


-
The community is a necessary environment with the help of which people with mental disorders can be rehabilitated and can return to society. The WHO (World Health Organization) advocates that mental health services should be available at the grassroots level and be integrated systematically into the primary healthcare (PHC) system[1]. The WHO’s Comprehensive Mental Health Action Plan 2013-2020 also sets one of the four objectives in community-based settings: the provision of comprehensive, integrated mental health and social care services[2]. According to the WHO’s Project Atlas, published in 2001, community care facilities for mental health exist in 63.4% of countries (n = 183), covering 79.9% of the world’s population[3]. Specialists and researchers in numerous countries have recognized and affirmed the effectiveness of community-based management for mental disorders[4, 5] associated with the reform[6, 7].
Since 2004, China’s community-based management system (CBMS) for individuals with severe mental disorder (SMD) has been piloted among two districts in each of the 30 provinces in the mainland and formally scaled up to the whole nation in 2009[8] as a new medical reform task and a component in the National Basic Public Health Services. The SMD cares for patients with the following six diagnoses: schizophrenia, schizoaffective disorder, paranoid psychosis, bipolar affective disorder, mental disorders due to epilepsy, and mental retardation by the Chinese Classification of Mental Diseases, 3rd edition (CCMD-3)[9]. In order to deliver a series of services such as screening, diagnosis, treatment, and management of patients with SMD in communities, the CBMS in China has formalized a general mechanism of coordination of health departments of five levels: state, province, prefecture city, county, and community. In parallel with the CBMS, an information management system (IMS) for managing SMD has also been developed since 2006. This study intends to present the urban-rural disparity utilization in CBMS in Sichuan Province, using the IMS database with 155,842 SMD patients (up to February 2014), in order to alert health policy decision-makers and researchers who study severe mental disorders.
When the '686' program was being conducted in China, the IMS database of Sichuan Province for the CBMS started the running tests in 2006. During the first four years until 2009, less than 400 SMD patients were registered in the system (Table 1). Following the 1st Specification policy issued in 2009, there was an observation of rapid increase of registered SMD patients. Due to the further improvements for registered patients, the 2nd Specification was issued in 2012 and the IMS was launched to be implemented throughout China. By the end of 2013, 131-327 patients with SMD were recorded in the IMS, of which 77.3% of them came from rural areas. Based on the population census data in 2013, the detection rate (DR) of patients with SMD was 1.68% for urban, 1.60% for rural, and 1.62% for the overall population. Further, the DR increased considerably to 3.58% and 4.31% in 2014 and in 2015, respectively. Overall, a large number of SMD patients were identified and managed in the CBMS during the last 10 years (linear trend χ2 = 1221014.587, P < 0.001).
Year Urban residents Rural residents All residents Population (10,000)a SMD patients Detectionrate (%) Population (10,000)b SMD patients Detectionrate (%) Population (10,000)a SMD patients Detectionrate (%) 2006 1,663 0 0.00000 6,506 6 0.00009 8,169 6 0.00007 2007 1,600 3 0.00019 6,527 40 0.00061 8,127 43 0.00053 2008 1,586 11 0.00069 6,552 75 0.00114 8,138 86 0.00106 2009 1,642 59 0.00359 6,543 320 0.00489 8,185 379 0.00460 2010 1,558 1,039 0.06669 6,487 6,046 0.09320 8,045 7,085 0.08807 2011 1,617 15,575 0.96320 6,433 66,549 1.03449 8,050 82,124 1.02017 2012 1,655 25,220 1.52387 6,421 97,668 1.52107 8,076 122,888 1.52164 2013 1,772 29,746 1.67867 6,335 101,581 1.60349 8,107 131,327 1.61992 2014 1,675 73,887c 4.41116 6,465 217,418c 3.36300 8,140 291,305c 3.57869 2015 1,887 116,141c 6.15480 6,317 237,523c 3.76006 8,204 353,664c 4.31087 Note. aStatistical Yearbook of the National Health and Family Planning Commission (2007-2016). bSichuan Statistical Yearbook. cUnpublished conference presentations by Sichuan Mental Health Center in 2016. SMD, severe mental disorder. Table 1. Detection rate of SMD in Sichuan province by year
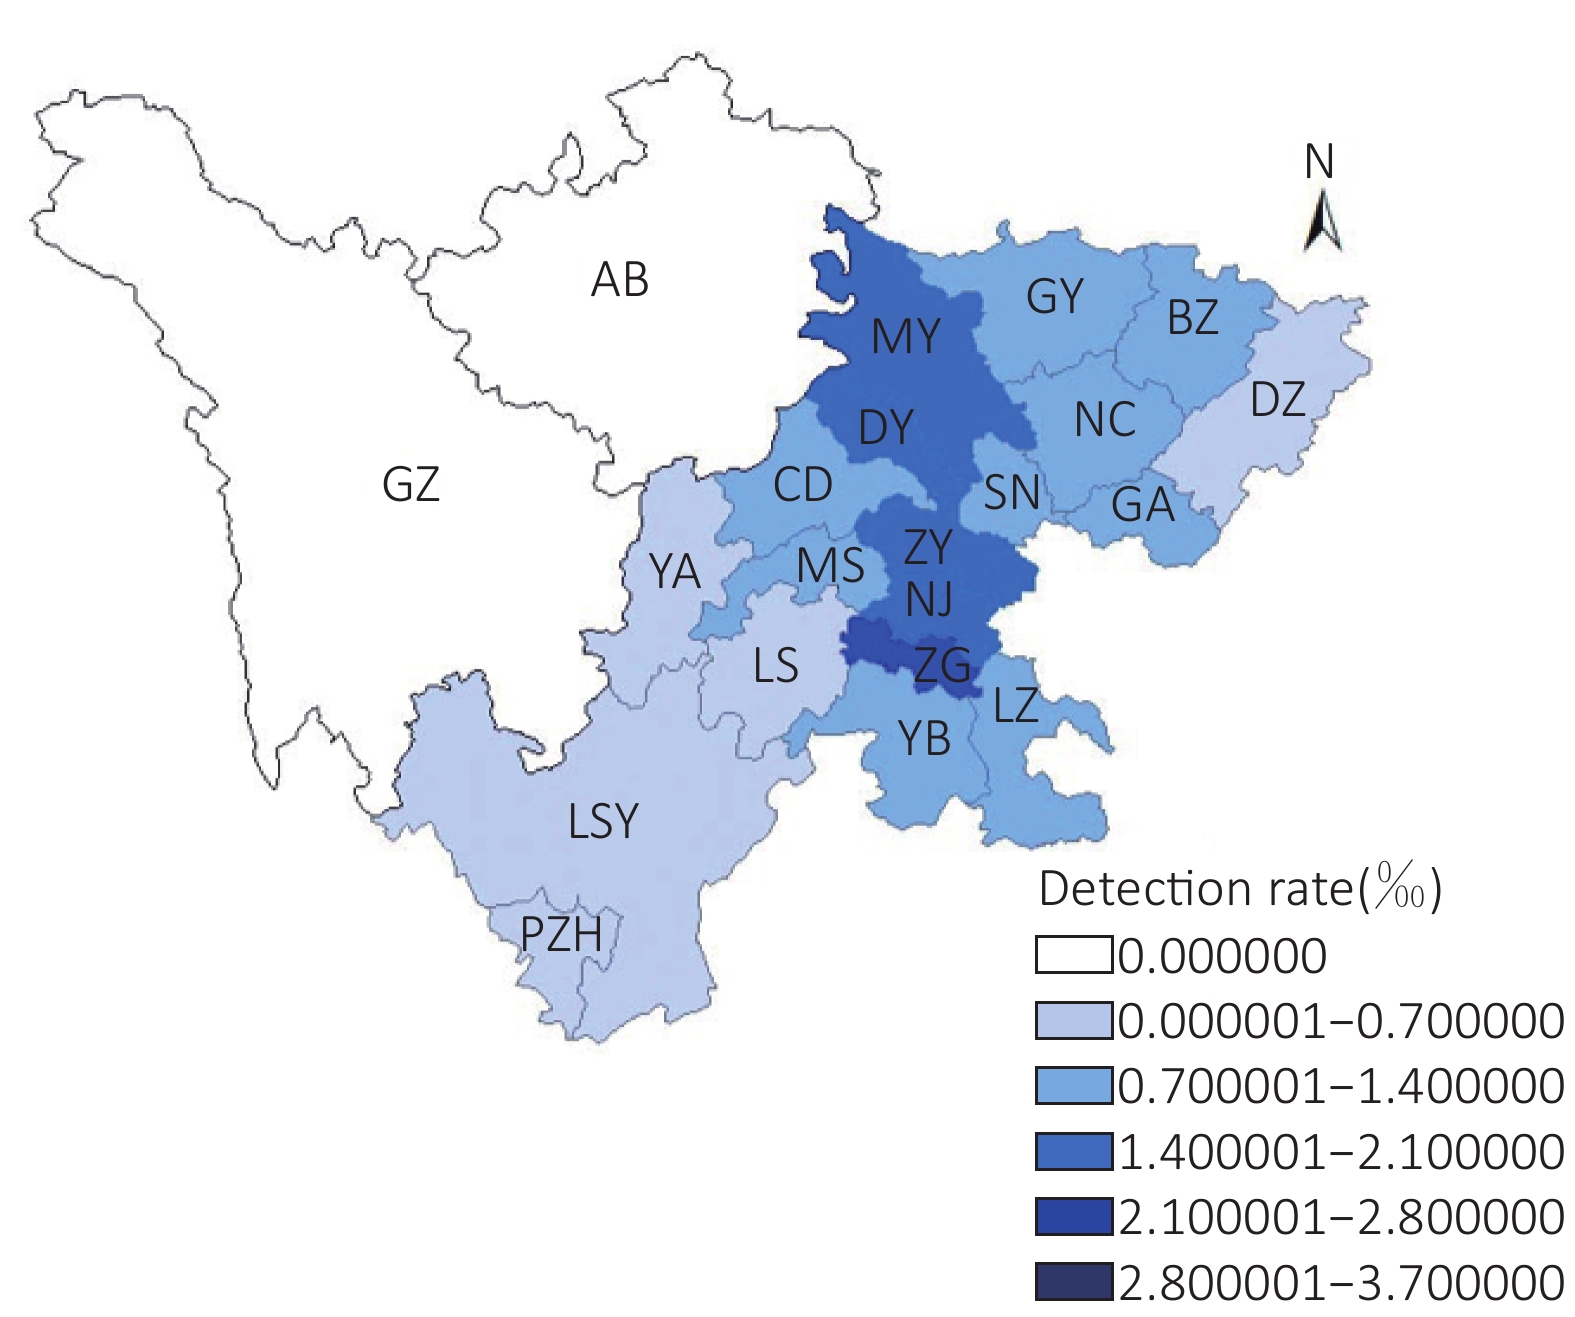
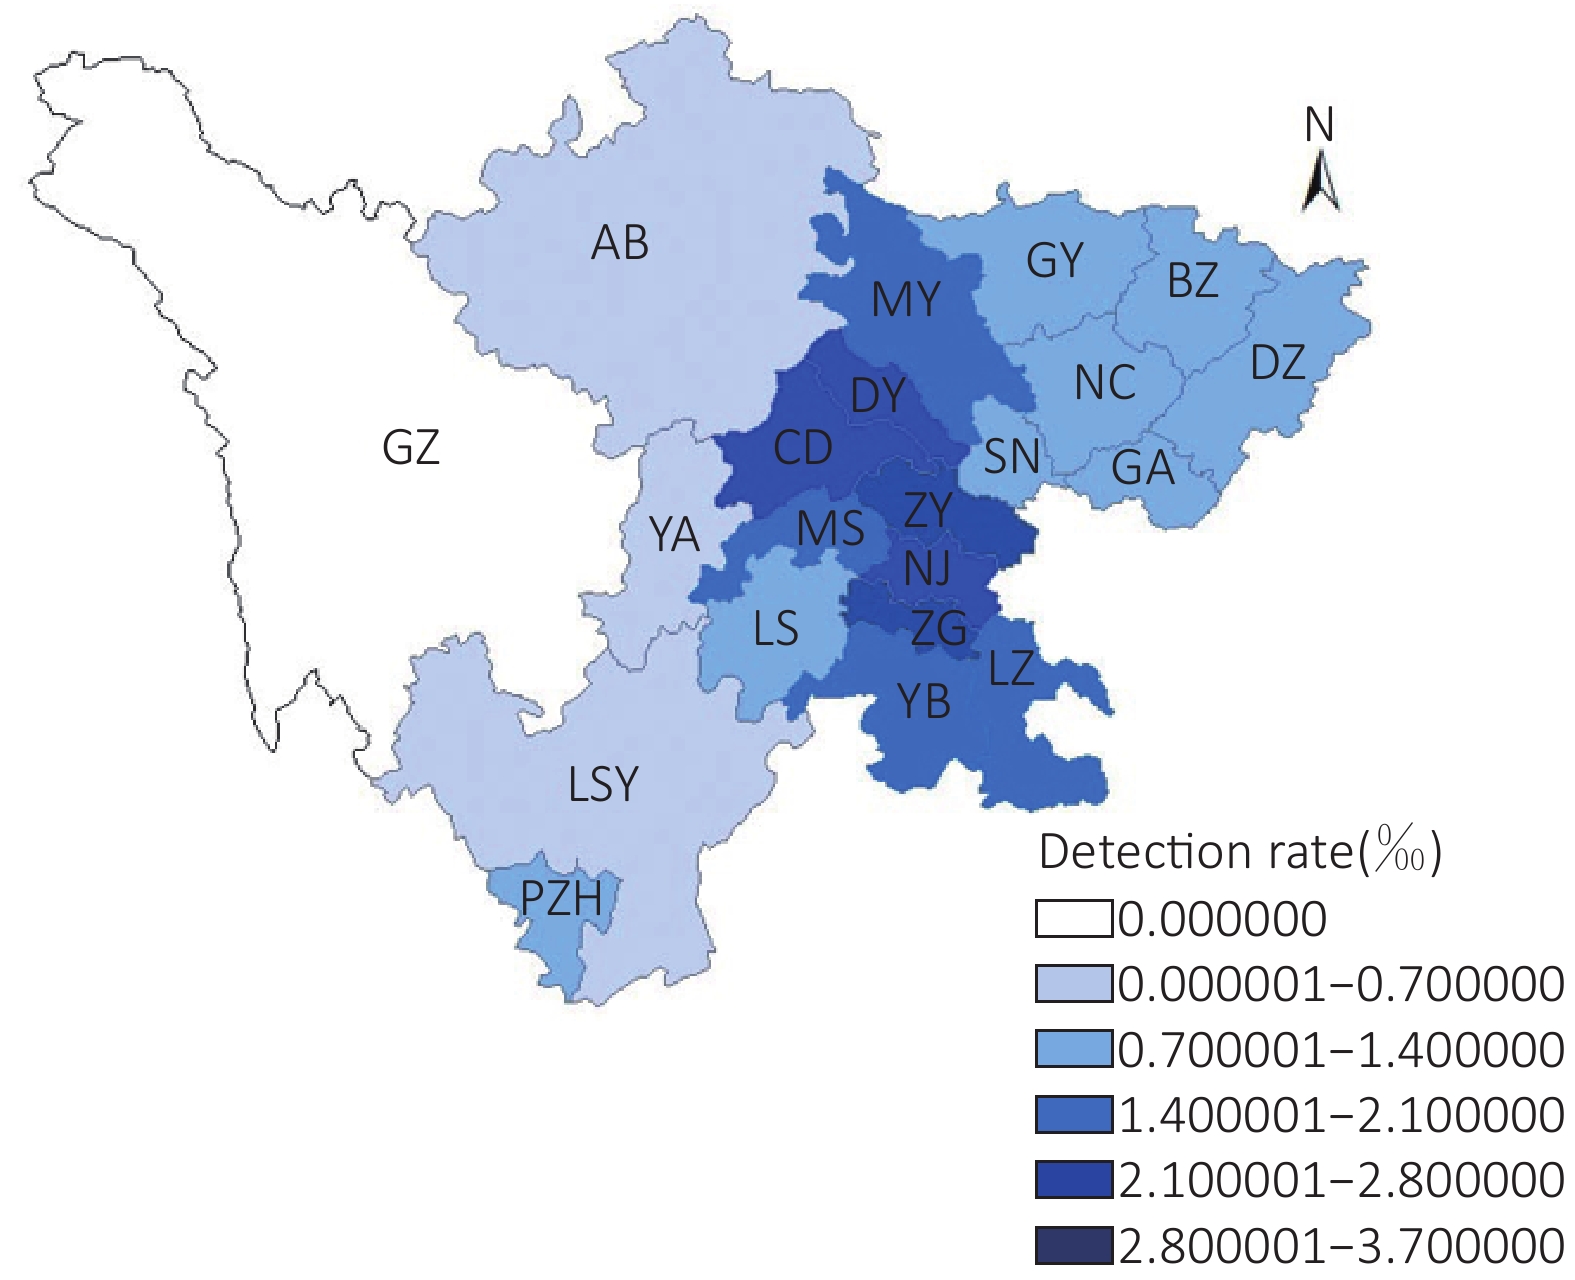
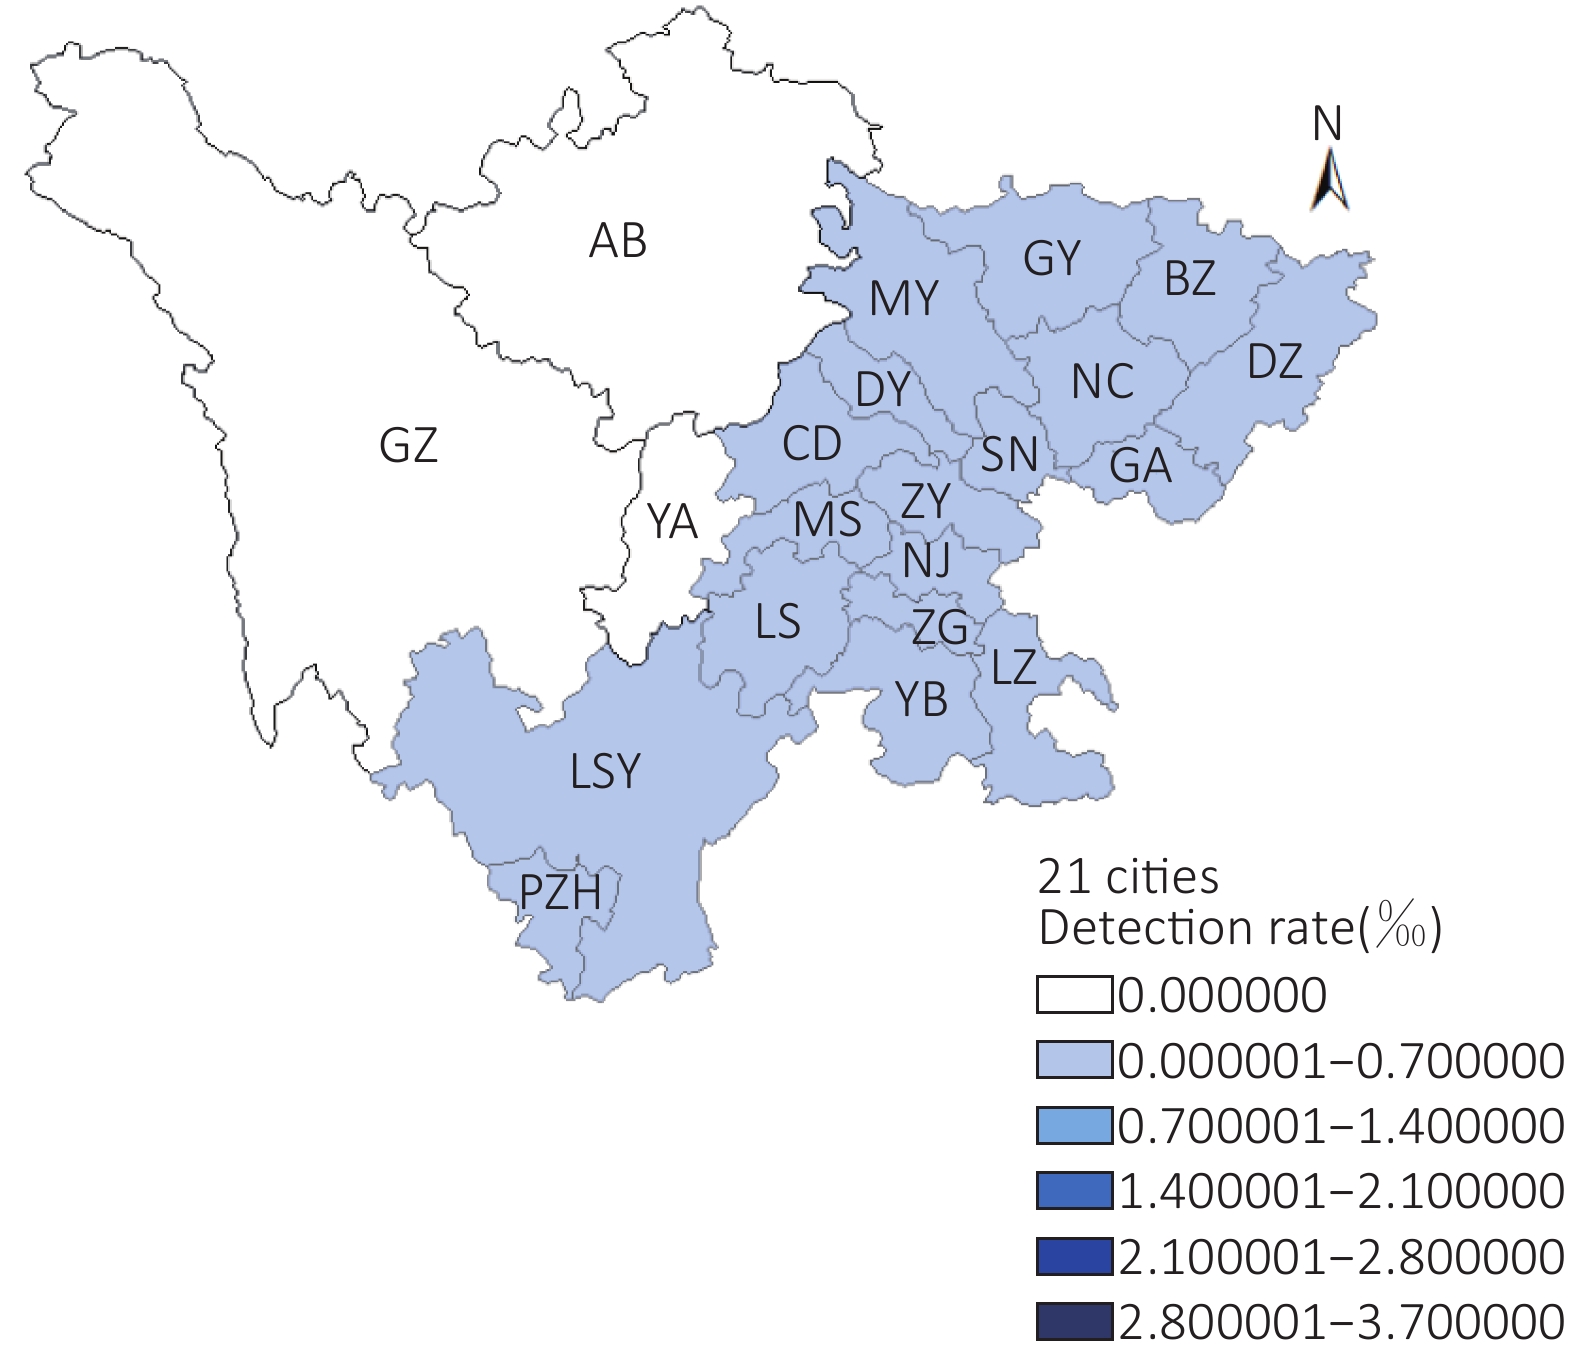
The GIS maps noticeably showed the improvement of DRs from 2010 to 2013 in prefecture cities in Sichuan Province (Supplementary Figures S1-S4 available in www.besjournal.com). However, as the IMS officially implemented from 2012, the DR in rural residents was consistently lower than that in urban residents, either than that in the overall population.
Because the data from 2014 and 2015 were not openly accessible, we only used data up to 2013 for follow-up analysis. Among 154,725 patients (up to the end of 2013), 83.9% were diagnosed with schizophrenia, 7.8% with mental retardation, 4.0% with mental disorders due to epilepsy, 2.5% with bipolar affective disorder, 1.5% with schizoaffective disorder, and 0.3% with paranoid psychosis. The categories of SMD from the Sichuan IMS were consistent with those of the national epidemiological survey[10]. Accordingly, by the end of 2013, the overall DR of 1.62% in our calculation (2.41% in IMS) was also lower in comparison with the national standard (2.62%)[11] and Jiangsu Province (2.86%)[11] in the east of China.
One of the main goals of management in the CBMS was to reduce dangerous behavior in psychiatric patients by increasing medication compliance to improve treatment effects. In Table 2, the three most important patient outcomes during 2009-2013 indicated a considerable difference between urban and rural patients. Consistently, patients in rural areas had higher dangerous behavior (DB) except for the year 2009. More patients not on medication compliance (MC), those in less stable conditions (SC), having fewer treatment effects (TE) than those in urban areas were found. Correspondingly, the outcomes demonstrated that over time, DB of patients both in rural and urban areas substantially declined in conjunction with an improved stabilization of conditions during the same period. However, the trends from 2010 to 2013 in proportions of patients without medication in rural areas had noticeably increased over time, as compared to a slight increase among urban patients over time. The impacts of treatment, for example, recuperation and changes in patient’s condition, evaluated by the clinical diagnosis, indicated minimal improvement among rural patients and declined effects among urban patients over time.
Year DBb P* SCb P* MC P* TE P* Urban Rural Urban Rural Urban Rural Urban Rural 2009 1
(2.13)15
(4.82)0.225 21
(44.68)74
(23.79)0.001 4
(8.51)93
(29.90)< 0.001 33
(70.21)148
(47.58)0.028 2010 22
(2.30)365
(3.37)0.075 305
(31.90)2,994
(27.63)< 0.001 176
(18.41)3,625
(33.45)< 0.001 607
(63.49)5,710
(52.69)< 0.001 2011 766
(2.45)6,031
(3.98)< 0.001 16,114
(51.49)61,688
(40.70)< 0.001 6,401
(20.45)54,948
(36.25)< 0.001 19,433
(62.09)84,344
(55.64)< 0.001 2012 659
(0.83)6,123
(1.69)< 0.001 49,421
(62.44)178,321
(49.22)< 0.001 17,476
(22.08)156,656
(43.24)< 0.001 47,667
(60.23)188,271
(51.97)< 0.001 2013 528
(0.55)4,629
(1.18)< 0.001 68,208
(70.50)241,419
(61.72)< 0.001 22,555
(23.31)182,173
(46.58)< 0.001 55,298
(57.15)200,681
(51.31)< 0.001 P** < 0.001 < 0.001 < 0.001 < 0.001 < 0.001 < 0.001 < 0.001 < 0.001 Note. aOne patient can have a number of observations under each outcome reported each year. bDefinition in Appendix. *P value of chi-square test for area difference, α = 0.05. **P value of chi-square test for linear trend text, α = 0.05. DB, dangerous behavior; MC, medication compliance; SC, stable conditions; TE, treatment effects. Table 2. Incidence numbera and percentage (%) of patients’ outcome over time by urban and rural areas
In view of the fact that controlling and decreasing of DB was one of the main goals for management of patients with SMD in the CBMS, the paper calculated the incidence of DB of SMD patients, from the perspective of epidemiology, using the IMS database of Sichuan Province from 2006 to 2013 to further detect the disparity utilization in management services as shown in Table 3. In total, the incidence of DB of SMD patients in urban areas was lower than that in rural areas in 70% of cities. In other words, management in the CBMS of patients with SMD in rural areas generally has a lower effectiveness compared with urban citizens.
Cities Urban areas Rural areas Total Patients Number of dangerous behaviorsa Person-years of follow-upb Incidencec
(%)Patients Number of dangerous behaviorsa Person-years of follow-upb Incidencec
(%)Patients Number of dangerous behaviorsa Person-years of follow-upb Incidencec
(%)Chengdu 186 643 12,691.84 5.07 752 3,593 30,991.62 11.59 1,019 4,533 49,507.46 9.16 Zigong 126 190 4,104.01 4.63 271 504 12,887.23 3.91 409 713 17,617.66 4.05 Panzhihua 8 20 252.39 7.92 83 138 641.32 21.52 94 164 1,043.76 15.71 Deyang 33 81 1,068.80 7.58 616 1,224 13,001.24 9.41 701 1,425 15,032.72 9.48 Mianyang 38 93 2,307.03 4.03 428 893 15,175.07 5.88 482 1,043 17,969.90 5.80 Guangyuan 33 96 609.14 15.76 449 1,307 5,056.00 25.85 492 1,430 6,025.88 23.73 Suining 18 35 630.86 5.55 159 279 6,756.65 4.13 188 362 7,739.69 4.68 Neijiang 60 82 2,030.25 4.04 303 652 13,041.09 5.00 394 787 16,164.13 4.87 Leshan 36 60 823.73 7.28 385 994 4,250.62 23.38 437 1,092 5,368.51 20.34 Nanchong 50 82 869.99 9.43 536 1,362 7,420.13 18.36 614 1,524 8,826.10 17.27 Meishan 12 16 675.79 2.37 119 257 7,602.75 3.38 133 275 8,564.64 3.21 Yibin 63 114 1,236.24 9.22 630 1,237 9,650.42 12.82 743 1,447 11,857.10 12.20 Guang’an 34 39 608.27 6.41 292 424 5,403.86 7.85 332 471 6,131.43 7.68 Dazhou 44 143 664.18 21.53 221 667 7,125.45 9.36 270 821 8,058.22 10.19 Ya’an 14 56 208.52 26.86 63 85 1,414.45 6.01 79 145 1,747.38 8.30 Bazhong 42 108 295.79 36.51 716 2,151 6,370.63 33.76 778 2,314 6,859.60 33.73 Ziyang 13 27 839.12 3.22 287 482 15,868.65 3.04 305 516 17,172.61 3.00 Luzhou 42 68 1,773.06 3.84 354 704 10,132.04 6.95 455 864 12,702.58 6.80 Aba 0 0 0.79 0.00 1 1 10.30 9.71 1 1 11.09 9.02 Liangshan 23 24 271.67 8.83 133 225 1,415.28 15.90 164 260 1,541.66 16.86 Total 875 1,977 31,700.10 6.24 6,798 17,179 174,214.80 9.86 8,090 20,187 219,942.12 9.18 Note. aNumber of dangerous behaviors: records of risk assessment as level 3–5 (means dangerous behaviors) from 2,006 to 2,013. bPerson-years of follow-up: total tal follow-up time for each patient from 2,006 to 2,013. cIncidence = number of dangerous behavior/person-years of follow-up × 100%. Table 3. Incidence of dangerous behavior of SMD patients in Sichuan from 2006 to 2013 (%)
The Chinese government attaches importance to SMD, with a series of policies issued to protect the rights of patients with SMD and integrated and systematic management and plans conducted to guarantee management effectiveness. Further, the CBMS for SMD patients in China, especially after the 686 program and the Specifications were launched, has formed an active structure and made certain advancements[12]. Furthermore, this study confirmed some positive implementations of the system along with the current management structure and health system inputs. Additionally, we distinguished the urban–rural disparity management and utilization issue to ensure progress for decision-makers and researchers who are associated with this domain.
The DR is also known as the registration rate of patients with SMD and is much lower than the prevalence of SMD among the population. A previous large epidemiological survey conducted during 2001-2005 in the four provinces of China reported an adjusted 1-month prevalence of psychotic disorder at 1.0% (95% CI, 0.8−1.1)[10]. The reason for the low DR is that two-thirds of known patients with SMD were not managed in the CBMS: (1) about one-third of patients whose condition was stabilized or recovered after clinic treatment and (2) about one-third of patients who were long-term institution-bound and harmless to the society or others. Nevertheless, one could still use the information system to assess the relative quality and management effects of the SMD by comparing DR or outcome measures of patients between regions over time.
By using the Sichuan IMS database, we found similar DR between urban and rural areas, but the management outcomes of patients in rural areas were worse than those in urban areas. Over time, the increased DR analysis enabled us to identify the positive response of CBMS to the policies in promoting and supporting the implementation of the system in the year 2009 and 2011 in particular. Over the last five years, increased problems faced by patients, such as the lack of medicines in rural areas and the declined treatment effects faced particularly by patients in urban areas, have raised concerns about the management quality of CBMS. Subsequently, in this study, we demonstrated how indicators not assessed by the government did not show the expected change pattern as compared to indicators assessed by the government. So, methods to evaluate the actual management effect by deeply and systematically using the indicators in IMS is the next topic for research.
However, some limitations of the study should be noted. First, one case study from Sichuan Province on the current status and possible effects of the CBMS may not be generally acceptable to the developed provinces in China due to the vast diversity of sociocultural, economic, and care provision characteristics in different regions in China. Second, the empirical data on the management system was only up to the end of 2013 due to official restrictions to the access of the complete data. In addition, recent changes and improvements to the system are not reflected in this study. Third, the DR of SMD in the community could be underreported because of the inclusion and exclusion strategy that was much influenced by insufficient psychiatric working forces in the province.
In conclusion, since the central funding was presented for PHC service, positive evidence is needed to show whether the amount of funding for the CBMS was sufficient to improve the management effect. Although the tiered multidisciplinary administrative and service structure was established for SMD patients with a monitory system to assess registration rate and risk behavior of patients, the service quality and efficiency of the CBMS require positive evidence. Further research should also pay attention to the large rural-urban disparity and possible reasons in the CBMS management effects concerning patient outcomes such as high-risk behavior, stability of mental health condition, medication adherence, etc. The IMS is an important surveillance database that has yet to be used to effectively generate evidence to reflect problems in the operation of the CBMS and to assess the performance of the CBMS work group among prefectures.

Figure S1. Geographic spatial distribution of patient detection rate in Sichuan Province in 2010.

Figure S2. Geographic spatial distribution of patient detection rate in Sichuan Province in 2011.
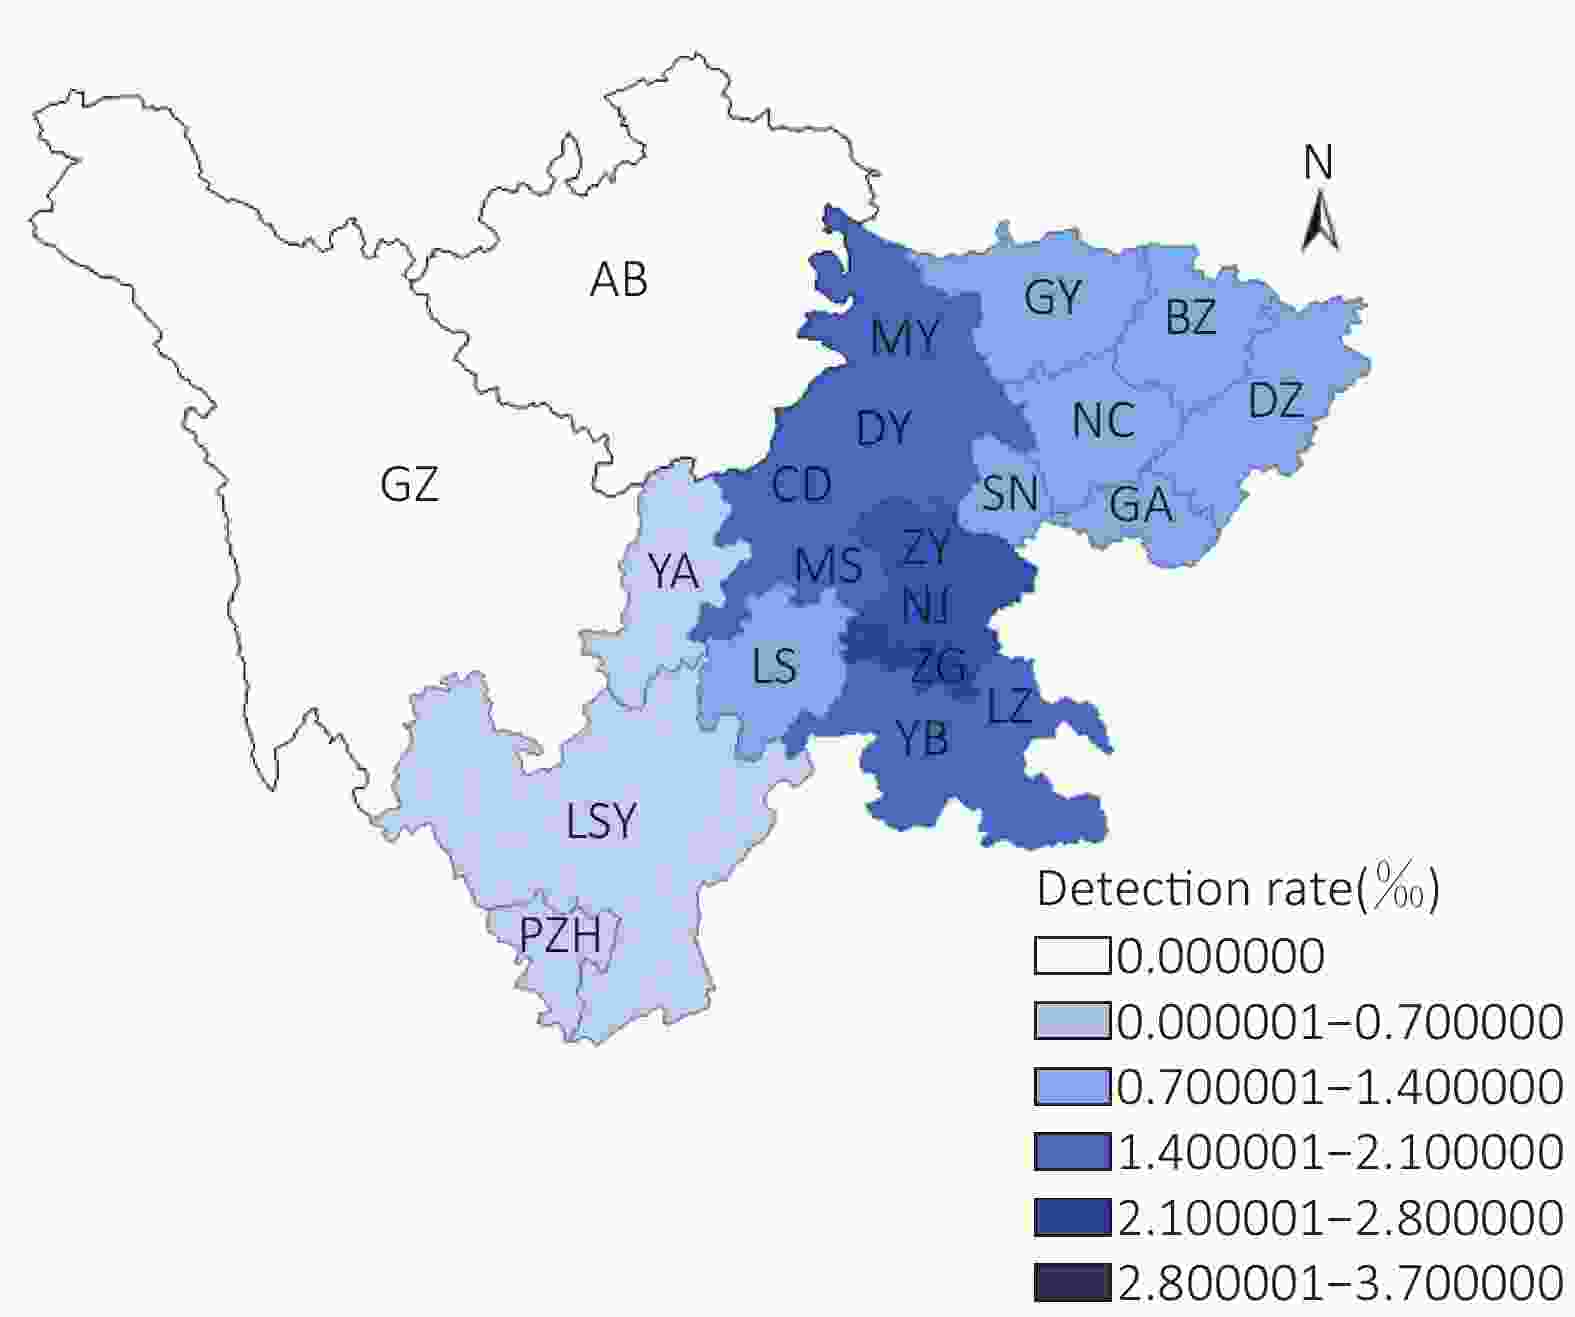
Figure S3. Geographic spatial distribution of patient detection rate in Sichuan Province in 2012.

Figure S4. Geographic spatial distribution of patient detection rate in Sichuan Province in 2013.
HTML
-
The authors thank the Center of Sichuan Mental Health for their collaboration and data supply and the China Medical Board (CMB12-106) for the support of funding.
-
TANG Wei Wei and LIU Yuan Yuan participated in the study design, literature search, data analysis and data interpretation, and drafting the manuscript; WANG Dan and WEN Hong provided access to the dataset and interpretation of data. YANG Min designed the study, supervised data analysis, and provided critical revisions for the concepts and contents of the manuscript. All authors read and approved the final version of the manuscript for submission.

 Quick Links
 DownLoad: