


-
It is estimated that only half of the 79 million adults with type 2 diabetes will have adequate access to insulin by 2,030 if the current levels of access is not improved[1]. Moreover, one of the significant causes of worldwide mortality and morbidity is diabetes[2], especially type 2 diabetes mellitus (T2DM), which is also the major cause of substantial global economic burden[3]. Therefore, there is an urgent need to identify the important risk factors for T2DM and develop effective strategies to address the problem of T2DM.
It is well accepted that genetic factor, environmental factors, and lifestyle contribute to the development of T2DM. Complex interactions between multiple genes and a range of environmental factors are involved in the onset and progression of type 2 diabetes[4]. A better understanding of the contribution of genetic factors in the etiology of T2DM will facilitate the development of effective preventive strategies to reduce the ever increasing incidence of T2DM[5], it will also improve the effectiveness and precision of treatment and prevention strategies[6].
It is reported that ApoE alleles are important genetic markers for dyslipidaemias[7], and previous studies indicate that ApoE is among the candidate genes which are most likely associated with CAD in T2DM patients[8]. ApoE draws much attention due to some reports supporting the association between ApoE polymorphism and T2DM[9-11]. In humans, ApoE gene is located on the chromosome at position 19q13.2 with 3 isoforms, ApoE2, ApoE3, and ApoE4; and 6 genotypes having 3 homozygous: ε2/ε2, ε3/ε3, and ε4/ε4, and 3 heterozygous: ε2/ε3, ε2/ε4, and ε3/ε4[12]. Besides T2DM, ApoE is also involved in many diseases, such as coronary heart disease (CHD)[13], ischemic cerebrovascular disease (ICD)[14], and Alzheimer’s disease[15].
Much of the recent research has studied the association between the ApoE gene polymorphism and the risk of T2DM, however, there are inconsistencies between the results of the different studies. The inconsistency may result from the difference of included population, sample size, and genotyping methods. Moreover, 18 new papers[9,16-32] have been published since the publication of latest meta-analysis of the association between ApoE gene polymorphism and T2DM in 2014[33]. Thus, we conducted a further meta-analysis to explore whether ApoE polymorphism is associated with the increased risk of T2DM by including these new published articles.
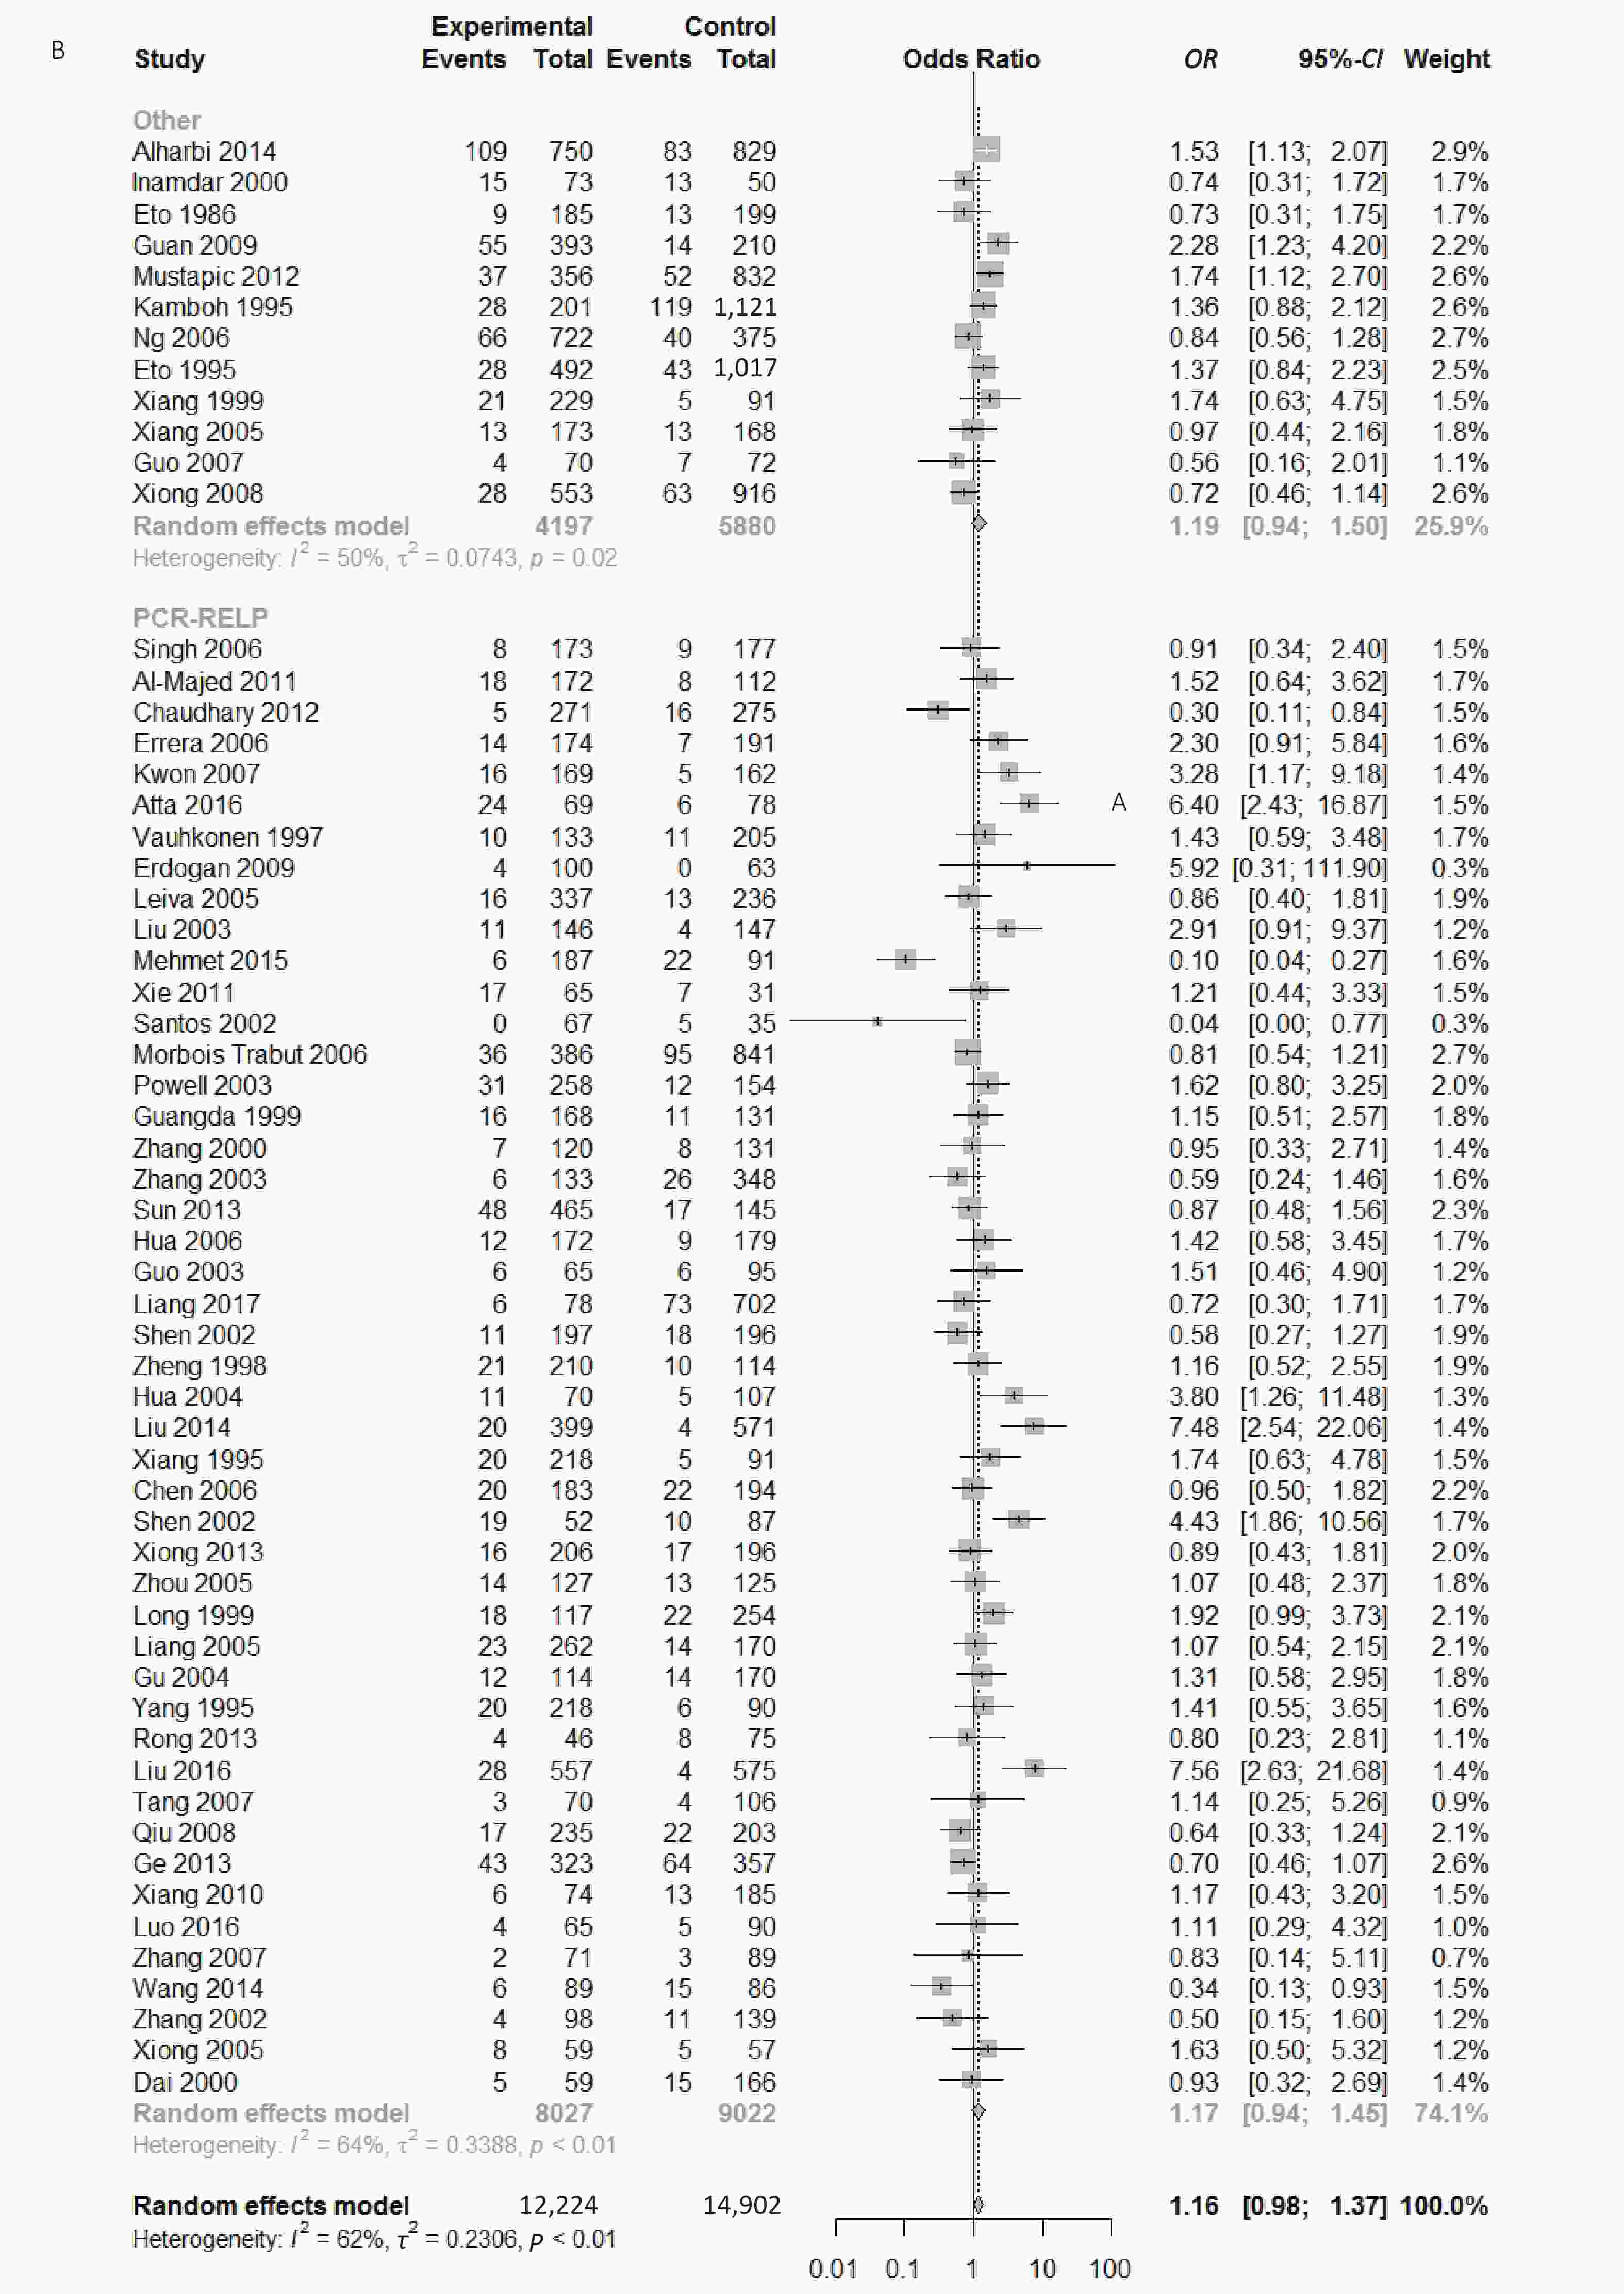
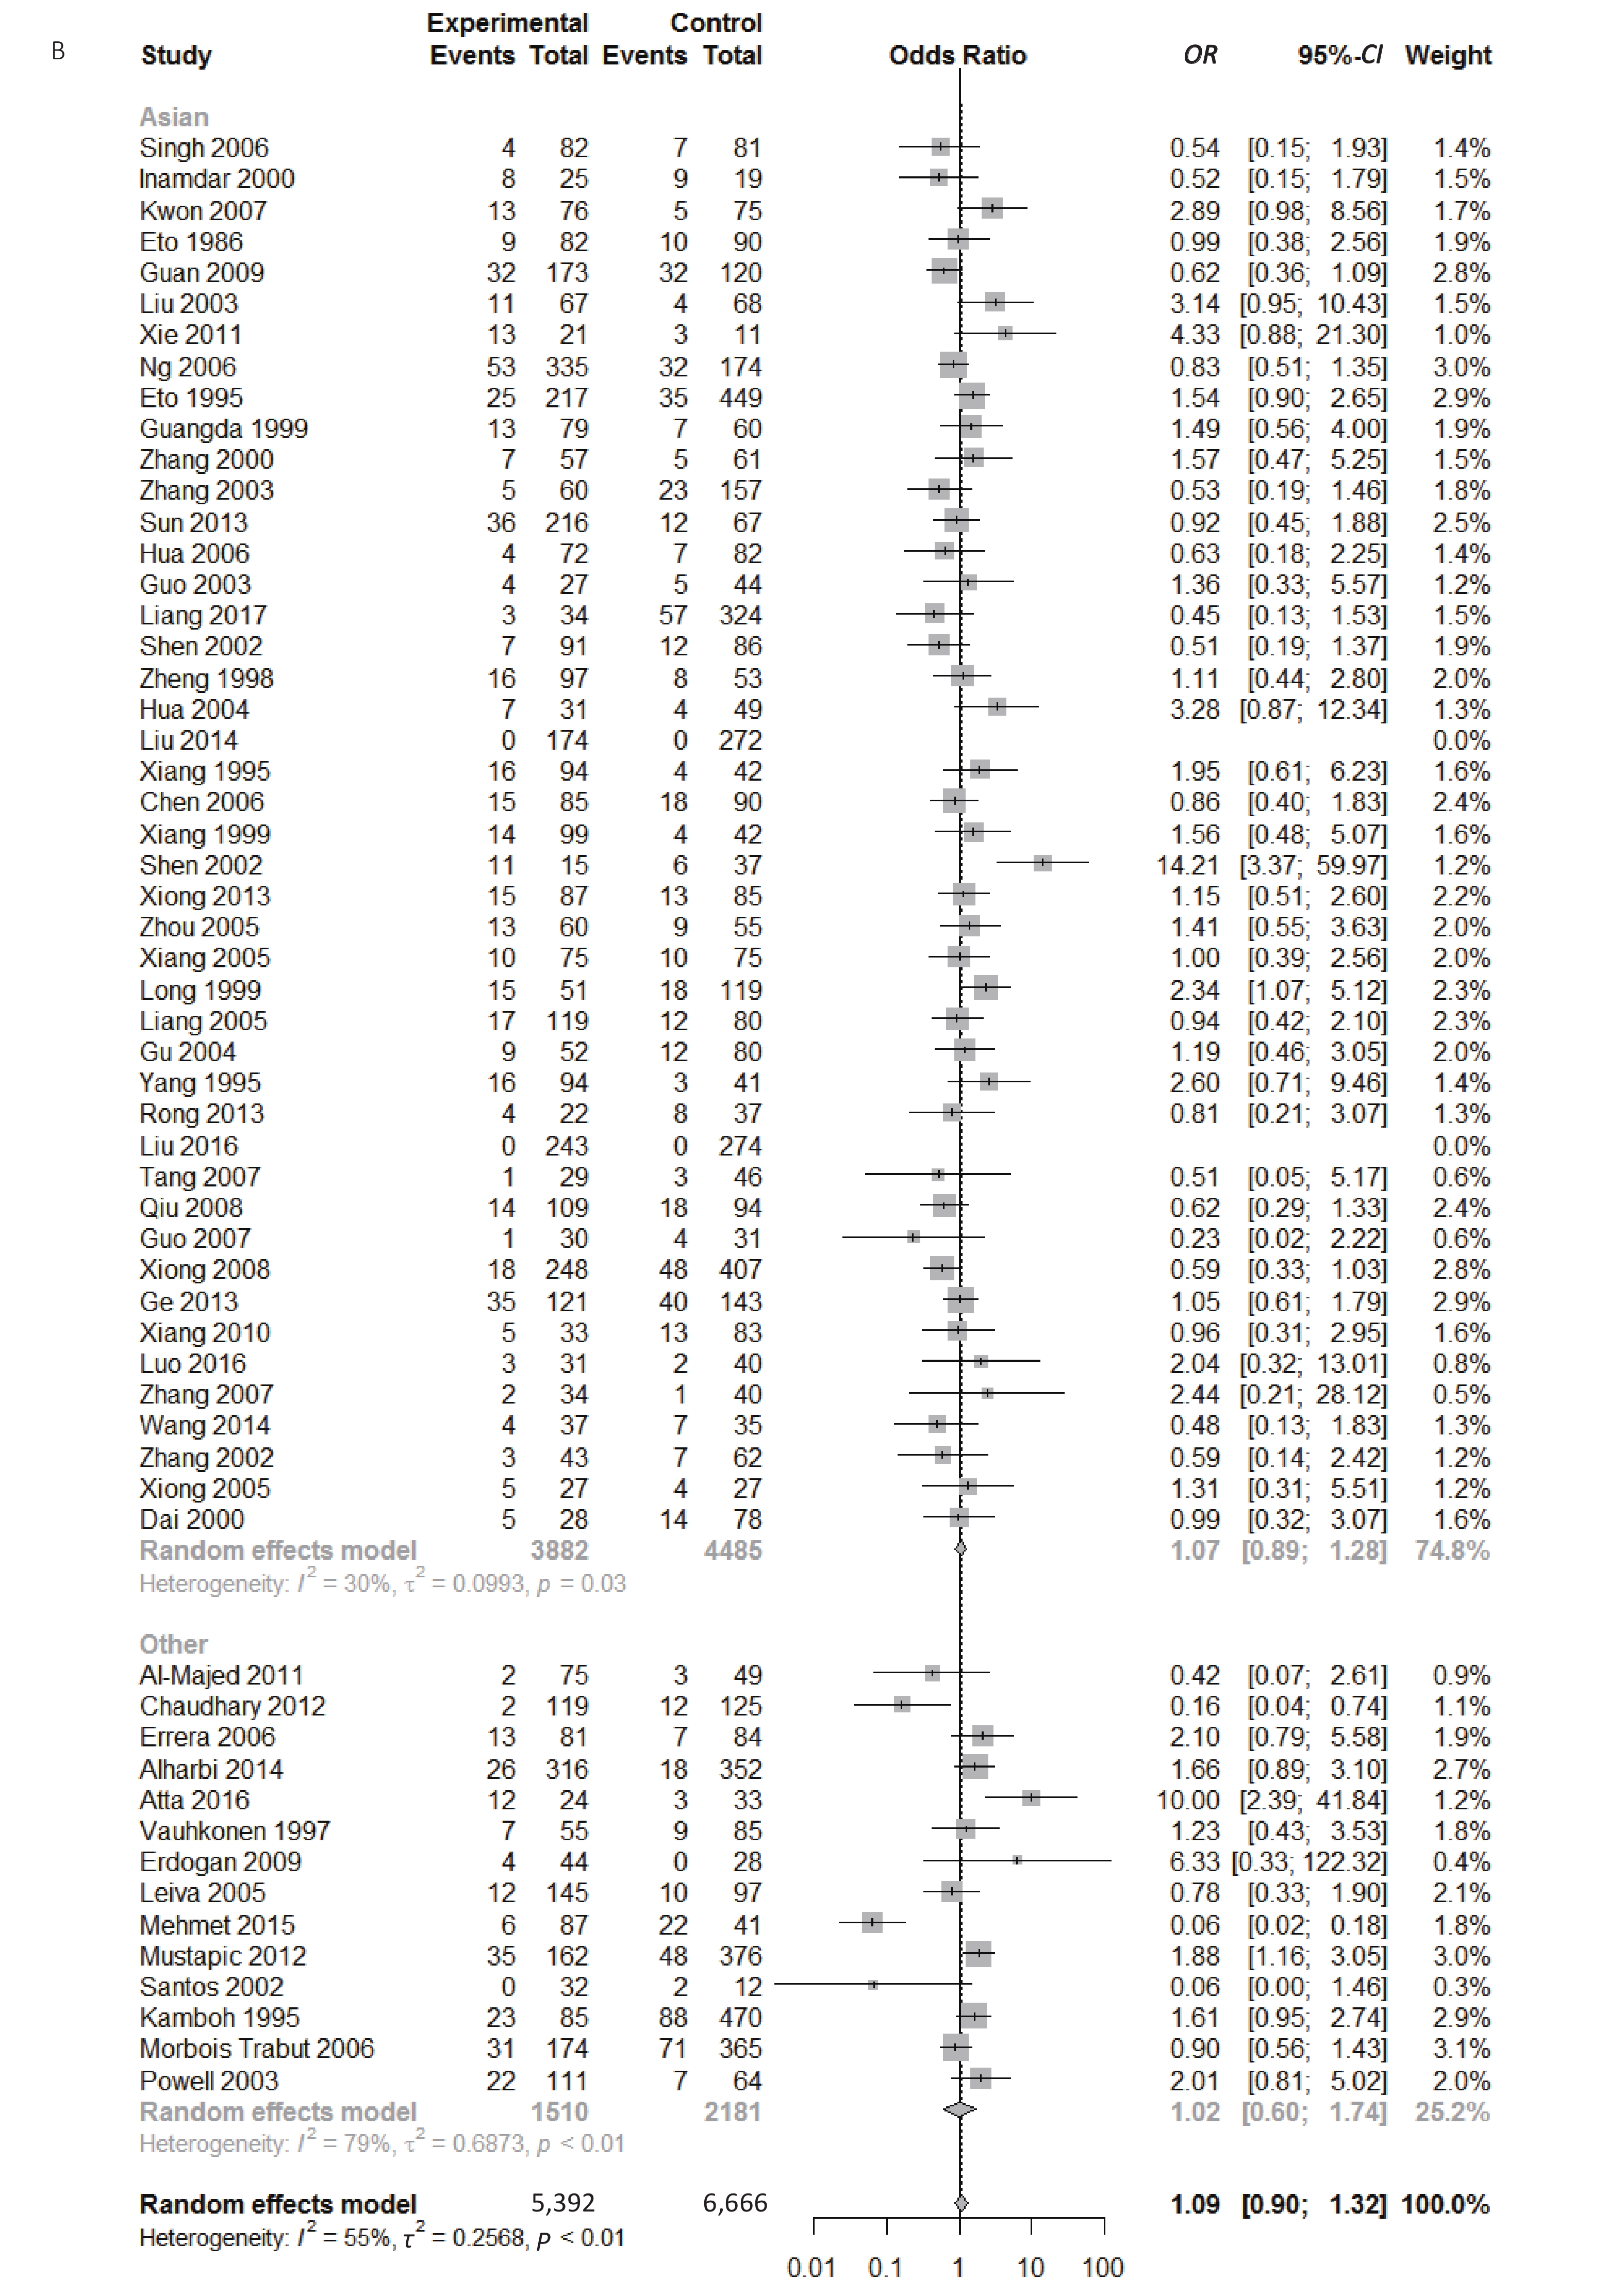
Figure S1. (A) Forest plot for associations between type 2 diabetes and ApoE ε2 allele vs. ε3 allele in the subgroup based on ethnicity. (B) Forest plot for associations between type 2 diabetes and ApoE ε2 allele vs. ε3 allele in the subgroup based on genotype
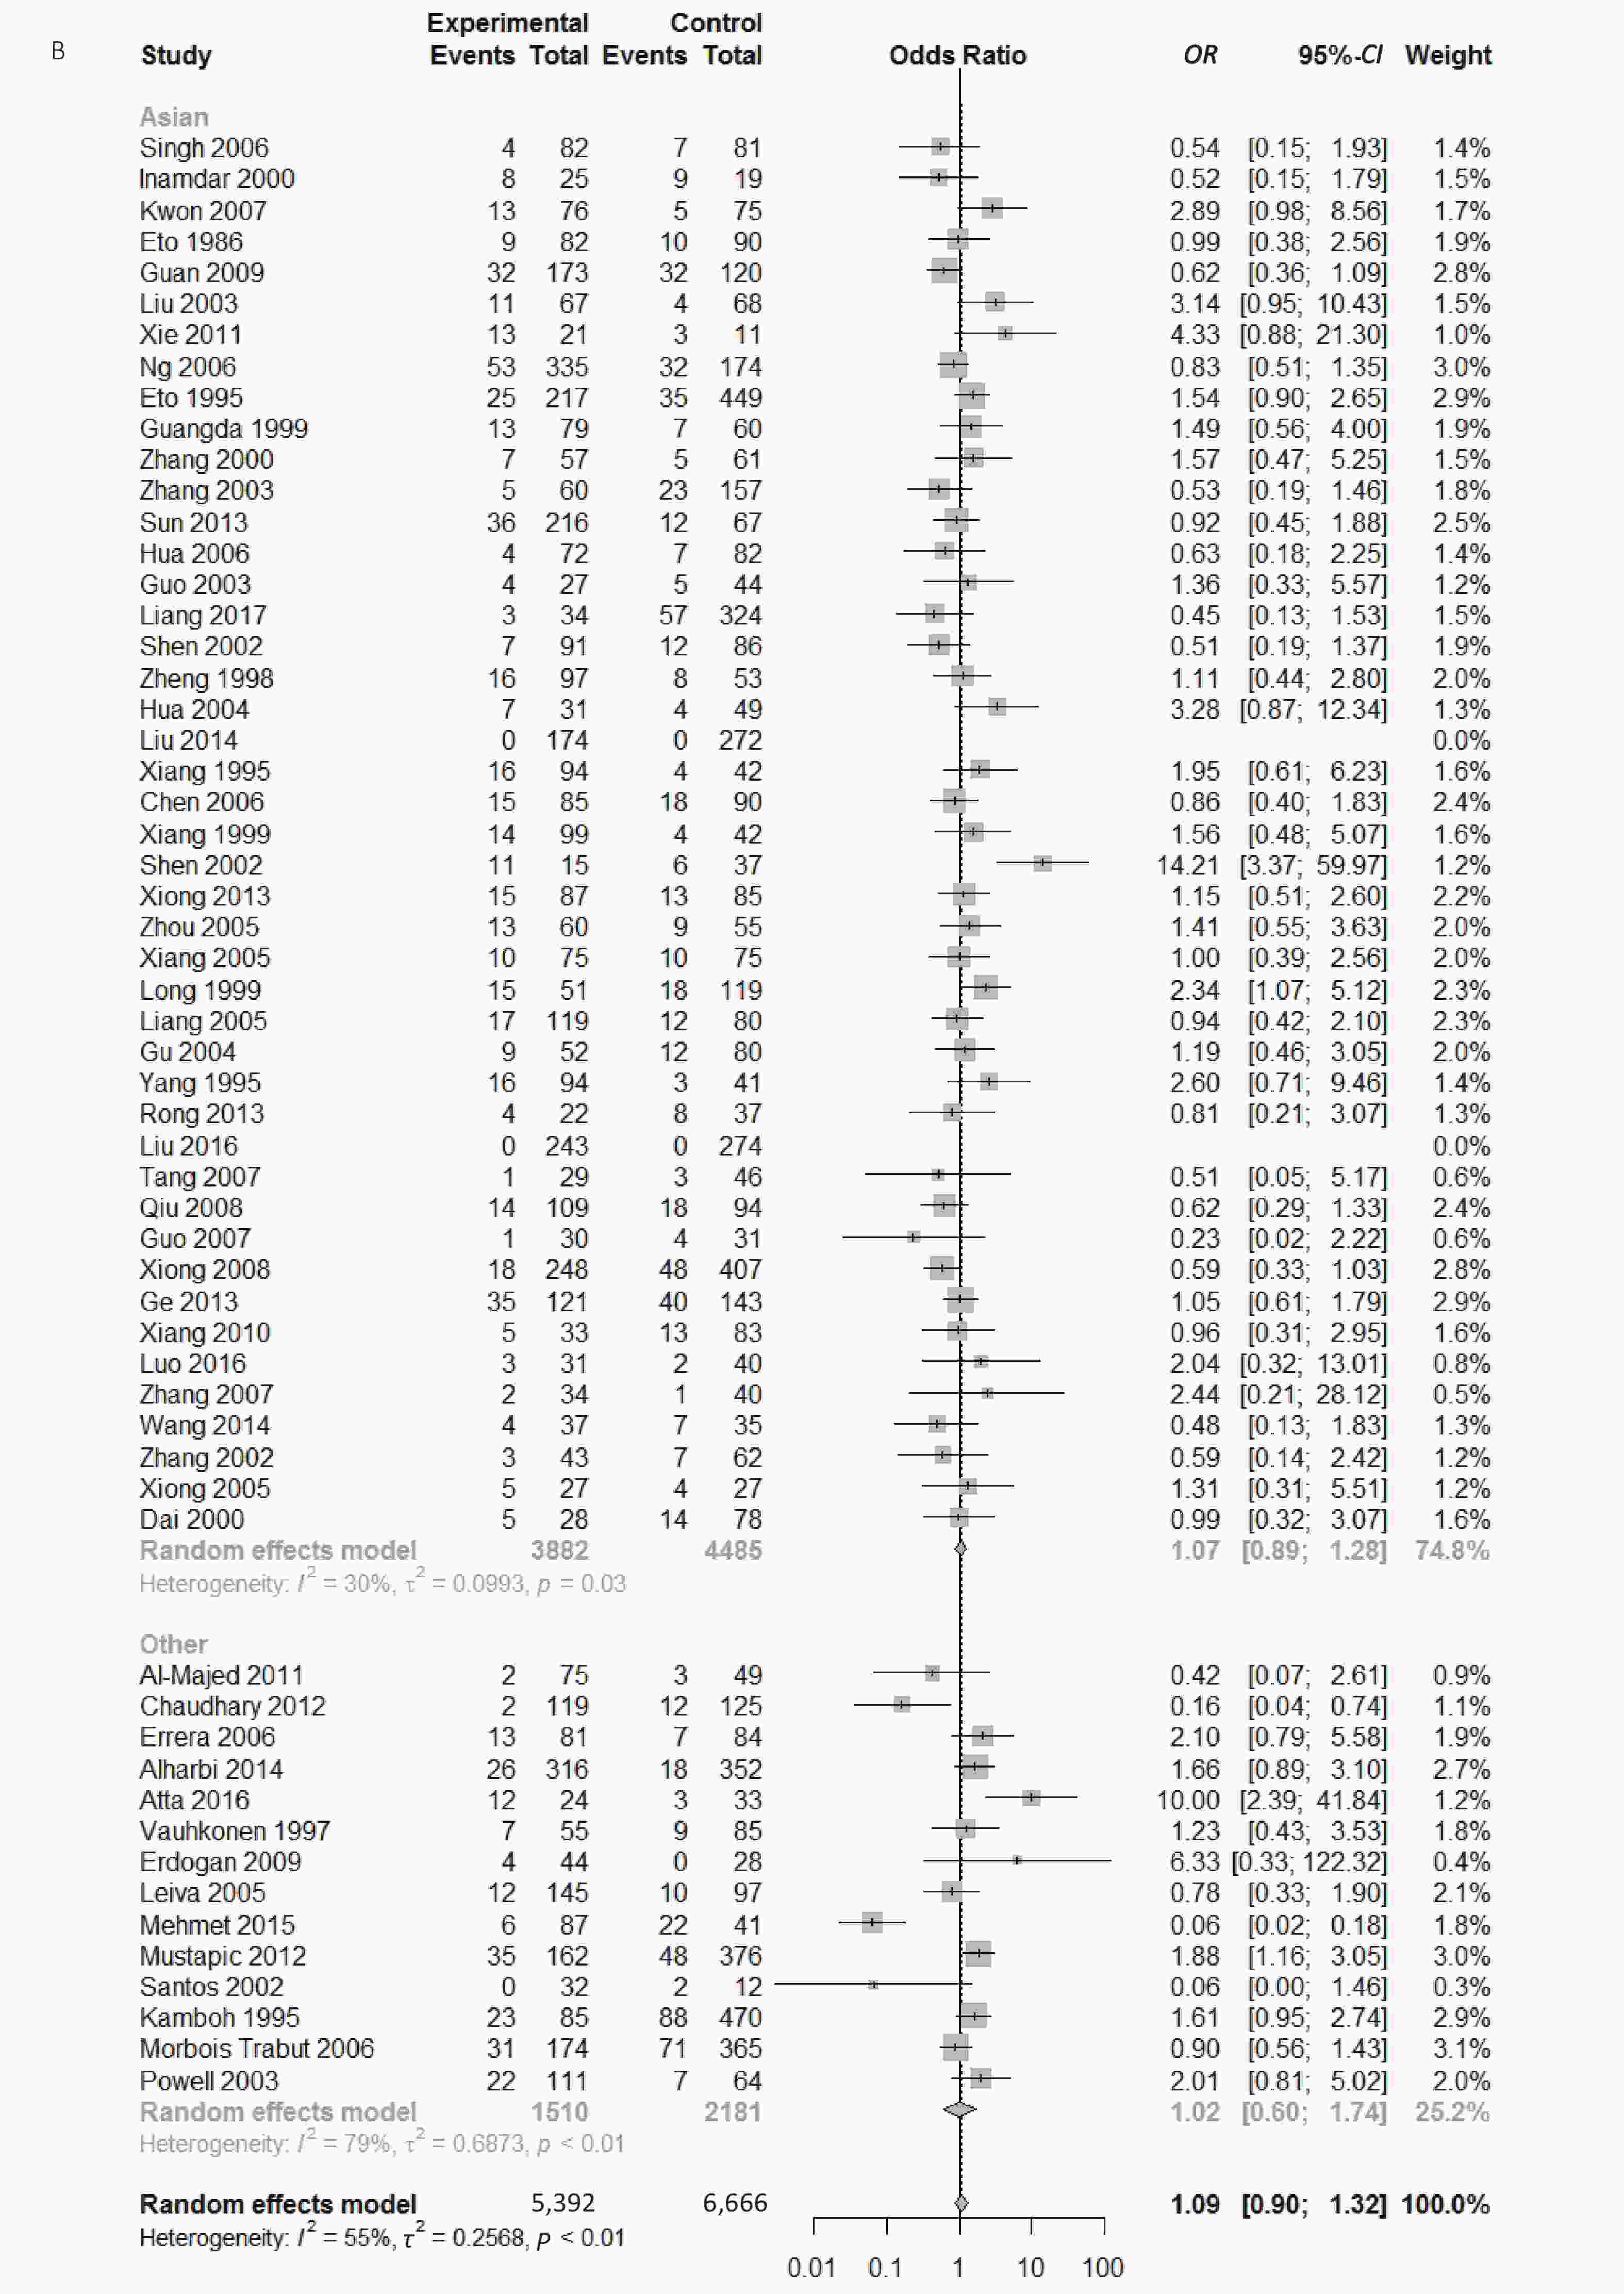
Figure S2. (A) Forest plot for associations between type 2 diabetes and ApoE ε2 allele vs. ε3 allele in the subgroup based on HWE. (B) Forest plot for associations between type 2 diabetes and ApoE ε2/ε3 genotype vs. ε3/ε3 genotype in the subgroup based on ethnicity
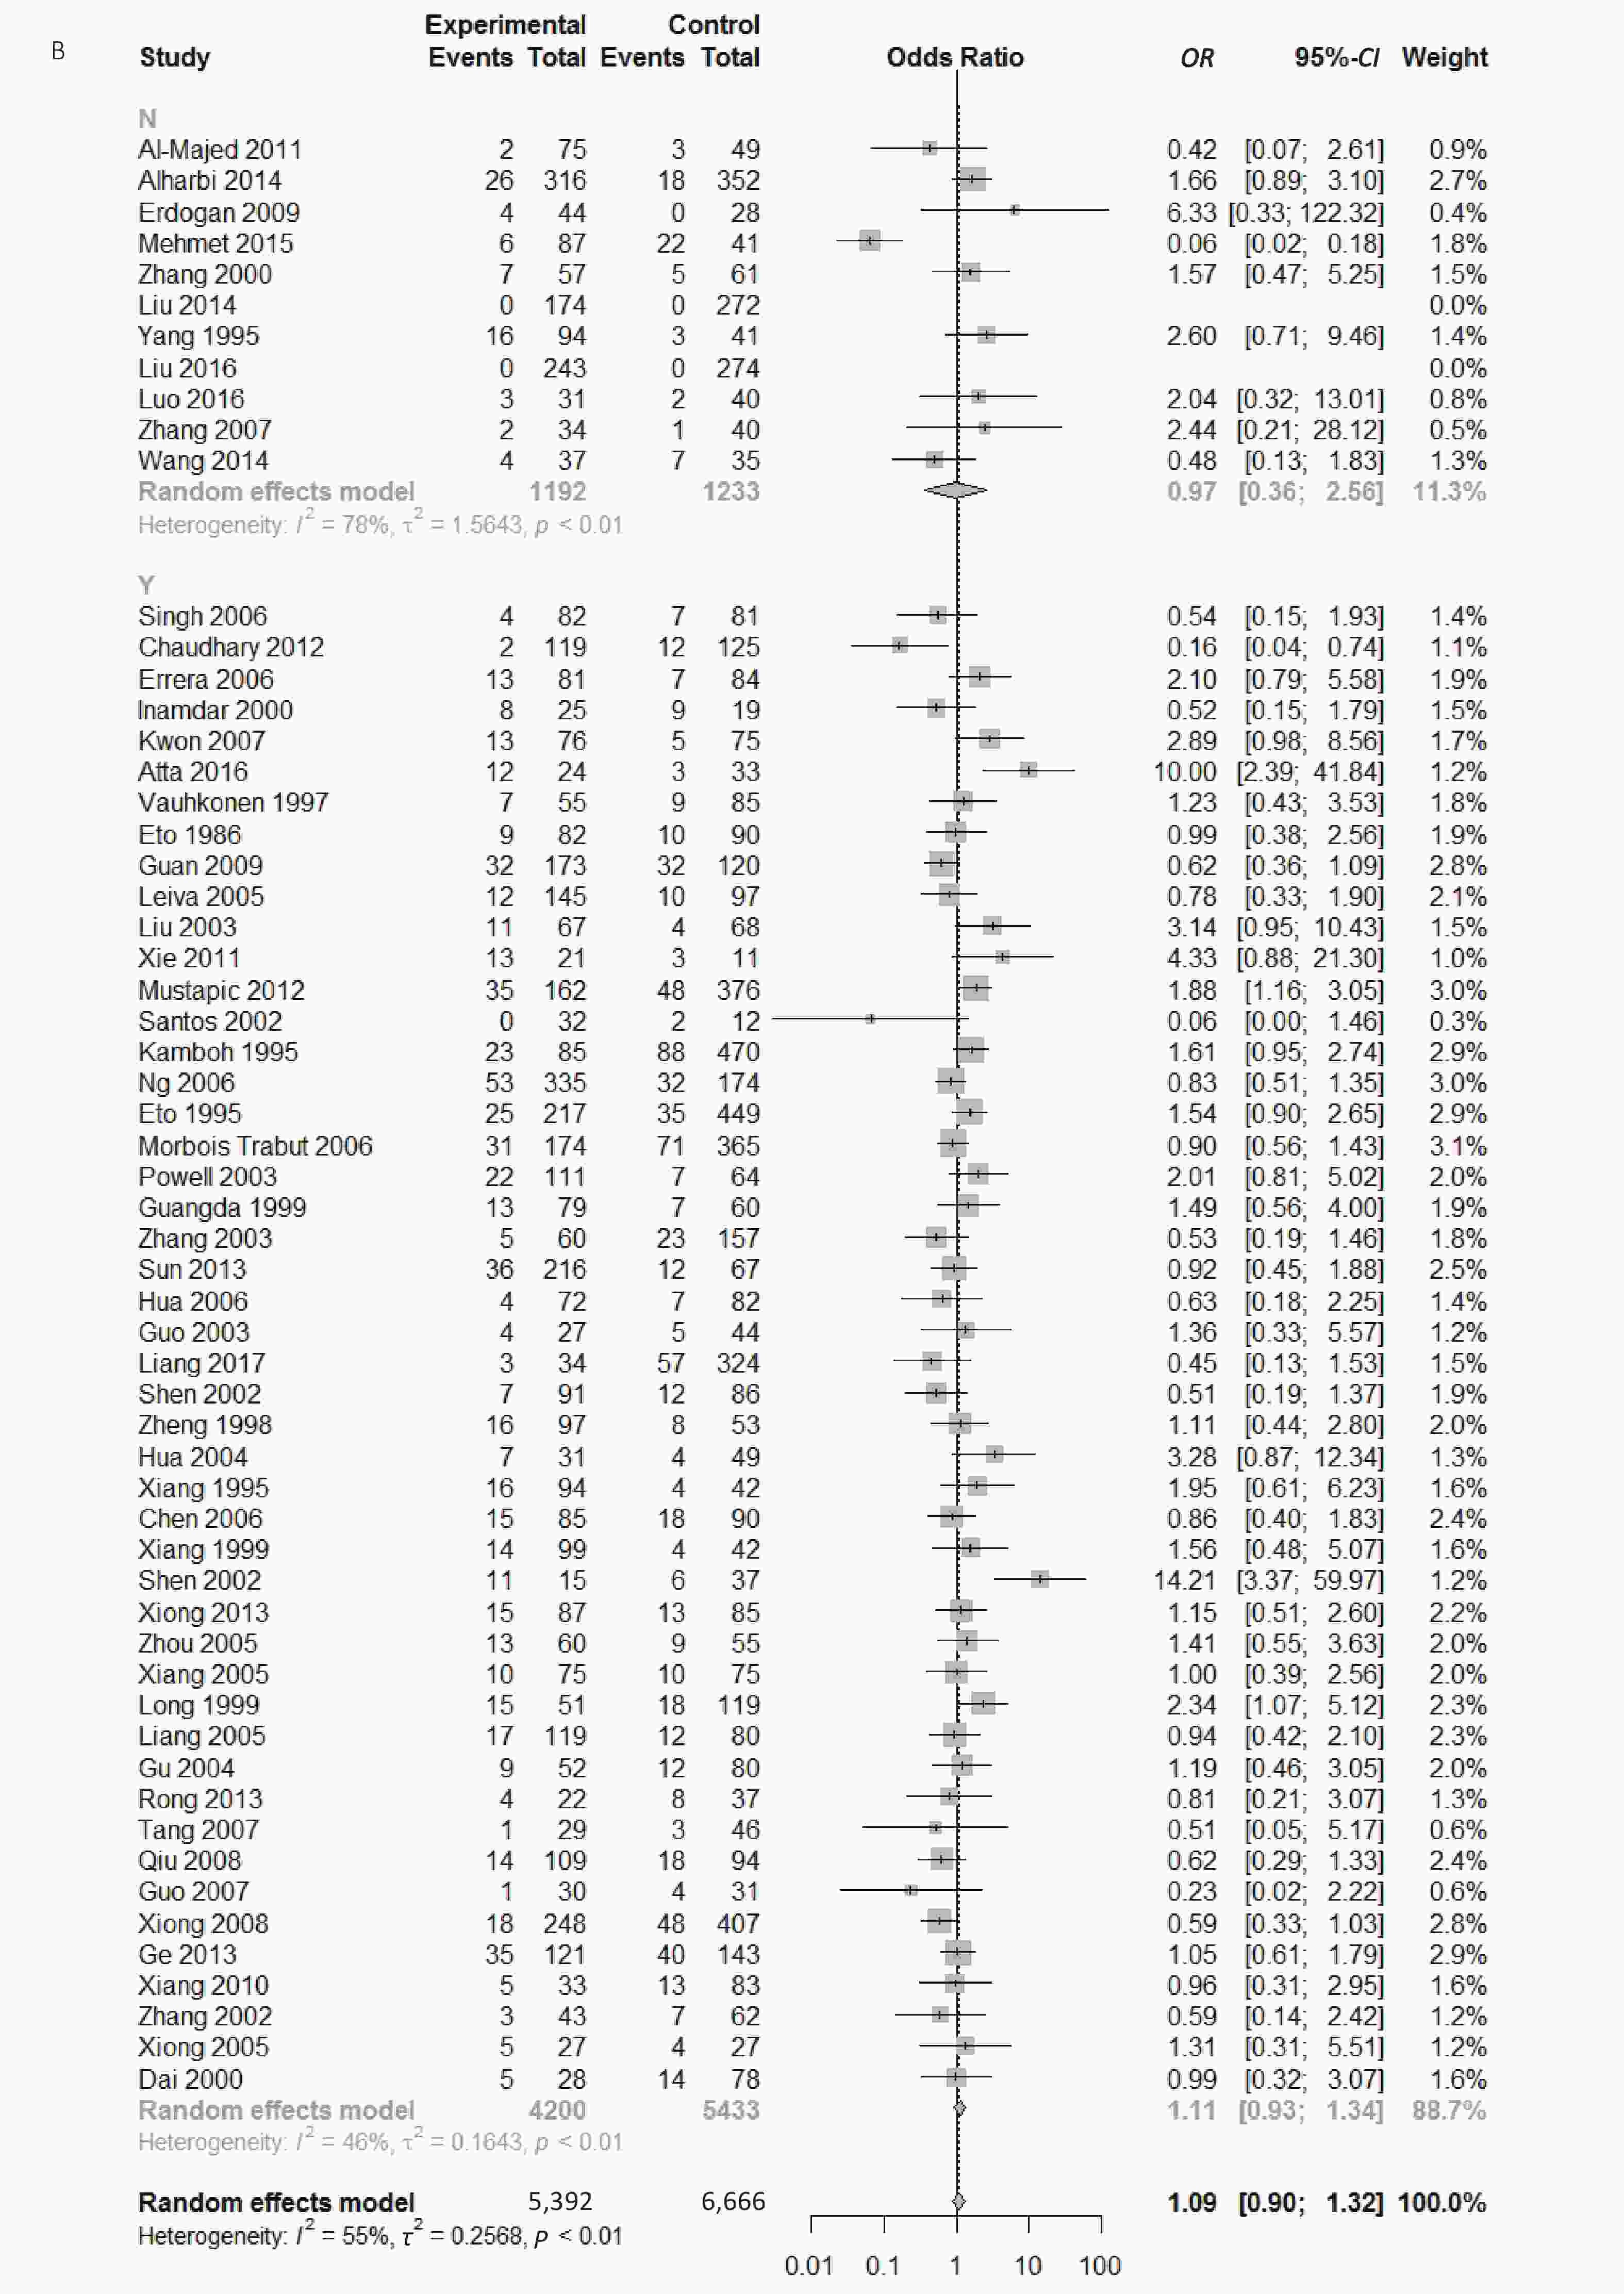
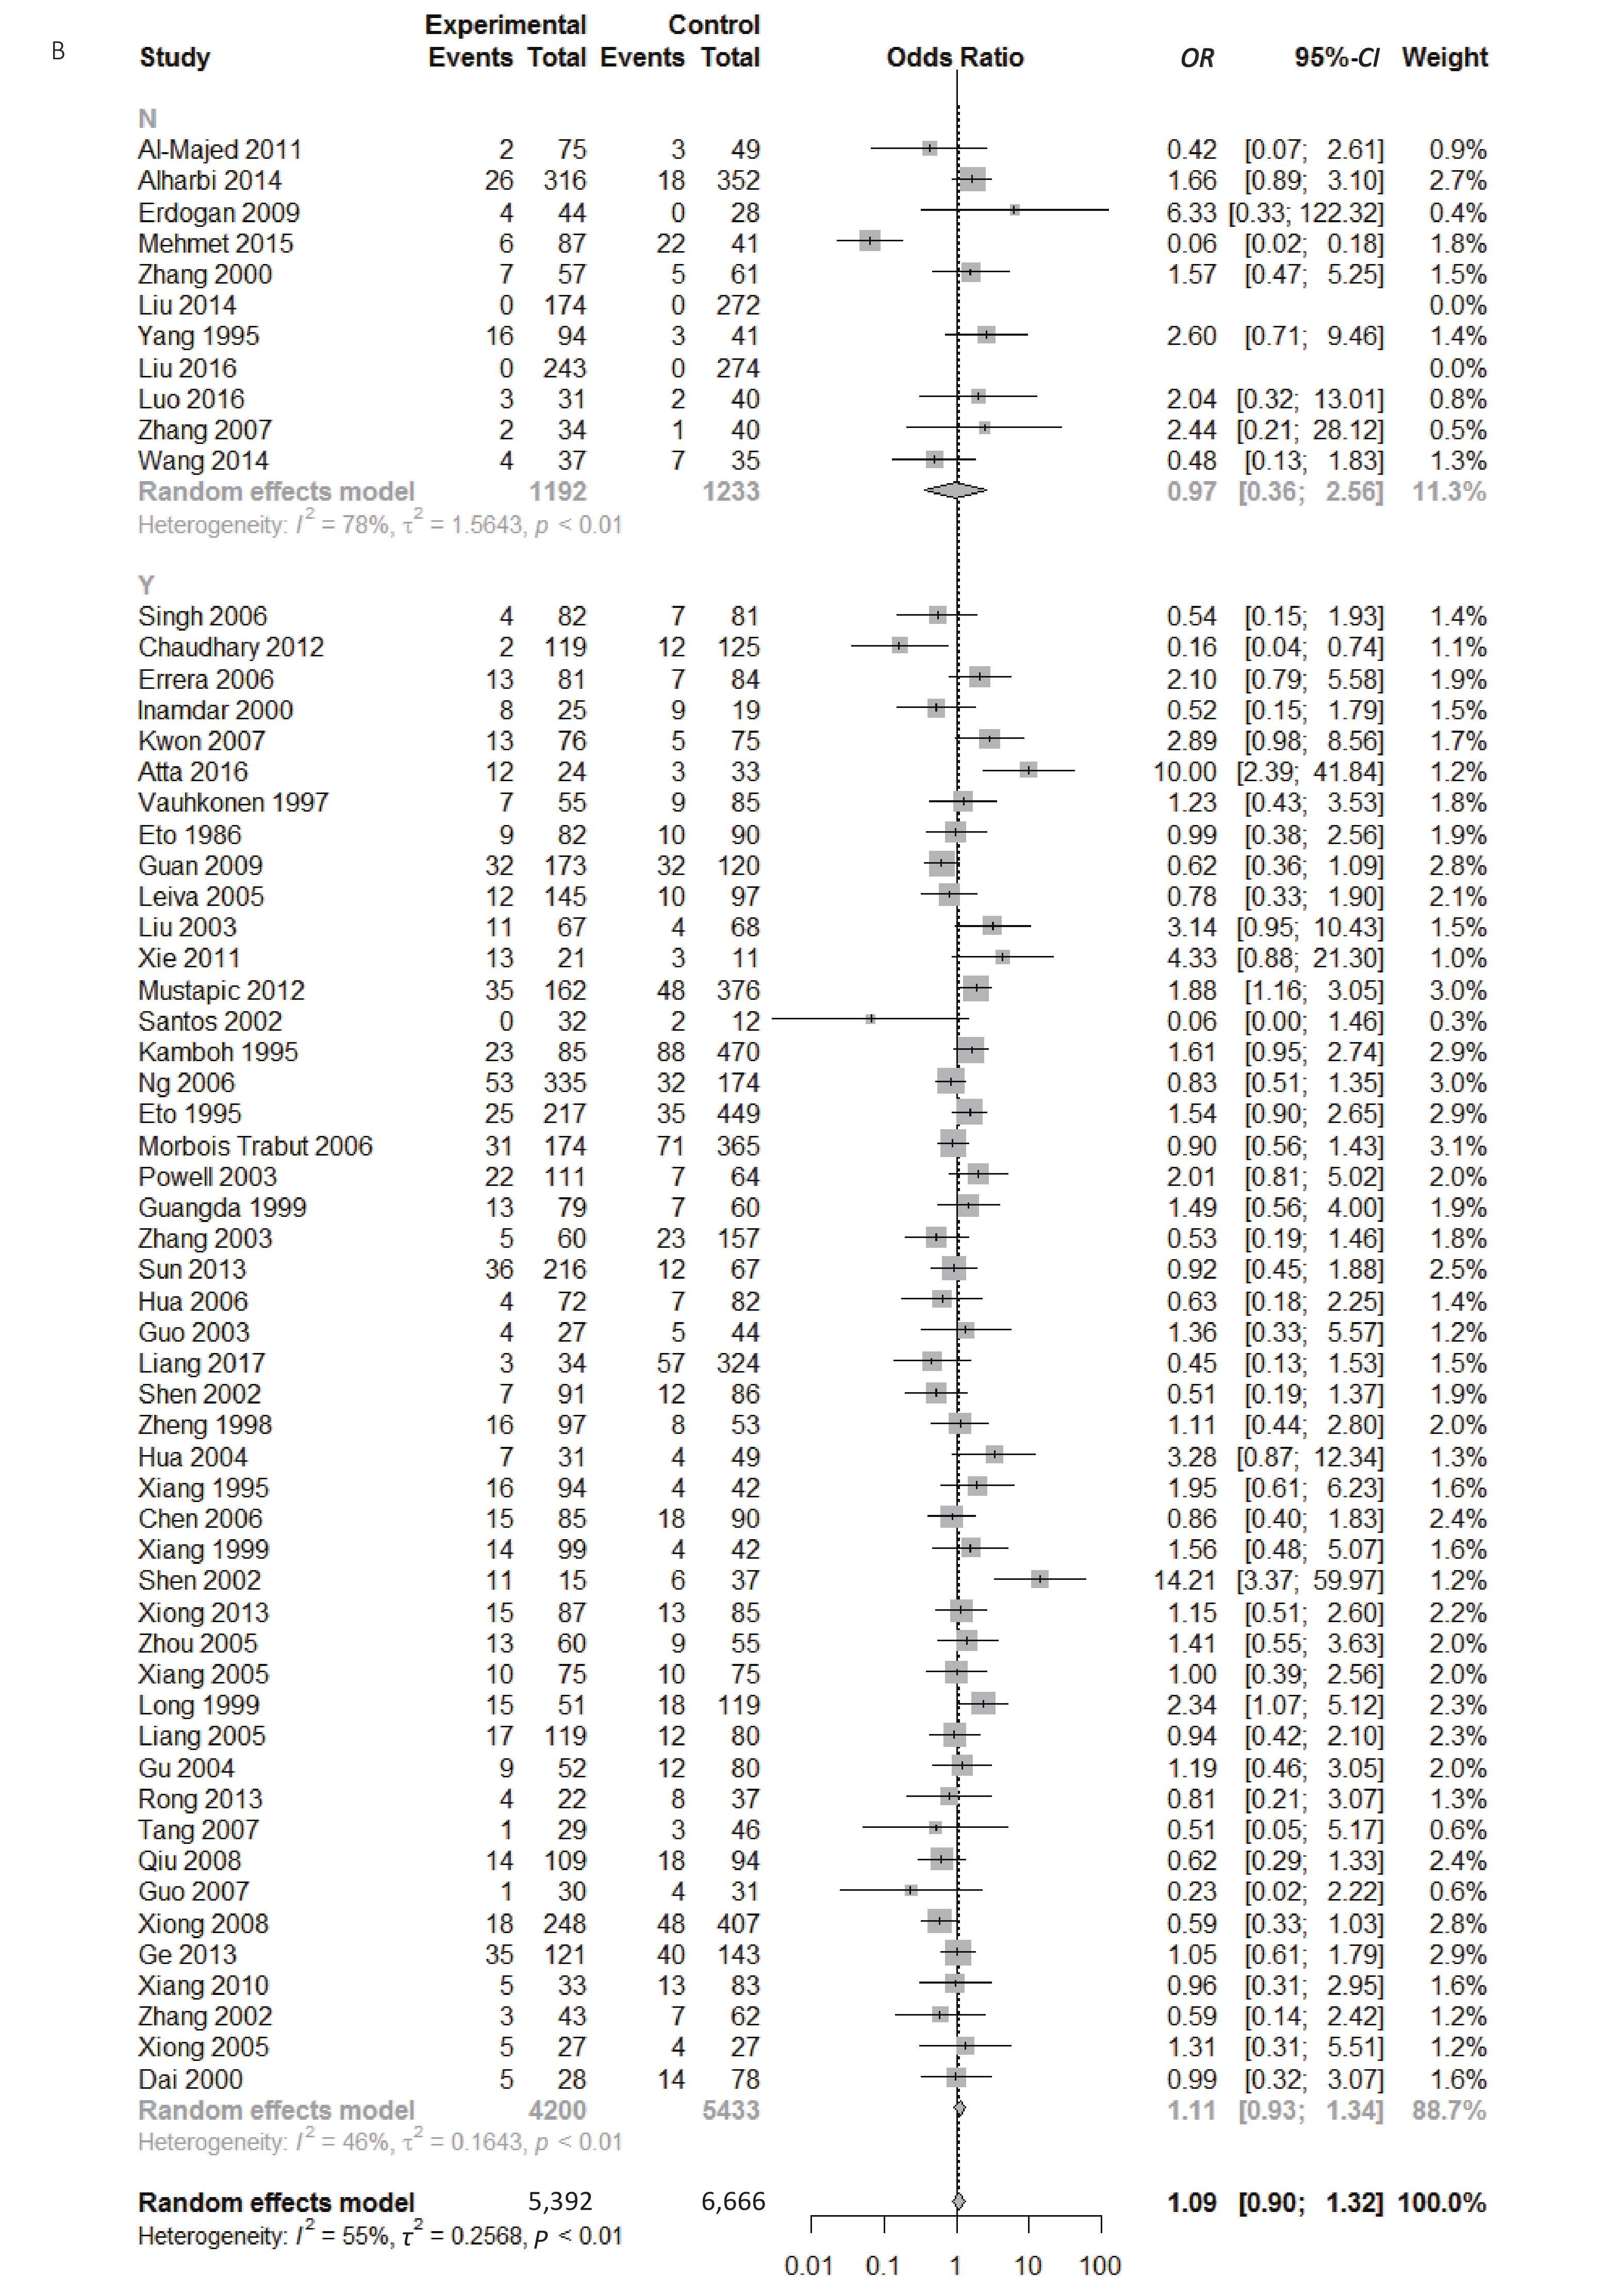
Figure S3. (A) Forest plot for associations between type 2 diabetes and ApoE ε2/ε3 genotype vs. ε3/ε3 genotype in the subgroup based on genotype. (B) Forest plot for associations between type 2 diabetes and ApoE ε2/ε3 genotype vs. ε3/ε3 genotype in the subgroup based on HWE
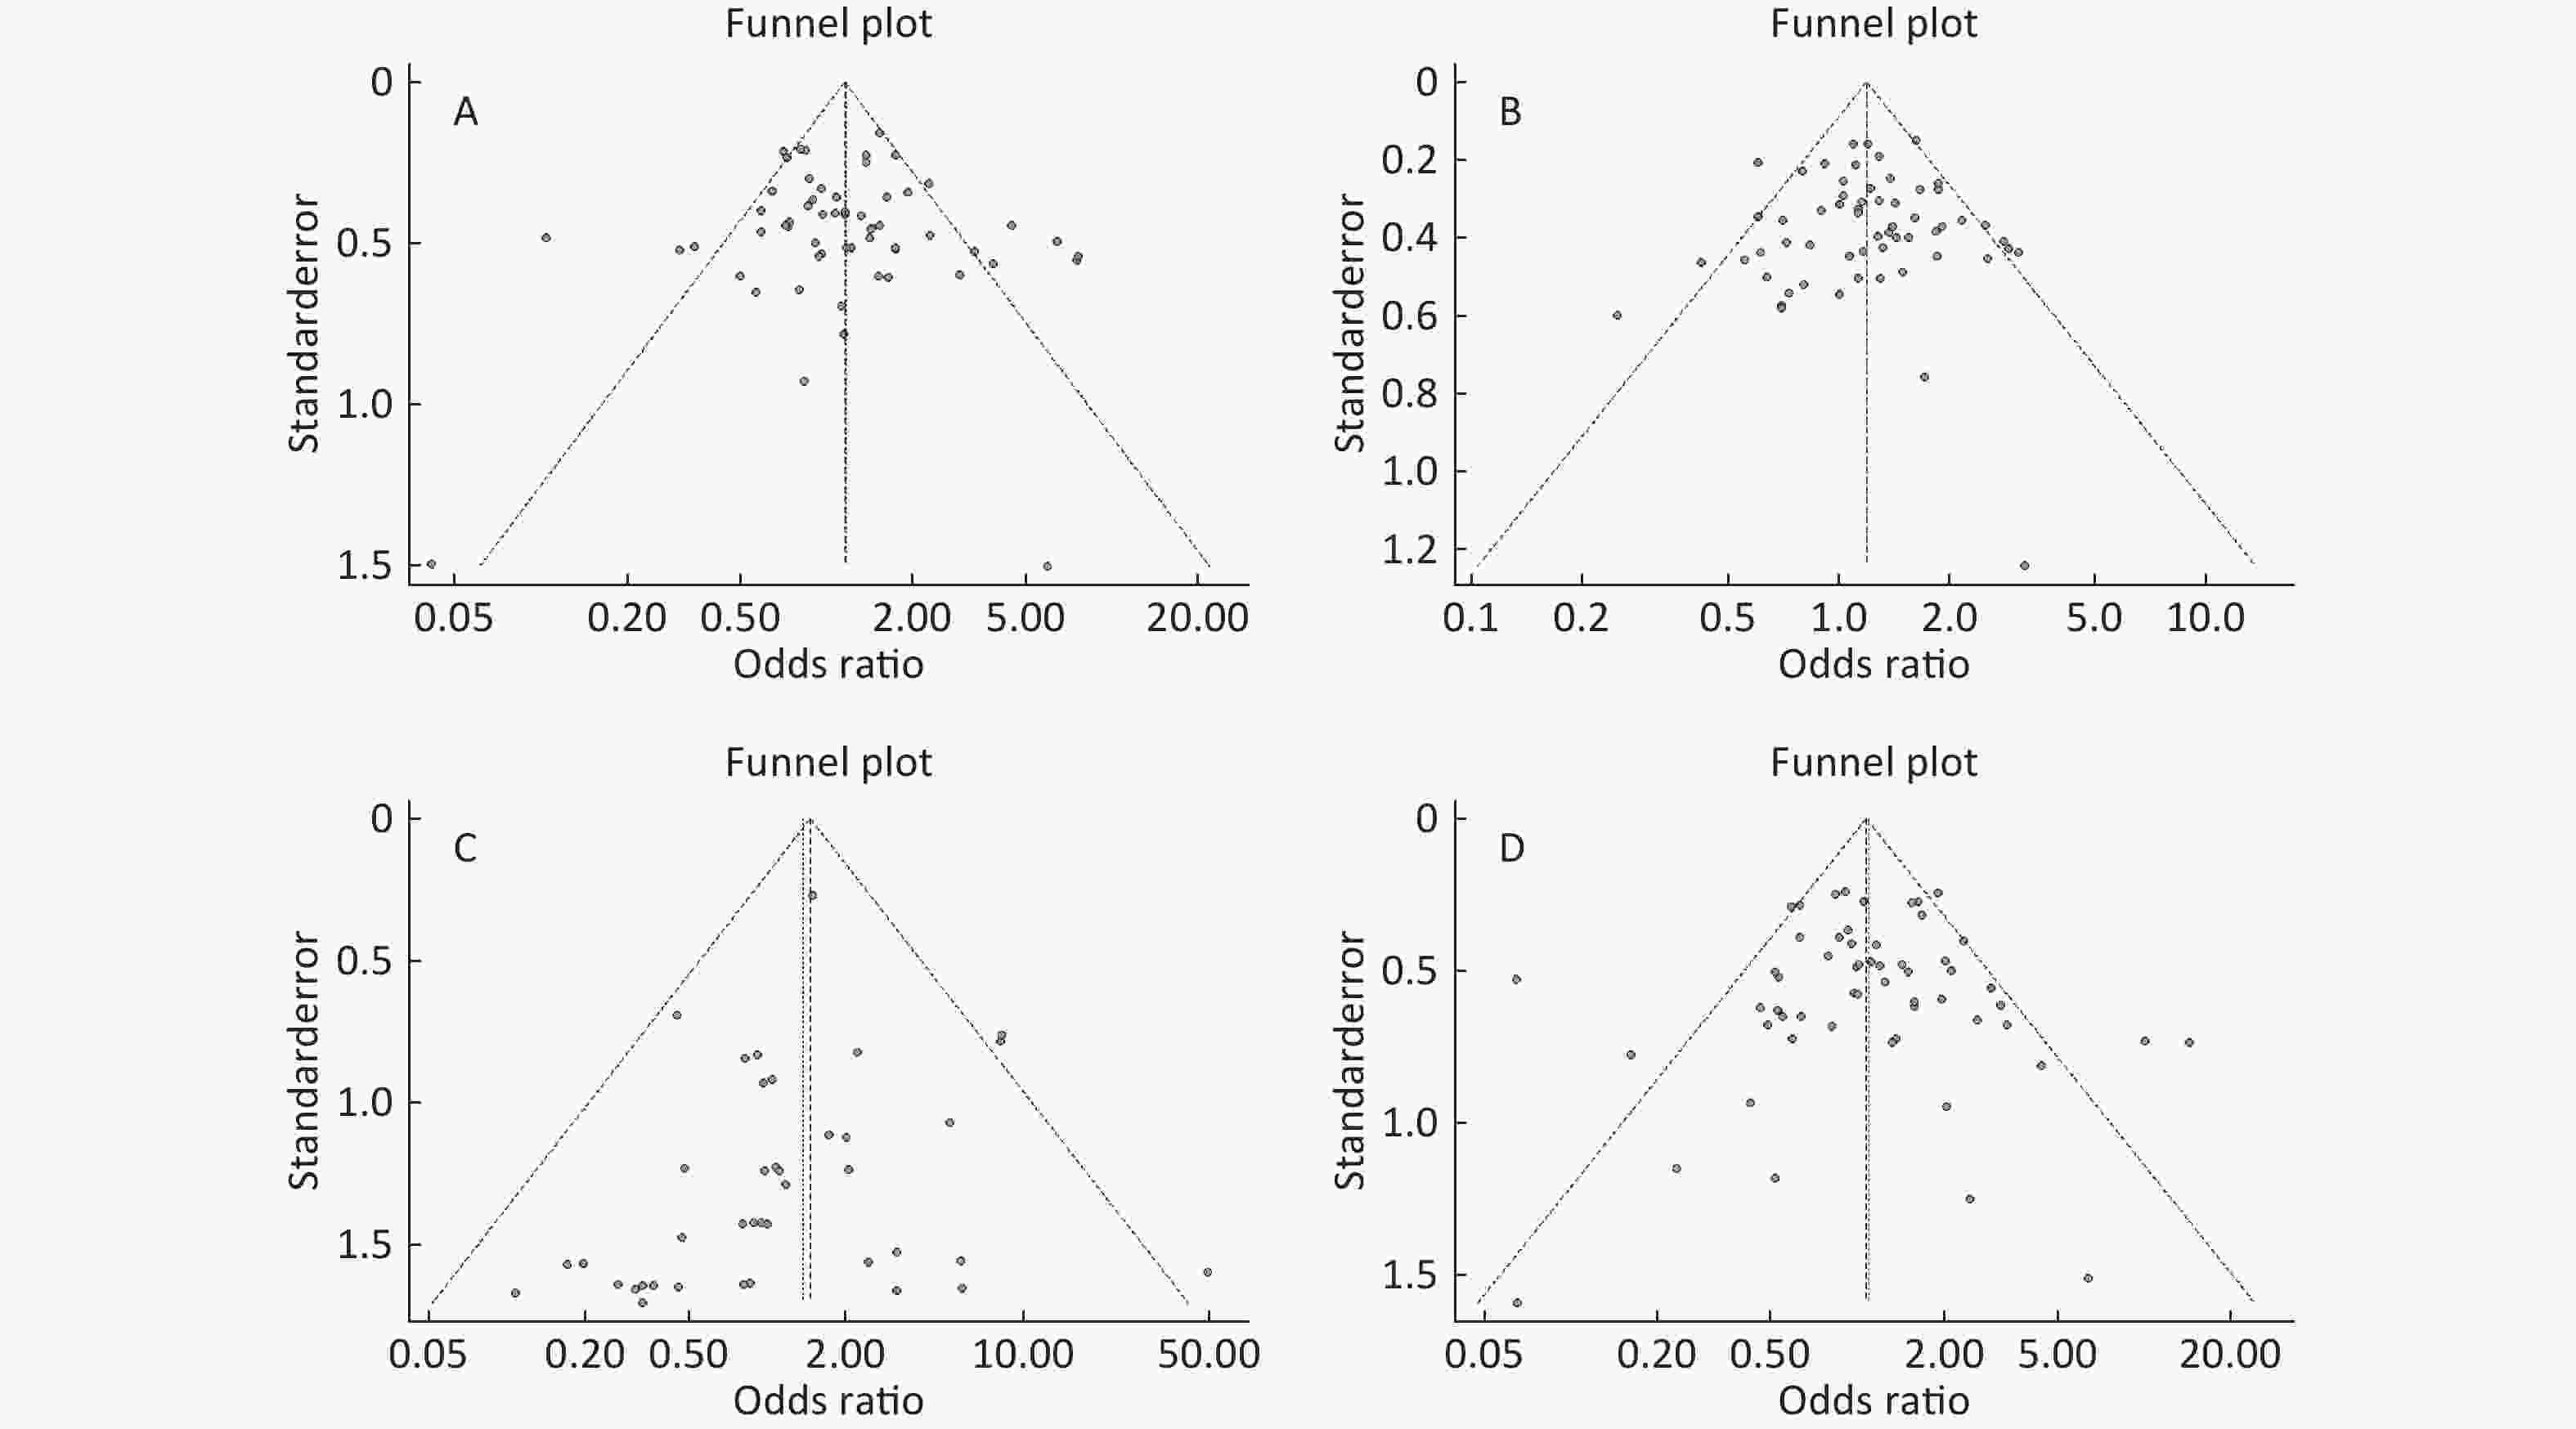
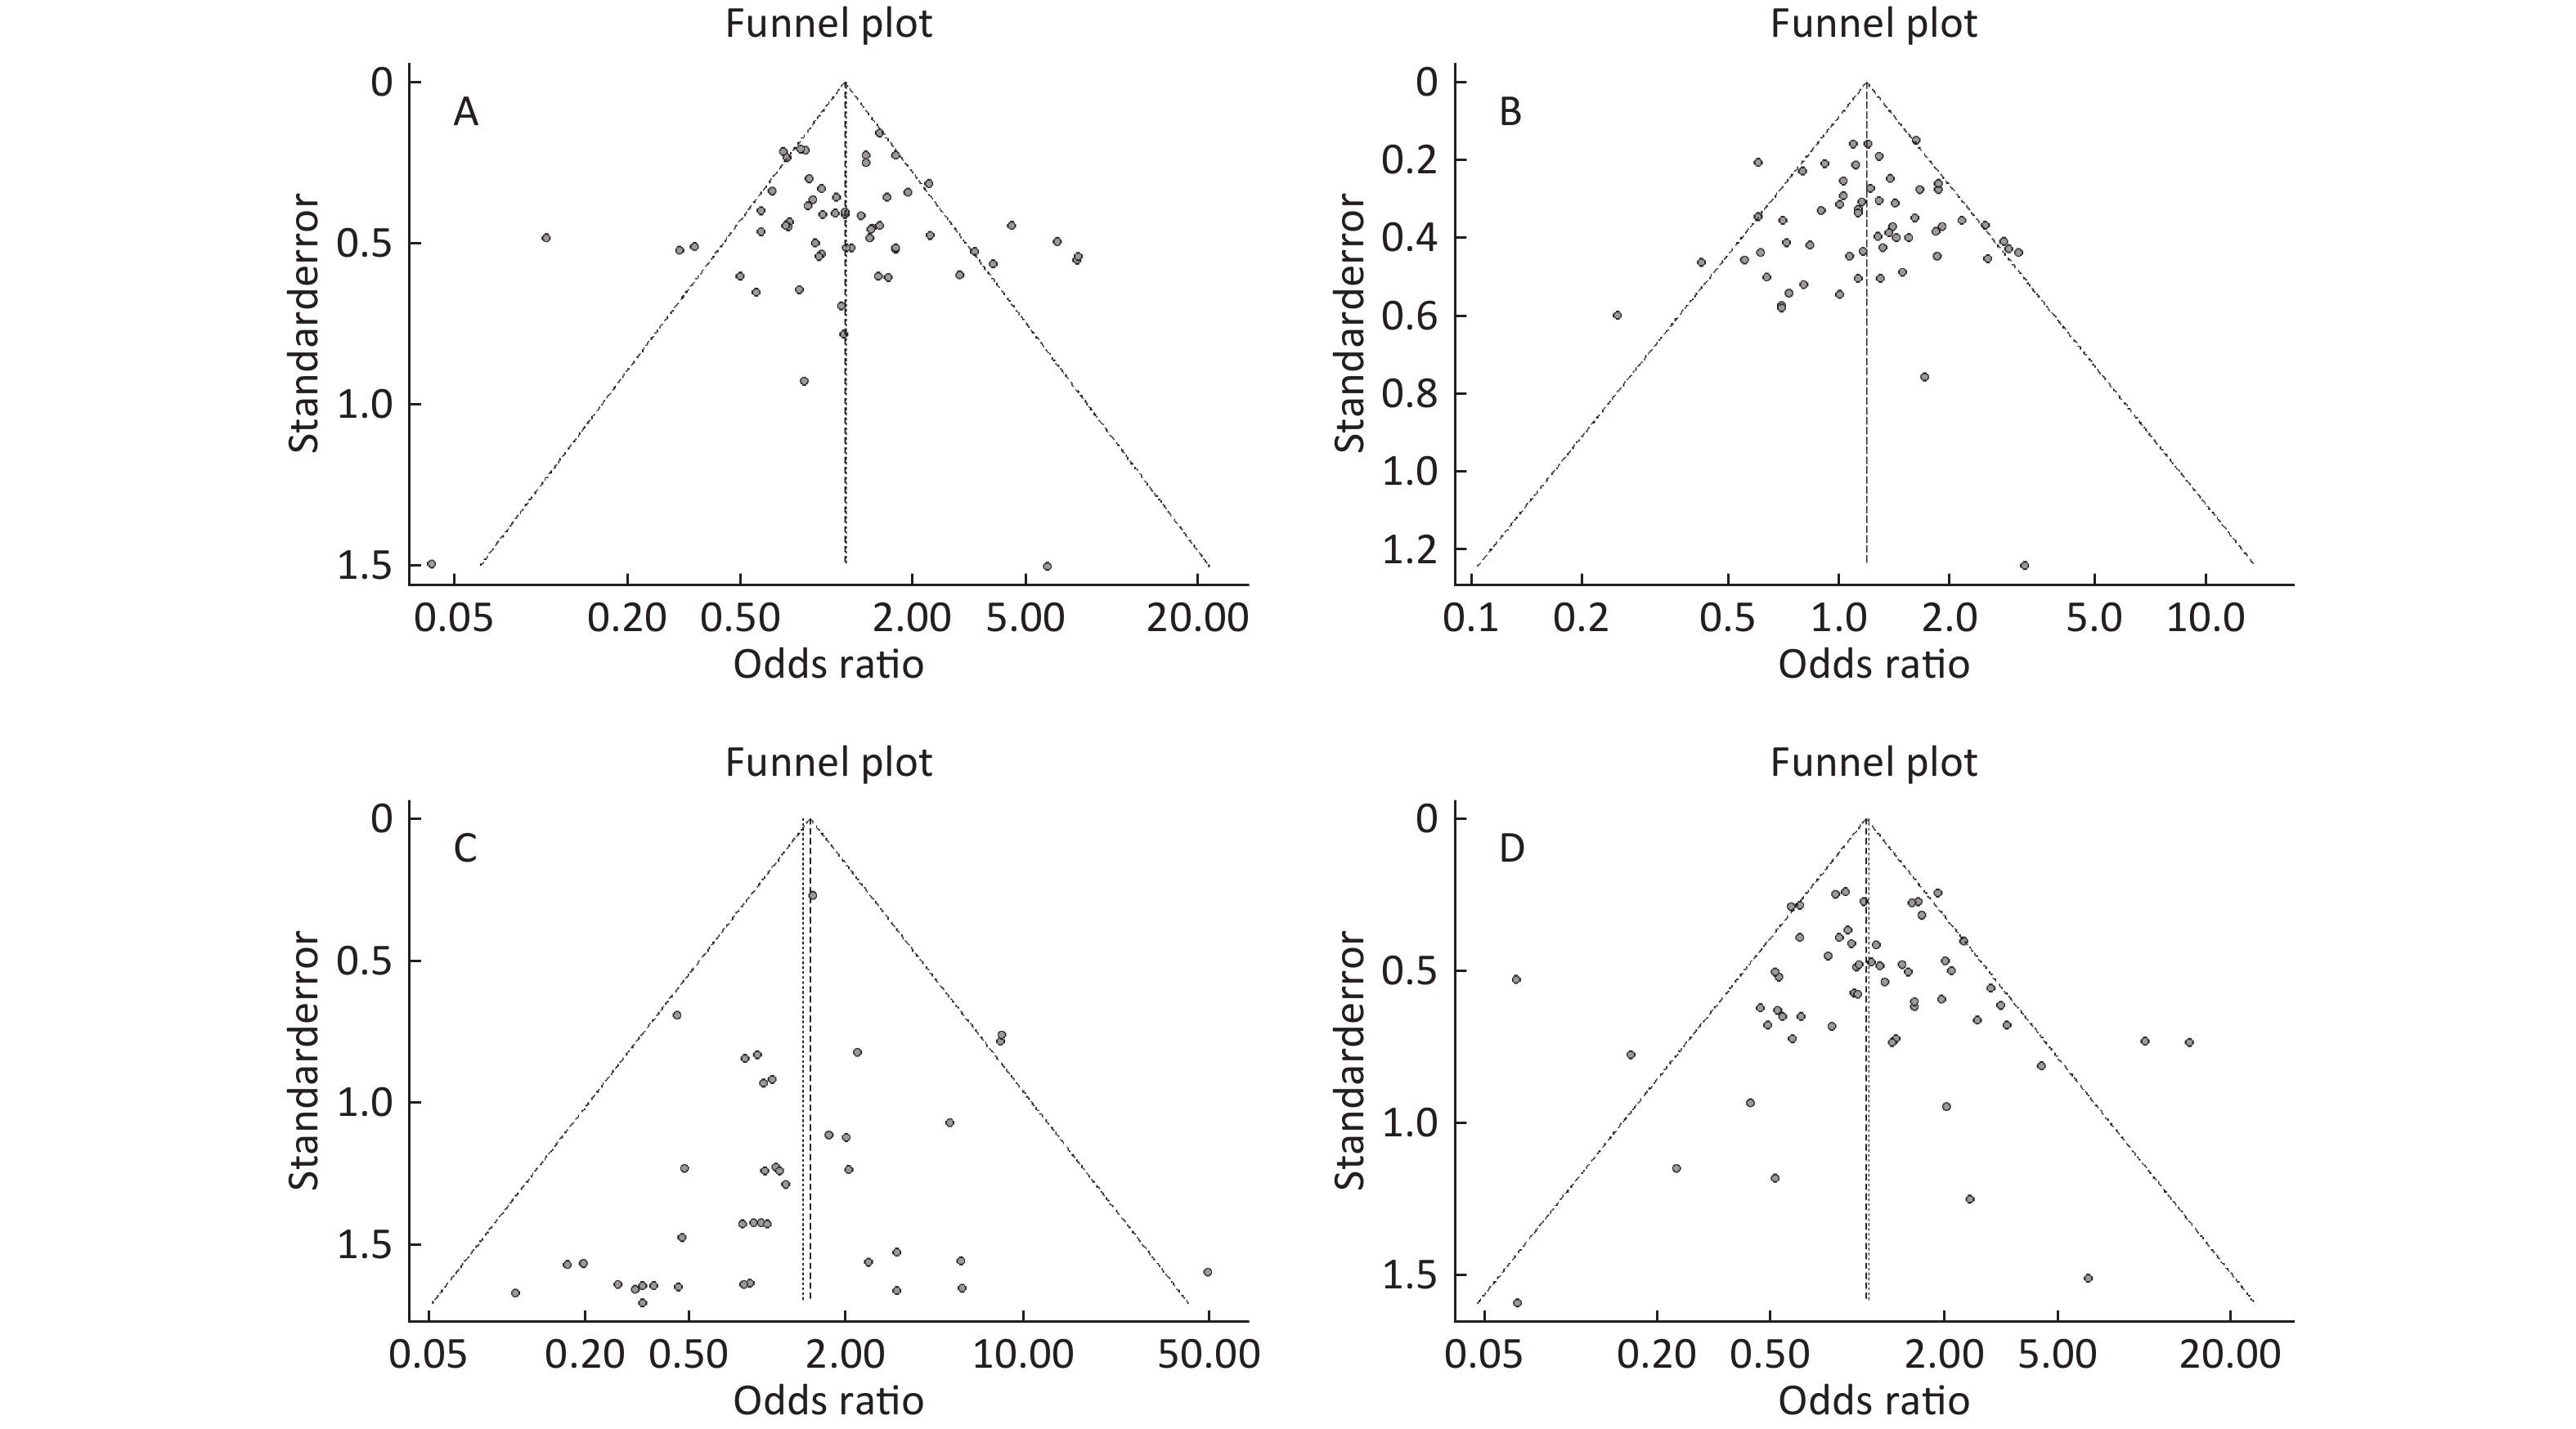
Figure S4. (A) Funnel plot of association between type 2 diabetes and ApoE ε2 allele vs. ε3 allele. (B) Funnel plot of association between type 2 diabetes and ApoE ε4 allele vs. ε3 allele. (C) Funnel plot of association between type 2 diabetes and ApoE ε2/ε2 genotype vs. and ε3/ε3 genotype. (D) Funnel plot of association between type 2 diabetes and ApoE ε2/ε3 genotype vs. and ε3/ε3 genotype
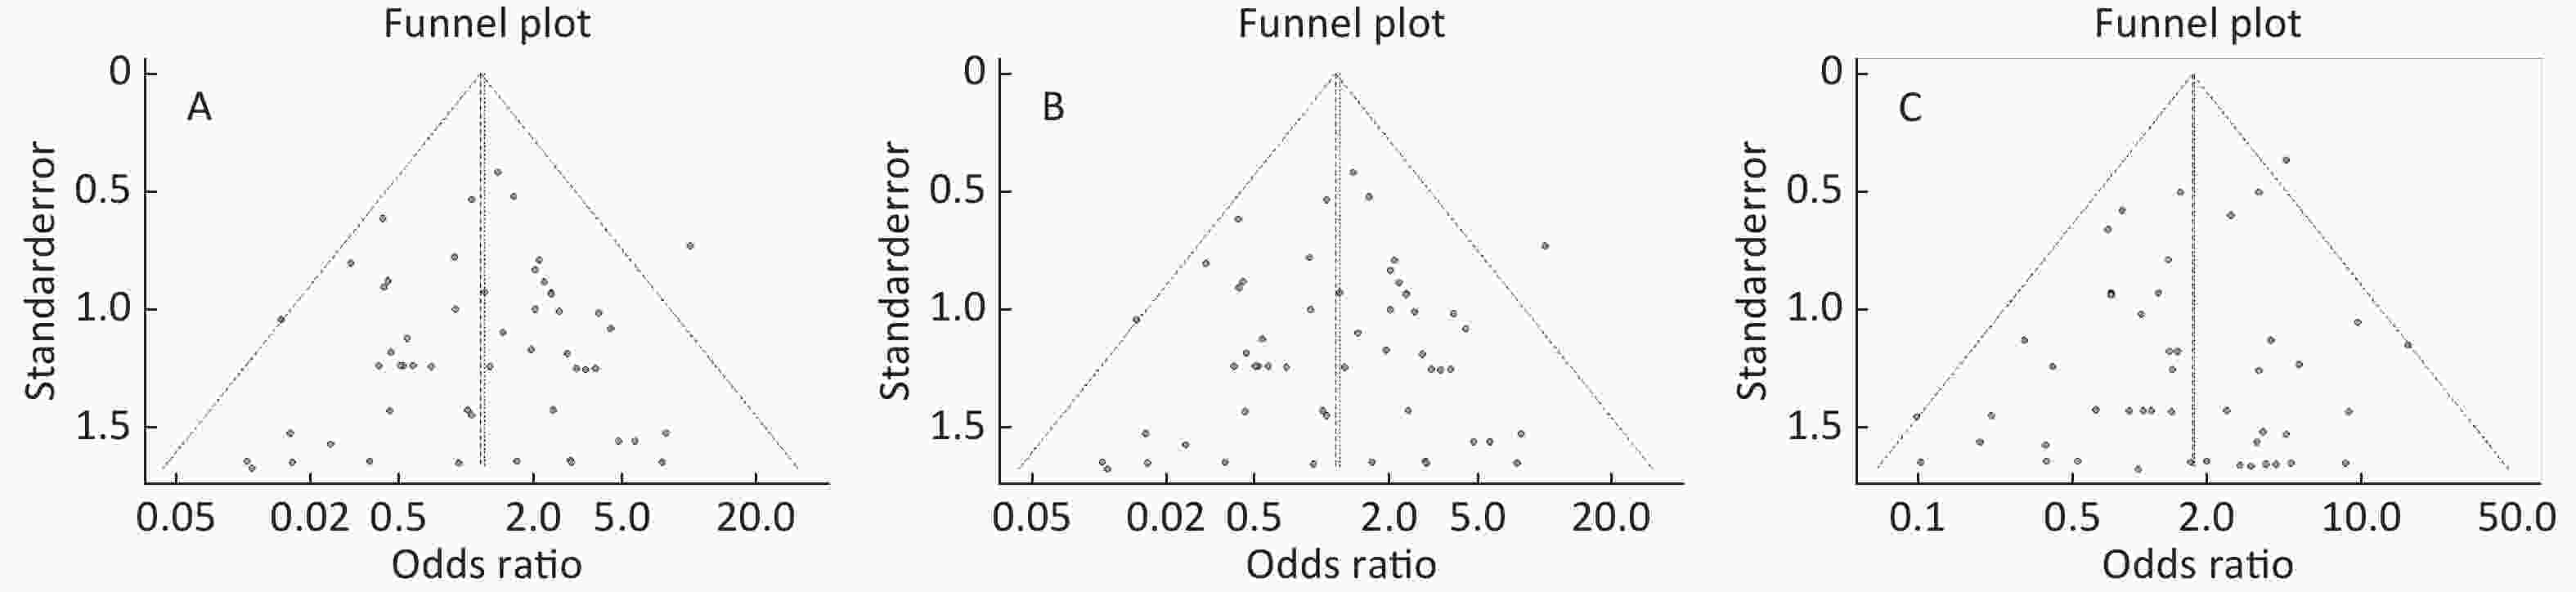
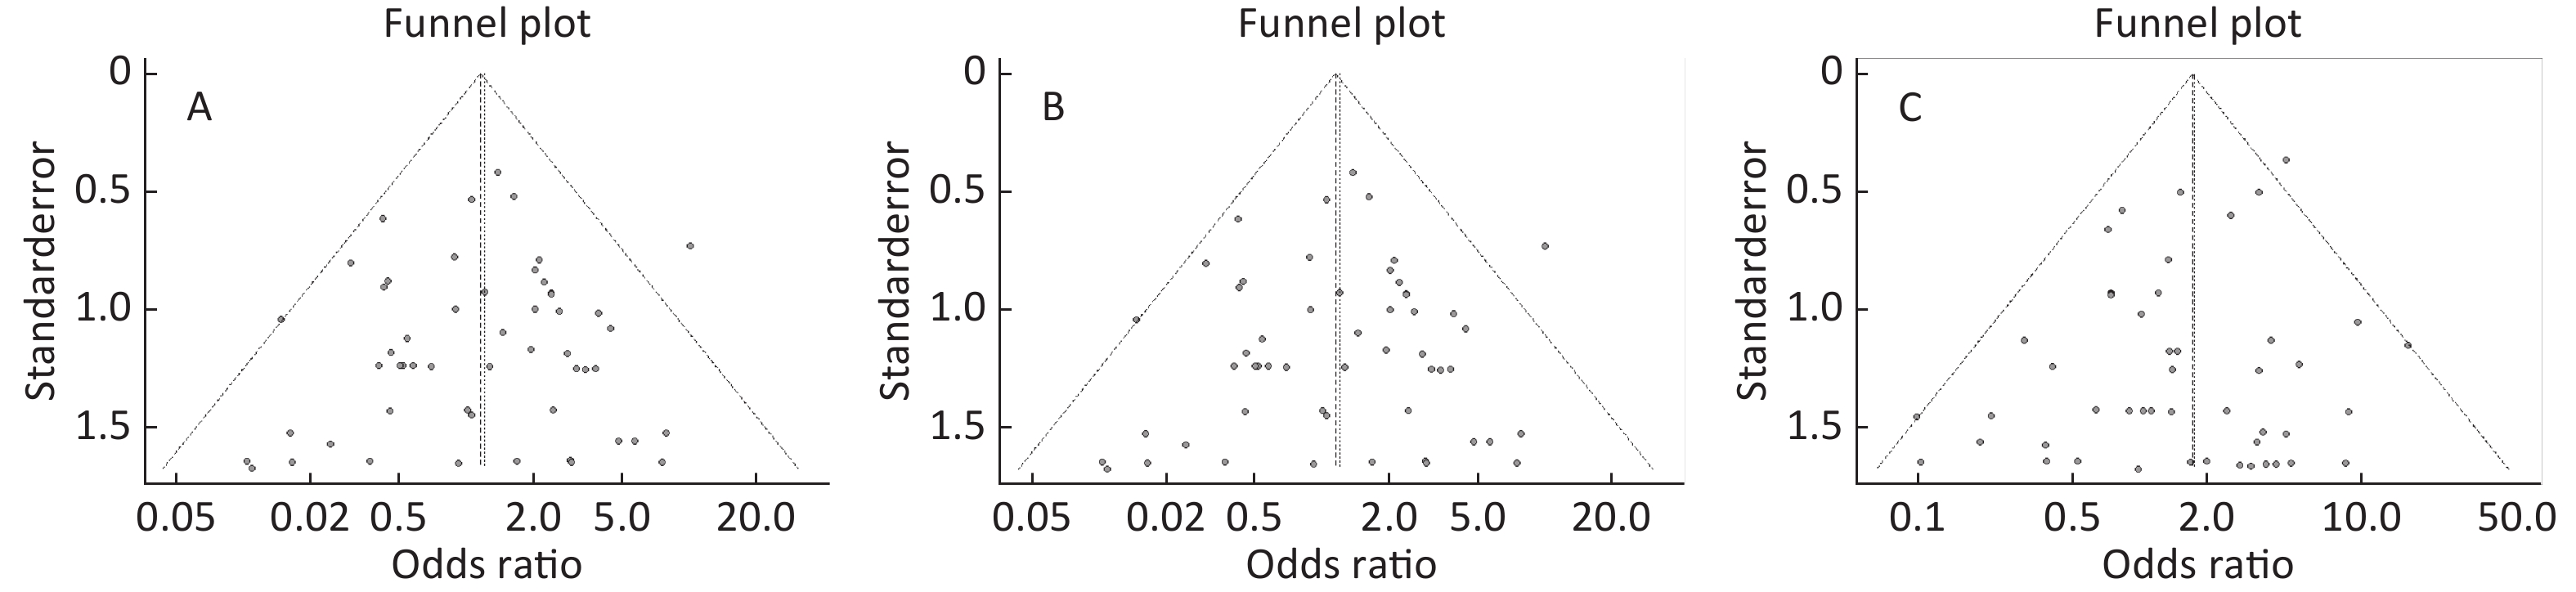
Figure S5. (A) Funnel plot of association between type 2 diabetes and ApoE ε2/ε4 genotype vs. and ε3/ε3 genotype. (B) Funnel plot of association between type 2 diabetes and ApoE ε3/ε4 genotype vs. and ε3/ε3 genotype. (C) Funnel plot of association between type 2 diabetes and ApoE ε4/ε4 genotype vs. and ε3/ε3 genotype
-
We performed this meta-analysis by extensive literature search in PubMed, Web of Science, Medline, WanFang, VIP, and CNKI databases (last search on February 28, 2019). We used the following terms for our search strategy, (‘ApoE’ OR ‘Apolipoprotein E’) AND (‘polymorphism, Genetic’ OR ‘‘variant’ OR ‘mutation’) AND (‘type 2 diabetes mellitus’ OR ‘type 2 diabetes’ OR ‘T2DM’ OR ‘non-insulin dependent diabetes’ OR ‘NIDDM’). The equivalent Chinese terms were used in the Chinese databases. In addition, we retrieved related articles that had not been identified in the initial search to replenish literatures.
-
Studies included in this meta-analysis were based on the following criteria: (1) case–control studies; (2) assessing the association between ApoE polymorphism and type 2 diabetes. The exclusion criteria met the follows: (1) duplicate articles; (2) no healthy controls; (3) insufficient information on genotype or allele frequencies.
-
We extracted the main characteristics of each eligible study, including first author’s last name, date of publication, region, population’s ethnicity, genotyping method, number of cases and controls, and counts of the ApoE genotype or allele. Hardy-Weinberg equilibrium (HWE) was collected and calculated among the controls.
-
We used the Newcastle-Ottawa scale (NOS) to assess the quality of each article by a ‘star’ rating system covering selection, comparability, and exposure. A score of 1 point was awarded for each condition a study met, and no point (0 score) if the condition or requirement was not met. We calculated the total Quality Score of each study. Two authors (Jikang Shi and Shuping Ren) assessed the quality of included studies independently. When inconformity occurred between the two authors, we discussed with the third investigator (CHEN Da Wei) and came to a conformity. We included those studies with poor quality score to avoid selection bias.
-
We calculated the allele and genotype frequencies of ApoE for each study to evaluate the HWE through Goodness of fit Chi-square test among control groups, and P < 0.05 was seen as a significant deviation from HWE. The strength of association between ApoE polymorphisms and type 2 diabetes susceptibility was assessed using odds ratios (OR) and 95% confidence intervals (95% CI) because outcome variable was binary. Heterogeneity was assessed by the Chi-square test based Q-statistic and quantified by I2-statistic[34]. Random-effect models (DerSimonian and Laird methods) were applied to calculate OR and 95% CI when P value of Q test was more than 0.10 or I2 value was more than 50%; otherwise, fixed-effect models (Mantel and Haenszel methods) were used (I2 ≥ 50% considered heterogeneity existed in between-study in this meta-analysis). Subgroup analyses stratified by ethnicity, quality score and Hardy–Weinberg equilibrium were calculated to trace main sources of heterogeneity and to identify the association between ApoE polymorphisms and type 2 diabetes in different groups. Publication bias was evaluated using funnel plots, and quantified by the Begg’s and Egger’s tests (P < 0.05 considered statistically significant publication bias)[35]. Sensitivity analysis was performed to examine stability of results by omitting each study in each turn. All data management and statistical analyses were used R soft-ware (version 3.4.3), P-value < 0.05 was considered statistically significant.
-
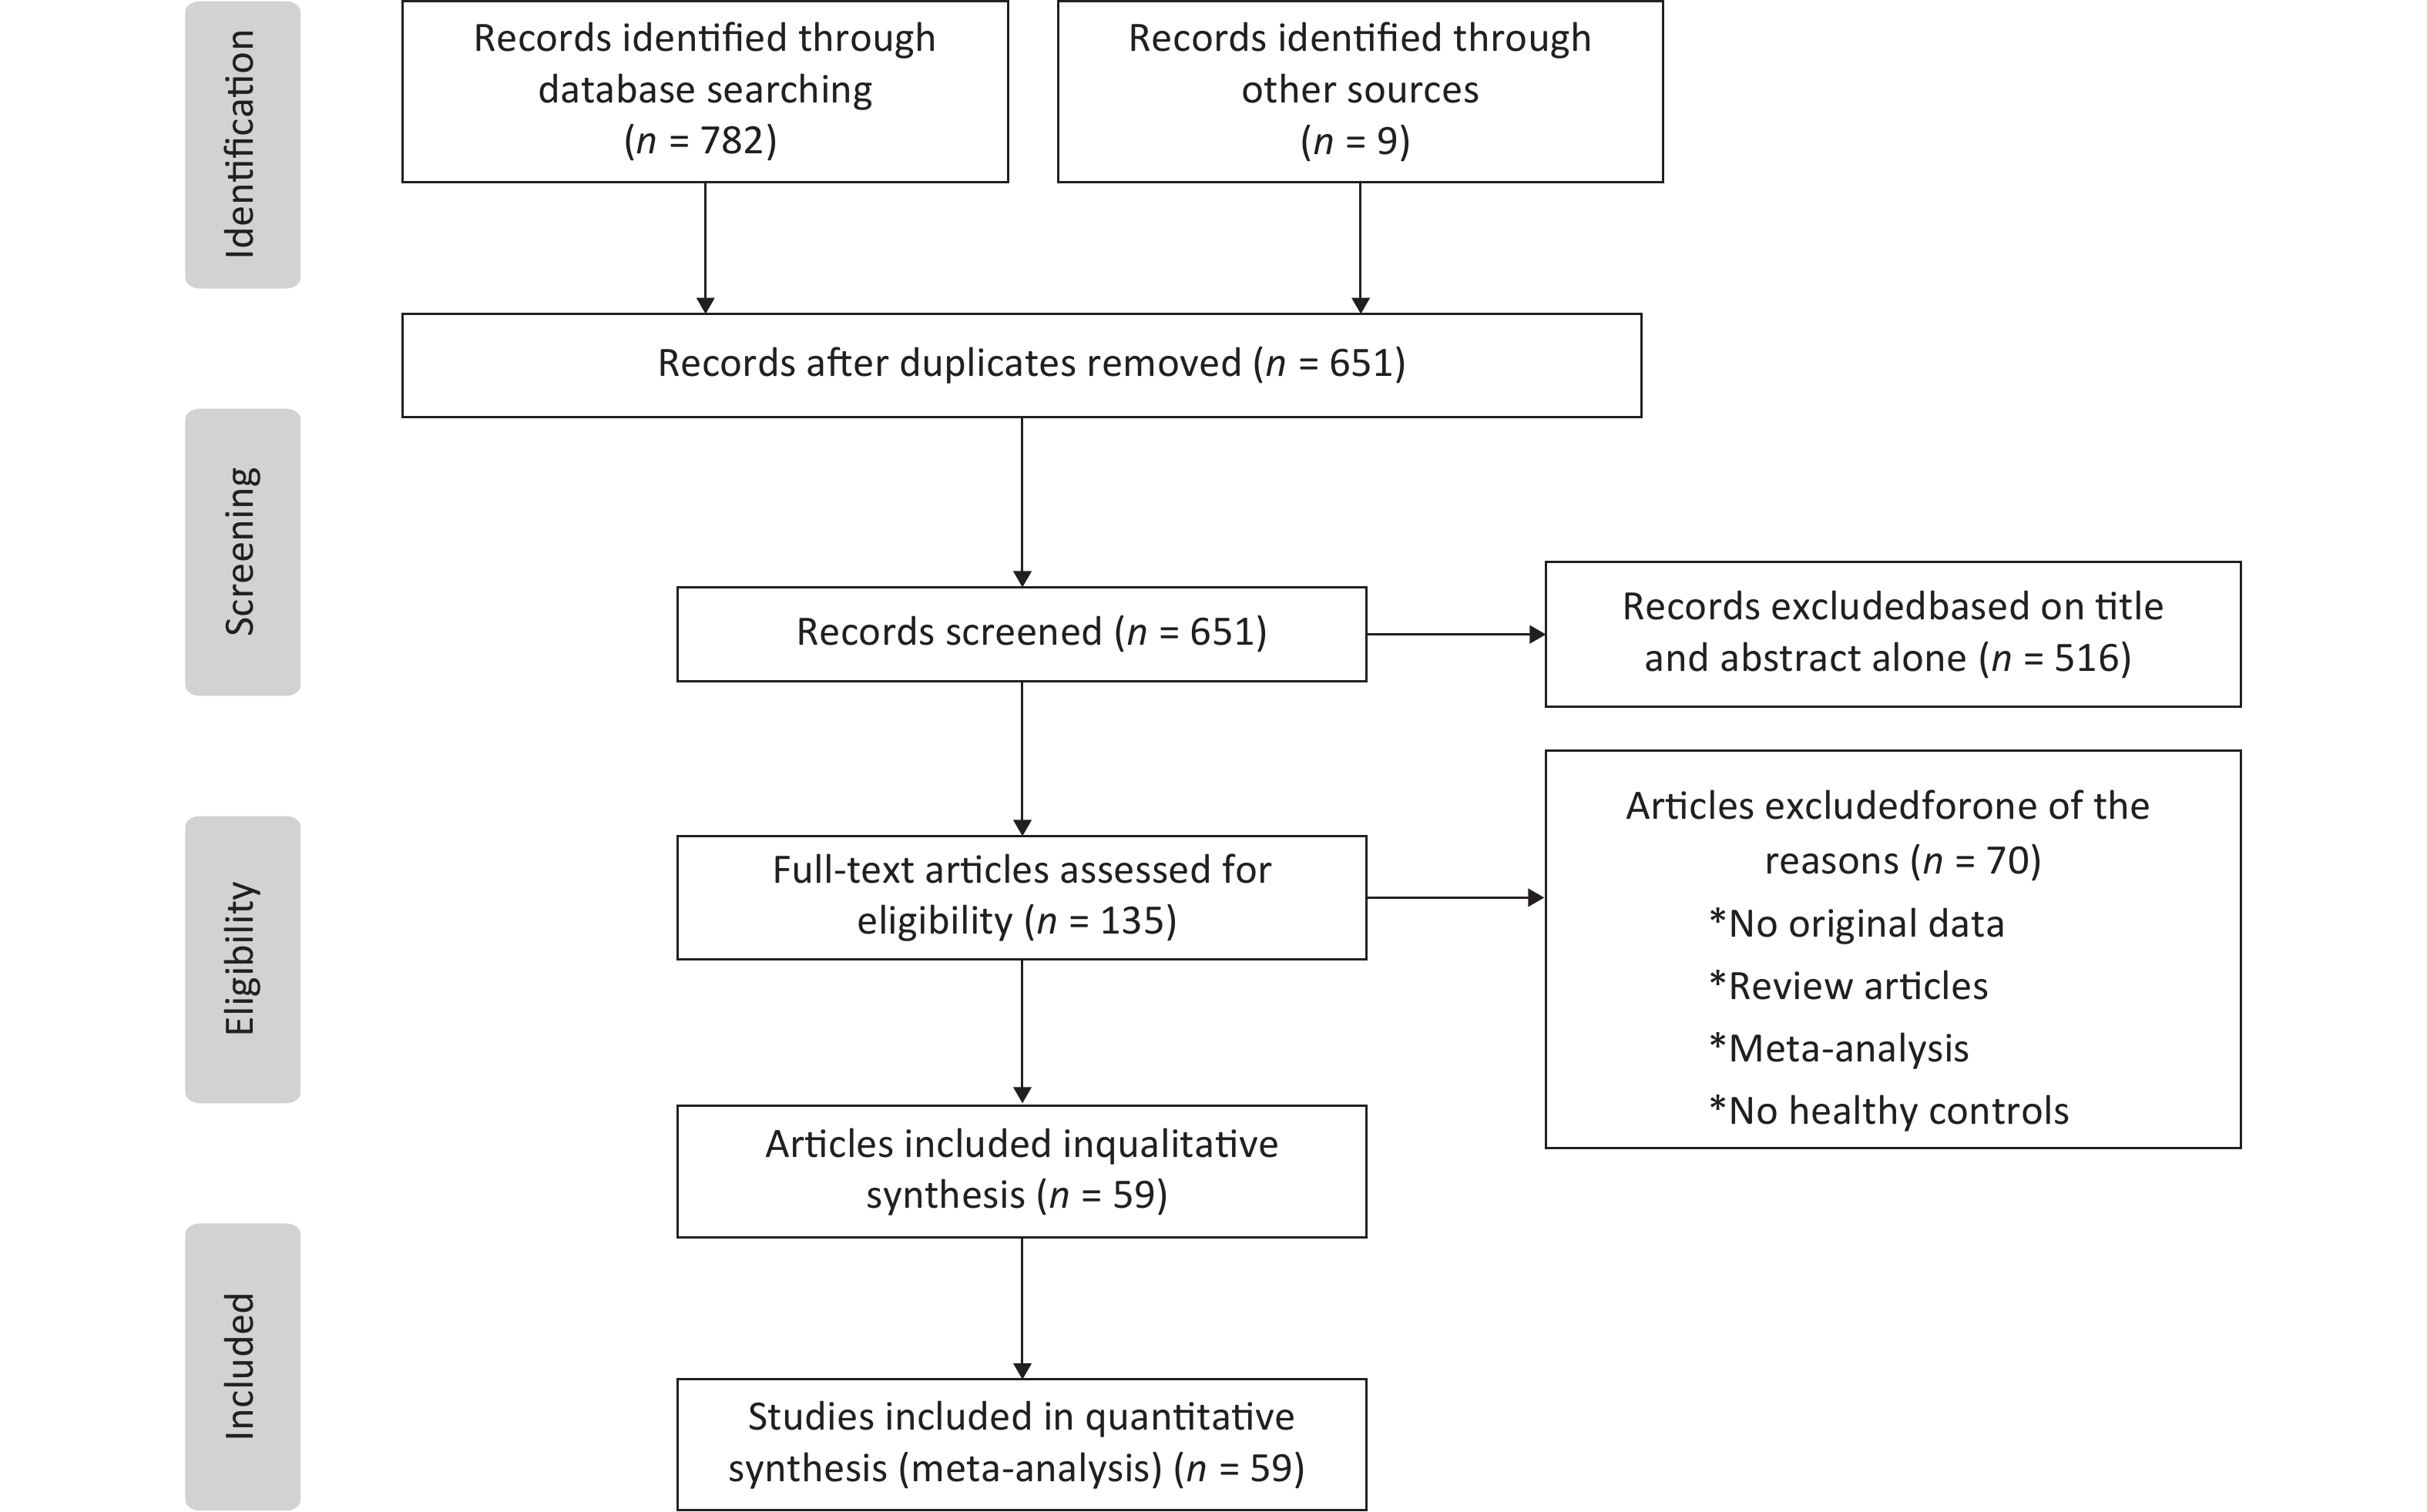
Our meta-analysis initially collected 791 published articles, including 782 papers collected by our search strategy and 9 papers through the references. After scanning the abstracts and full texts according to the inclusion and exclusion criteria, we included 59 eligible articles with 6,872 cases and 8,250 controls in this paper. The protocol of the process for literature identification and selection is listed in Figure 1, and the baseline characteristics of the included studies are summarized in Table 1, all the results of meta-analysis is shown in Table 2.
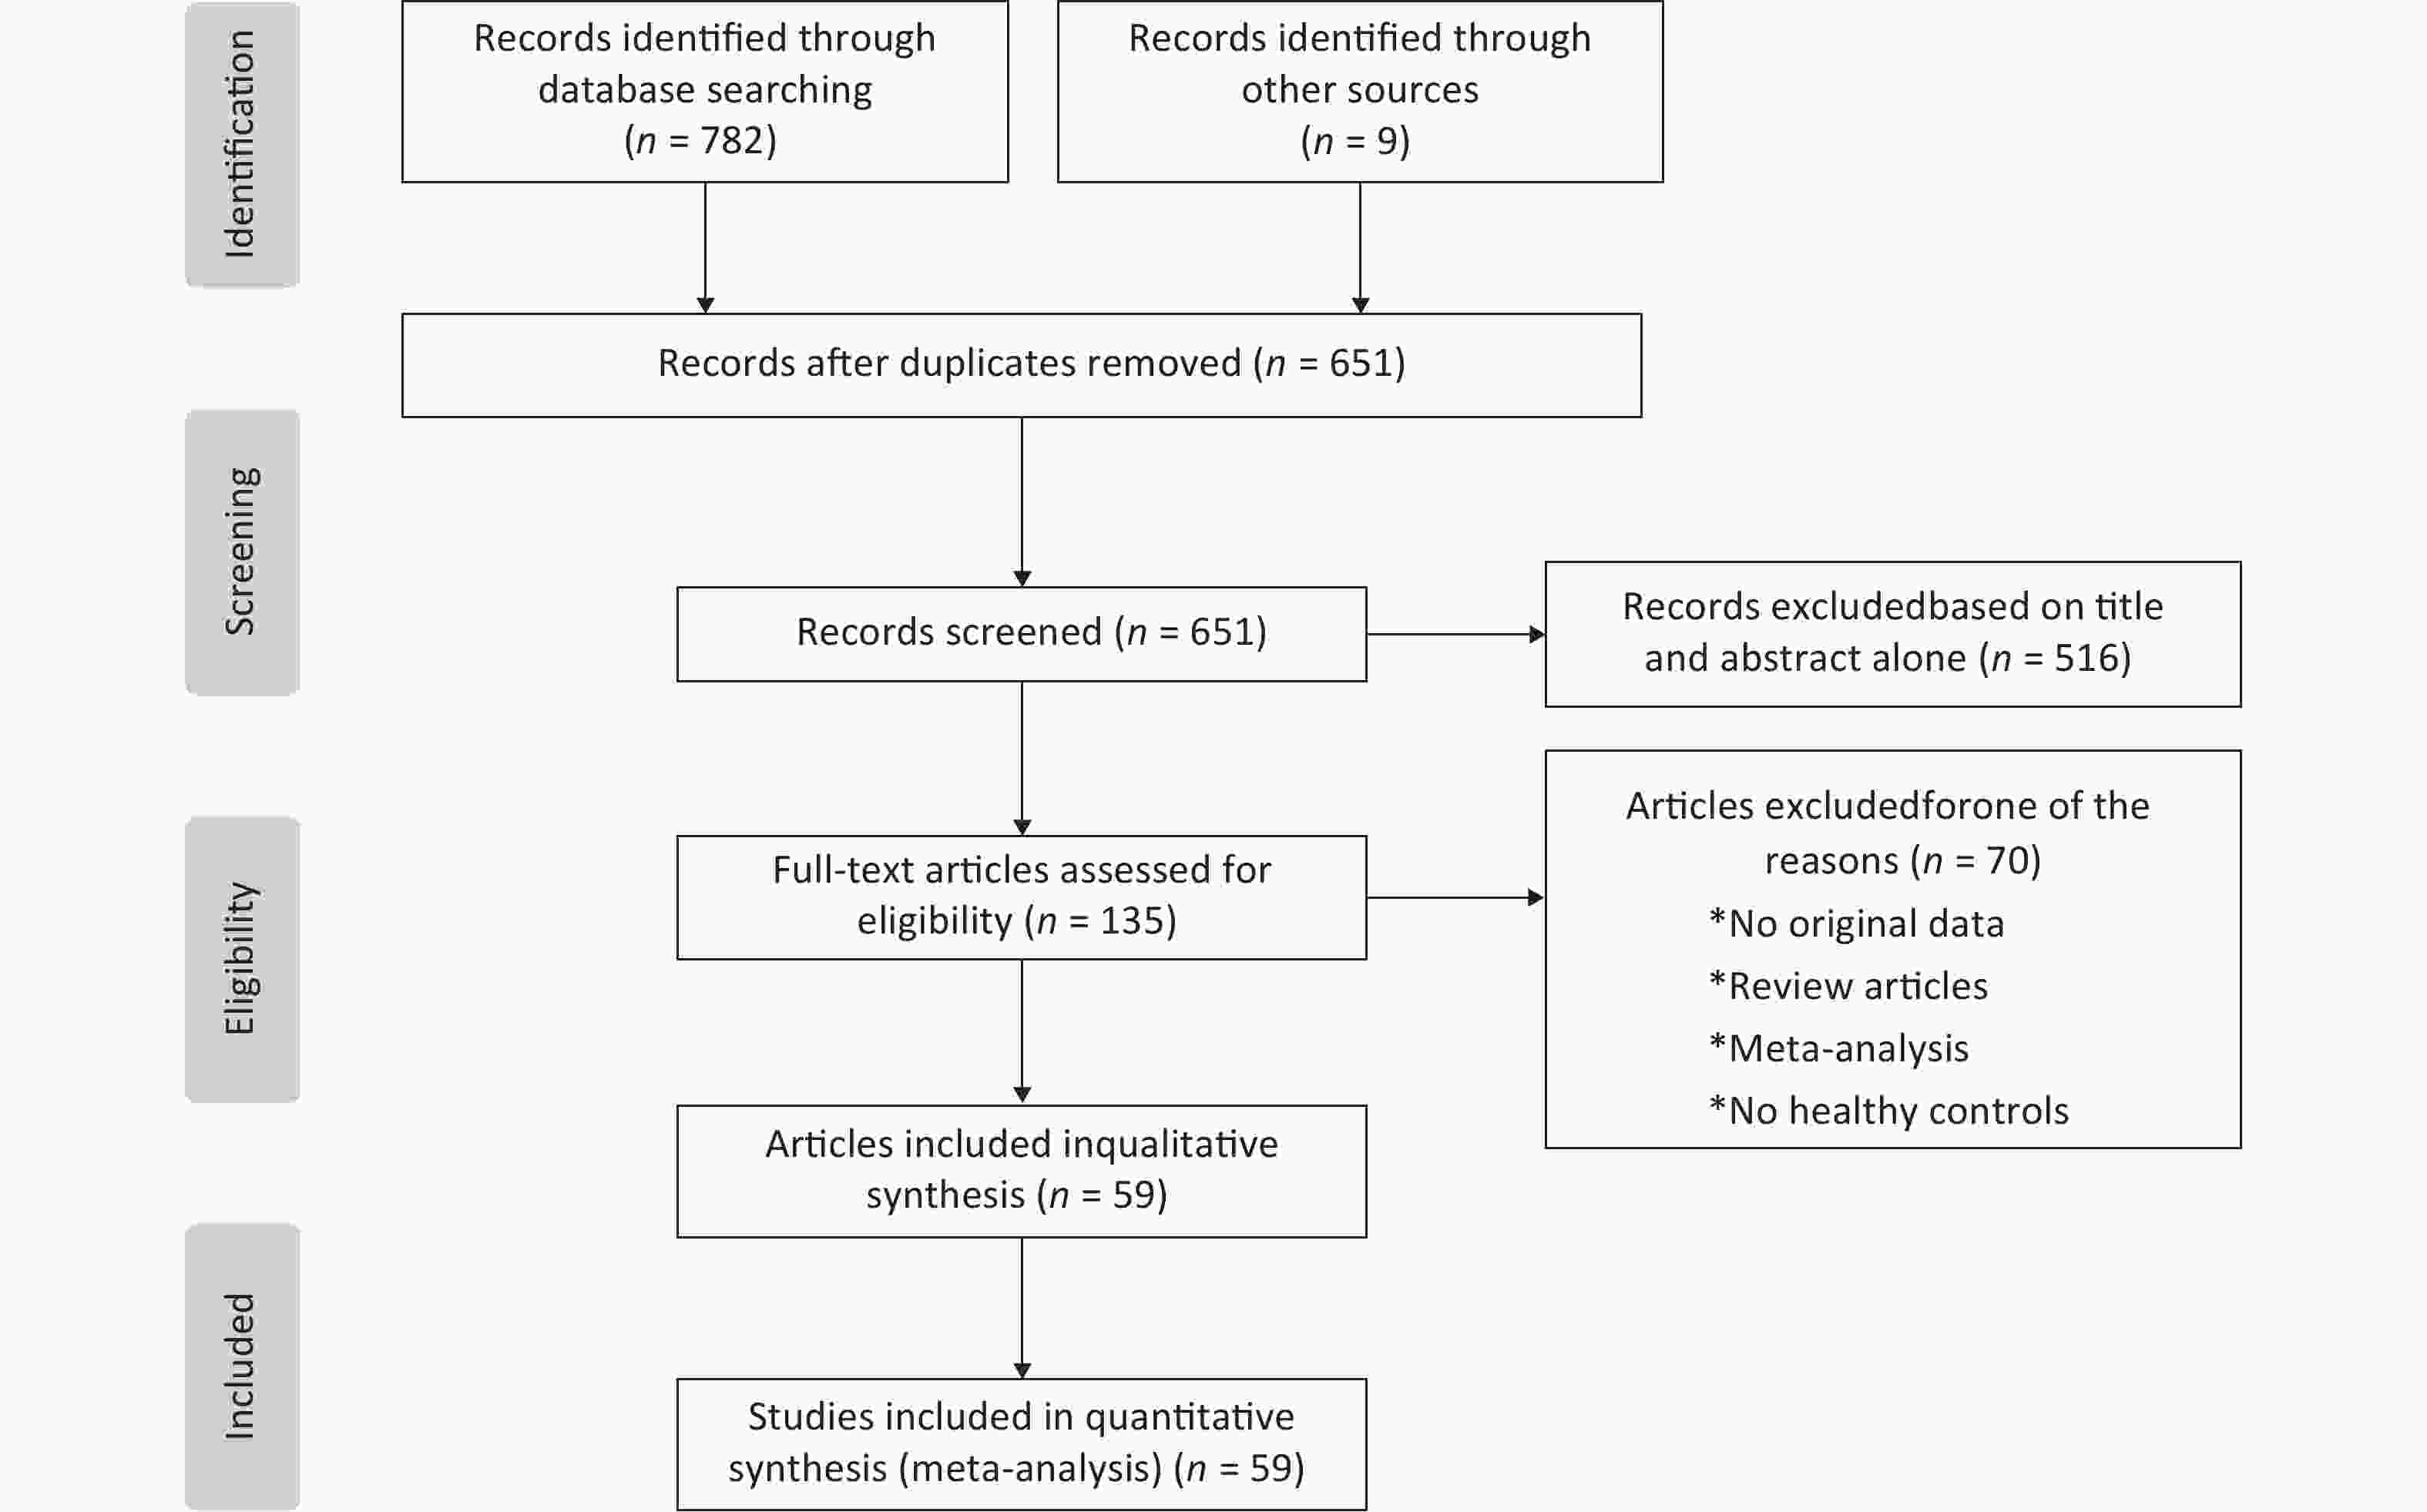
Figure 1. Flow chart of the process for literature identification and selection
Study Year Region Ethnicity Genotyping method Sample
size (case/
control)Quality
scoreHWE Y/N(P) ε2/ε2(n)+
ε2/ε3(n)ε2/ε4(n)+
ε3/ε3(n)ε3/ε4(n)+
ε4/ε4(n)case control case control case control Singh[36] 2006 India Asian PCR-RELP 90/97 9 Y(0.184) 1+4 1+7 2+78 0+74 5+0 13+2 Al-Majed[16] 2011 Kuwait Other PCR-RELP 105/62 6 N(0.006) 7+2 2+3 2+73 2+46 6+15 9+1 Chaudhary[9] 2012 Bangkok Other PCR-RELP 155/149 8 Y(0.121) 1+2 2+12 1+117 0+113 30+4 21+1 Errera[37] 2006 Brazil Other PCR-RELP 95/107 7 Y(0.584) 0+13 0+7 2+68 0+77 12+0 23+0 Alharbi[17] 2014 Riyadh Other TaqMan 438/460 7 N(< 0.001) 35+26 27+18 13+290 11+334 35+39 60+10 Inamdar[38] 2000 India Asian Flat gel isoelectric focusing 60/40 8 Y(0.054) 2+8 1+9 3+17 2+10 16+14 8+10 Kwon[39] 2007 Korea Asian PCR-RELP 94/88 7 Y(0.924) 0+13 0+5 3+63 0+70 14+1 12+1 Atta[18] 2016 Egypt Other PCR-RELP 45/45 5 Y(0.098) 0+12 0+3 12+12 3+30 9+0 9+0 Vauhkonen[40] 1997 Finland Caucasian PCR-RELP 86/125 8 Y(0.963) 0+7 0+9 3+48 2+76 20+8 33+5 Erdogan[19] 2009 Turkey Caucasian PCR-RELP 56/35 7 N(< 0.001) 0+4 0+0 0+40 0+28 12+0 7+0 Eto[41] 1986 Japan Asian Flat gel isoelectric focusing 105/111 8 Y(0.339) 0+9 1+10 0+73 1+80 21+2 16+3 Guan[42] 2009 China Asian PCR-LDR 213/111 7 Y(0.499) 8+32 1+32 7+141 1+88 24+1 9+1 Leiva[43] 2005 Chile Other PCR-RELP 193/139 7 Y(0.293) 0+12 0+10 4+133 3+87 43+1 39+0 Liu[44] 2003 China Asian PCR-RELP 80/81 7 Y(0.217) 0+11 0+4 1+56 2+64 12+0 11+0 Mehmet[20] 2015 Turkey Caucasian PCR-RELP 100/50 8 N(0.039) 0+6 0+22 0+81 0+19 13+0 9+0 Xie[45] 2011 China Asian PCR-RELP 60/20 7 Y(0.936) 0+13 1+3 4+8 2+8 19+16 5+1 Mustapic[21] 2012 Croatia Caucasian TaqMan 196/456 6 Y(0.331) 0+35 1+48 2+127 2+328 30+2 76+1 Santos[46] 2002 Mexico Other PCR-RELP 36/22 8 Y(0.423) 0+0 1+2 0+32 1+10 3+1 8+0 Kamboh[47] 1995 USA Caucasian IEF-immunoblottin and PCR 116/659 6 Y(0.992) 0+23 6+88 5+62 19+382 26+0 150+14 Ng[48] 2016 China Asian Other 386/200 6 Y(0.168) 4+53 1+32 5+282 6+142 39+3 19+0 Eto[49] 1995 Japan Asian Flat gel isoelectric focusing 281/576 8 Y(0.609) 1+25 2+35 1+192 4+414 55+7 111+10 Morbois Trabut[50] 2006 France Caucasian PCR-RELP 210/481 7 Y(0.773) 2+31 5+71 1+143 14+294 33+0 87+10 Powell[51] 2003 UK Caucasian PCR-RELP 187/102 7 Y(0.094) 3+22 2+7 3+89 1+57 27+3 21+0 Guangda[52] 1999 China Asian PCR-RELP 89/72 7 Y(0.122) 1+13 1+7 1+66 2+53 7+1 7+2 Zhang[53] 2000 China Asian PCR-RELP 63/71 8 N(0.009) 0+7 0+5 0+50 3+56 6+0 6+0 Zhang[54] 2003 China Asian PCR-RELP 74/191 8 Y(0.878) 0+5 1+23 1+55 1+134 12+1 31+1 Sun[55] 2013 China Asian PCR-RELP 243/78 7 Y(0.414) 6+36 2+12 0+180 1+55 21+0 6+1 Hua[56] 2006 China Asian PCR-RELP 50/60 8 Y(0.190) 2+4 0+7 4+68 2+75 20+2 13+3 Guo[57] 2003 China Asian PCR-RELP 40/52 7 Y(0.739) 0+4 0+5 2+23 1+39 9+2 6+1 Liang[23] 2017 China Asian PCR-RELP 44/374 6 Y(0.816) 1+3 5+57 1+31 6+267 7+1 38+1 Shen[58] 2002 China Asian PCR-RELP 106/110 7 Y(0.577) 1+7 1+12 2+84 4+74 11+1 18+1 Zheng[59] 1998 China Asian PCR-RELP 112/60 8 Y(0.801) 2+16 1+8 1+81 0+45 11+1 6+0 Hua[60] 2004 China Asian PCR-RELP 38/60 7 Y(0.434) 1+7 0+4 2+24 1+45 4+0 8+2 Liu[24] 2014 China Asian PCR-RELP 215/298 7 N(< 0.001)) 10+0 2+0 0+174 0+272 31+0 23+1 Xiang[61] 1995 China Asian PCR-RELP 125/50 7 Y(0.715) 2+16 0+4 0+78 1+38 26+3 6+1 Chen[25] 2006 China Asian PCR-RELP 97/105 7 Y(0.906) 2+15 1+18 1+70 2+72 8+1 10+1 Xiang[62] 1999 China Asian PCR-ASO 130/50 8 Y(0.715) 3+14 0+4 1+85 1+38 24+3 6+1 Shen[63] 2002 China Asian PCR-RELP 35/50 6 Y(0.112) 3+11 0+6 2+4 4+31 14+0 9+0 Xiong[26] 2013 China Asian PCR-RELP 121/112 8 Y(0.991) 0+15 1+13 1+72 2+72 31+2 22+2 Zhou[64] 2005 China Asian PCR-RELP 67/68 7 Y(0.263) 0+13 2+9 1+47 0+46 6+0 11+0 Xiang[65] 2005 China Asian PCR-ASO 101/95 7 Y(0.438) 1+10 1+10 1+65 1+65 20+4 15+3 Long[66] 1999 China Asian PCR-RELP 67/135 7 Y(0.124) 0+15 0+18 3+36 4+101 12+1 12+0 Liang[67] 2005 China Asian PCR-RELP 145/90 8 Y(0.592) 0+17 0+12 6+102 2+68 18+2 8+0 Gu[68] 2004 China Asian PCR-RELP 63/90 8 Y(0.592) 0+9 0+12 3+43 2+68 7+1 8+0 Yang[69] 1995 China Asian PCR-RELP 125/50 7 N(0.028) 2+16 1+3 0+78 1+38 26+3 5+2 Rong[32] 2013 China Asian PCR-RELP 18/29 7 Y(0.953) 0+4 0+8 0+18 0+29 2+0 1+0 Liu[27] 2016 China Asian PCR-RELP 300/300 8 N(< 0.001) 14+0 2+0 0+243 0+274 43+0 23+1 Tang[28] 2007 China Asian PCR-RELP 41/60 6 Y(0.80) 0+1 0+3 2+28 1+43 10+0 13+0 Qiu[70] 2008 China Asian PCR-RELP 129/110 8 Y(0.481) 0+14 1+18 3+95 2+76 14+3 11+2 Guo[71] 2007 China Asian ARMS-PCR 40/40 6 Y(0.618) 0+1 1+4 3+29 1+27 7+1 7+0 Xiong[72] 2008 China Asian MultiARMS PCR 316/512 6 Y(0.744) 2+18 3+48 6+230 9+359 47+13 87+6 Ge[29] 2013 China Asian PCR-RELP 200/210 7 Y(0.544) 3+35 8+40 2+86 8+103 73+1 47+4 Xiang[73] 2010 China Asian PCR-RELP 41/102 7 Y(0.473) 0+5 0+13 1+28 0+70 7+0 19+0 Luo[30] 2016 China Asian PCR-RELP 35/50 6 N(0.005) 0+3 0+2 1+28 3+38 2+1 7+0 Zhang[74] 2007 China Asian PCR-RELP 38/49 6 N(0.015) 0+2 0+1 0+32 2+39 3+1 7+0 Wang[31] 2014 China Asian PCR-RELP 57/55 8 N(0.027) 0+4 2+7 2+33 4+28 13+5 8+6 Zhang[75] 1999 China Asian PCR-RELP 56/76 5 Y(0.631) 0+3 1+7 1+40 2+55 11+1 11+1 Xiong[76] 2005 China Asian PCR-RELP 32/30 7 Y(0.608) 1+5 0+4 1+22 1+23 2+1 2+0 Dai[77] 2000 China Asian PCR-RELP 32/90 8 Y(0.253) 0+5 0+14 0+23 1+64 3+1 9+2 Note. HWE, Hardy-Weinberg equilibrium. Table 1. Main characteristics of the included studies
Variable OR (95% CI) I2 (%) P ApoE alleles ε2 1.16 (0.98, 1.37) 62 0.079 ε4 1.18 (1.09, 1.28) 36 < 0.001 ApoE genotypes ε2/ε2 1.46 (1.11, 1.93) 0 0.007 ε2/ε3 1.09 (0.90, 1.32) 55 0.397 ε2/ε4 1.15 (0.90, 1.46) 0 0.276 ε3/ε4 1.11 (1.01, 1.22) 39 0.039 ε4/ε4 1.71 (1.33, 2.19) 0 < 0.001 Note. ApoE alleles (ε2 and ε4) and genotypes (ε2/ε2, ε2/ε3, ε2/ε4, ε3/ε4, and ε4/ε4) were compared with ε3 and ε3/ε3. Table 2. Meta-analysis results of association between ApoE polymorphism and type 2 diabetes
-
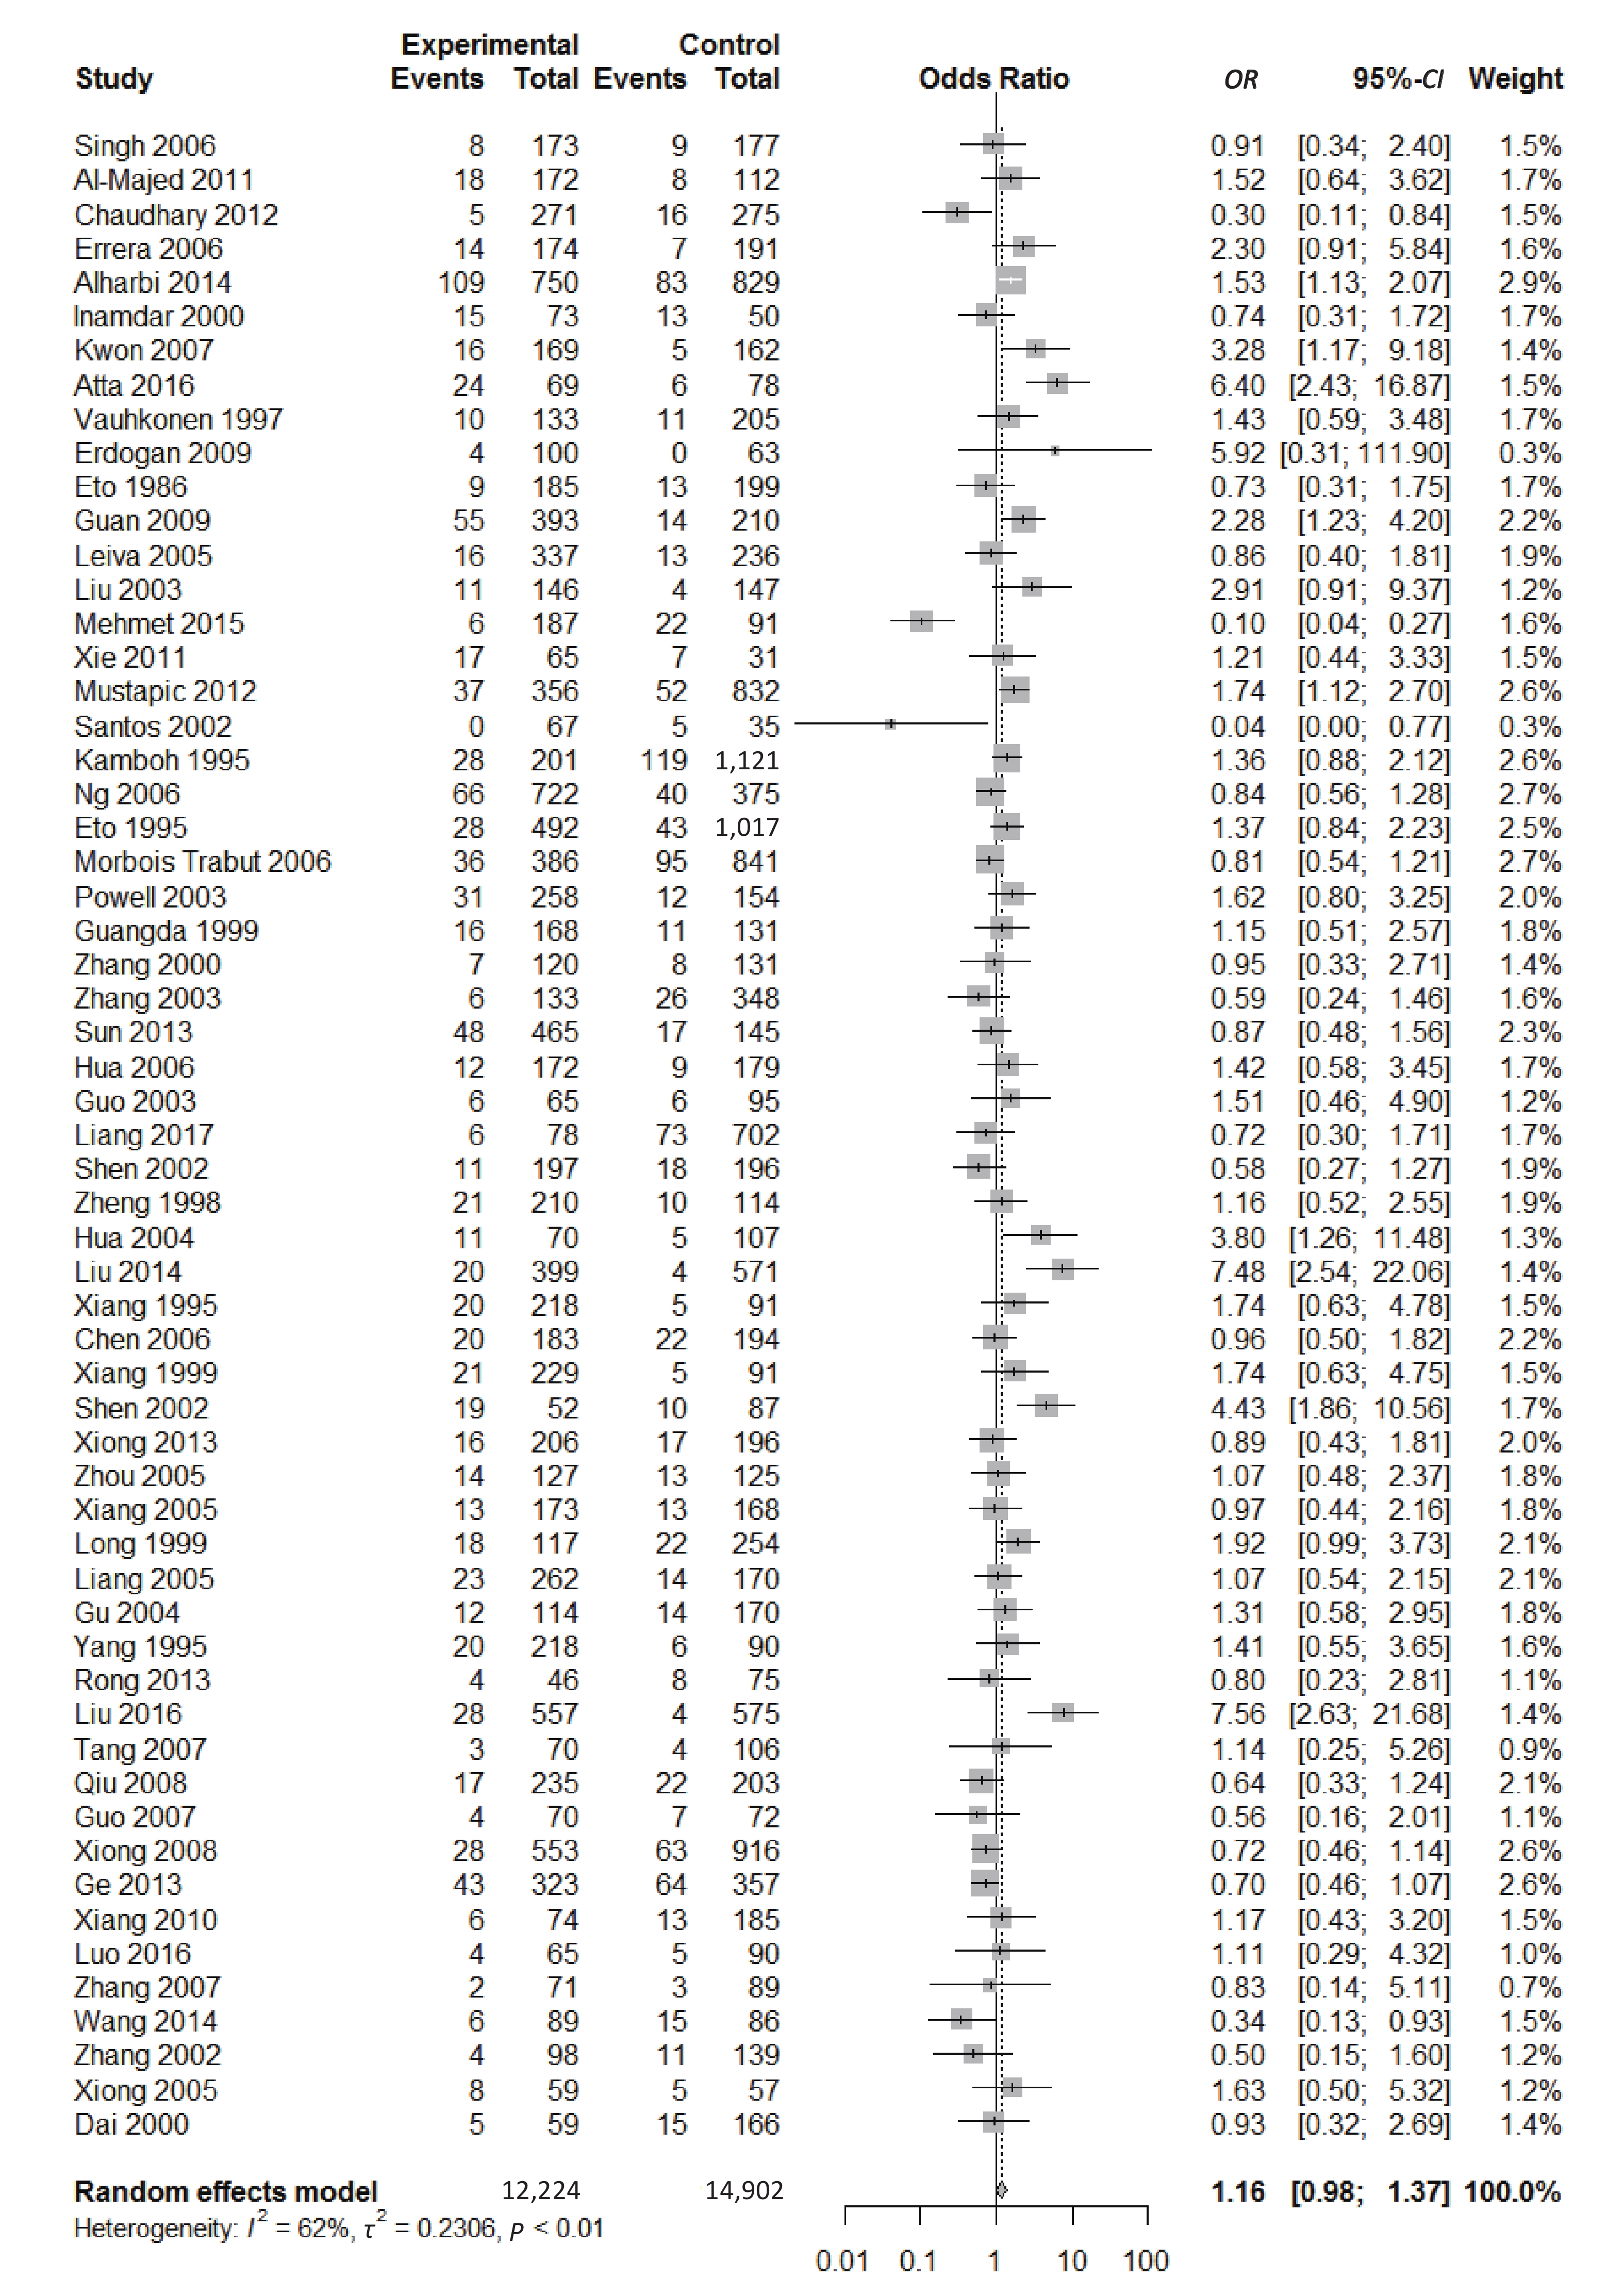
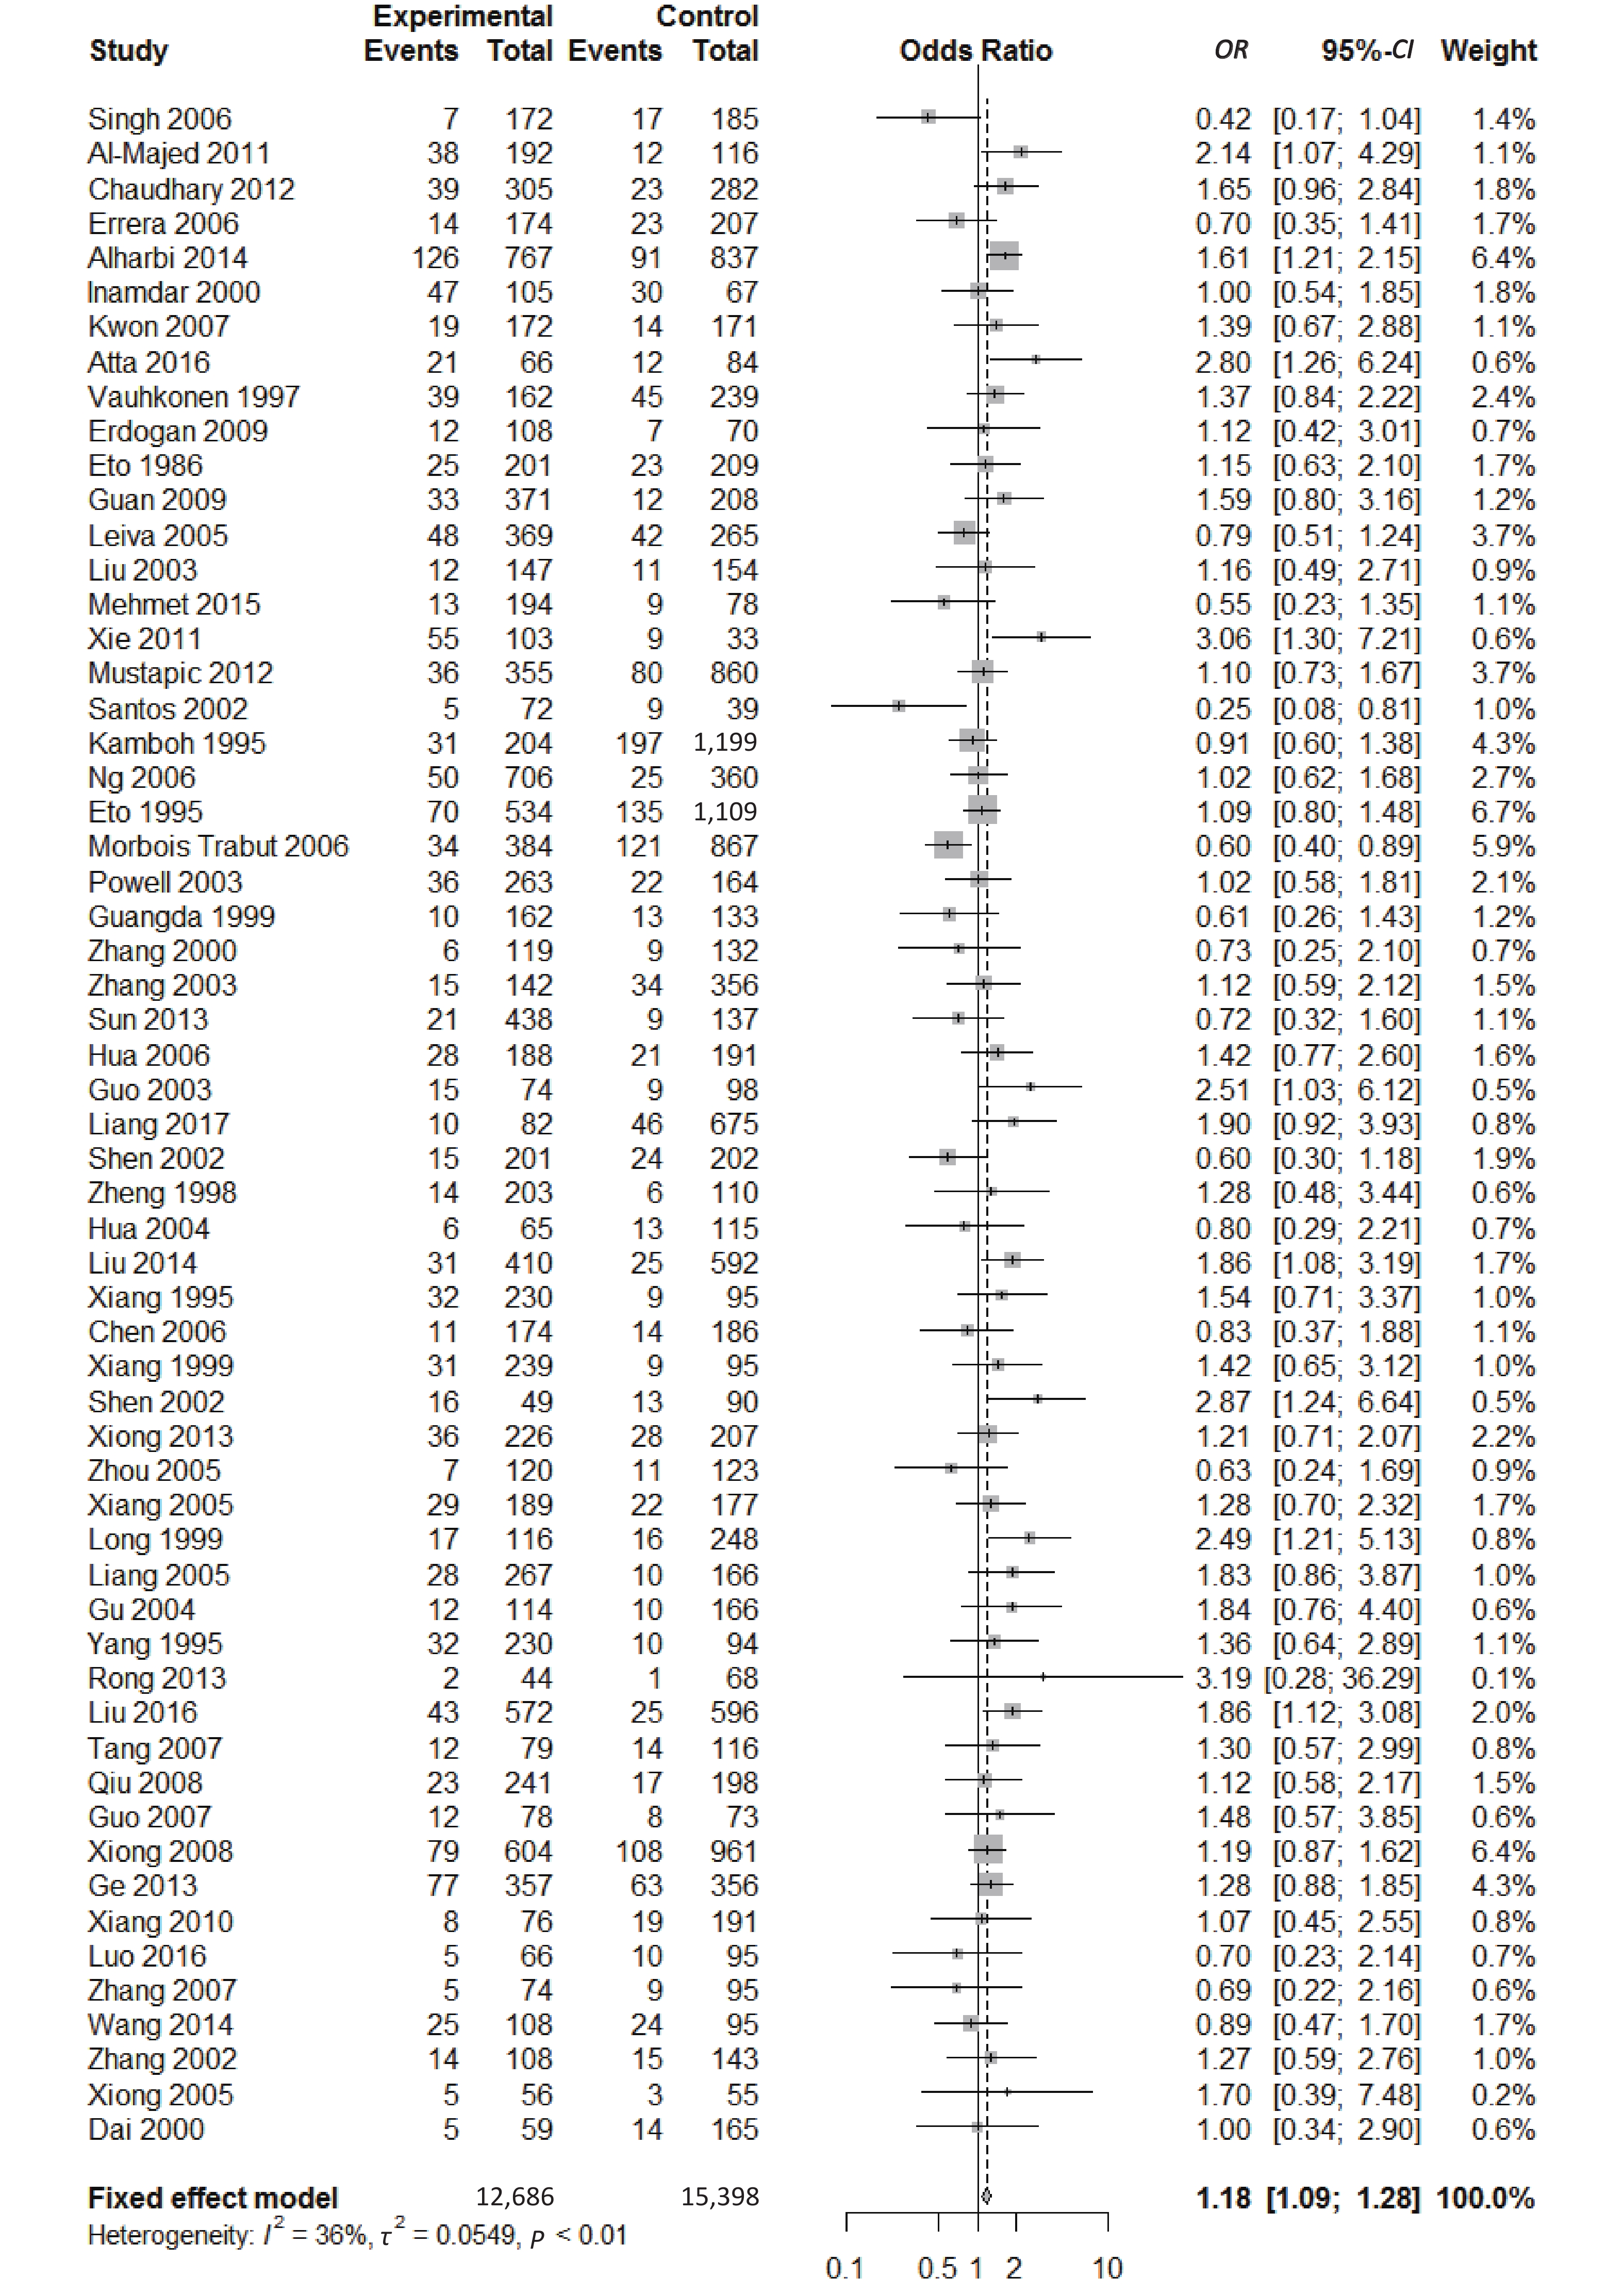
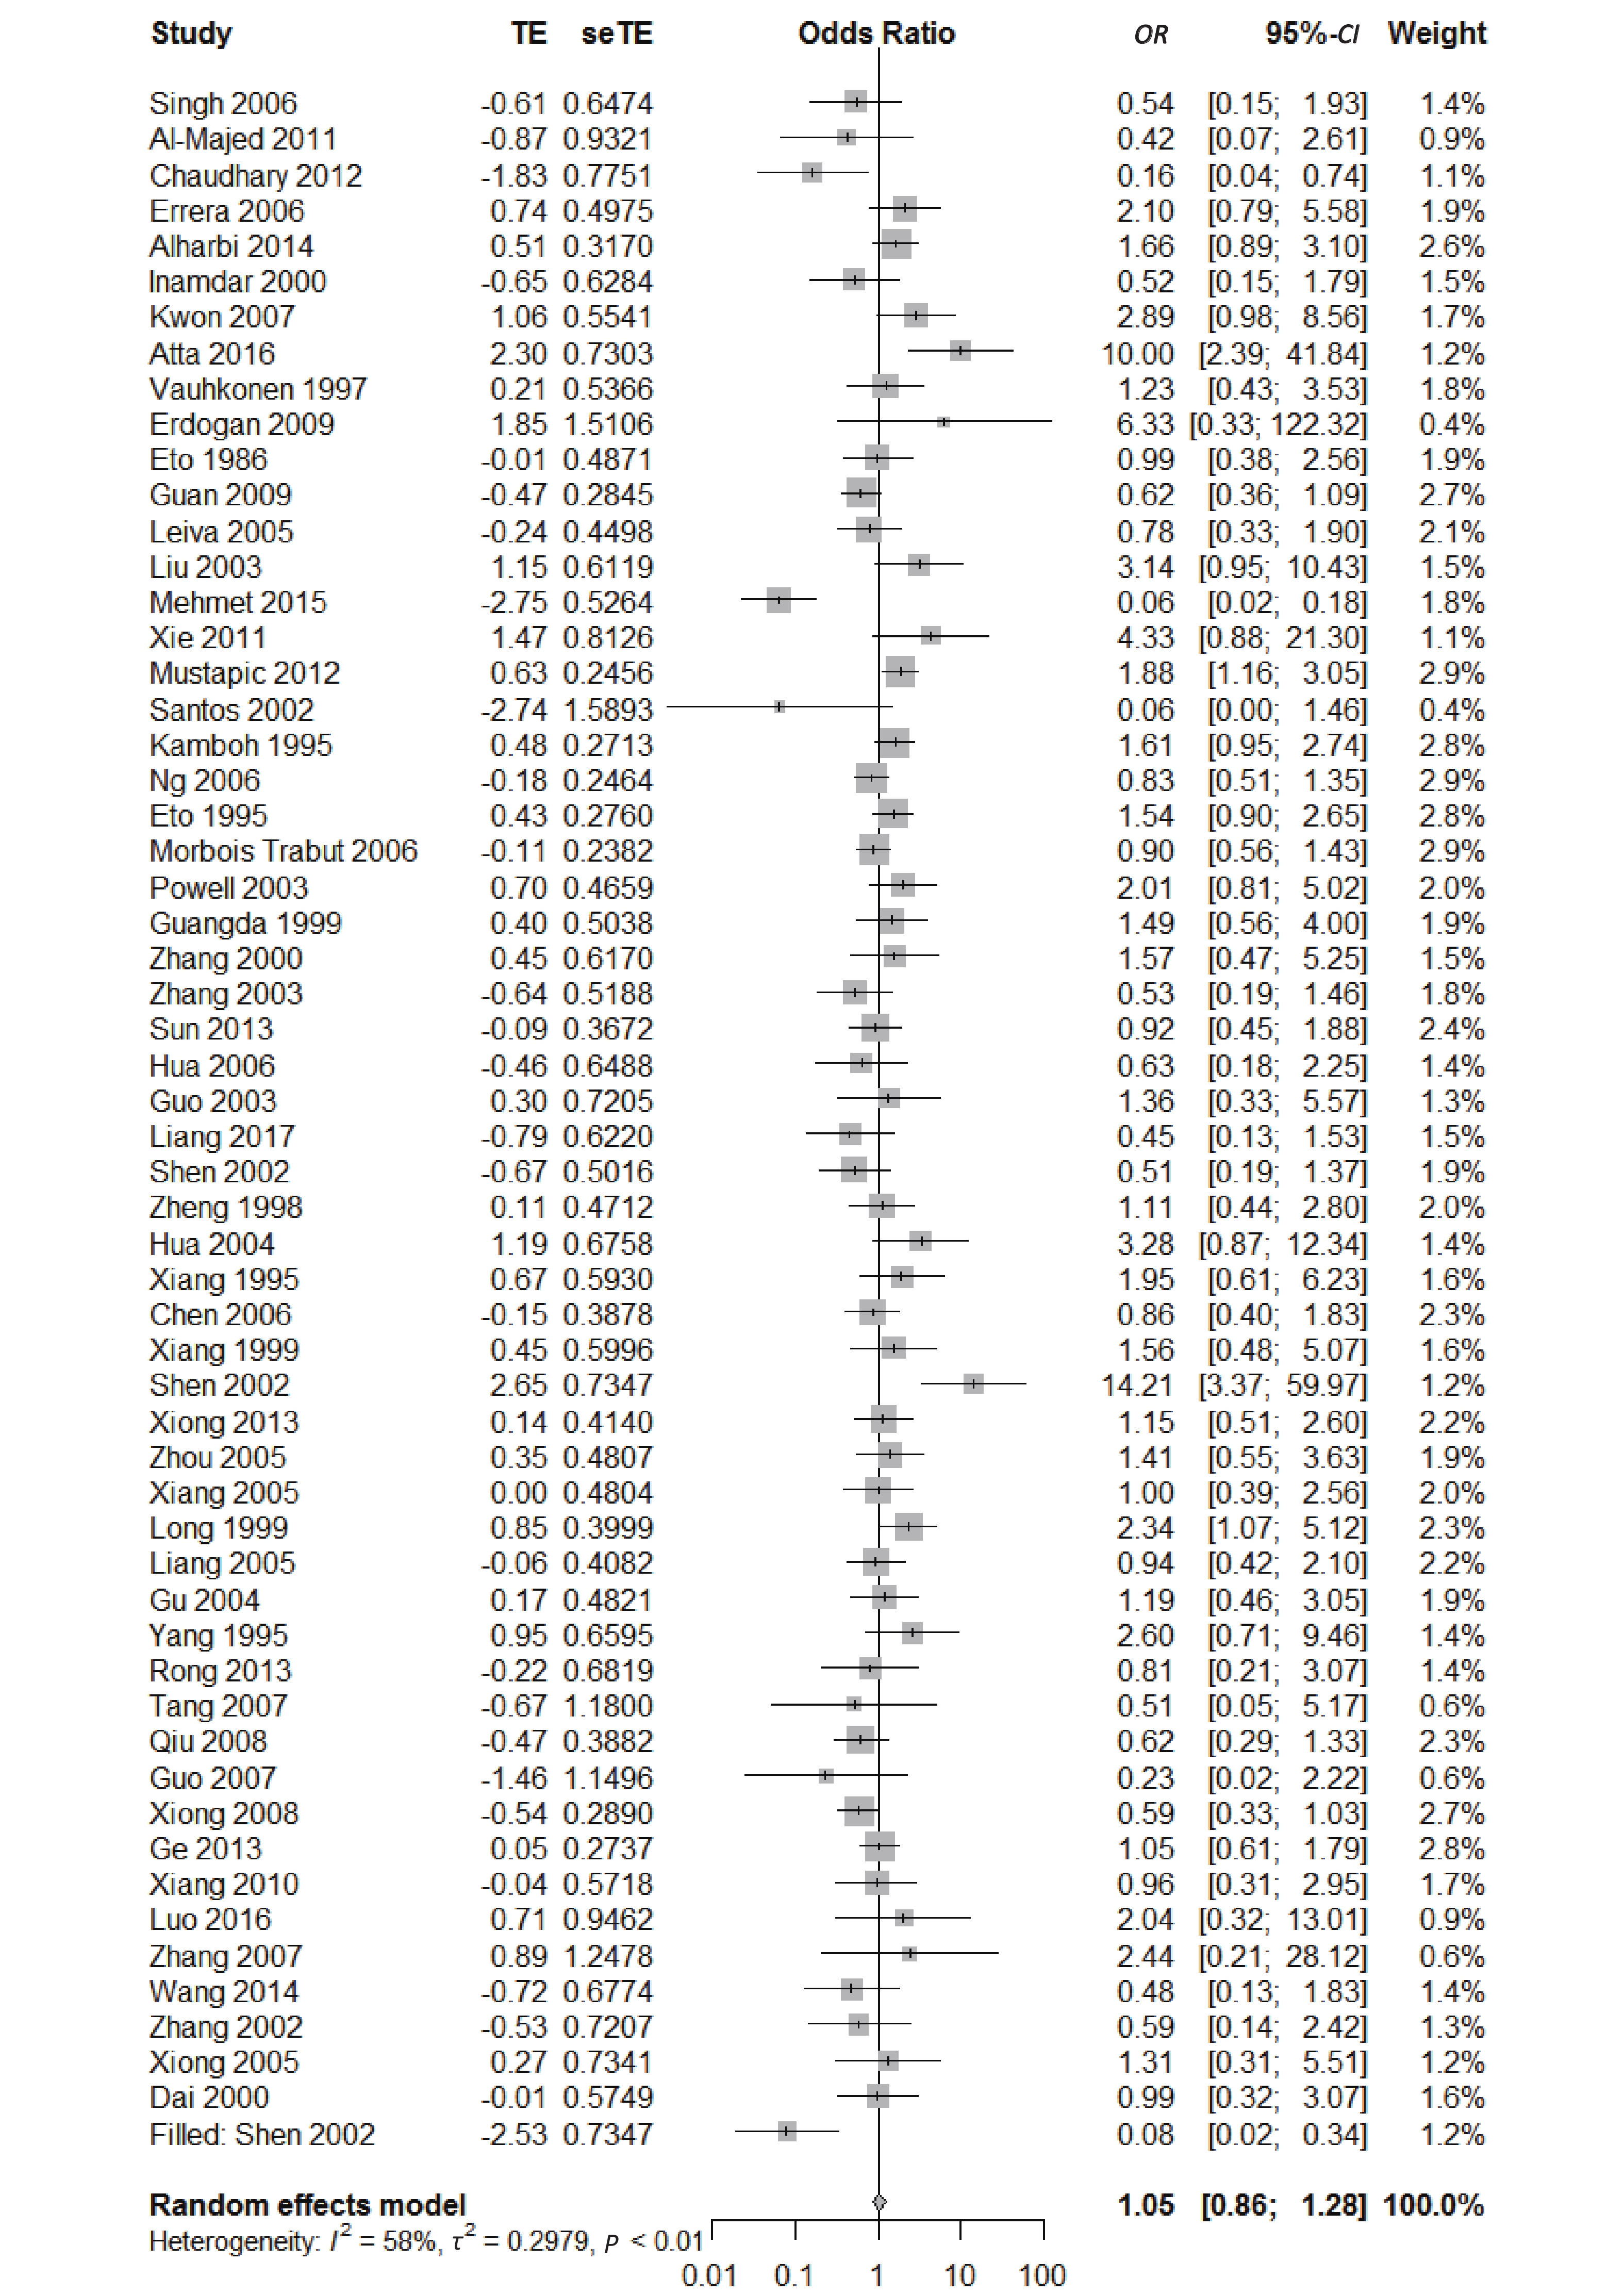
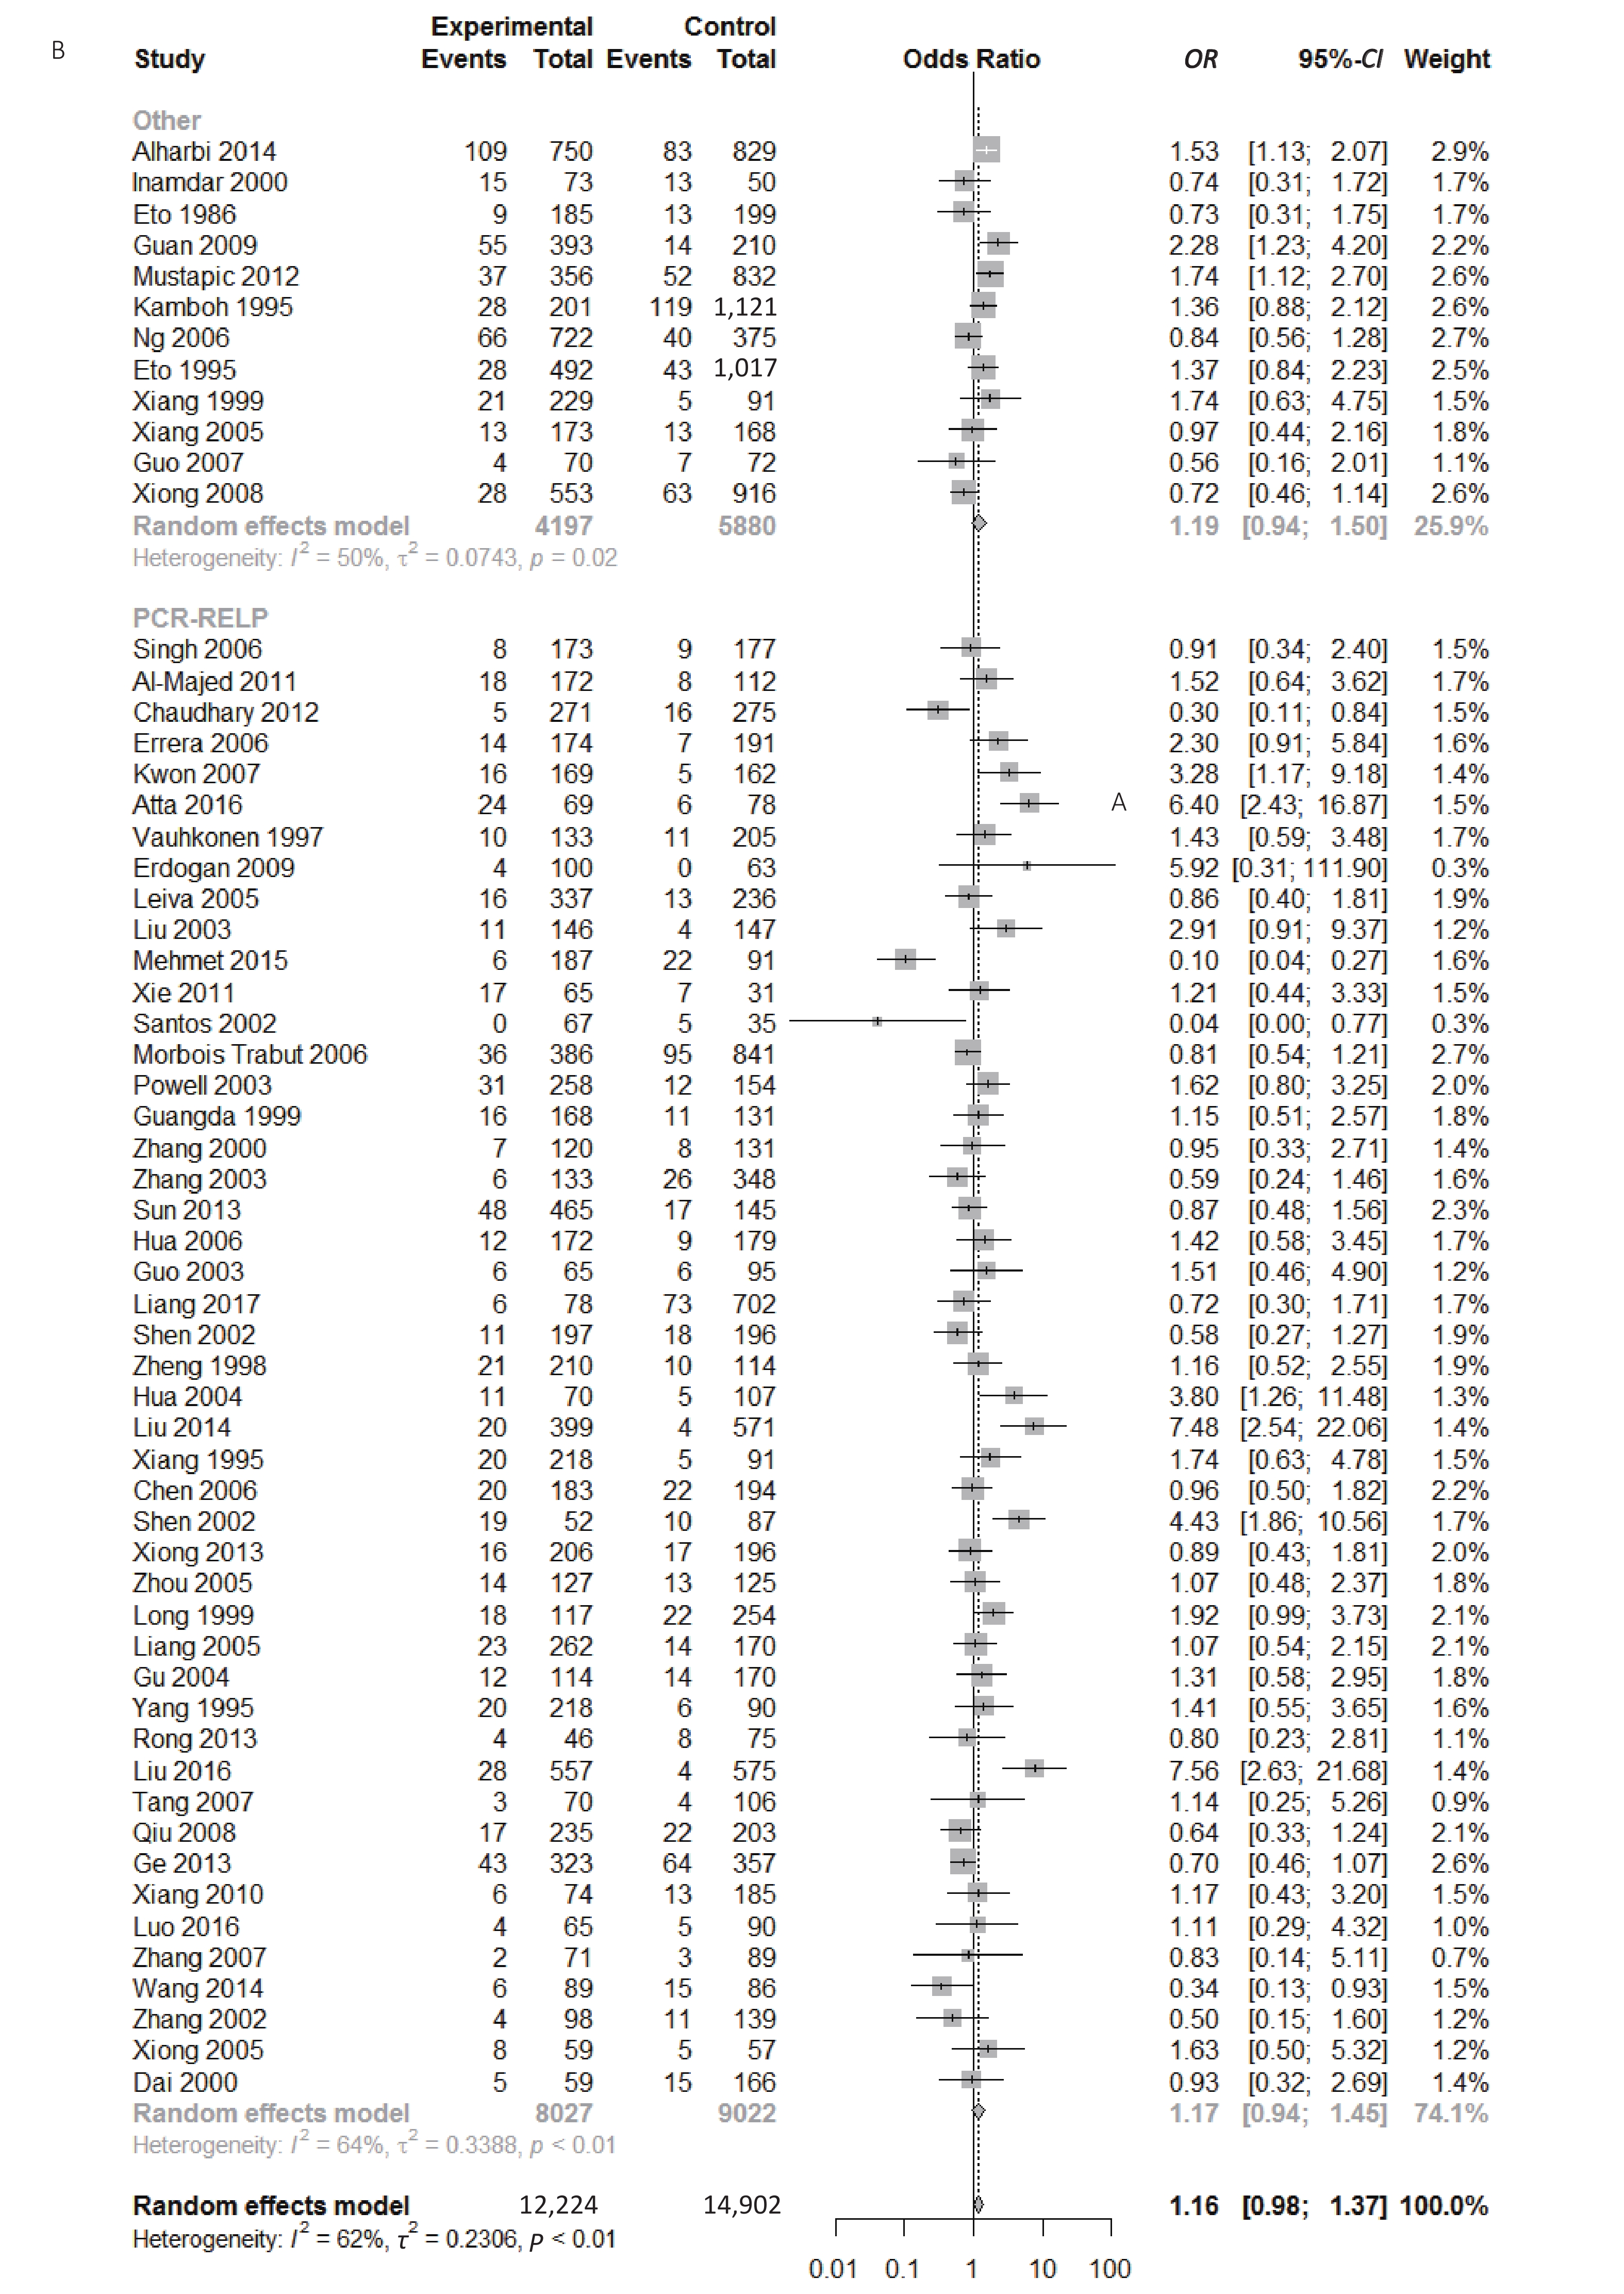
We found a significant heterogeneity when we comparing ApoE ε2 with ε3 allele (I2 = 62%), and had the pooled OR of 1.16 (95% CI: 0.98-1.37; P = 0.079) calculated by the random-effects model (Figure 2); however, there was not heterogeneity in the comparison of ApoE ε4 with ε3 allele (I2 = 36%), and the pooled OR was 1.18 (95% CI: 1.09-1.28; P < 0.001) when the fixed-effects model was applied to compare ApoE ε4 with ε3 (Figure 3), indicating that ApoE ε4 allele may be a risk factor for type 2 diabetes.
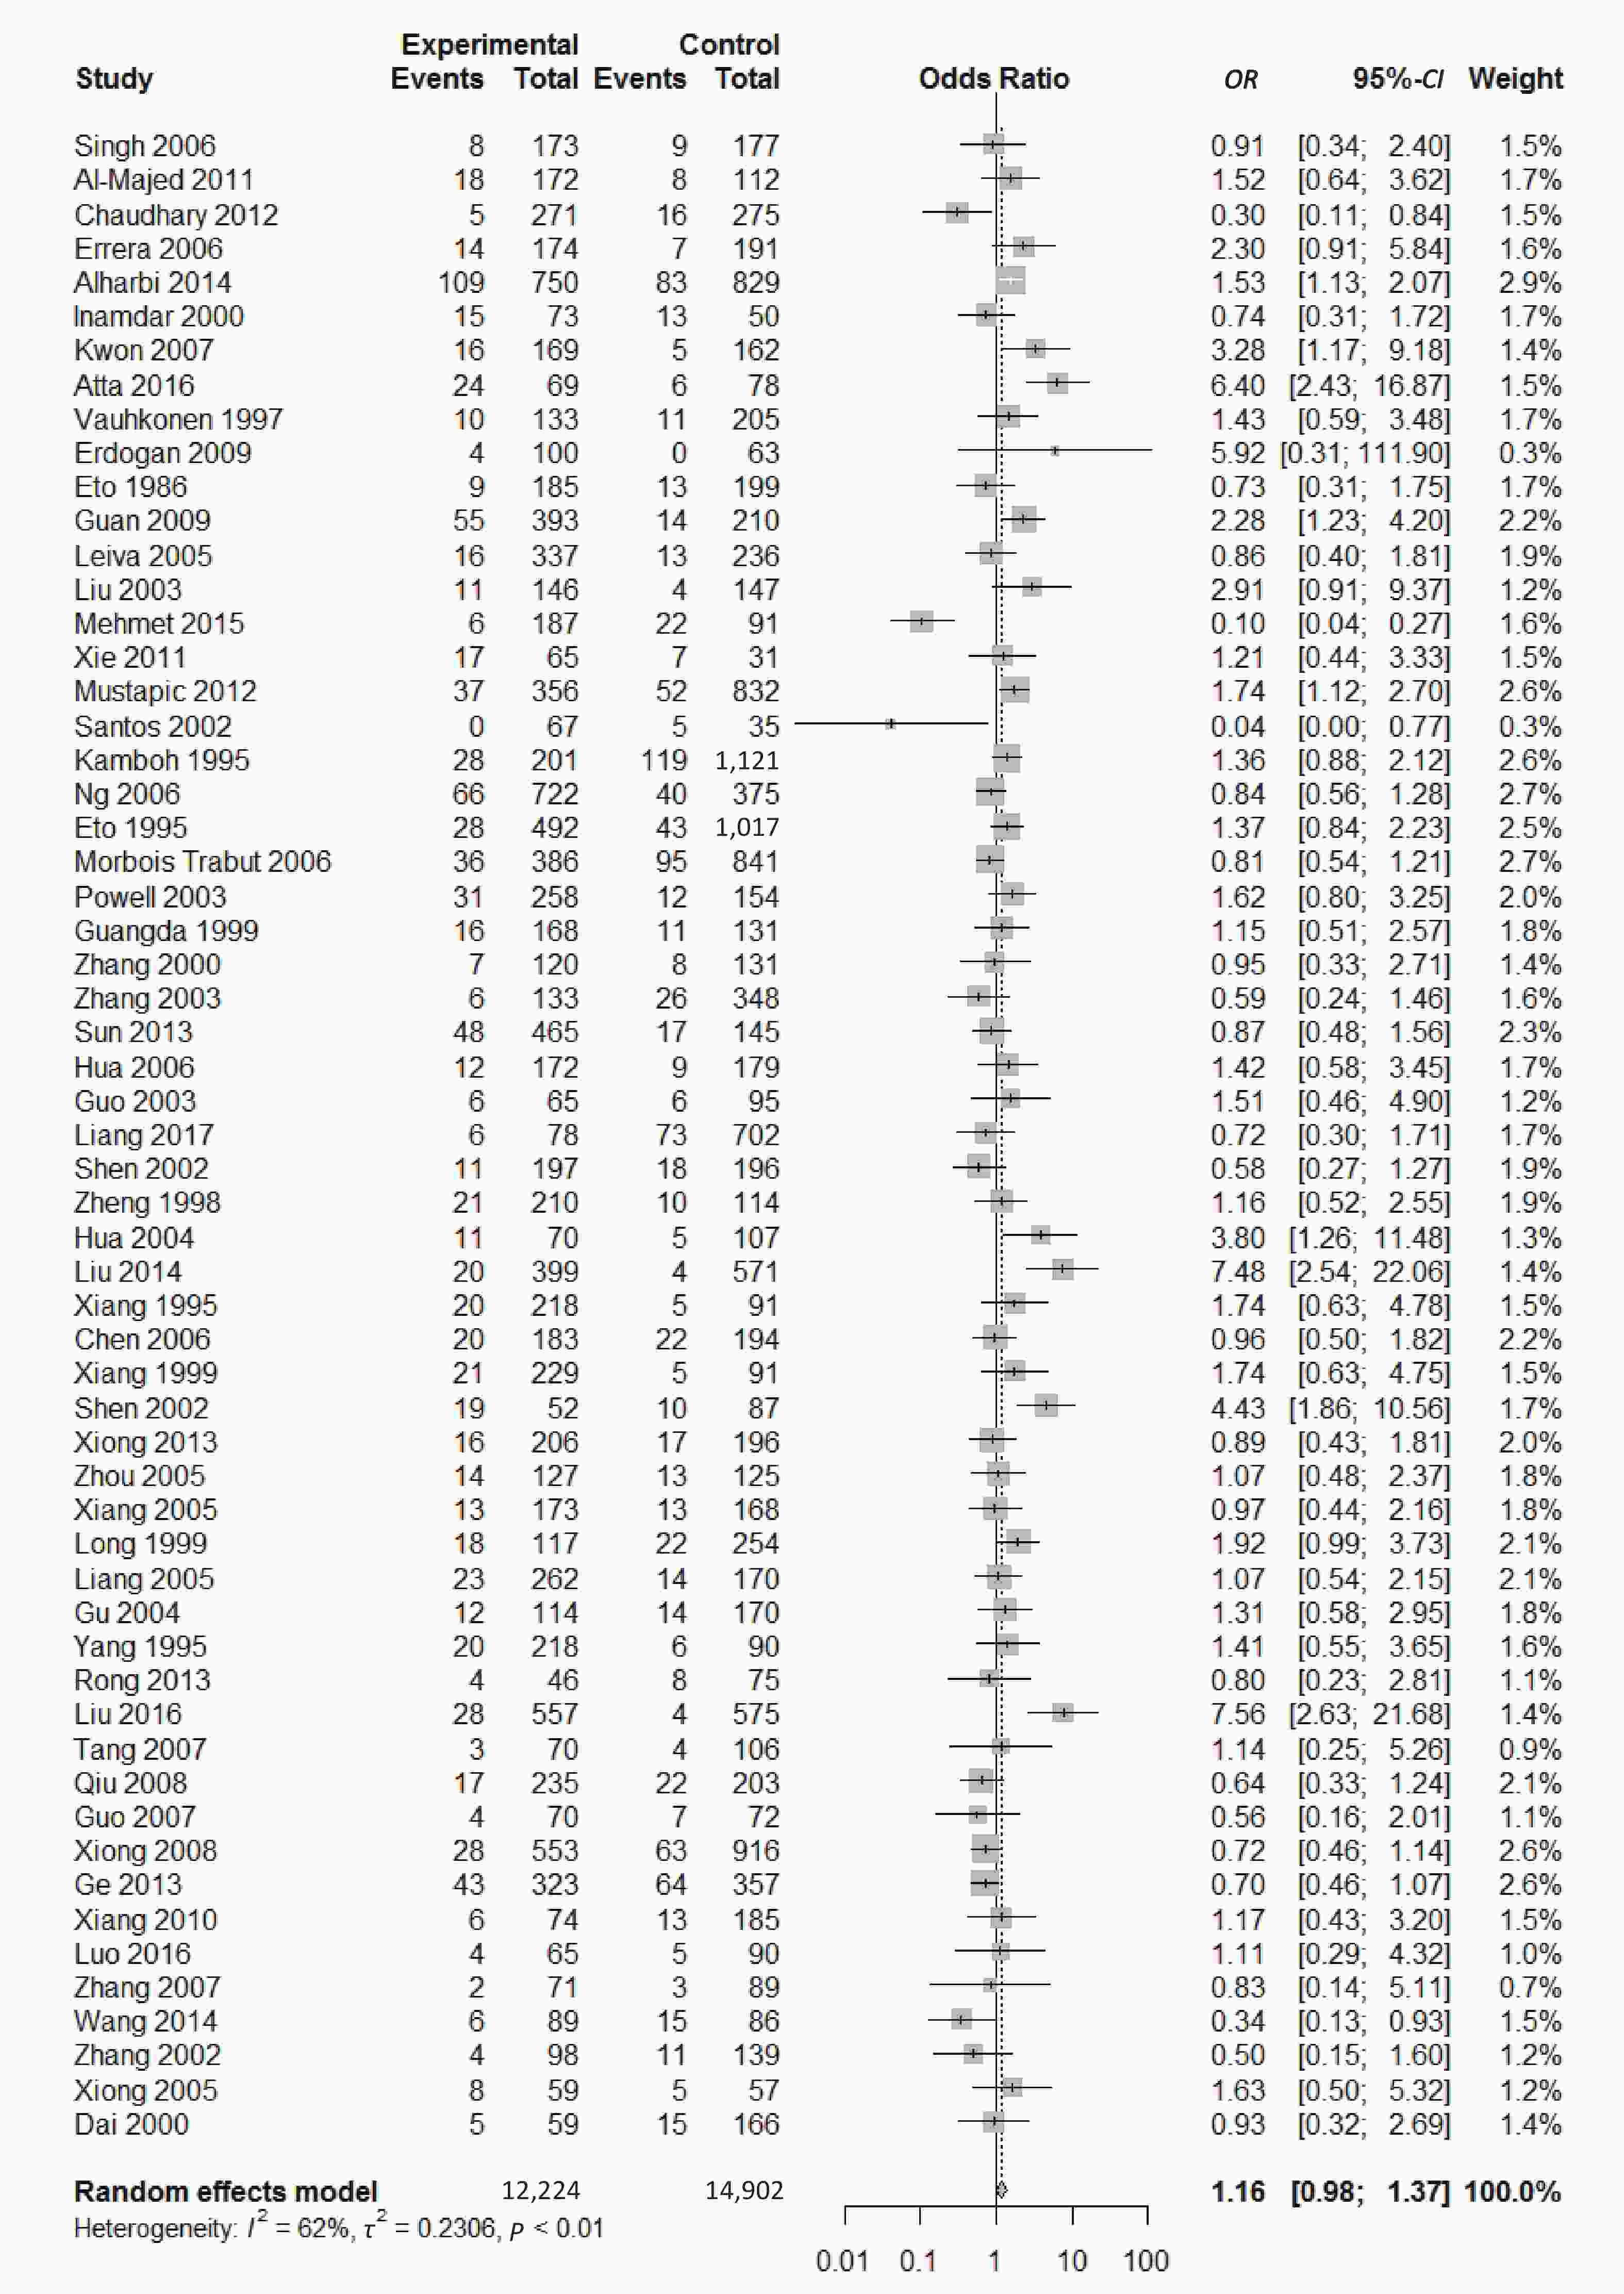
Figure 2. Forest plot for the result of association between type 2 diabetes and ApoE ε2 allele vs. ε3 allele based on a random-effects model.
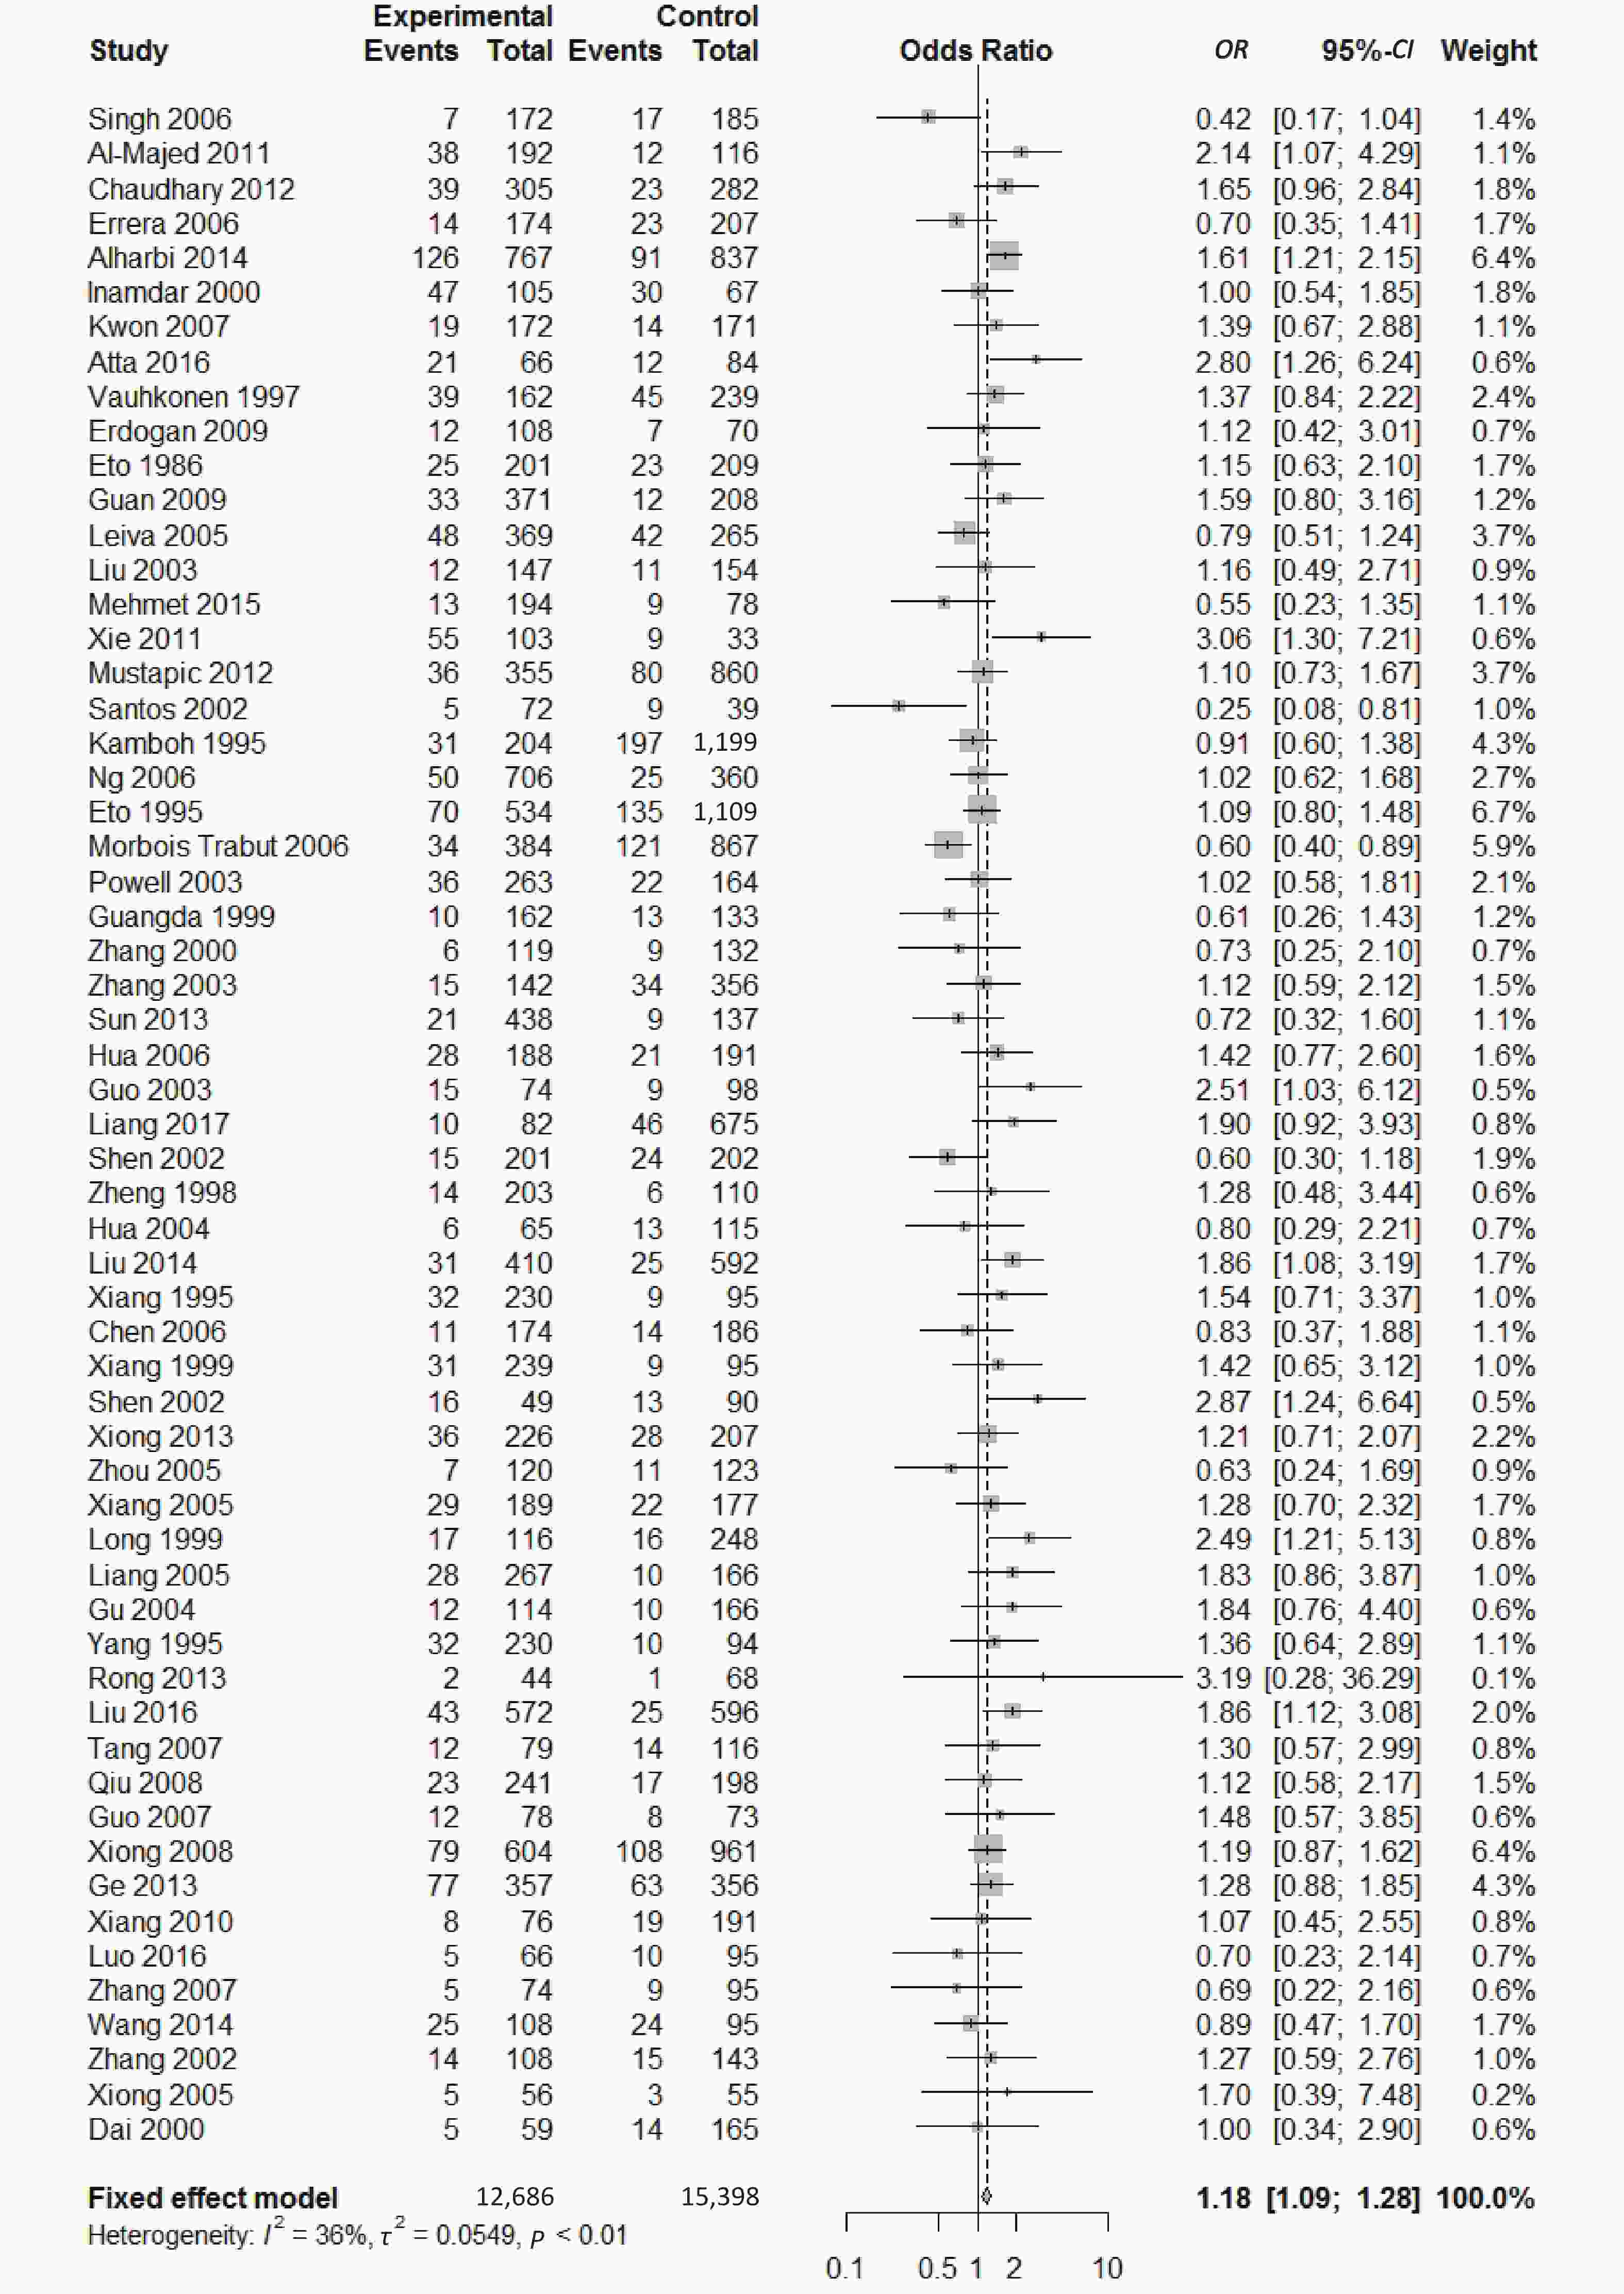
Figure 3. Forest plot for the result of association between type 2 diabetes and ApoE ε4 allele vs. ε3 allele based on a fixed-effects model
-
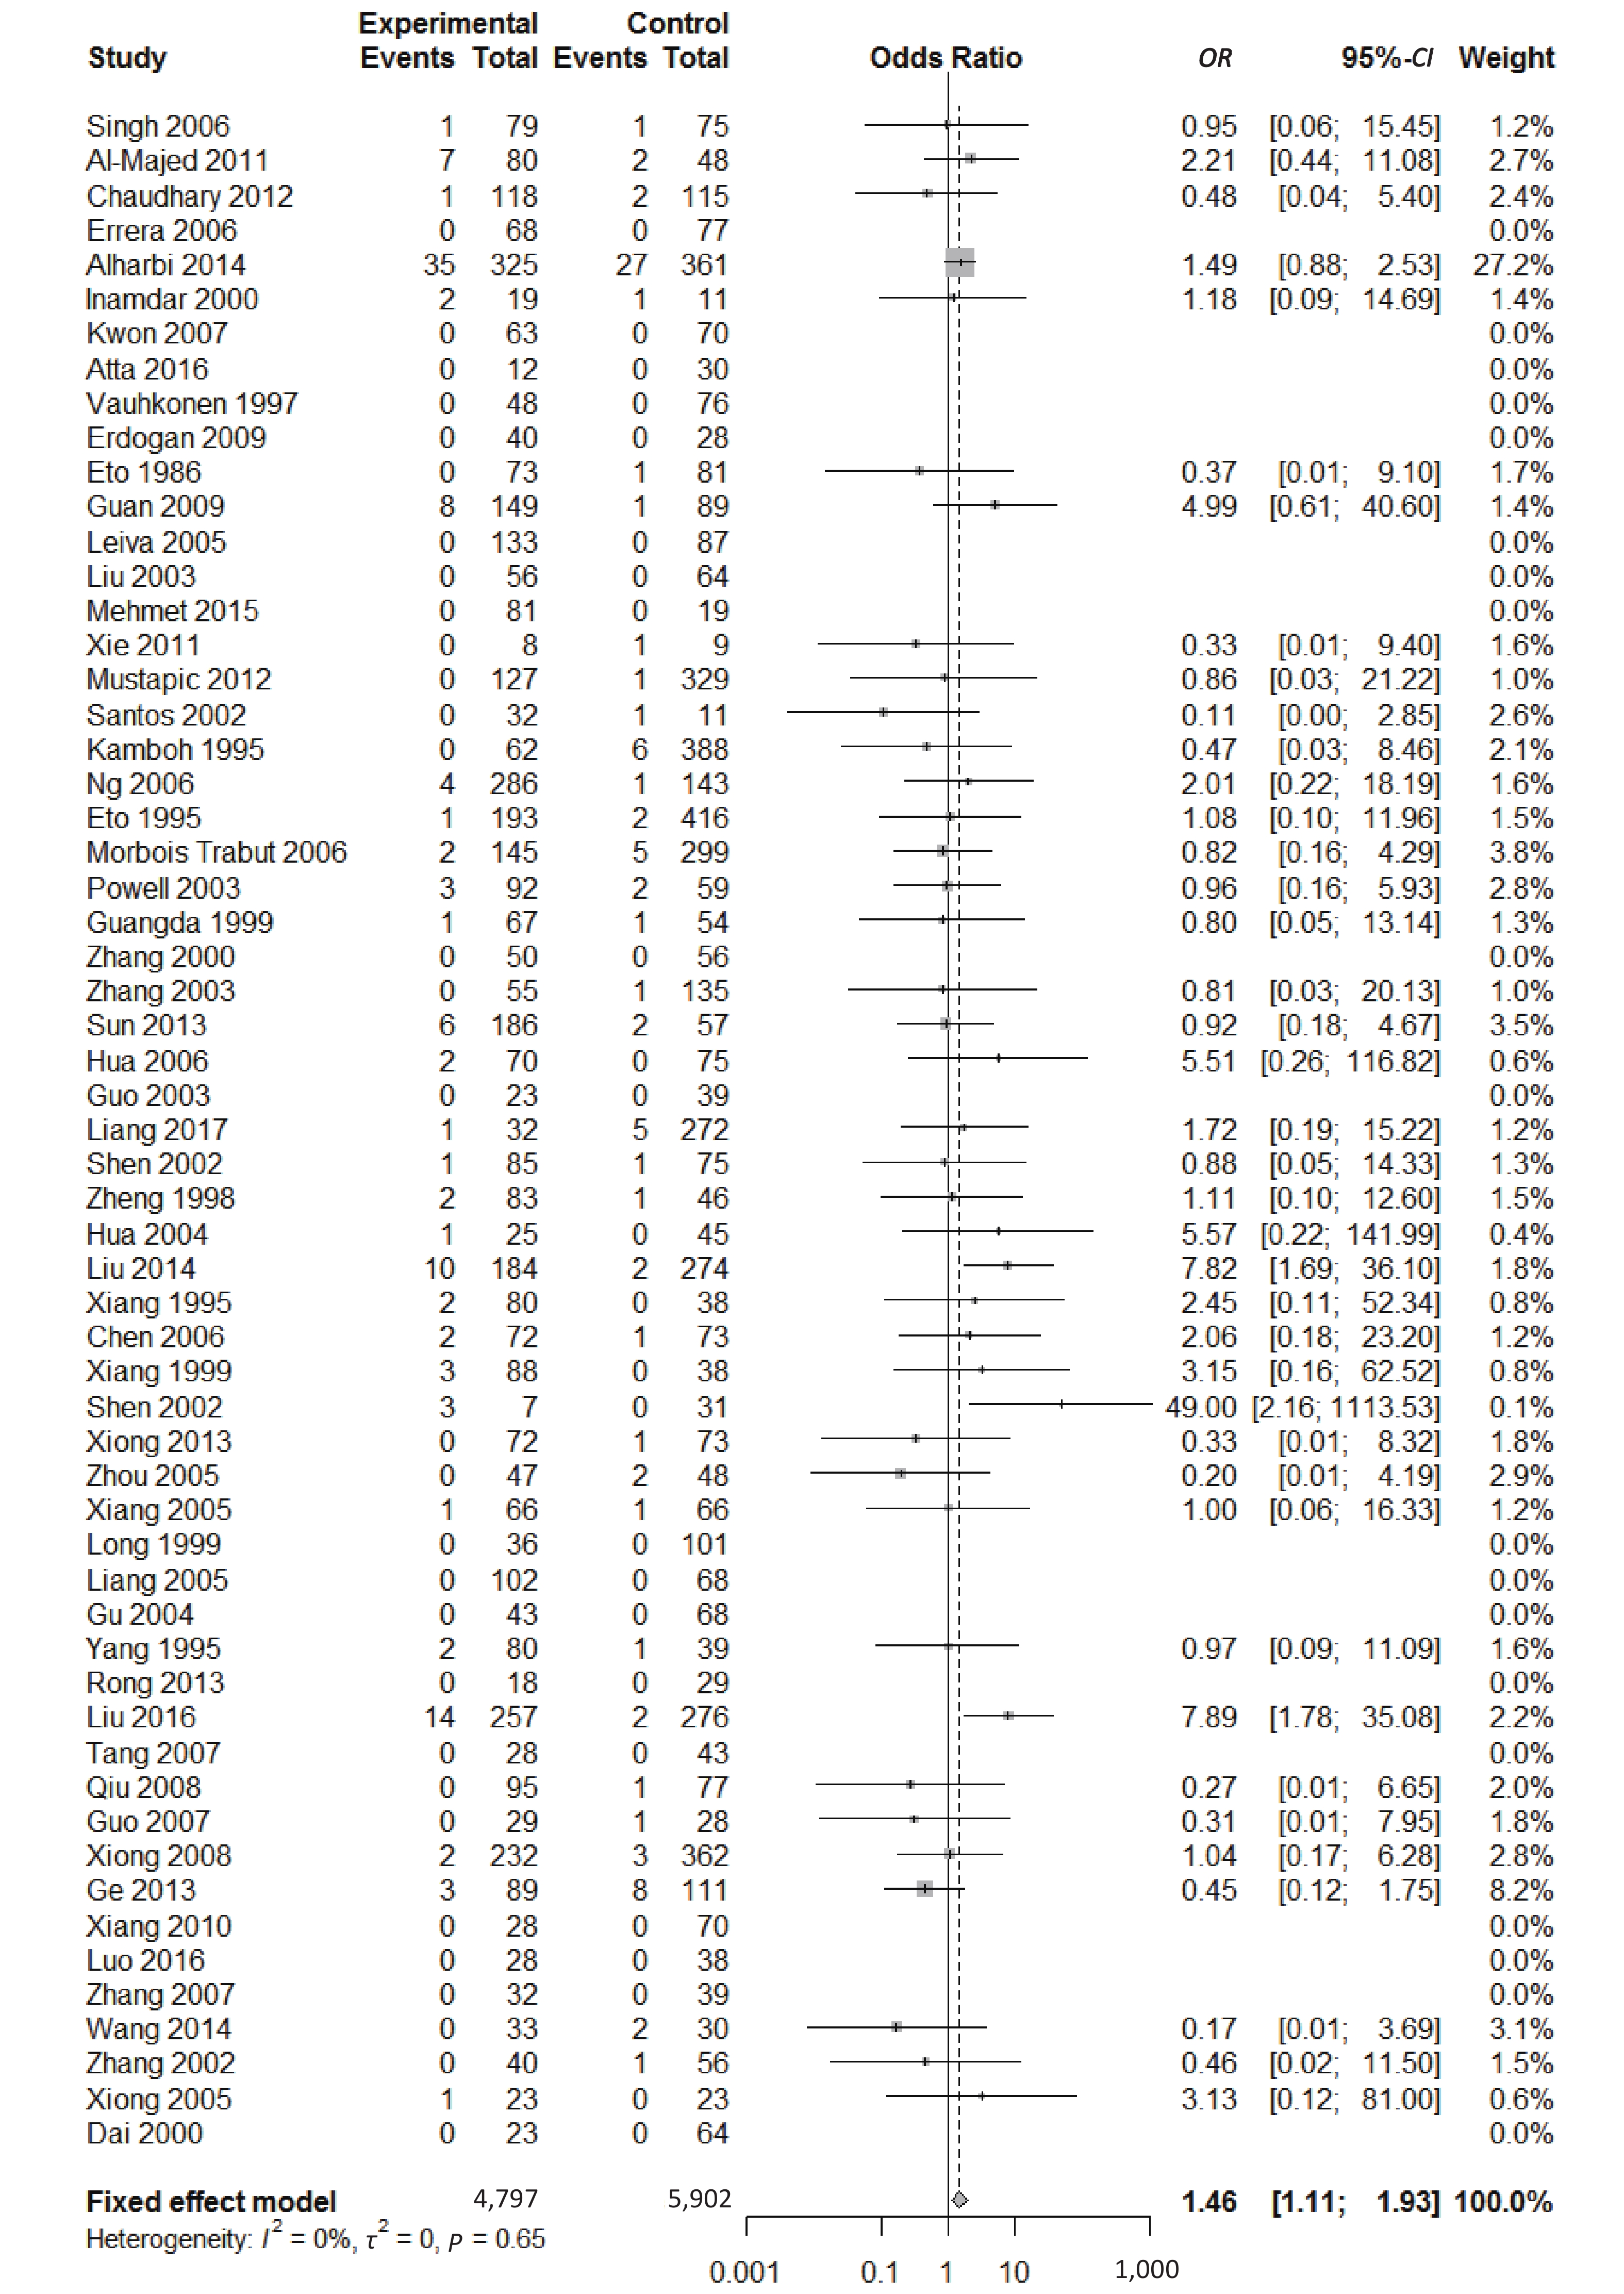
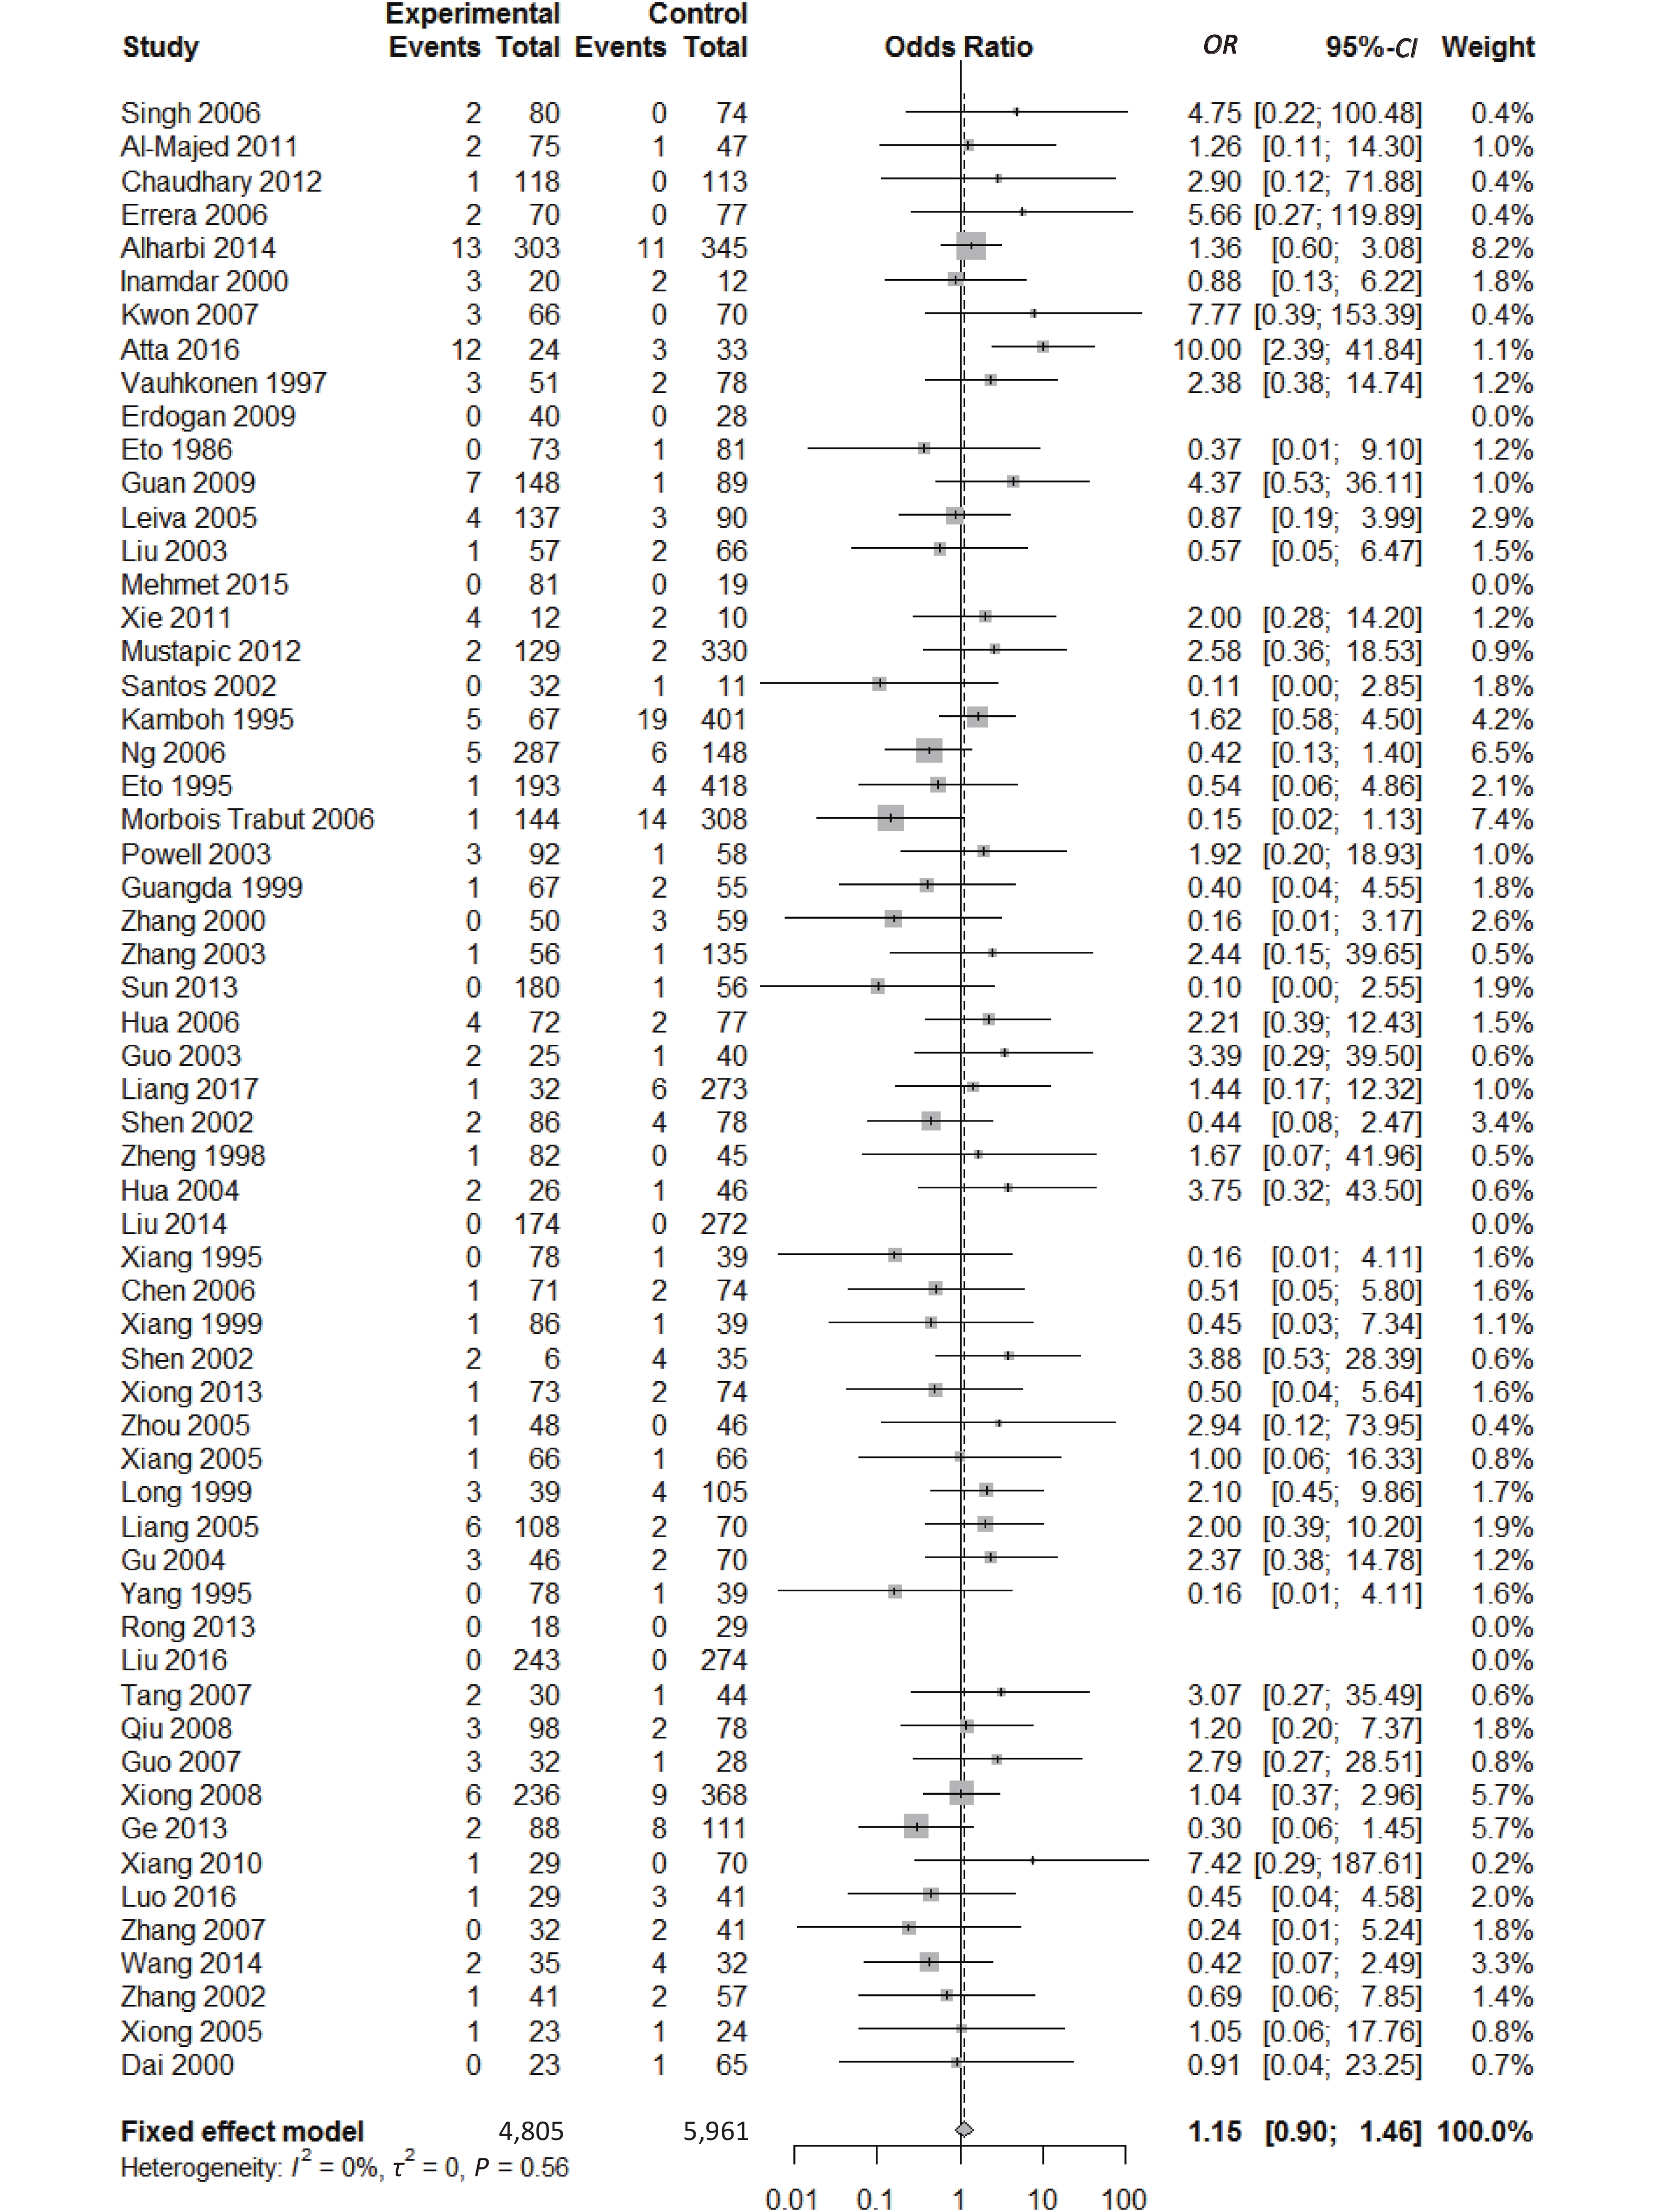
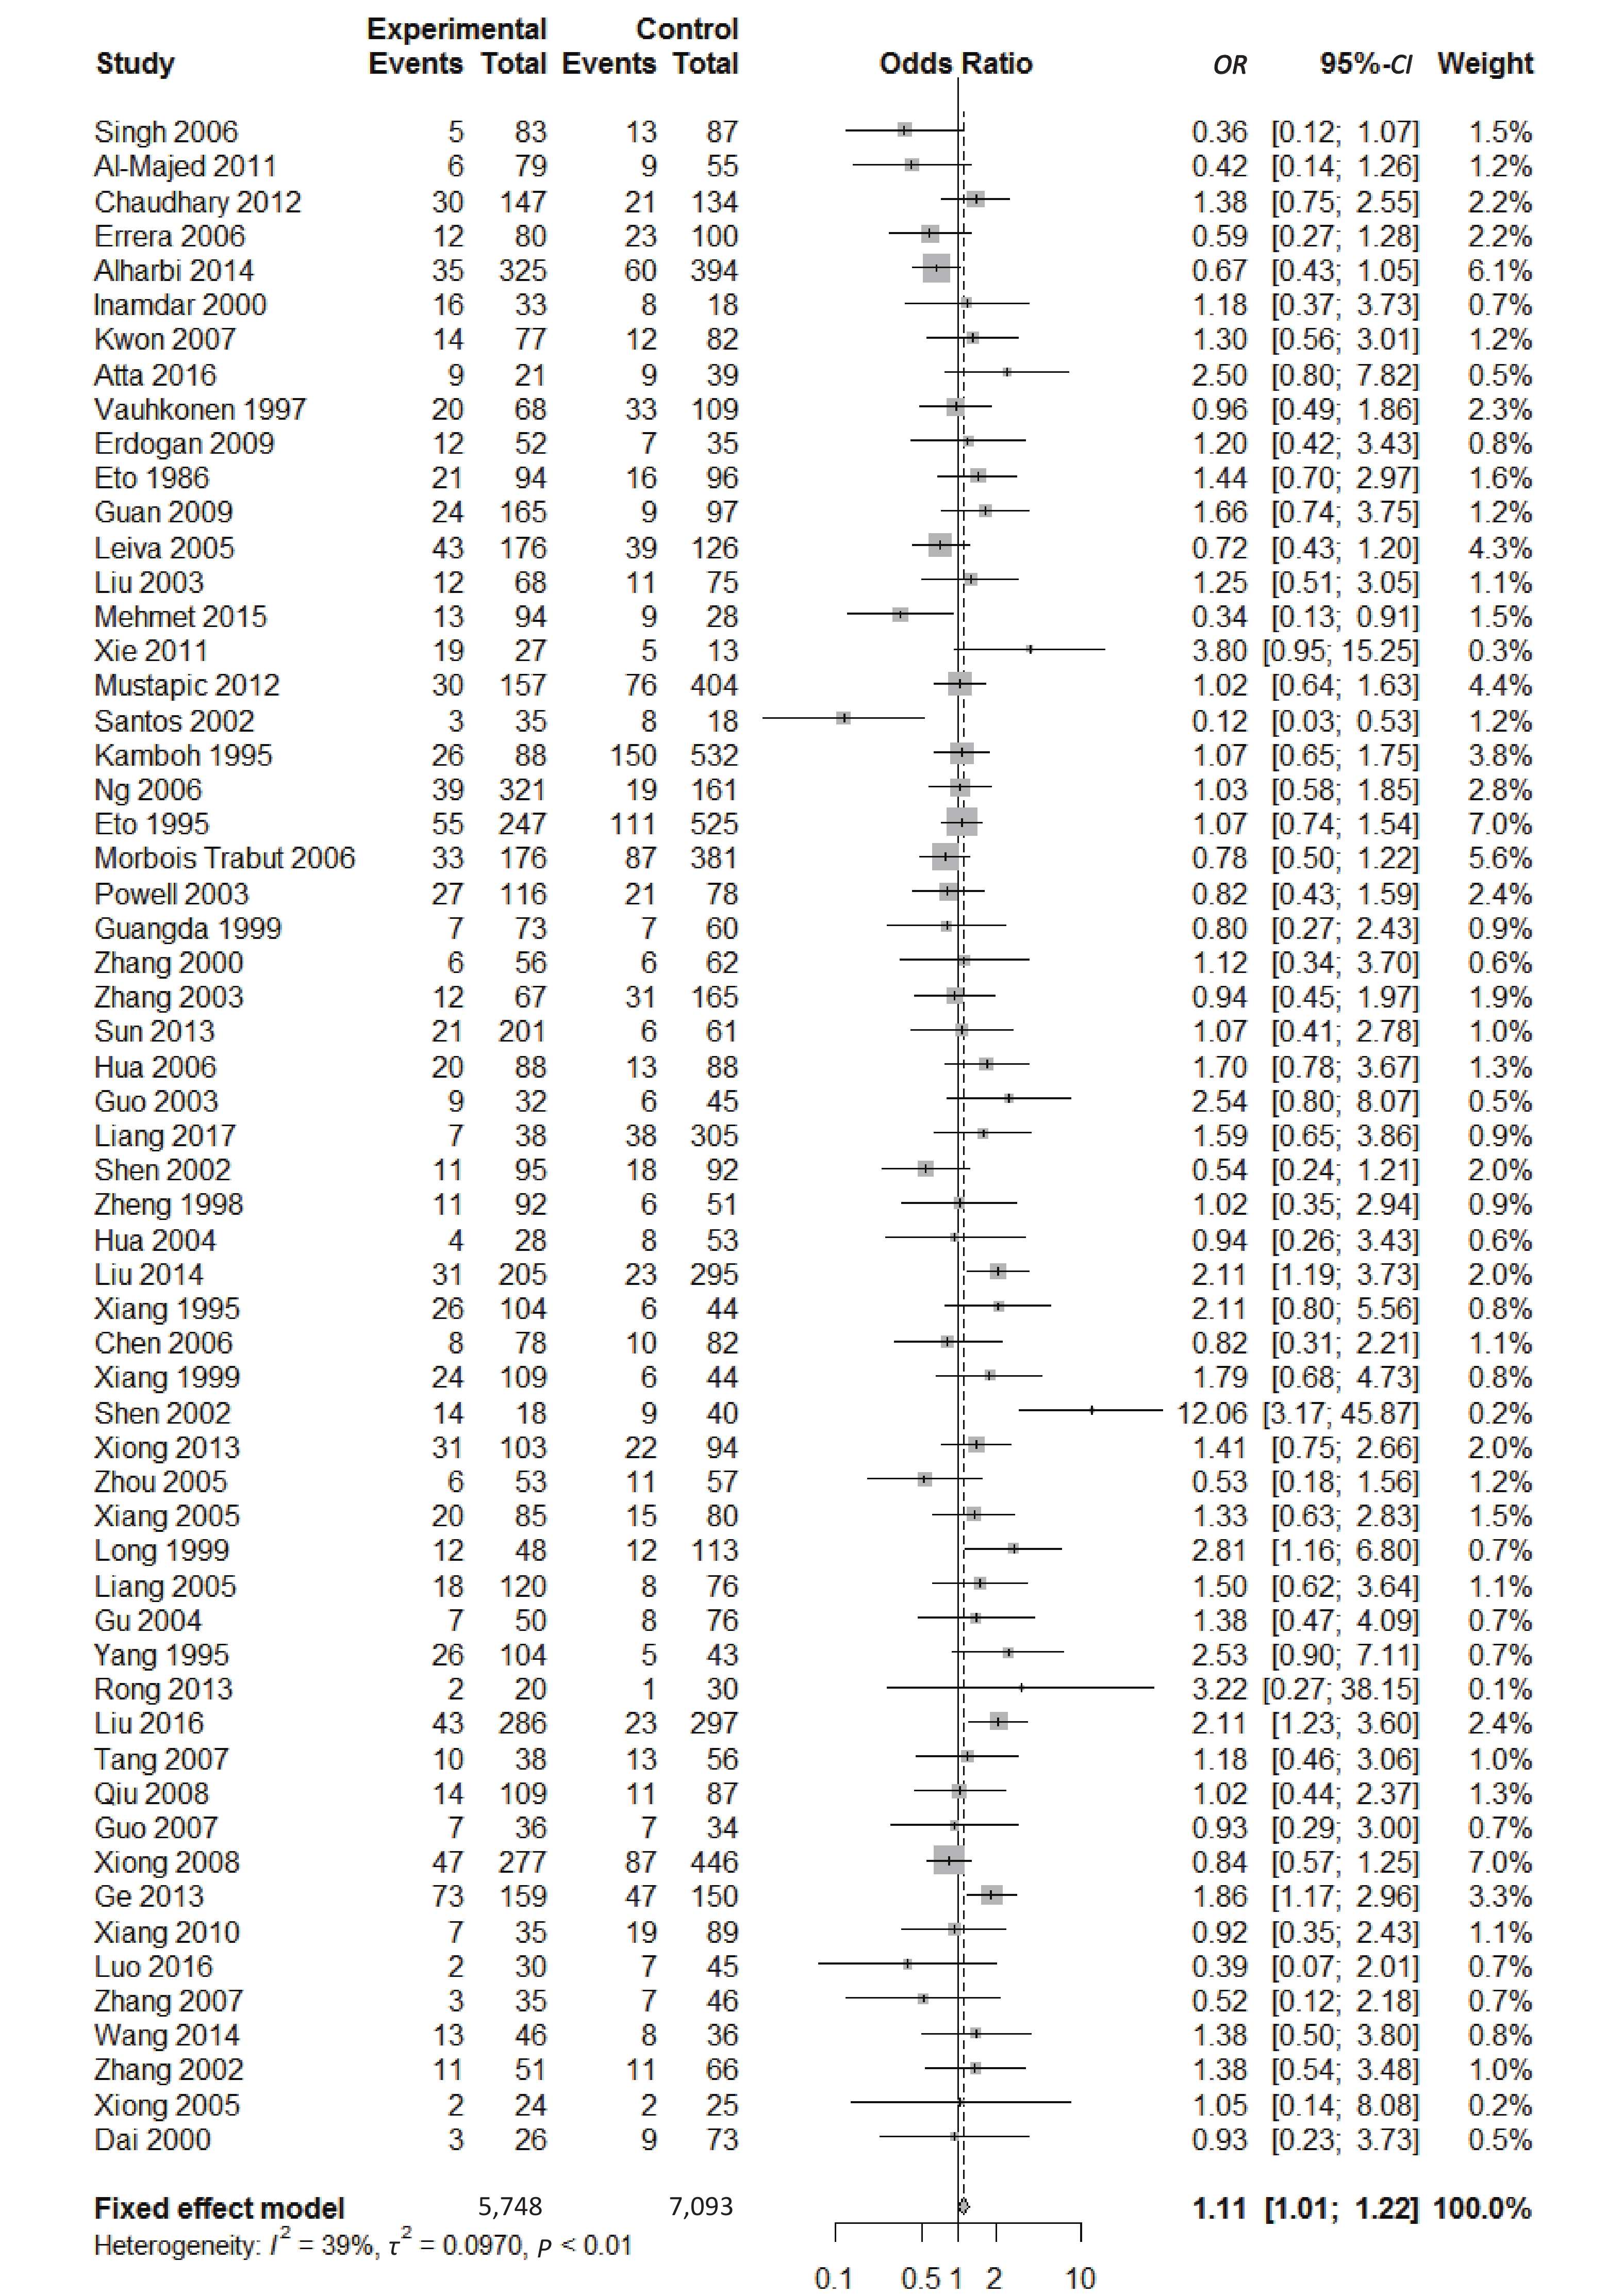
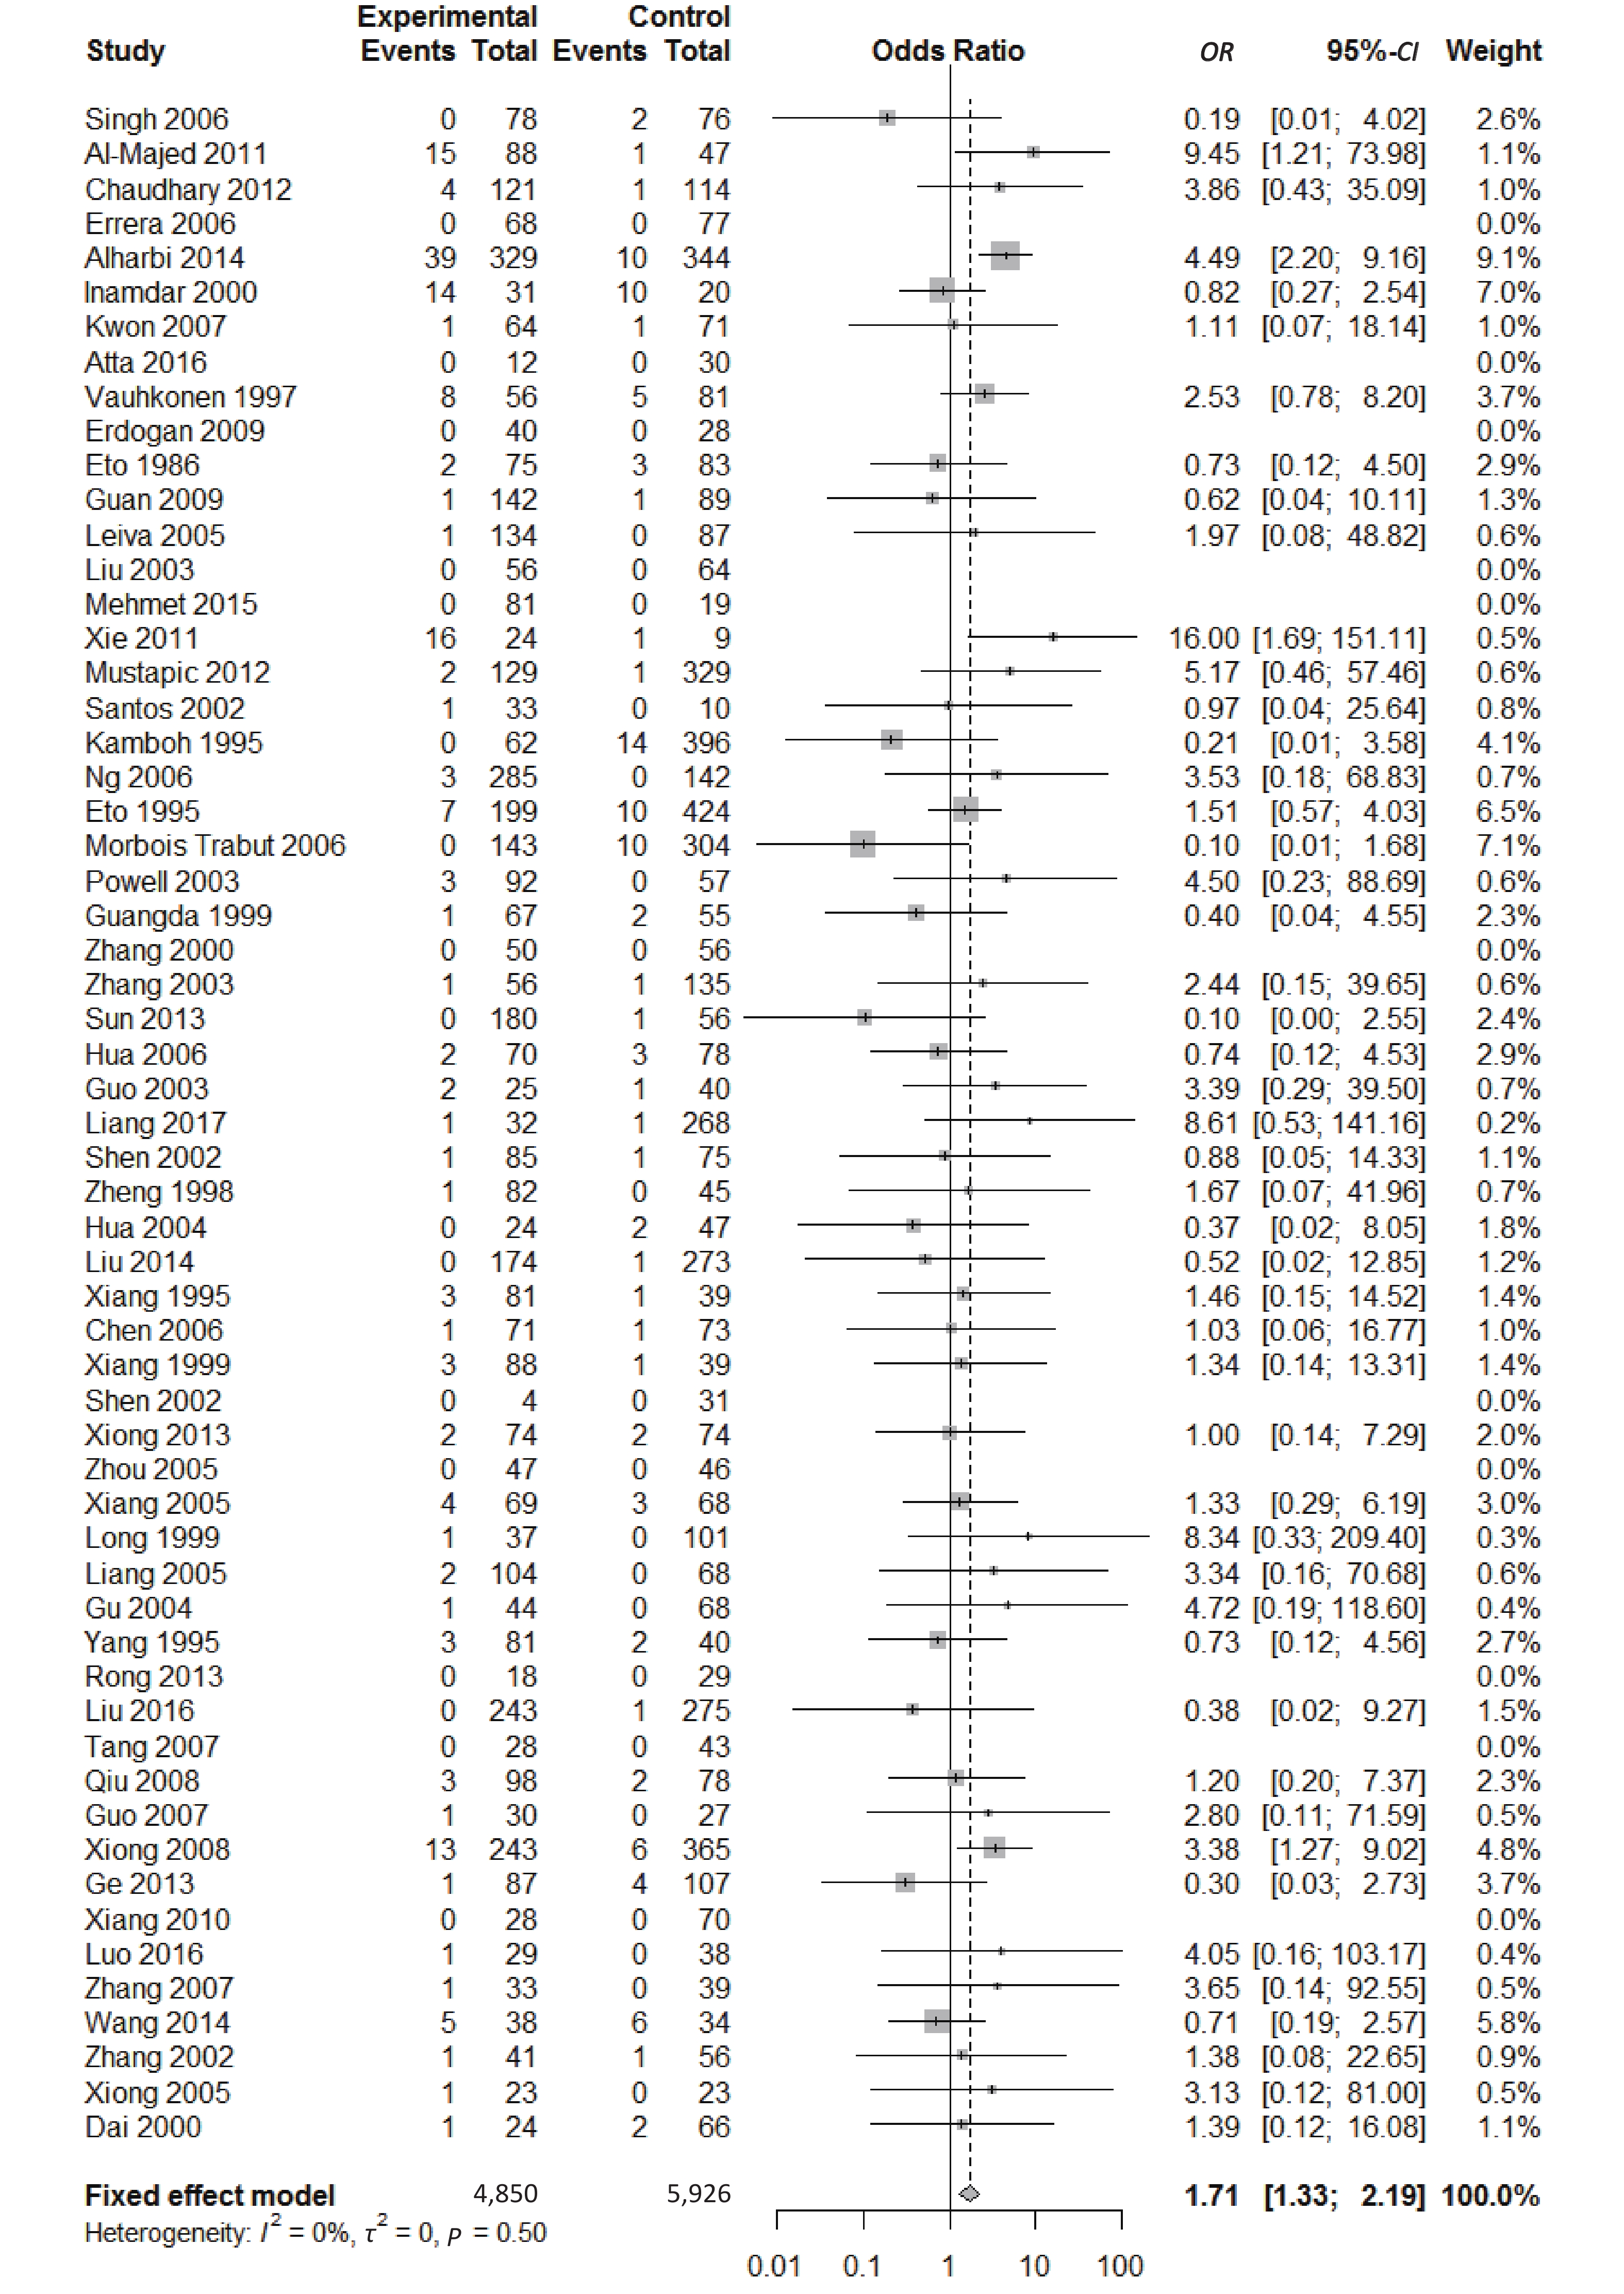
There were five genotypes (ε2/ε2, ε2/ε3, ε2/ε4, ε3/ε4
, and ε4/ε4) were compared with ε3/ε3 genotype. No significant heterogeneity was found when the comparison was performed between the ε2/ε2 and ε3/ε3 genotypes (I2 = 0%), and the yielded OR of ε2/ε2 genotype versus ε3/ε3 genotype using a fixed-effects model was 1.46 (95% CI: 1.11-1.93; P = 0.007) (Figure 4), indicating that the ε2/ε2 genotype might produce a harmful effect on type 2 diabetes. However, when ε2/ε3 genotype was compared with ε3/ε3 genotype, there was significant heterogeneity (I2 = 55%), and the yielded OR of ε2/ε3 genotype versus ε3/ε3 genotype using a random-effects model was 1.09 (95% CI: 0.90-1.32; P = 0.397) (Figure 5). Compared with ε3/ε3 genotype, there were no significant heterogeneity between ε2/ε4, ε3/ε4, and ε4/ε4 genotype, respectively (I2 = 0%, I2 = 39%, and I2 = 0%). The yielded OR of ε2/ε4 genotype versus ε3/ε3 genotype using a fixed-effects model was 1.15 (95% CI: 0.90-1.46; P = 0.276) (Figure 6). The yielded OR of ε3/ε4 genotype versus ε3/ε3 genotype using a fixed-effects model was 1.11 (95% CI: 1.01-1.22; P = 0.039) (Figure 7). For the comparison of ε4/ε4 genotype with ε3/ε3 genotype, the yielded OR showed a 1.71-fold risk of type 2 diabetes (OR = 1.71; 95% CI: 1.33-2.19; P < 0.001) using the fixed-effects model (Figure 8). 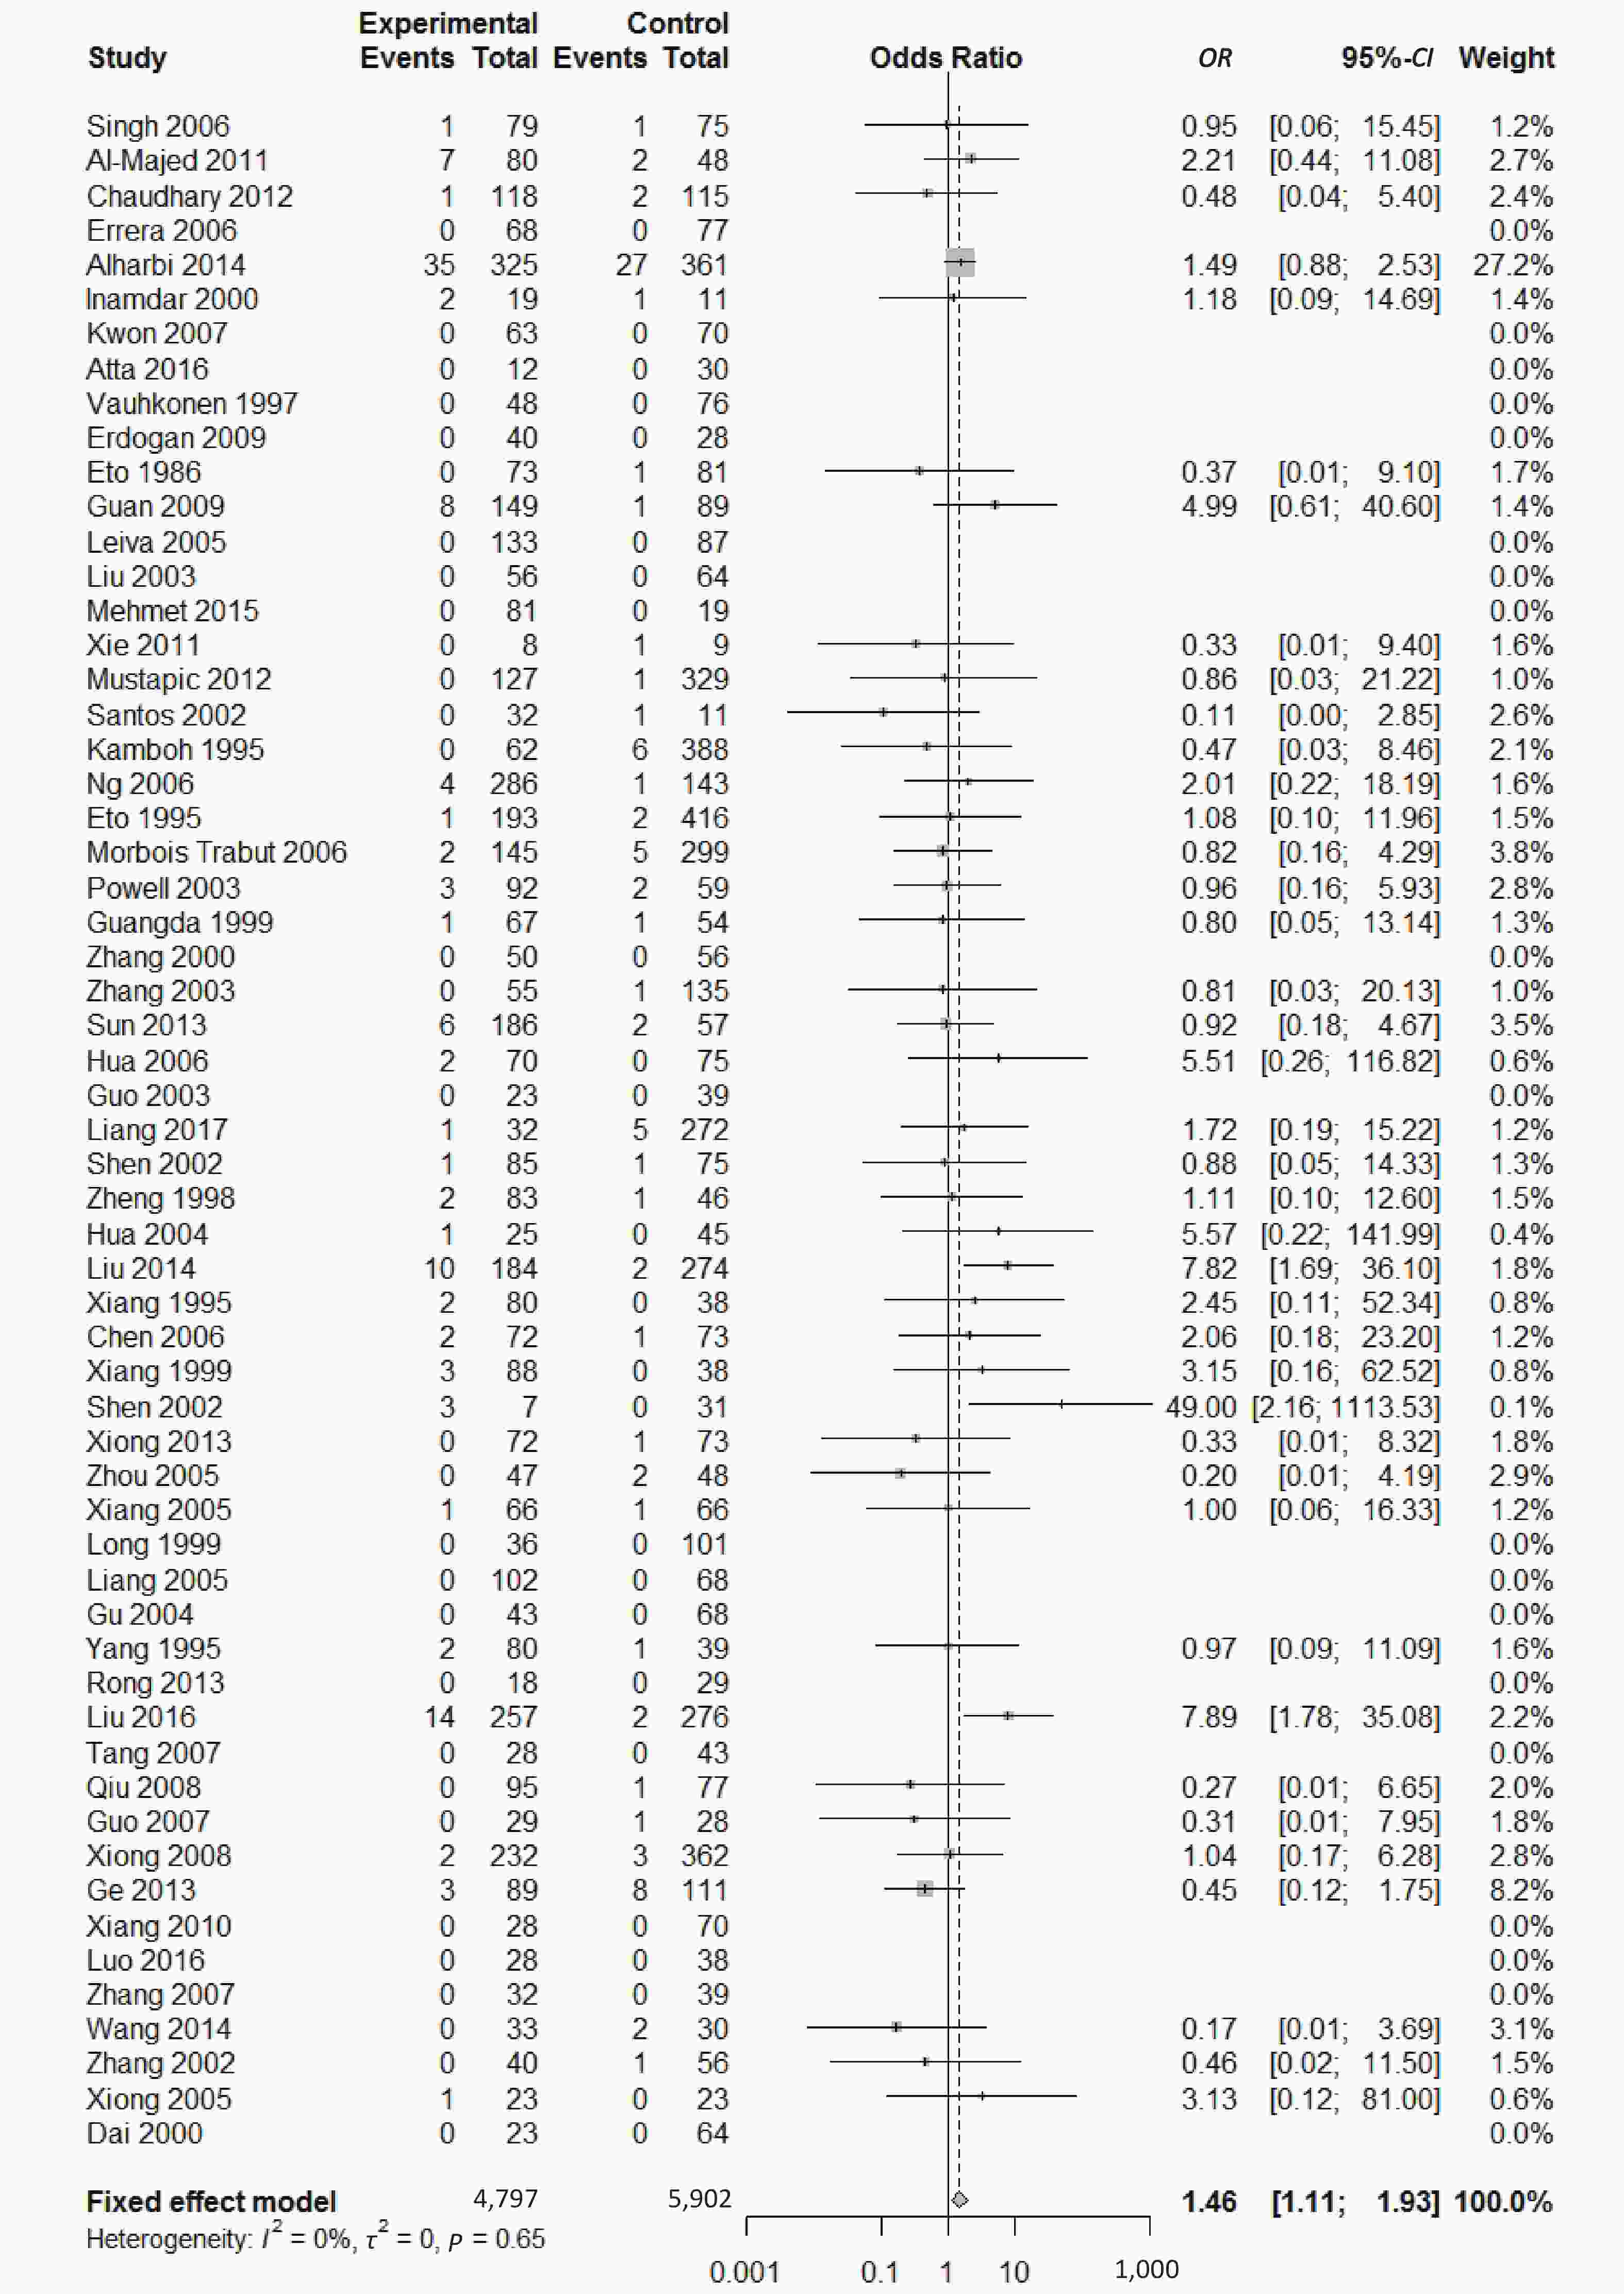
Figure 4. Forest plot for the result of association between type 2 diabetes and ApoE ε2/ε2 genotype vs. ε3/ε3 genotype based on a fixed-effects model
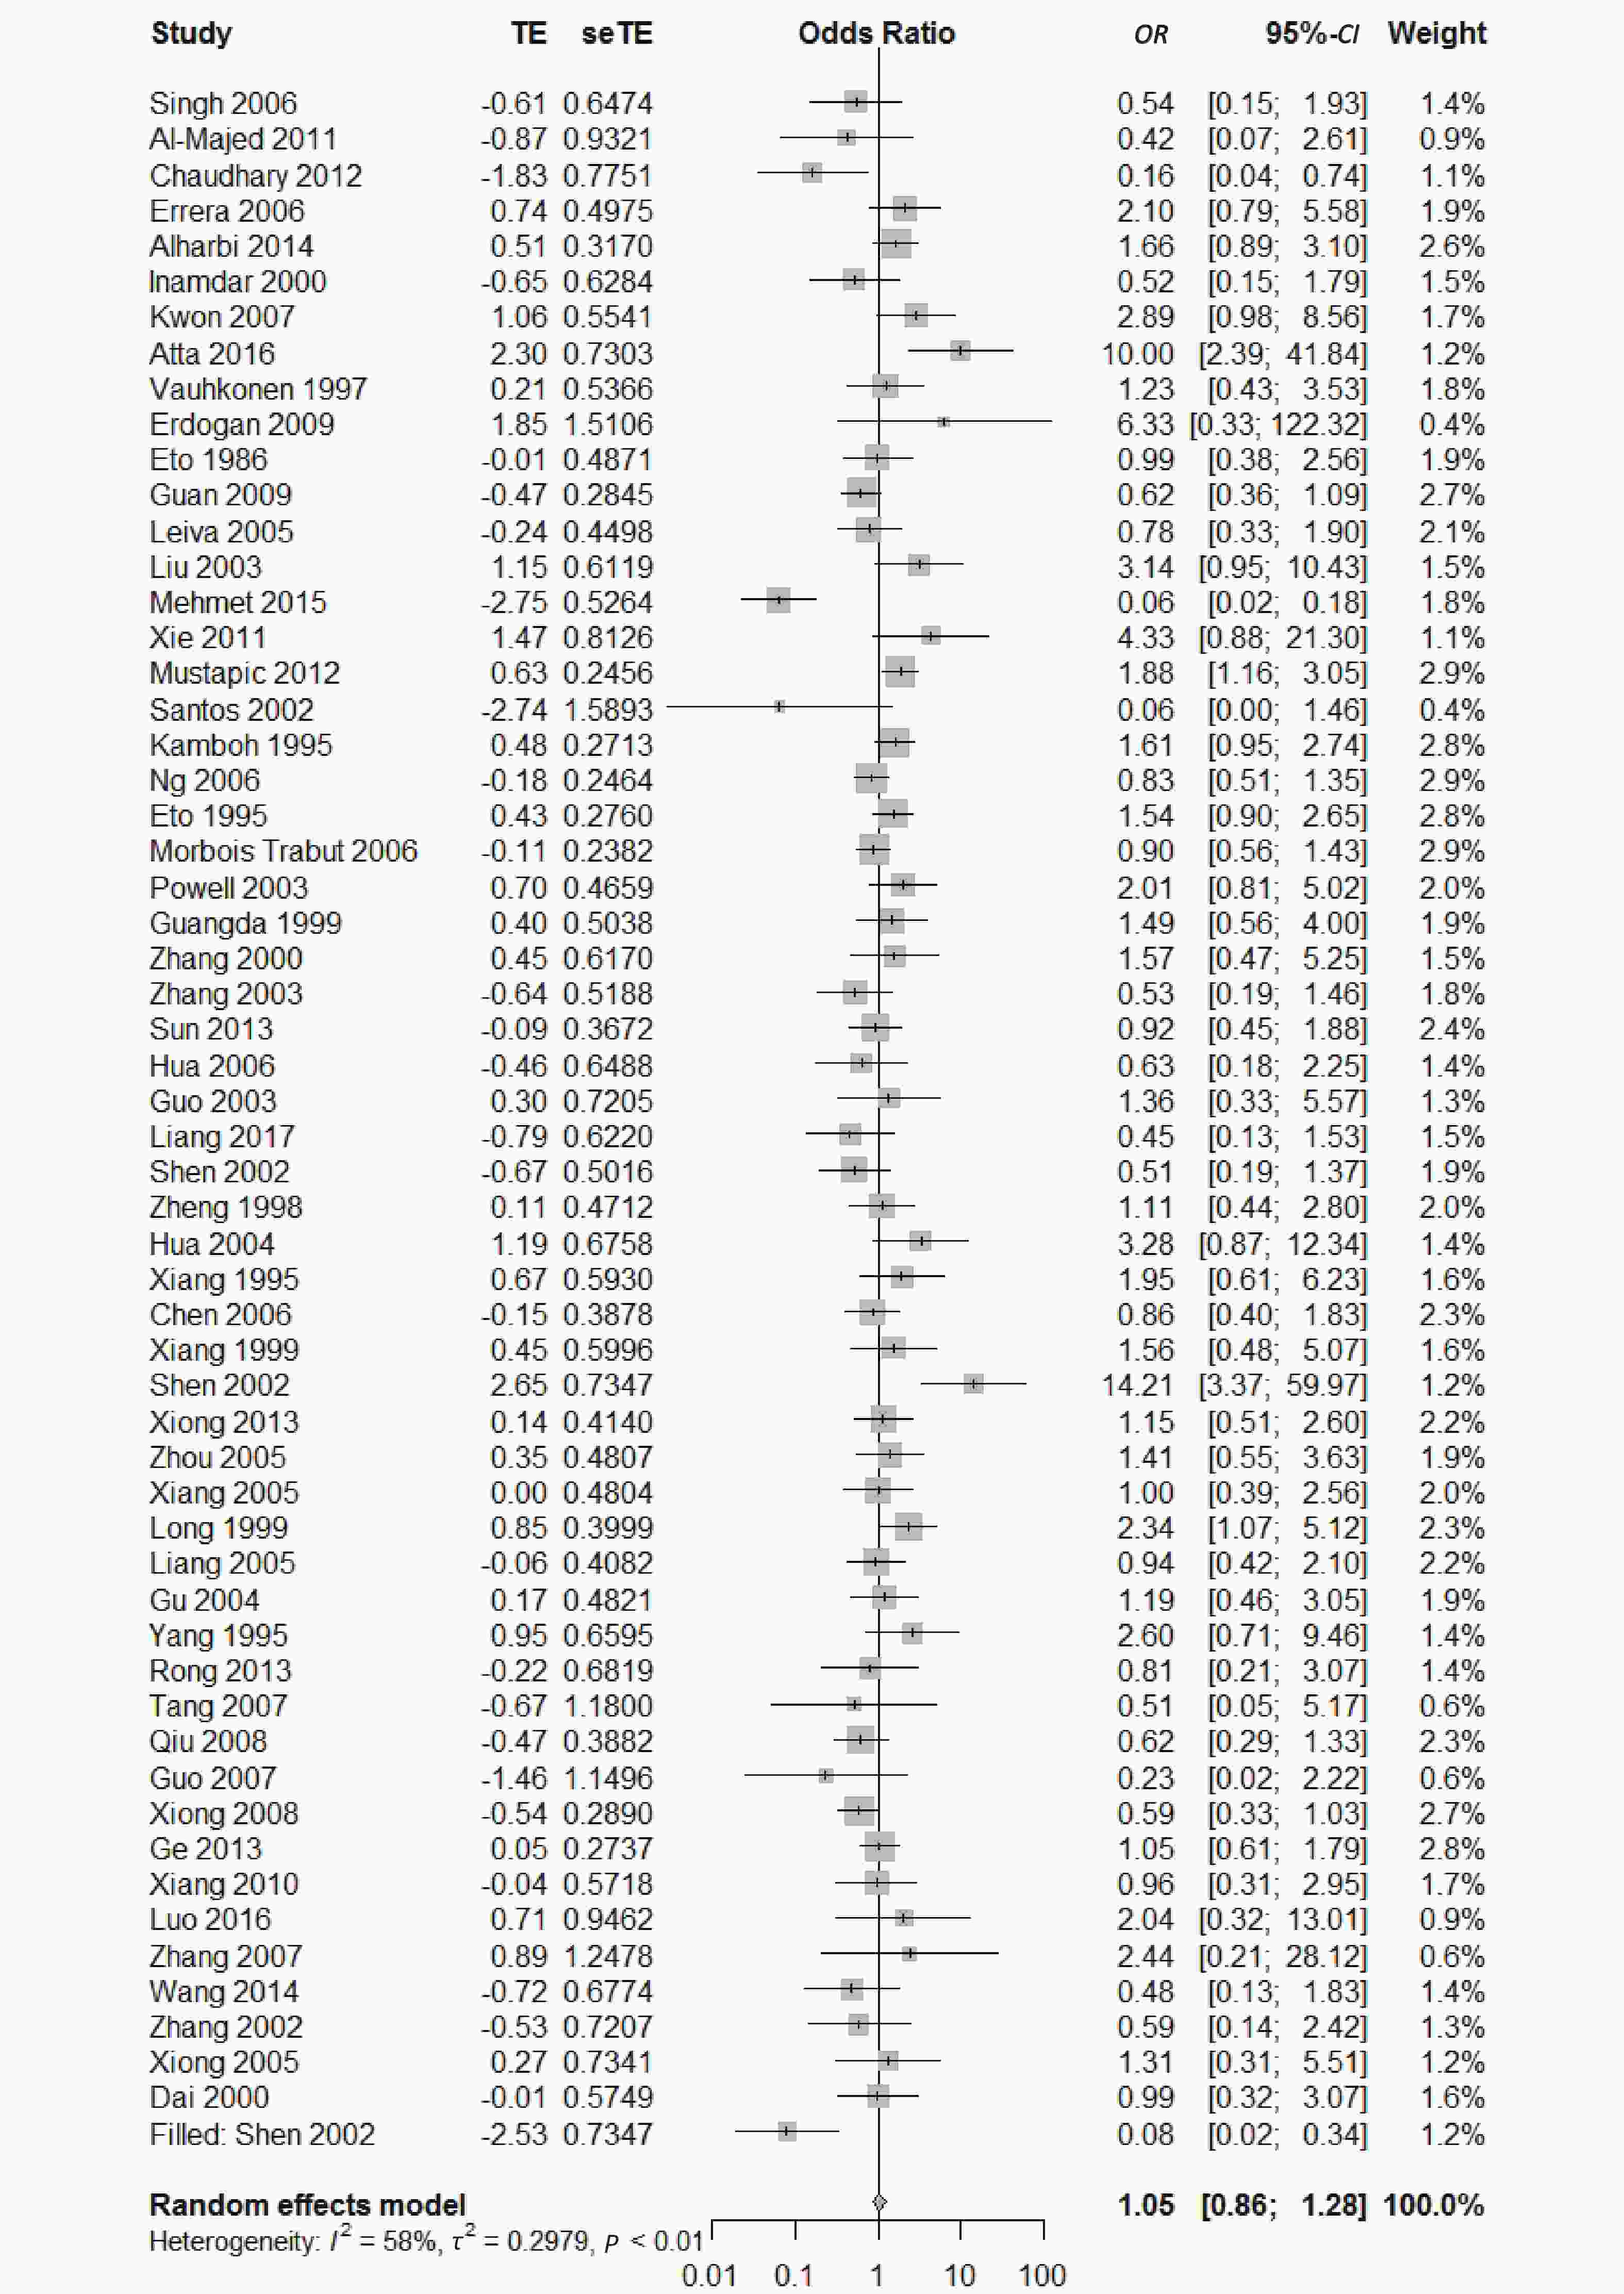
Figure 5. Forest plot for the result of association between type 2 diabetes and ApoE ε2/ε3 genotype vs. ε3/ε3 genotype based on a random-effects model
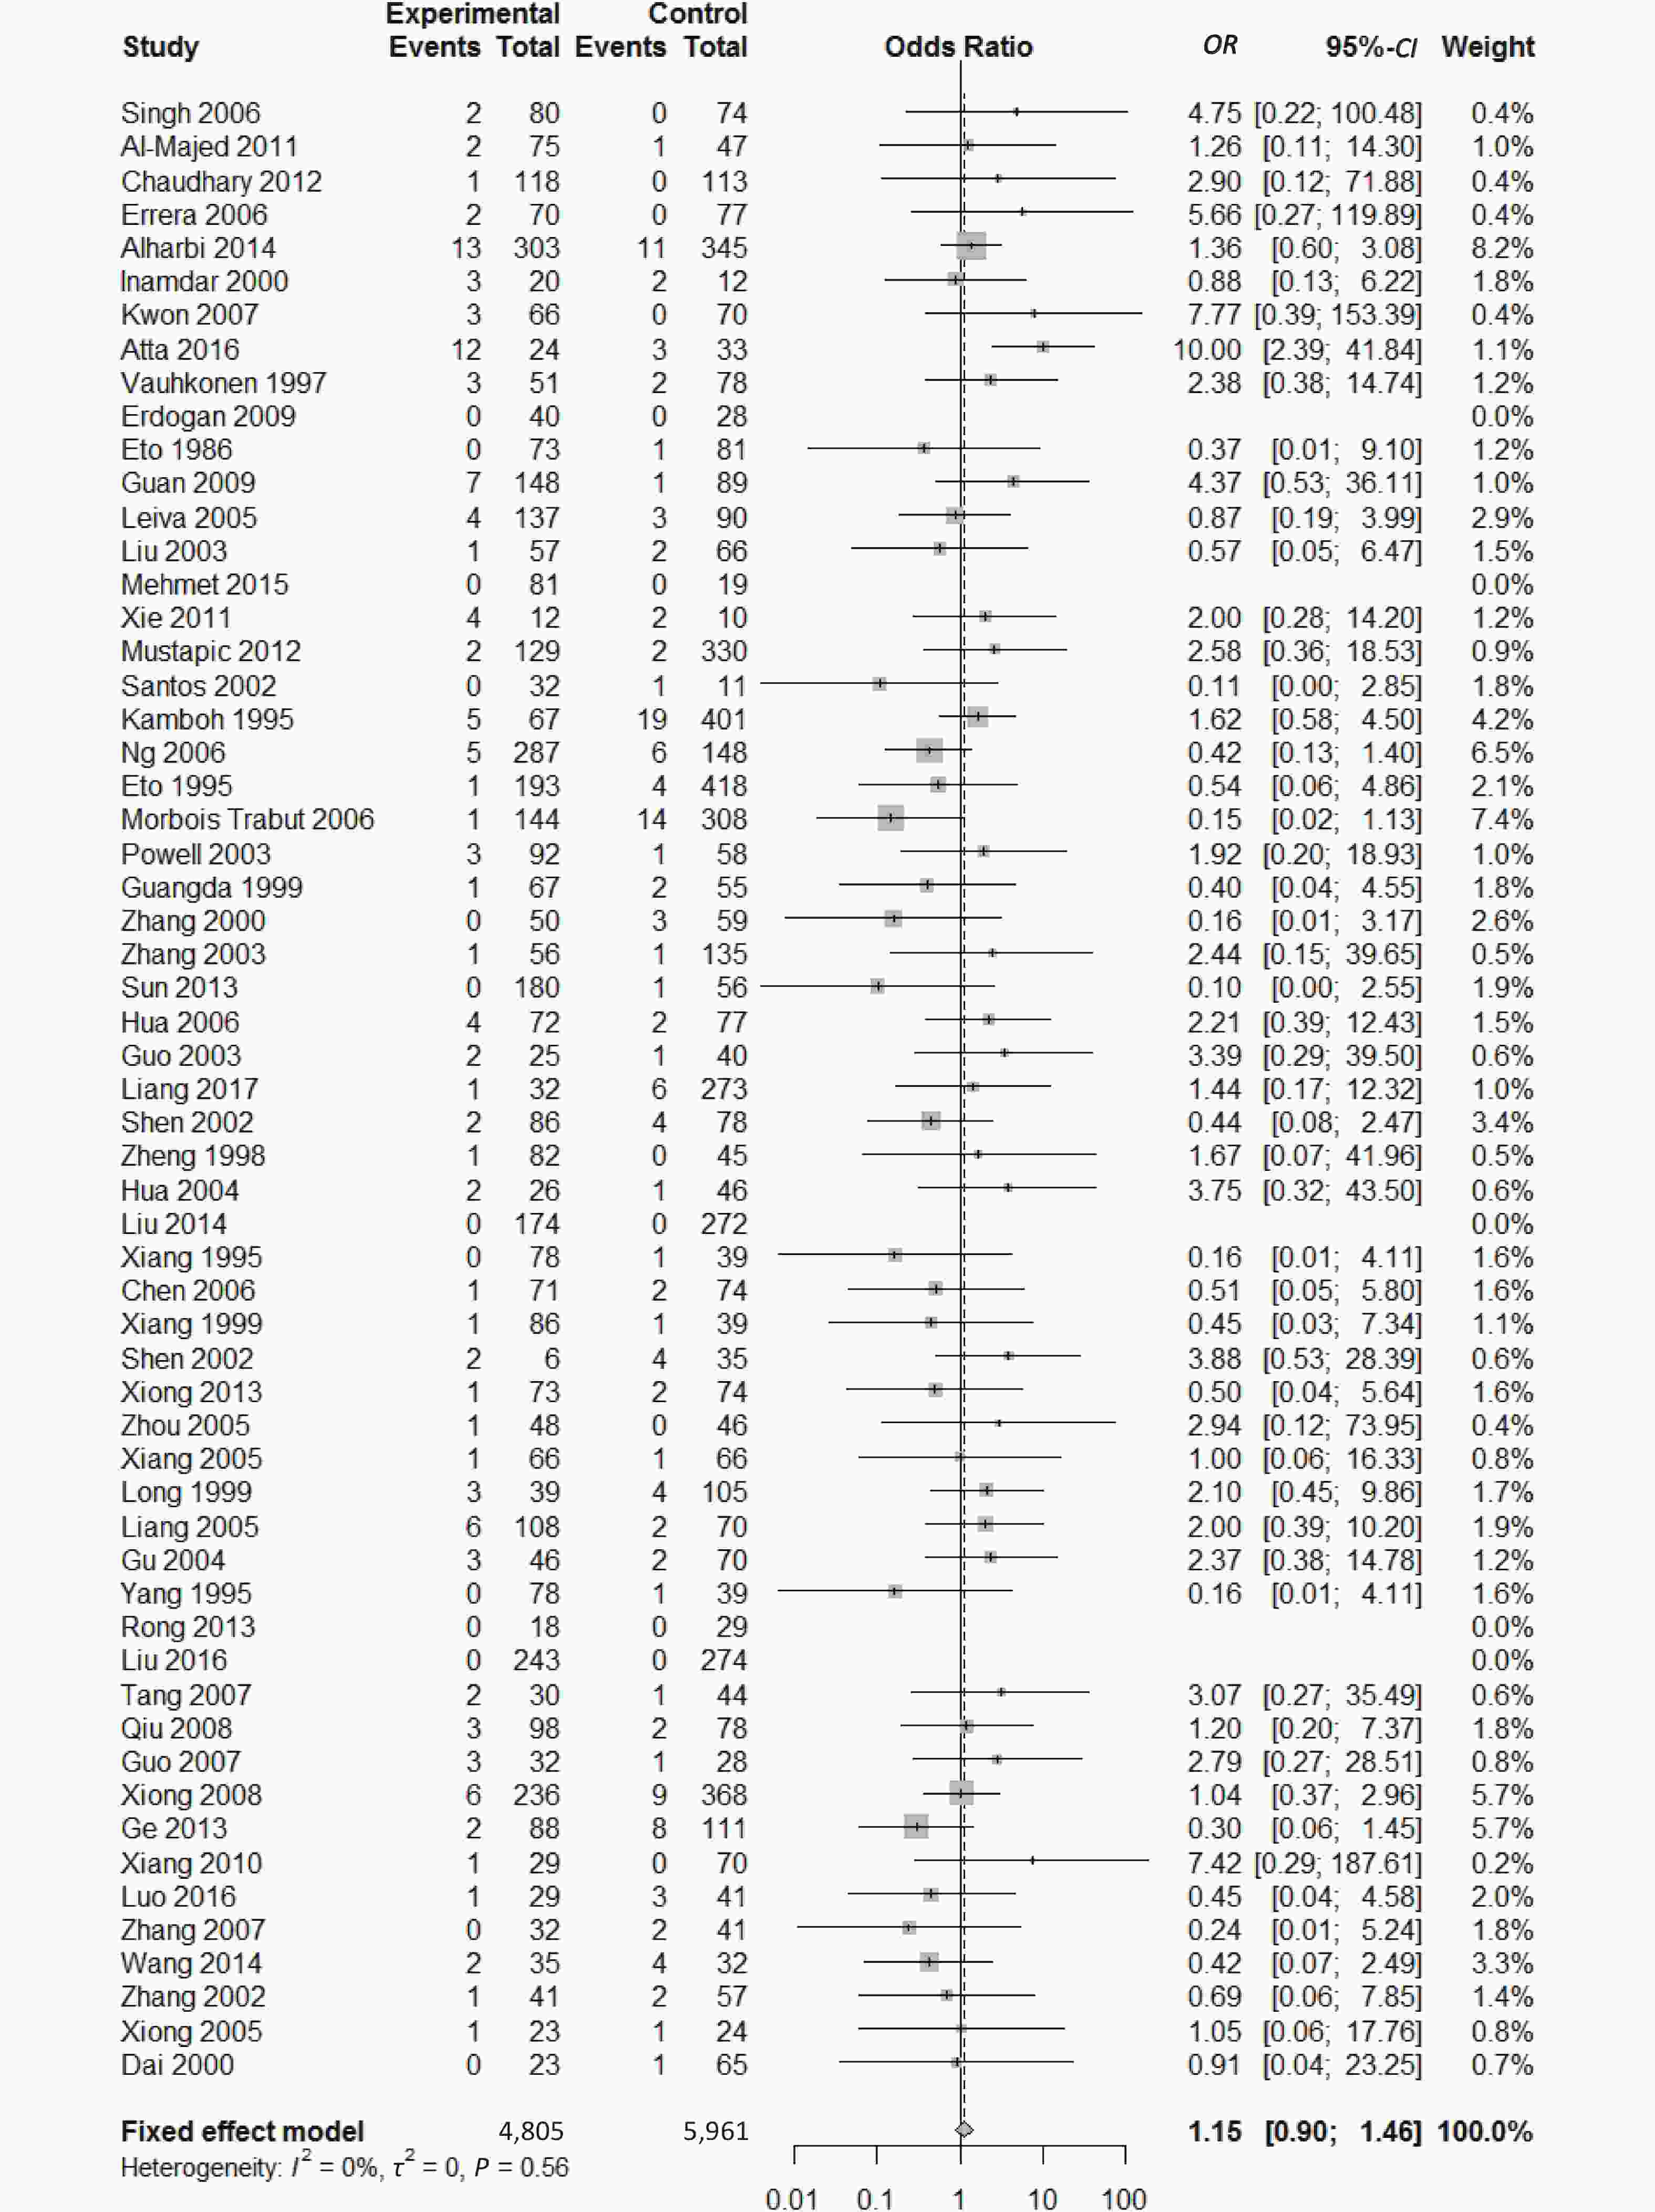
Figure 6. Forest plot for the result of association between type 2 diabetes and ApoE ε2/ε4 genotype vs. ε3/ε3 genotype based on a fixed-effects model
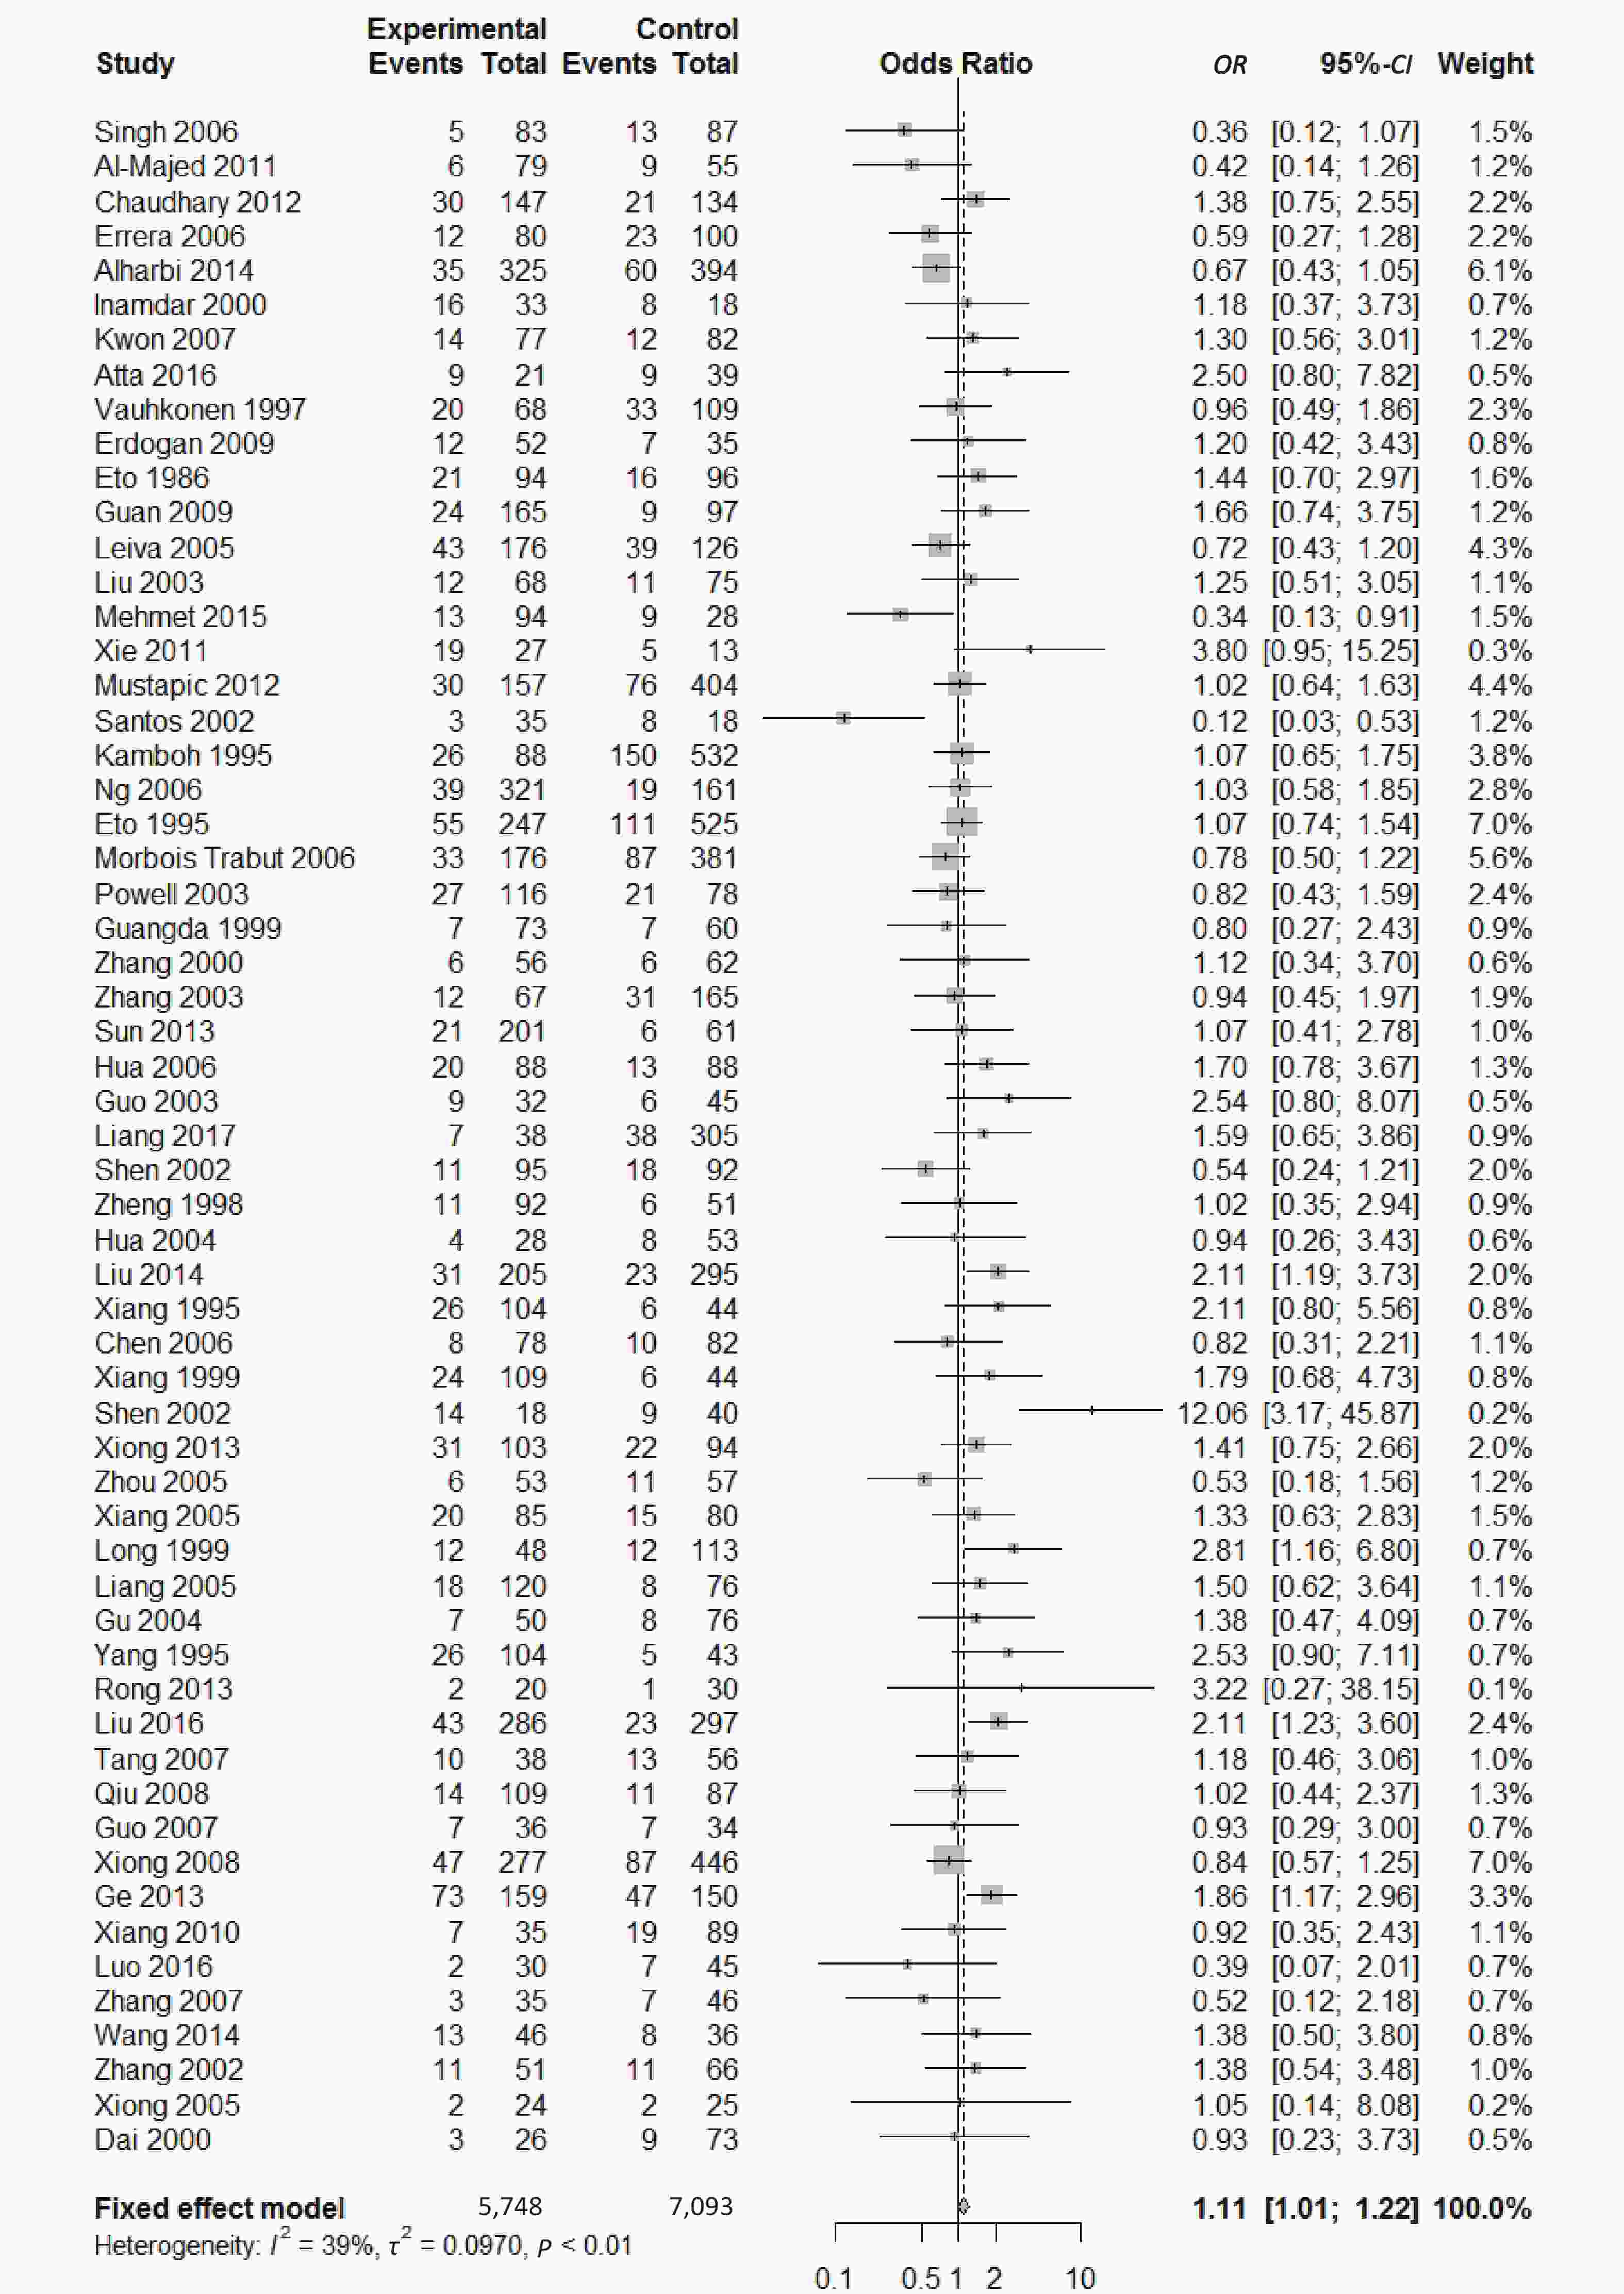
Figure 7. Forest plot for the result of association between type 2 diabetes and ApoE ε3/ε4 genotype vs. ε3/ε3 genotype based on a fixed-effects model
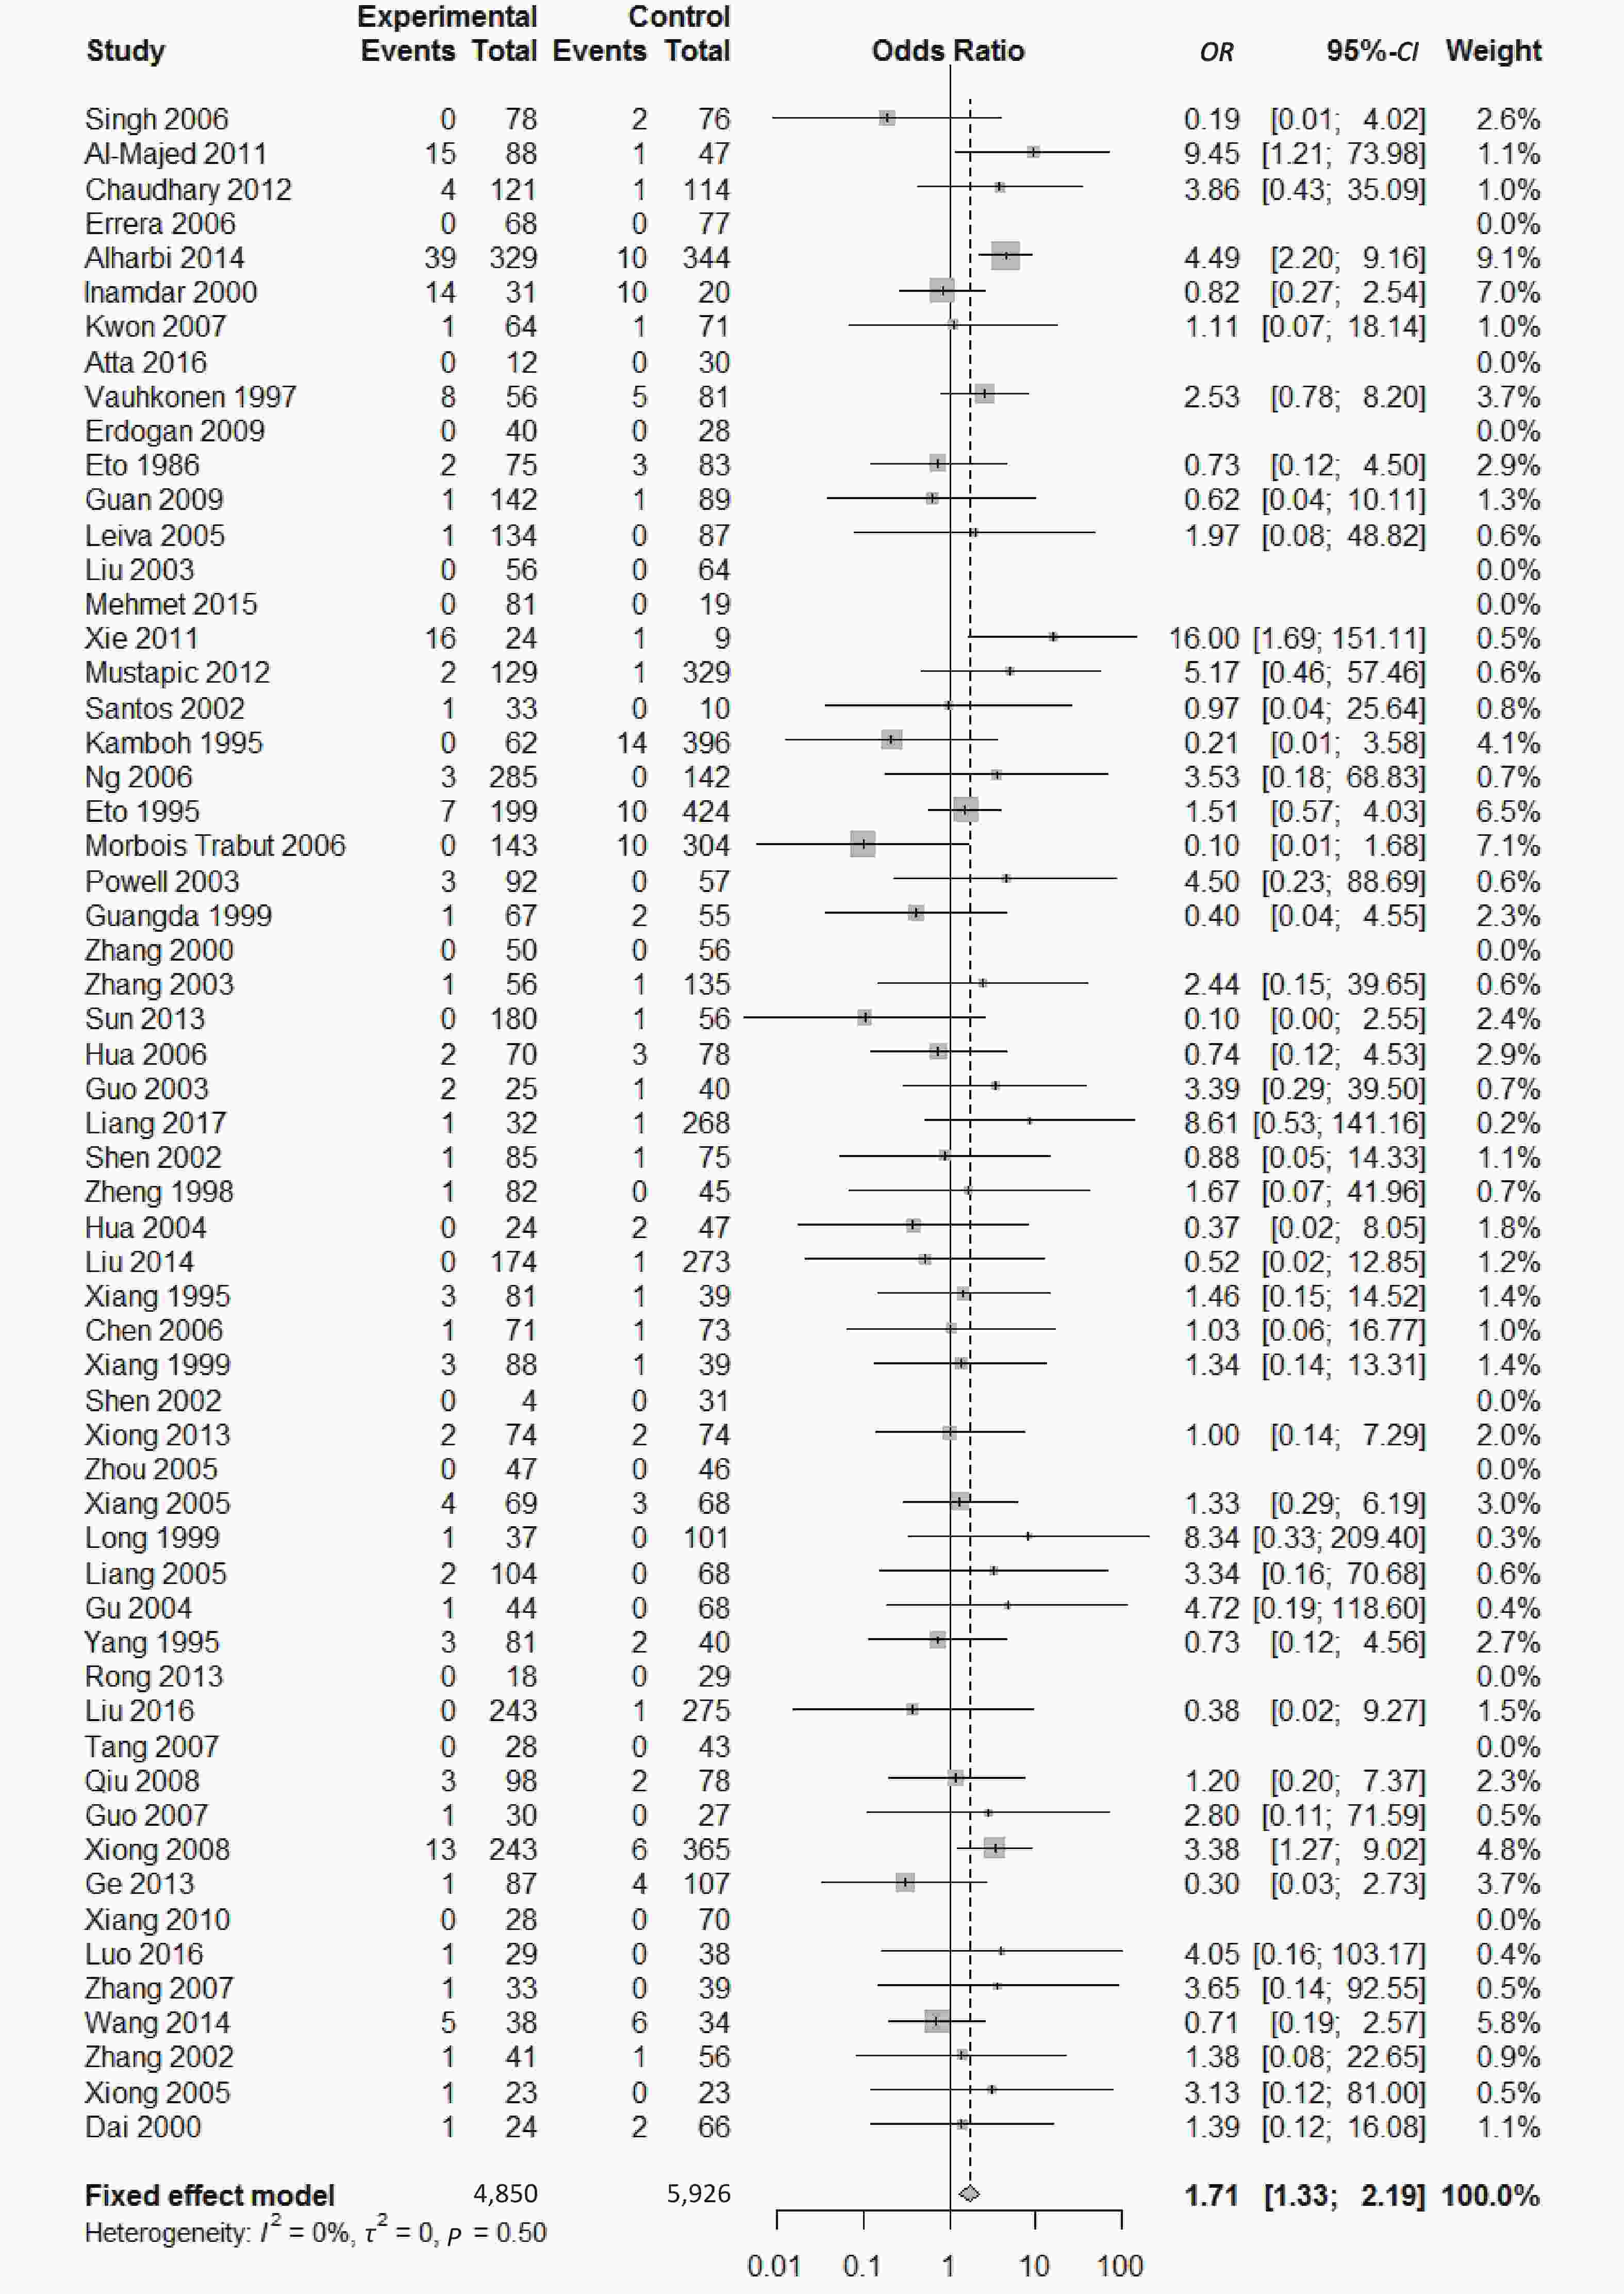
Figure 8. Forest plot for the result of association between type 2 diabetes and ApoE ε4/ε4 genotype vs. ε3/ε3 genotype based on a fixed-effects model
-
We conducted subgroup analysis stratified by ethnicity, quality score and Hardy–Weinberg equilibrium in order to identify main sources of heterogeneity. There were significant heterogeneity in the comparison of ApoE ε2 with ε3 allele (I2 = 62%) and the comparison of ε2/ε3 genotype with ε3/ε3 genotype (I2 = 55%) in our paper; however, we could not identify the sources of heterogeneity and there was no significant association between ApoE polymorphisms and type 2 diabetes in different subgroups (Supplementary Figures S1-S3, available in www.besjournal.com).
-
Funnel plots was used to assess and Begg’s and Egger’s tests to quantify the publication bias. All the funnel plots for ApoE allele and ApoE genotypes seemed symmetrical (Supplementary Figures S4-S5, available in www.besjournal.com), and the results of Begg’s and Egger’s tests revealed that no publication bias was present for the association between ApoE allele and type 2 diabetes and between the ApoE genotypes and type 2 diabetes (all P > 0.05).
-
According to our results of sensitivity analysis, no individual study produced influence on the corresponding pooled ORs and 95% CIs in the comparison of ApoE allele with ε3 allele or in the comparison of ApoE genotypes with genotype ε3/ε3 genotype, which indicated these results were relatively stable and credible.
-
In this meta-analysis, we included 59 literatures with 6,872 cases and 8,250 controls to explore the association between the ApoE gene polymorphism and type 2 diabetes mellitus. The major findings of our study are that allele ε4 and genotypes (ε2/ε2, ε3/ε4, and ε4/ε4) are associated with the increased risk for the development of T2DM, however, allele ε2 and genotypes (ε2/ε3 and ε2/ε4) are not associated with T2DM.
The findings of our meta-analysis are in accordance with the previous studies[33,78-80], showing that both ApoE ε4 allele and the genotypes (ε3/ε4 and ε4/ε4) were associated with increased risk of T2DM. Subjects carrying the ε4 alleles had higher plasma total cholesterol levels compared to subjects carrying the ε3/ε3 genotype, and HDL cholesterol was significantly lower in the ε3/ε4 than in the ε3/ε3 individuals[81]; individuals carrying the ε2/ε2 genotype had about 31% lower mean LDL than those with the ε4/ε4 genotype[82]. Insulin resistance is known to be strongly associated with metabolic dyslipidemia and the correlation of lipid profiles with diabetic phenotypes is significant. Therefore, ApoE ε4 allele and the genotypes (ε3/ε4 and ε4/ε4) were associated with an increased risk of T2DM through affecting the lipid metabolism.
We found the genotype ε2/ε2 was associated with increased risk of T2DM, but not allele ε2 or genotype ε2/ε3; which are not in agreement with the results of previous meta-analyses[33]. The results from Yan et al. showed that ε2 and genotype ε2/ε3 were associated with increased risk of T2DM, genotype ε2/ε2 was not associated with increased risk of T2DM. The inconsistency may be caused by the different subjects included. Yan et al. research included only Chinese Han. Furthermore, we did not reveal the difference in the association of ApoE gene polymorphism with T2DM between ethnicities through subgroup analysis. In addition, our findings are consistent with those of Anthopoulos et al. study[78] which reveals that the ORs for the other ε2-carriers genotypes (ε2/ε2, ε2/ε3, and ε2/ε4) compared to ε3/ε3 were greater than 1.00. The slight difference between the present study and Anthopoulos et al’ is that the OR of ε2/ε2 in our study reaches statistical significance while the OR of ε2/ε3 in Anthopoulos et al’ reaches statistical significance. However, the estimates of the results from Anthopoulos et al’ study are likely to be attenuated due to the small sample size. Our findings demonstrate that individuals with the genotype carrying single allele ε2 (ε2/ε3 and ε2/ε4) are not at the risk of T2DM while those carrying two ε2 allele (ε2/ε2) possess higher risk for T2DM, which also coincides with the finding that the higher frequency of the ε2/APOE allele might be primarily related to T2DM[37].
The strengths of the present study are that, 1) we included all the published literatures on the association between ApoE gene polymorphism and T2DM regardless of regions or ethnicities; 2) we had a large sample size. There are 18 new published papers discussing the association between ApoE gene polymorphism and T2DM since the last meta-analysis published in 2014, all of them are included in our present meta-analysis, which will provide more convincing evidence to the association of ApoE gene polymorphism with T2DM; 3) the results of our sensitivity analysis demonstrate that the conclusion of the present study is very stable; 4) the results of publication bias analysis reveal that the conclusion of our study is absent of publication bias. However, our study also has several weaknesses, 1) presence of heterogenicity in our study. We did the subgroup analysis on HWE, genotyping methods and ethnicities, but we did not trace the source of heterogenicity; 2) since the present study is a case-control study, the findings of our study cannot provide the causal relationship between ApoE gene polymorphism and T2DM, only the association of ApoE gene polymorphism with T2DM.
-
There is an association between ApoE polymorphism and T2DM: allele ε4 and genotypes (ε2/ε2, ε3/ε4, and ε4/ε4) are associated with the increased risk for the development of T2DM, and they may be risk factors for T2DM.
-
The funding body has no role in the design of the study and collection, analysis, and interpretation of data and in writing the manuscript.
-
REN Shu Ping concepted and designed the study; CHEN Da Wei, SHI Ji Kang, LI Yun, and YANG Yu collected, and assembled the data; CHEN Da Wei and SHI Ji Kang analyzed and interpreted the data; CHEN Da Wei, SHI Ji Kang, and REN Shu Ping contributed to the writing process.
Funds:
This work was supported by the Jipa Ruida Environmental Inspection Corporation Limited, Beijing under Grant Radioactive Diagnosis and Treatment Construction Project-Radiation Protection and Evaluation [Grant No. 2016YX137]; and Jilin Province Pharmacy Operation Corporation, Limited [Grant No.371182093427]

 Quick Links
 DownLoad: