


HTML
-
The epidemic and burden of type 2 diabetes mellitus (T2DM) are major public health issues and the biggest challenges for human beings because of the disease’s increasing prevalence in the world. In 2017, the International Diabetes Federation (IDF)[1] estimated that age-adjusted prevalence of diabetes was 8.8% (7.2%–11.3%): 8.4% in women and 9.1% in men, and about 79% of adults with diabetes live in developing countries. In China, the prevalence of T2DM in adults aged 18 years or older was estimated to be 11.6% [95% confidence interval (CI) 11.3%–11.8%] in 2010: 11.0% (95% CI, 10.7%–11.4%) in women and 12.1% (95% CI, 11.7%–12.5%) in men.[2]
The onset of T2DM is characterized by abnormal serum glucose and often accompanied by dyslipidemia[3,4]. A cohort study[5] of 19,476 adults aged 35–74 years in eight European countries and a cross-sectional study[6] of 46,239 adults aged 20 years or older in China revealed that triglycerides (TG) and total cholesterol (TC) levels of patients with T2DM were higher than those patients without diabetes. Meanwhile, increasing TG[7,8] and TC[9-11] were positively associated with diabetes incidence. A cross-sectional study of Qingdao Diabetes Survey Group[12] also showed the same association in Chinese adults.
It is well known that body mass index (BMI), an important risk factor for T2DM and a basis for classification of obesity, has been explored for the prediction of T2DM[13,14]. TG[7,8,15,16] and TC[10,11] were also reported to be positively associated with T2DM. Their possibility to predict T2DM have also been discussed in some studies[17-20]. A cohort study[18] of 5,201 Iranian participants aged 20 years and more reported the optimal cutoff values of TG but low accuracy for TG predicting diabetes. However, moderate accuracy was reported in not only the Chinese[19] but also the American[17] and European[20] populations. The cross-sectional study from the Rancho Bernardo Study of 1,549 American aged 67 ± 11 years and the validation cohort from the Health, Aging, and Body Composition study of 2,503 American aged 70–79 years showed that TG was as good as the 2-h post-load plasma glucose (2 h PG) test to predict T2DM incidence[17]. Another cross-sectional study of 500 elderly Greek with diabetes indicated that elevated TG level is the strongest single predictor for the presence of metabolic syndrome[20], a major risk factor for T2DM. In addition, no study has reported the predictive value of a single TC. The association between TG, TC, and T2DM incidence was influenced by many factors, such as diet and lifestyle. Besides, the statistical efficiency of the association between TG, TC, and T2DM incidence was impacted by a relatively small sample size in Chinese adults. Therefore, the present study aimed to assess the association between the single indicator of TG and TC at baseline and T2DM incidence based on the follow-up survey of 3 years in the general Chinese population. Further, we proposed to evaluate TG and TC at baseline as a simple tool to predict T2DM incidence.
-
This study comes from the Qingdao Diabetes Prevention Program–a community-based health-promoting study. The designs and strategies of this study have been described in our previous study[21]. For the prevention of T2DM, a cross-sectional survey was conducted in three urban (Shinan, Shibei, and Sifang) and three rural (Huangdao, Jiaonan, and Jimo) districts in Qingdao between 2006 and 2009. A total of 7,824 participants aged 35–74 years and living at least 5 years in Qingdao were recruited at baseline. A follow-up survey for non-diabetic participants was conducted in 2012–2015. TG, TC, fasting plasma glucose (FPG), and 2 h PG in the follow-up survey were measured. Ethical approval was formally reviewed by the Qingdao Municipal Center for Disease Control and Prevention in 2008 and 2014. Informed consent was voluntarily signed by all the participants.
-
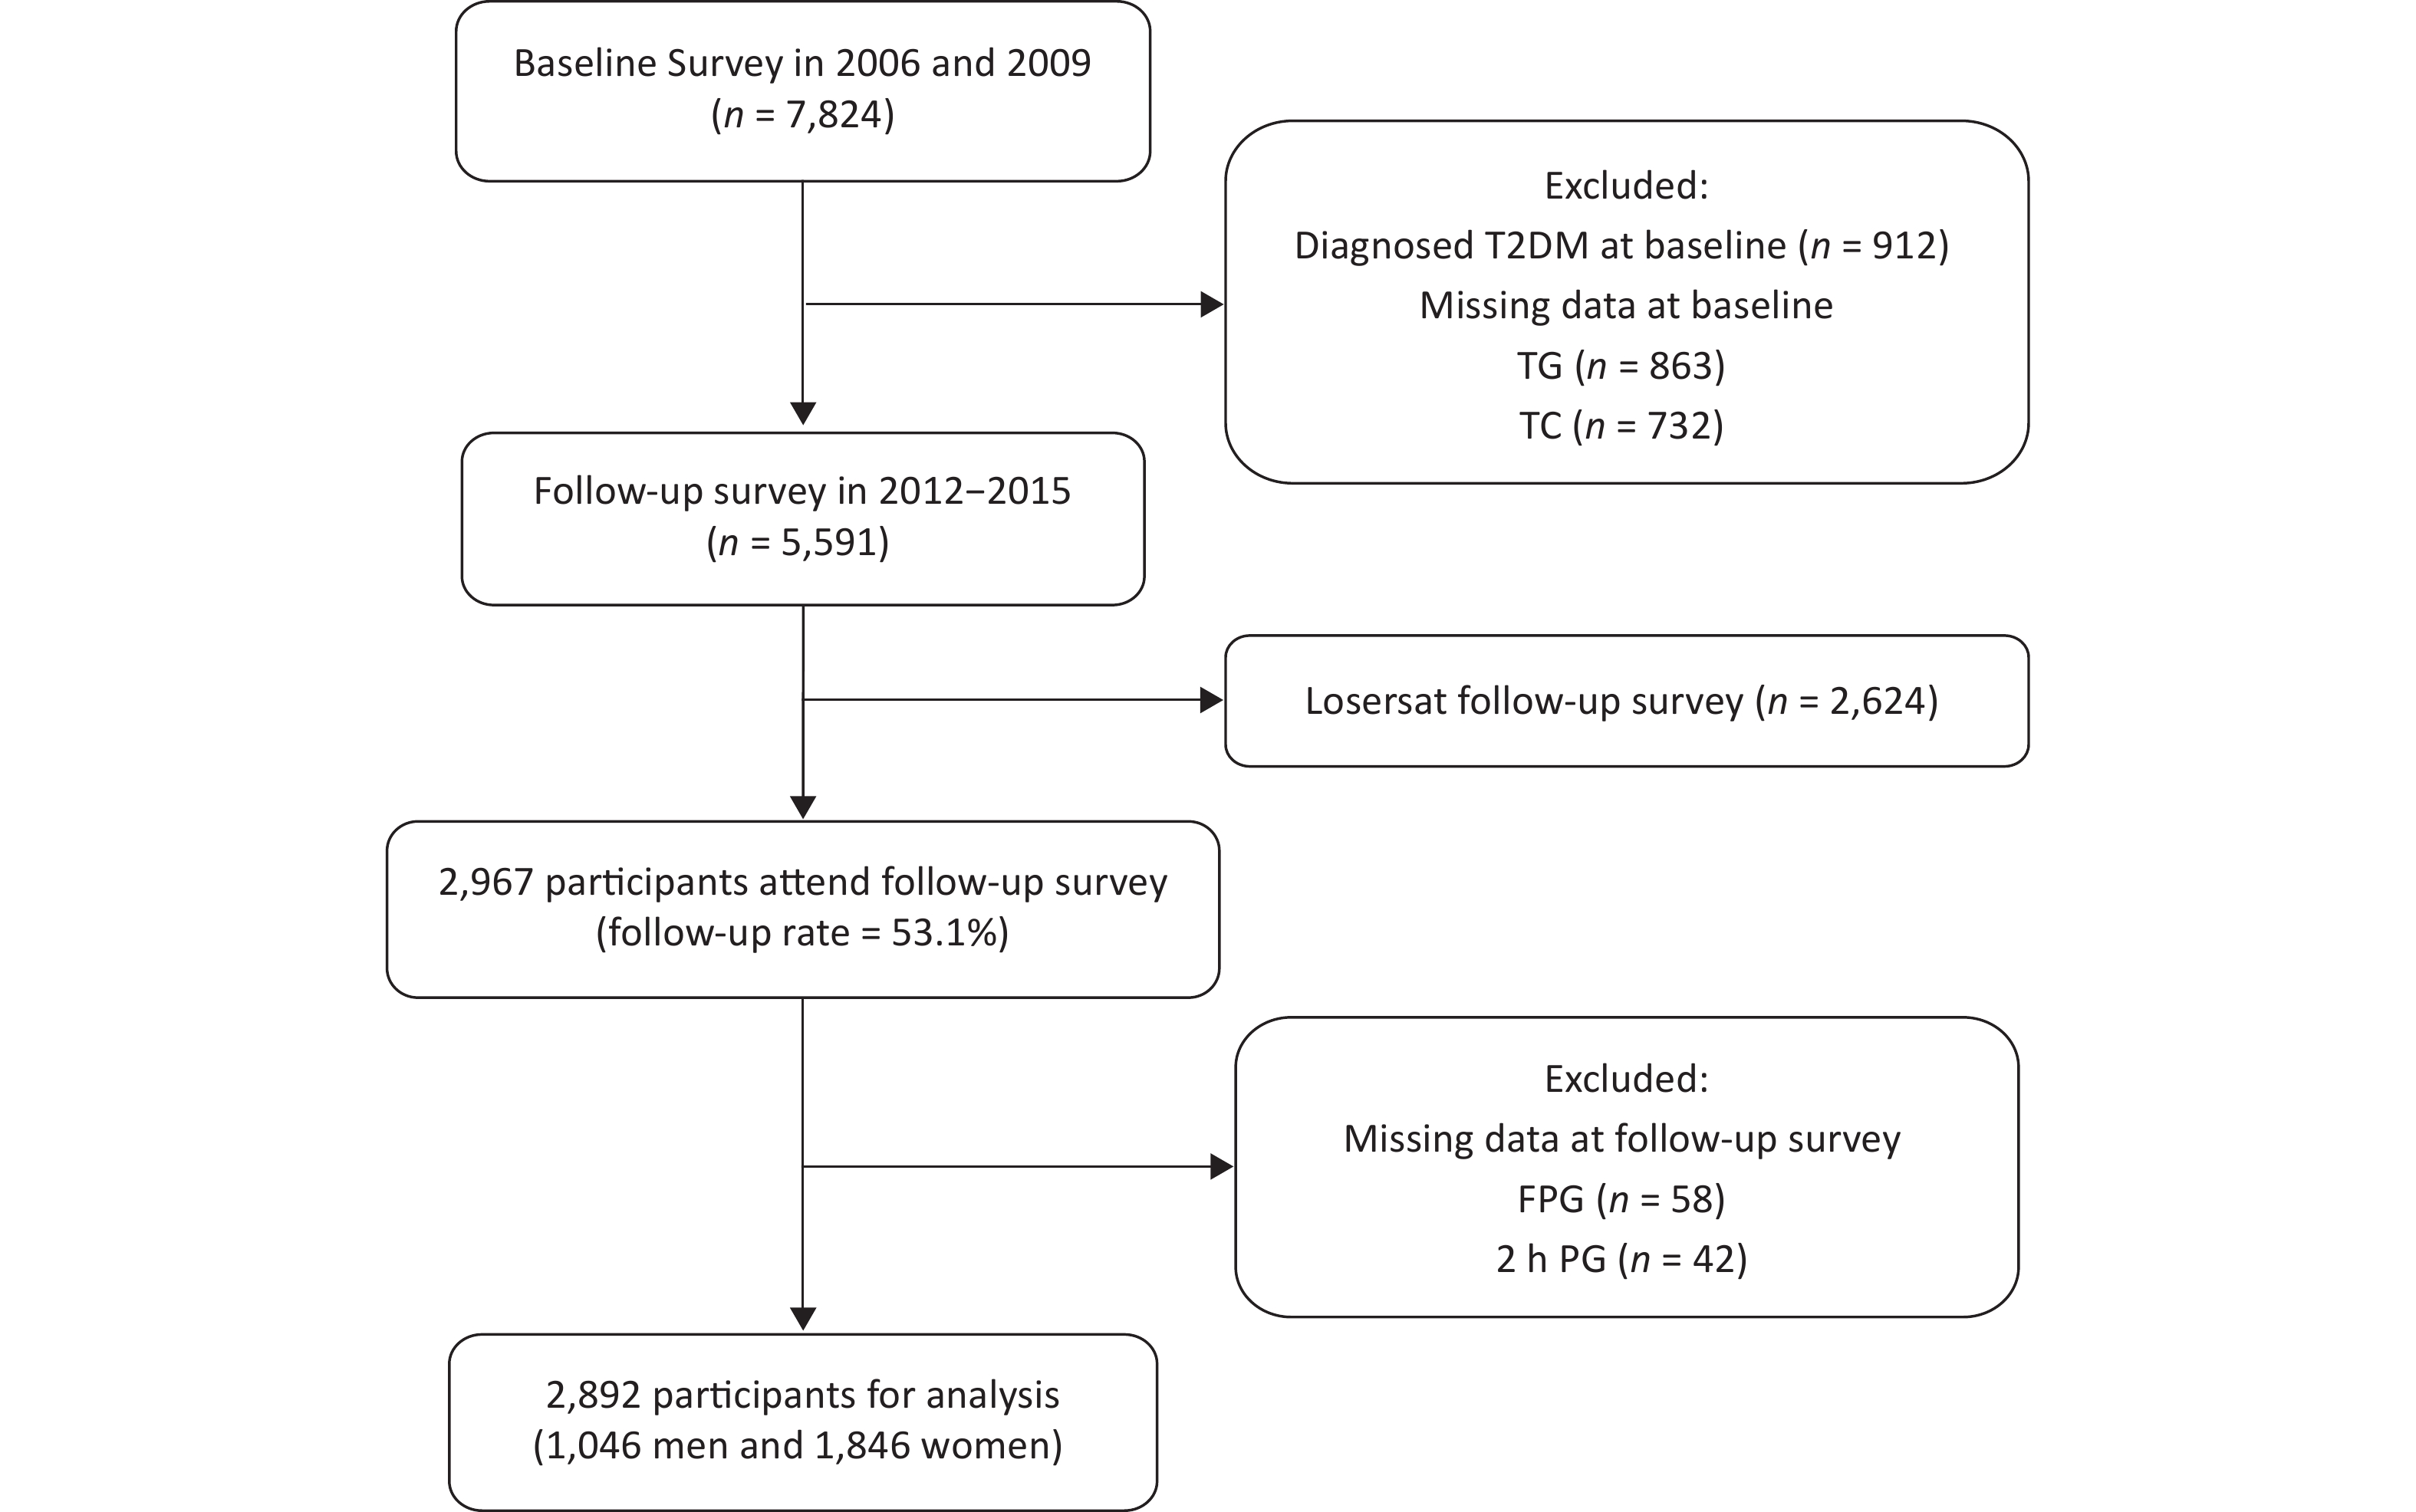
The flow chart of the study sample recruitment is shown in Figure 1. The participants were excluded in the follow-up survey: 912 individuals with T2DM at baseline, 1,321 individuals without FPG, 2 h PG, TG, or TC at baseline, and 2,624 individuals refusing the follow-up survey with or without any reasons. A total of 2,967 individuals (53.1%) were available in the follow-up survey. Finally, 75 individuals were excluded because of missing FPG or 2 h PG results in the follow-up survey, and 2,892 participants (1,046 men and 1,846 women) were included in the final cohort analysis. In this study, we aimed to explore the ability of TG and TC concentrations at baseline to predict the incidence of T2DM in Chinese men and women.
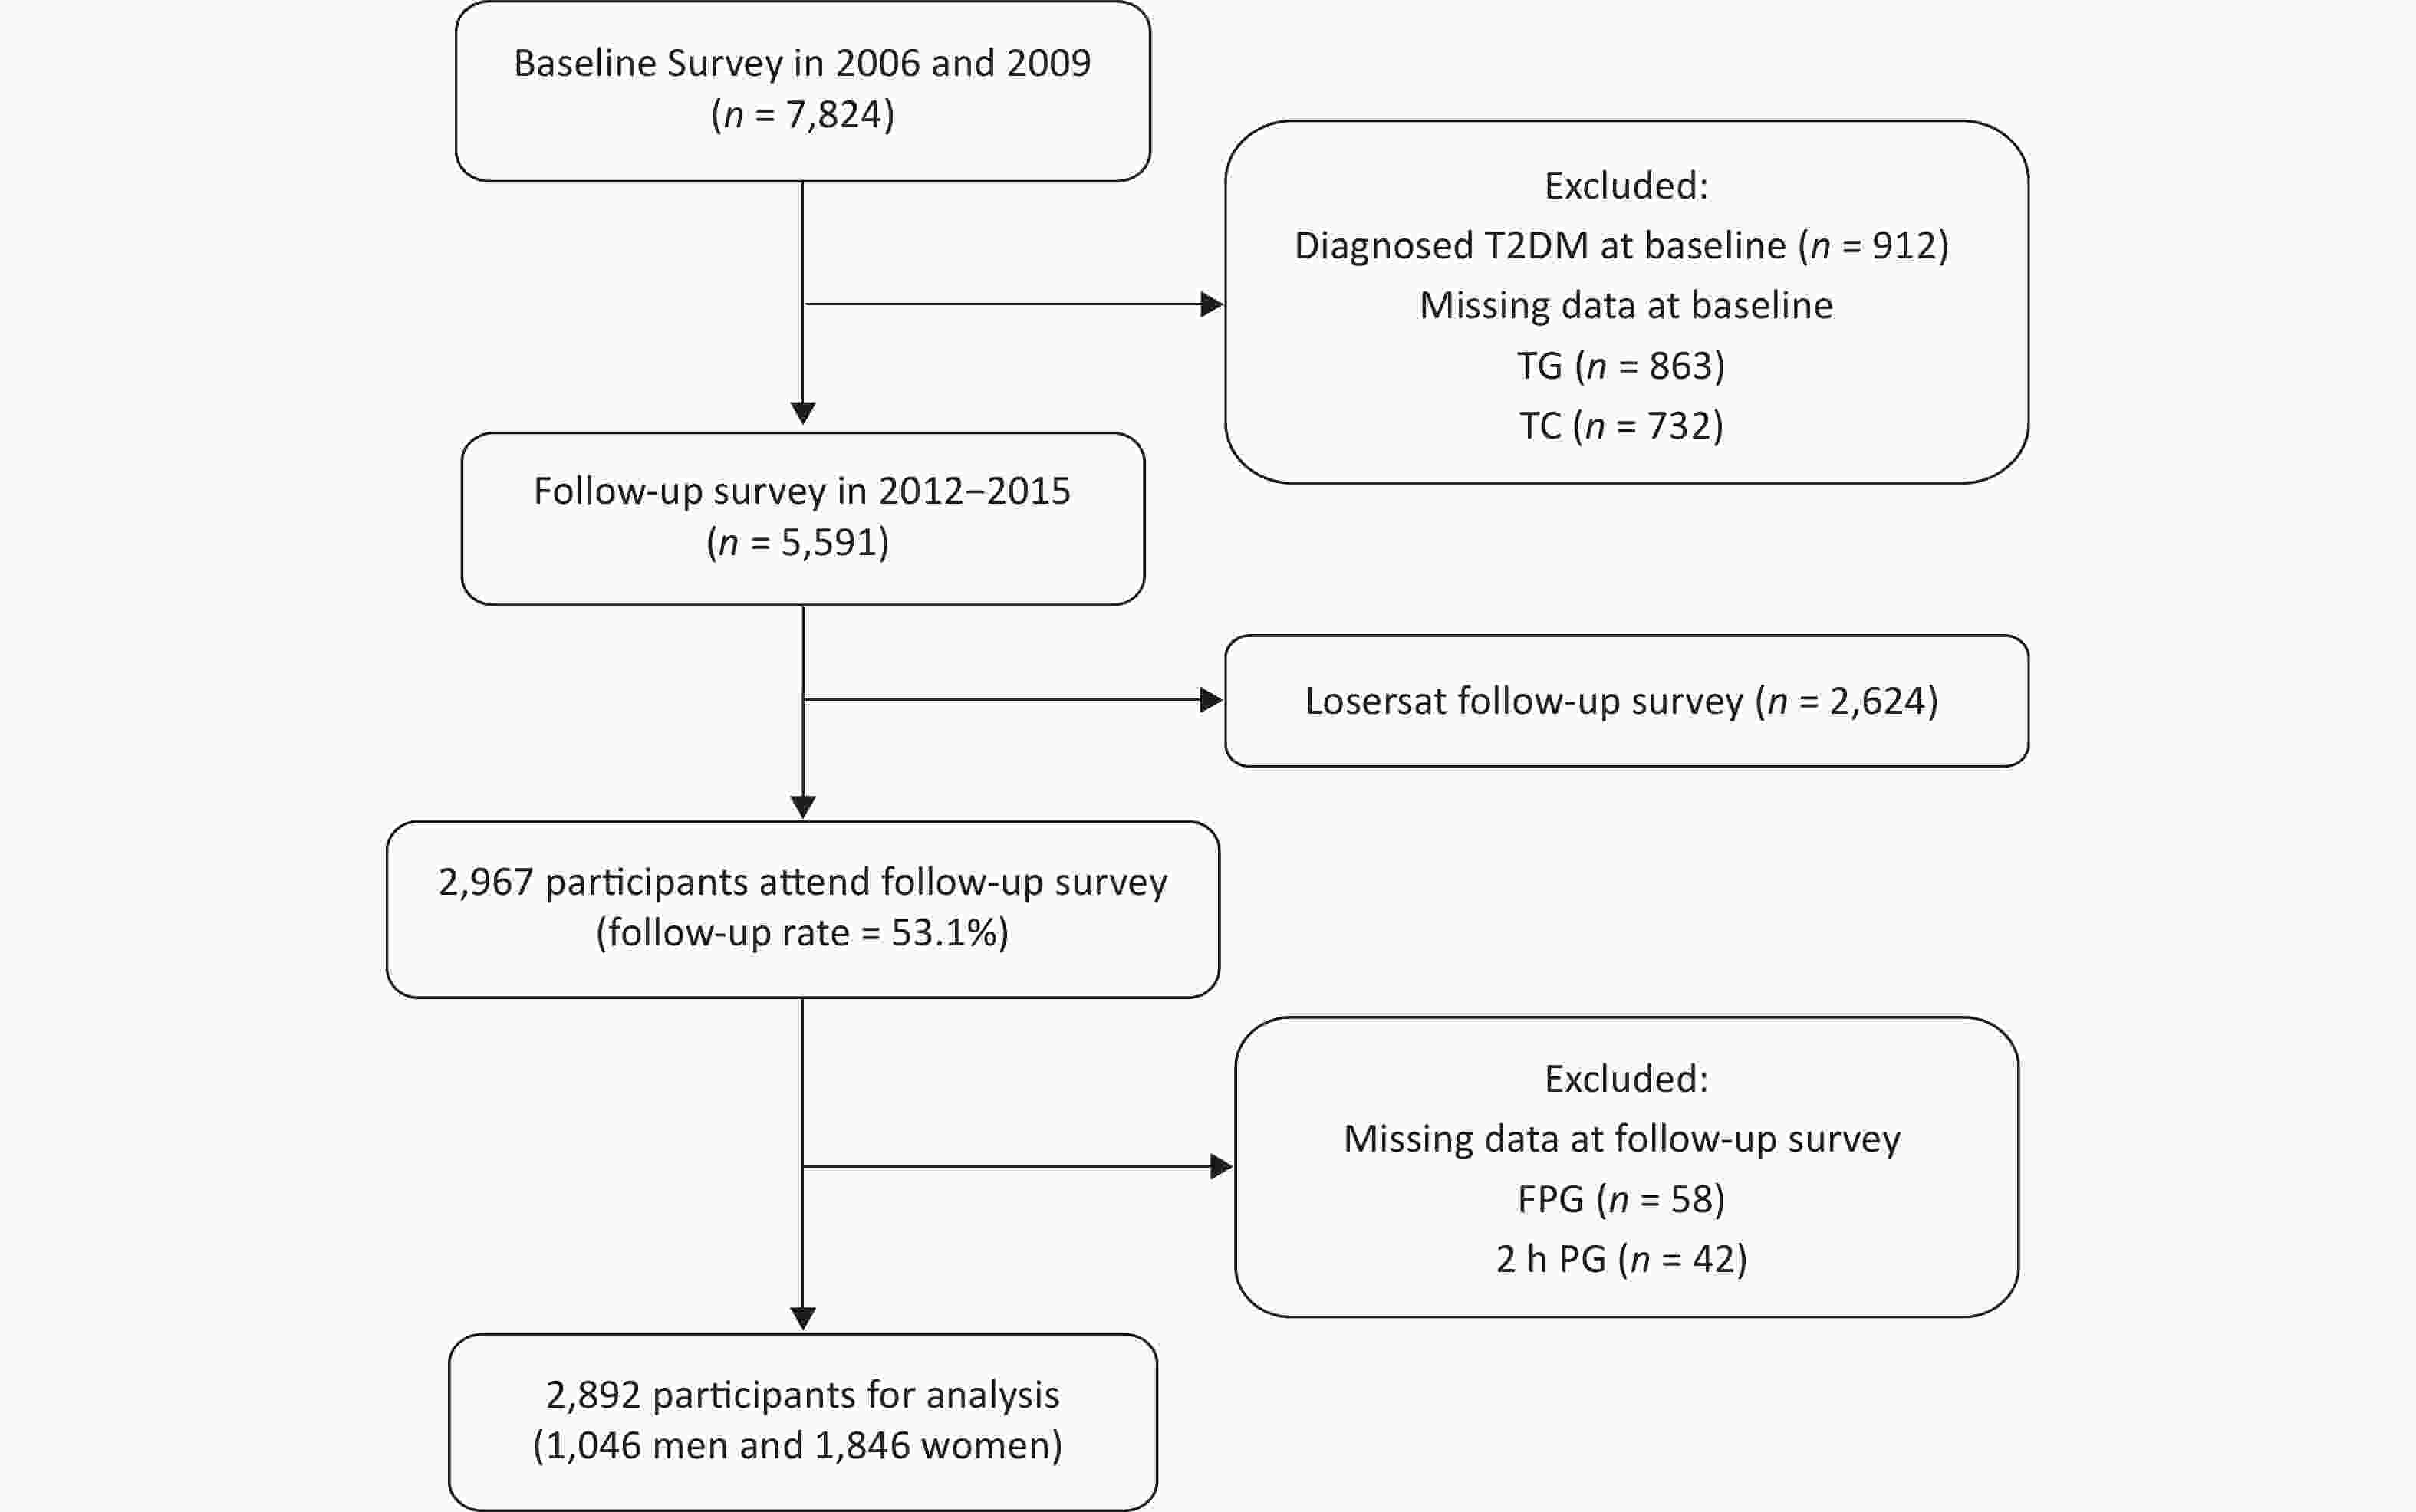
Figure 1. Flow chart of the participants included and excluded in the follow-up analysis. T2DM, type 2 diabetes mellitus; TG, triglycerides; TC, total cholesterol; FPG, fasting plasma glucose; PG, post-load plasma glucose
-
Demographic characteristics (gender, age, marital status, and family history of diabetes), socioeconomic information (educational attainment and personal monthly income), and lifestyle factors (smoking status and alcohol-drinking status) were collected by a standardized questionnaire. The information was obtained by trained doctors and nurses through a face-to-face interview. Marital status was classified as either married (married and cohabiting) or unmarried (single, divorced, and widowed). Participants were considered to have a family history of diabetes if at least one family member (grandparents, parents, sibling, and offsprings) has been diagnosed with diabetes. Educational attainment was categorized according to the number of school years: ≤ 9 years (illiteracy, elementary school, and junior high school) and > 9 years (senior high school and college). There were three categories of personal monthly income: ≤ 599 Chinese Yuan (CNY), 600–1,999 CNY, and ≥ 2,000 CNY. Smoking status was grouped as current smokers and nonsmokers, whereas alcohol-drinking status was determined as current drinkers and nondrinkers.
Height and weight of participants were measured in light clothes and without shoes through calibrated digital scales and height gage. BMI was computed as weight in kilograms divided by height in meters squared (kg/m2).
Blood pressure measurement was taken on the participants’ right upper arm while sitting and using a mercury hemopiezometer. Blood pressure was remeasured after at least 30 s apart. Hypertension was defined as follows: a self-reported history of hypertension, systolic blood pressure ≥ 140 mmHg, and/or diastolic blood pressure ≥ 90 mmHg.
Fasting blood samples were collected after a 10-h overnight fast at both baseline and follow-up, then a standard 75 g oral glucose tolerance test at 2 h was performed to determine plasma glucose in non-diabetic participants. Plasma glucose was determined using the glucose oxidase method. TG, TC, and uric acid (UA) were analyzed using enzymatic methods. High-density lipoprotein cholesterol (HDL-C) was determined by a direct method.
-
Pathoglycemia was diagnosed according to the 2006 World Health Organization/IDF standards[22]. T2DM was defined as any of the following: FPG ≥ 7.0 mmol/L, 2 h PG ≥ 11.1 mmol/L, self-reported clinician’s diagnosis, and/or antidiabetic medication use. In the current analysis, data of FPG and 2 h PG were available for the baseline and follow-up surveys.
The categories of TG and TC were made according to the guideline of the Chinese Heart Association[23]. Participants were divided into three TG categorical groups as follows: normal TG (TG < 4.1 mmol/L), borderline high TG (BHTG; 4.1 ≤ TG < 4.9 mmol/L), and hypertriglyceridemia (TG ≥ 4.9 mmol/L). Participants were also subdivided as follows: normal TC (TC < 5.2 mmol/L), borderline high TC (BHTC; 5.2 ≤ TC < 6.2 mmol/L), and hypercholesterolemia (TC ≥ 6.2 mmol/L). Baseline data of TG and TC were applied in the current analysis.
-
In our previous study, the prevalence of diabetes in women between 35 and 74 years old was marginally lower than that in men in 2002 and 2006[24]. Therefore, all analyzes were stratified by sex. The follow-up duration was measured in years, from the date of baseline assessment to the onset date of T2DM or to follow-up in September 2015. All continuous variables were non-normal distribution except BMI. T-test and Mann–Whitney U test were used to compare the differences in continuous normal and non-normal data, respectively. Chi-squared test was used to compare the differences in categorical variables. Cox regression model was used to estimate the association between TG, TC, and T2DM incidence with a hazard ratio (HR) and 95% CIs. The adjusted variables included age, BMI, family history of diabetes, demographic factors (educational attainment, marital status, geographic division, and monthly income), lifestyle factor (smoking and alcohol-drinking status), and health indicators at baseline (hypertension, HDL-C, and UA). TG and TC values were used to construct receiver operating characteristic (ROC) curves. We estimated the area under the ROC (AUROC) curve to examine the accuracy of prediction of TC and TG. AUROC values, ranging from 0 to 1.0, were classified using the system described by Swets[25] as follows: ≤ 0.5, no better than chance; 0.5–0.7, low accuracy; 0.7–0.9, moderate accuracy; and ≥ 0.9, high accuracy. The optimal cutoffs of TG and TC to predict T2DM incidence were chosen according to maximizing Youden index. With these values, we calculated sensitivity, specificity, the positive likelihood ratio (LR+), and the negative LR (LR−). LR+ and LR− were interpreted against the following reference values: LR+ > 10 or LR− < 0.1, large change (in the probability of T2DM); LR+ 5–10 or LR− 0.1–0.2, discrete change; LR+ 2–5 or LR− 0.2–0.5, small but important change; and LR+ < 2 or LR− > 0.5, minimal practical utility. All analyzes were performed by SPSS (version 20.0). The statistical significance was at P < 0.05. ROC curves were performed using MedCalc (version 15.2.2).
Study Design
Study Population
Data Collection
Outcome Definitions
Statistical Analysis
-
The baseline characteristics of the follow-up population are shown in Table 1. A total of 2,892 individuals were recruited, and more than half of them were women (63.8%). Simultaneously, the women had a younger age, fewer school years, lesser personal monthly income, higher rural living percentage, higher smoking status, higher alcohol-drinking status, hypertension, higher BMI, lower FPG and UA median, and higher 2 h PG results compared with men (P all < 0.05). After 3.0 years of follow-up, 114 men (10.9%) and 172 women (9.3%) were diagnosed with T2DM.
Characteristics Men Women P-value Number, (%) 1,046 (36.2) 1,846 (63.8) < 0.001 Age, (years) 52.1 ± 11.0 50.3 ± 9.7 < 0.001 School years > 9, n (%) 255 (24.4) 365 (19.8) 0.003 Unmarried, n (%) 58 (5.6) 86 (4.7) 0.286 Rural living, n (%) 867 (82.9) 1,410 (76.4) < 0.001 Personal monthly income, n (%) < 0.001 ≤ 599 476 (46.9) 1,113 (62.7) 600–1,999 435 (42.9) 621 (35.0) ≥ 2,000 103 (10.2) 41 (2.3) Family history of diabetes, n (%) 105 (10.3) 210 (11.5) 0.318 T2DM in the follow-up survey, n (%) 114 (10.9) 172 (9.3) 0.171 Follow-up duration (years) 3.14 3.19 0.174 Current smoking, n (%) 594 (57.1) 62 (3.4) < 0.001 Current alcohol-drinking status, n (%) 449 (43.1) 16 (0.9) < 0.001 BMI (kg/m2) 24.9 ± 3.4 25.5 ± 3.6 < 0.001 Hypertension, n (%) 518 (50.0) 802 (43.9) 0.002 TG (mmol/L) 1.03 (0.74, 1.56) 1.08 (0.77, 1.60) 0.267 TC (mmol/L) 5.16 (4.58, 5.77) 5.14 (4.56, 5.83) 0.843 FPG (mmol/L) 5.6 (5.2, 6.1) 5.5 (5.1, 5.9) < 0.001 2 h PG (mmol/L) 6.2 (5.1, 7.5) 6.5 (5.6, 7.7) < 0.001 HDL-C (mmol/L) 1.57 (1.34, 1.87) 1.60 (1.38, 1.85) 0.059 UA (μmol/L) 341 (294, 395) 267 (228, 311) < 0.001 Note. BMI, body mass index; T2DM, type 2 diabetes mellitus; TG, triglycerides; TC, total cholesterol; FPG, fasting plasma glucose; 2 h PG, 2-hour post-load plasma glucose; HDL-C, high-density lipoprotein cholesterol; UA, uric acid. Table 1. Baseline characteristics of the follow-up population
As shown in Figure 2, higher TG at baseline indicated significantly increased T2DM incidence in women (Ptrend < 0.001) but not in men (P = 0.101). However, higher TC showed significantly increased T2DM incidence in both men (Ptrend = 0.029) and women (Ptrend < 0.001).
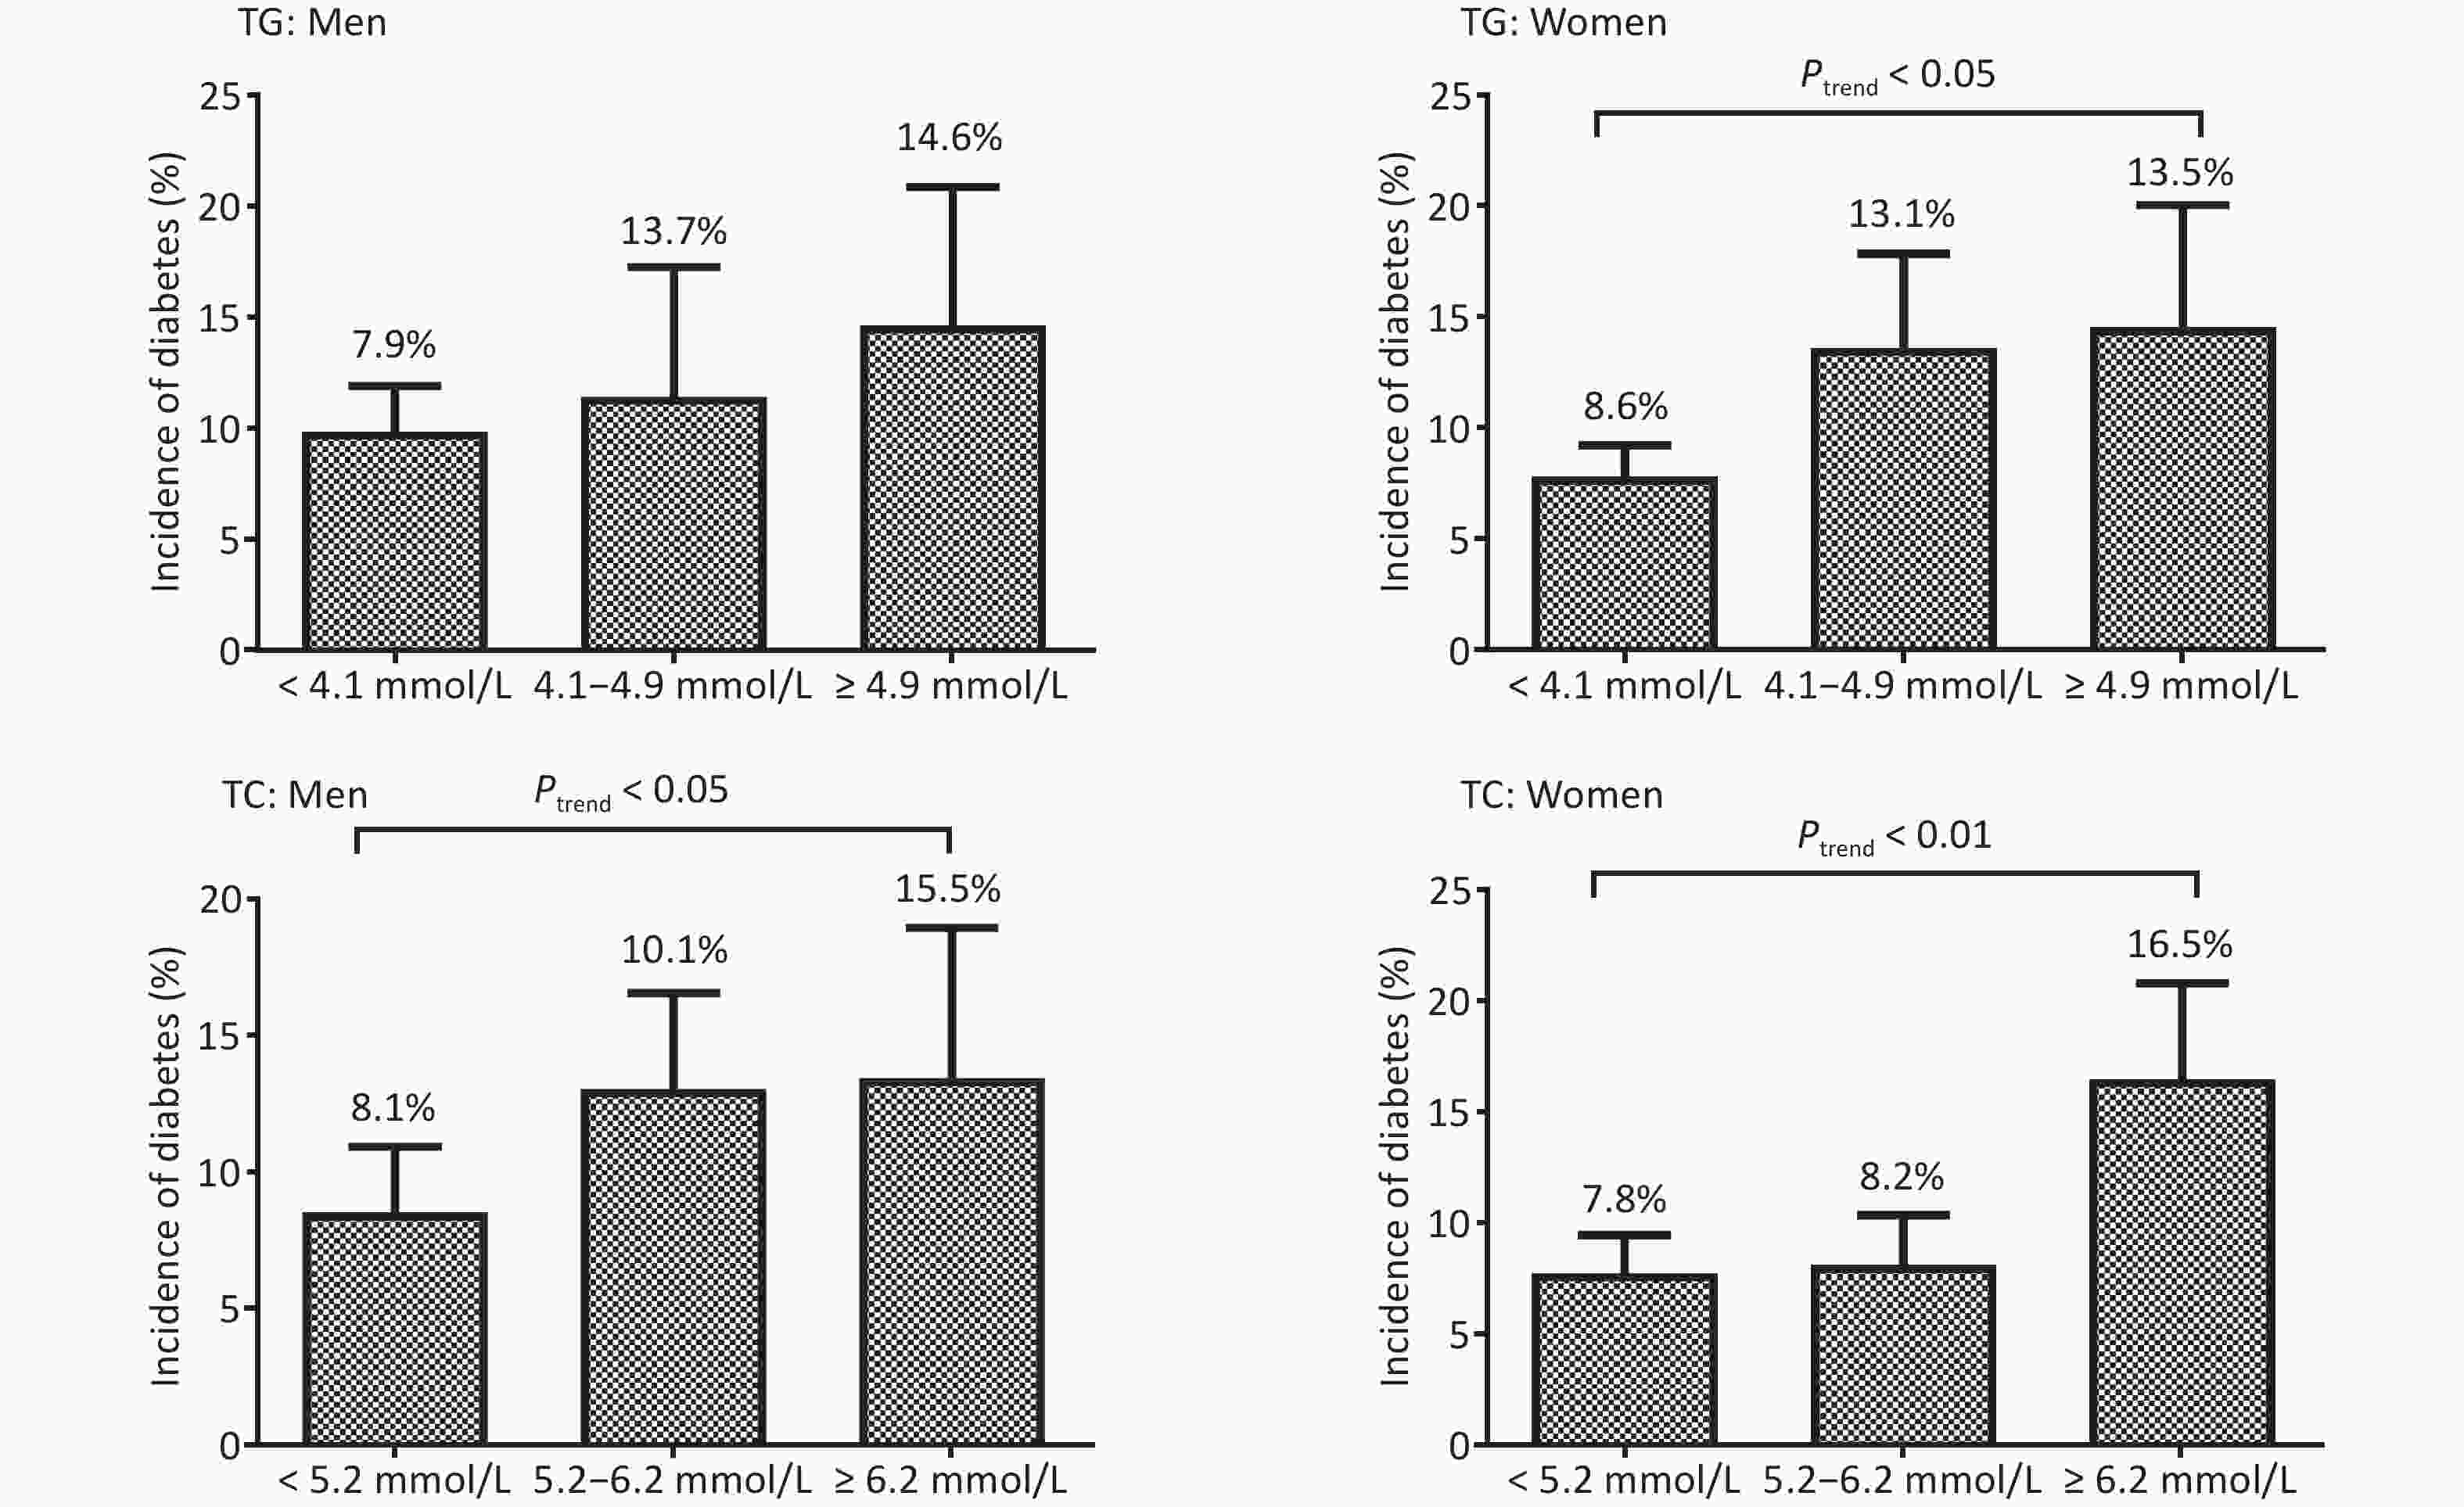
Figure 2. The incidence (%) of type 2 diabetes mellitus in men and women based on the triglycerides (TG) and total cholesterol (TC) levels
Cox regression results were presented in Table 2. Univariate Cox regression showed that higher TG [BHTG (HR: 2.05; 95% CI: 1.40, 3.00), hypertriglyceridemia (HR: 2.64; 95% CI: 1.68, 4.15)] and TC [hypercholesterolemia (HR: 2.05; 95% CI: 1.43, 2.95)] were significantly associated with increased risk of T2DM incidence in women but not in men. Only elevated TC [BHTC (HR: 1.61, 95% CI: 1.04, 2.48)] showed increased risk of T2DM in men even after adjusting for age, BMI, family history of diabetes, school years, marital status, geographic division, personal monthly income, smoking status, alcohol-drinking status, hypertension, HDL-C, and UA. Elevated TG [(hypertriglyceridemia (HR: 1.78; 95% CI: 1.07, 2.97)] and TC [hypercholesterolemia (HR: 1.68; 95% CI: 1.81, 2.61)] still indicated significant association in women in multivariate Cox regression analysis.
Varaibles N Model 1 Model 2 Men Triglycerides (mmol/L) < 4.1 817 1.00 1.00 4.1–4.9 110 1.12 (0.63, 2.02) 1.21 (0.64, 2.31) ≥ 4.9 119 1.42 (0.85, 2.37) 1.77 (0.97, 2.97) Total cholesterol (mmol/L) < 5.2 532 1.00 1.00 5.2–6.2 366 1.49 (1.00, 2.24) 1.61 (1.04, 2.48) ≥ 6.2 148 1.54 (0.91, 2.61) 1.44 (0.82, 2.52) Women Triglycerides (mmol/L) < 4.1 1,434 1.00 1.00 4.1–4.9 255 2.05 (1.40, 3.00) 1.29 (0.84, 1.99) ≥ 4.9 157 2.64 (1.68, 4.15) 1.78 (1.07, 2.97) Total cholesterol (mmol/L) < 5.2 969 1.00 1.00 5.2–6.2 586 1.09 (0.76, 1.56) 0.93 (0.62, 1.39) ≥ 6.2 291 2.05 (1.43, 2.95) 1.68 (1.81, 2.61) Note. Model 1: univariate Cox regression. Model 2: adjusted for age, body mass index (BMI), family history of diabetes, school years, marital status, geographic division, personal monthly income, smoking status, alcohol-drinking status, hypertension, high-density lipoprotein cholesterol (HDL-C), and uric acid (UA). HR, hazard ratio; 95% CI, 95% confidence interval. Table 2. HR and 95% CI of triglycerides and total cholesterol for type 2 diabete mellitus incidence in men and women in Cox regression models
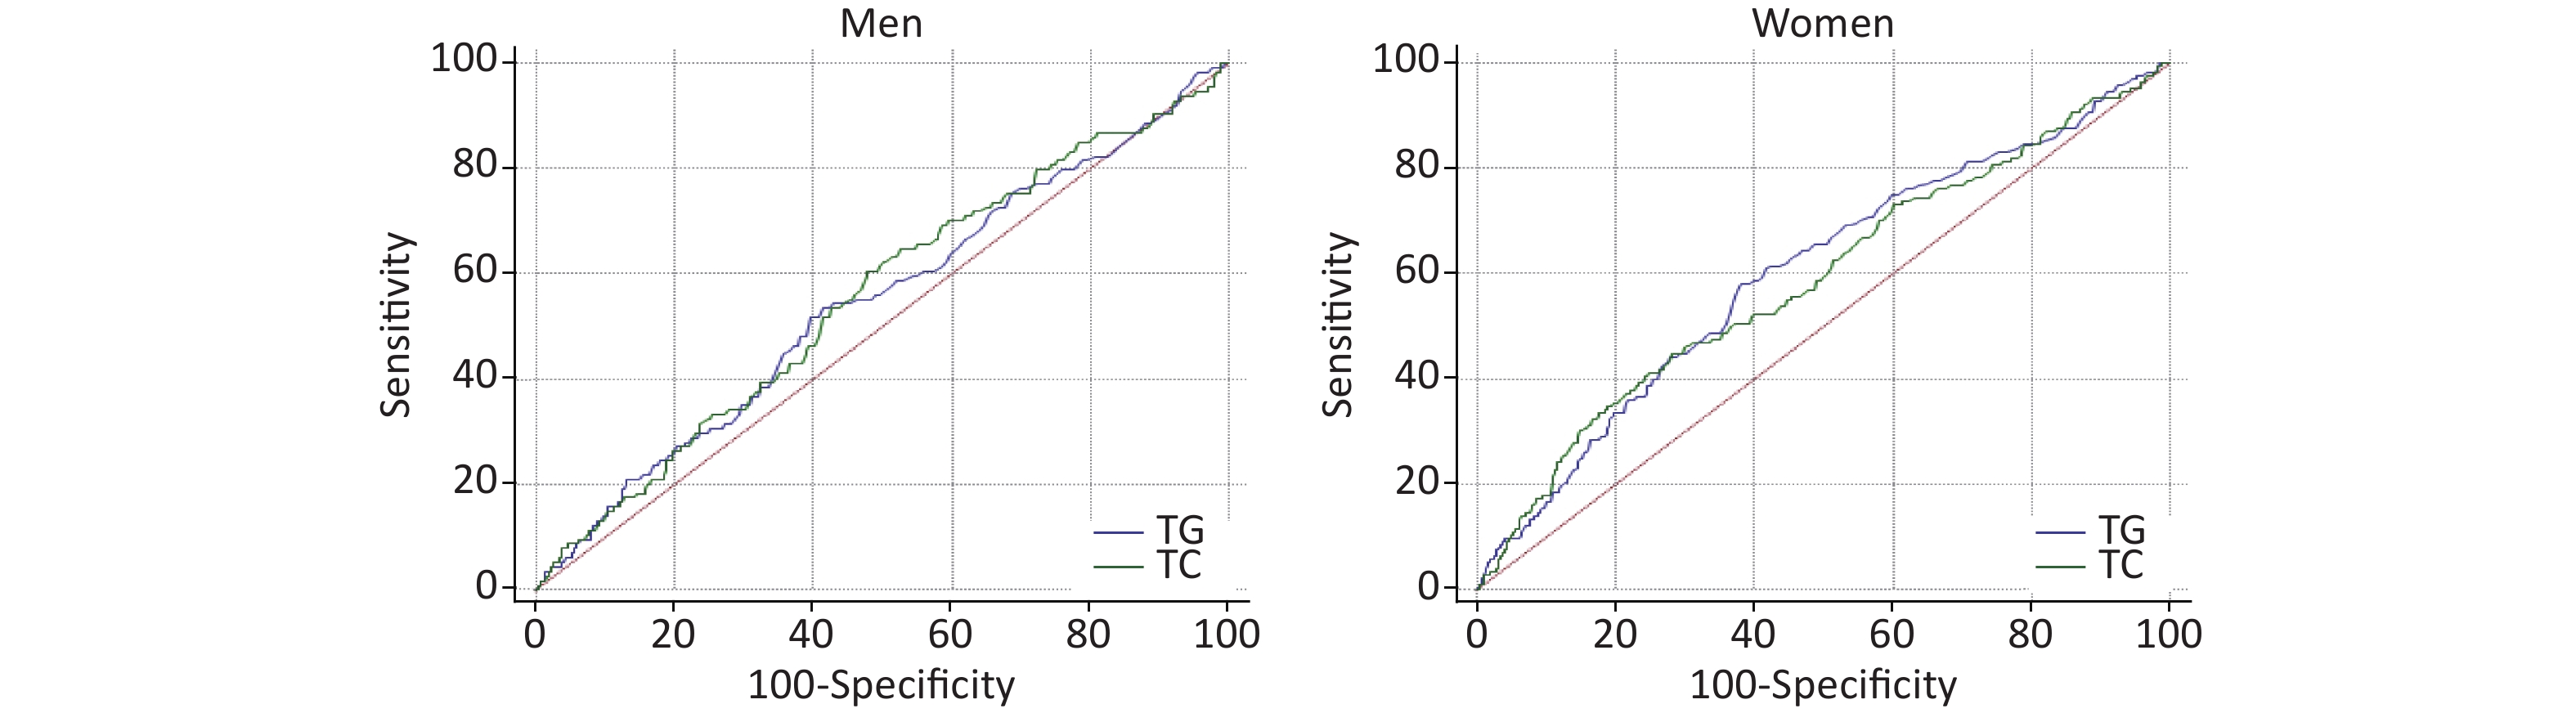
AUROCs of TG and TC for T2DM incidence are presented in Figure 3. AUROCs of TG and TC in women were 0.60 (0.58–0.62) and 0.59 (0.56–0.61), respectively, with P < 0.001, and P > 0.05 for men. But the AUROCs of TG and TC predicting T2DM incidence were not significantly different in men and women.
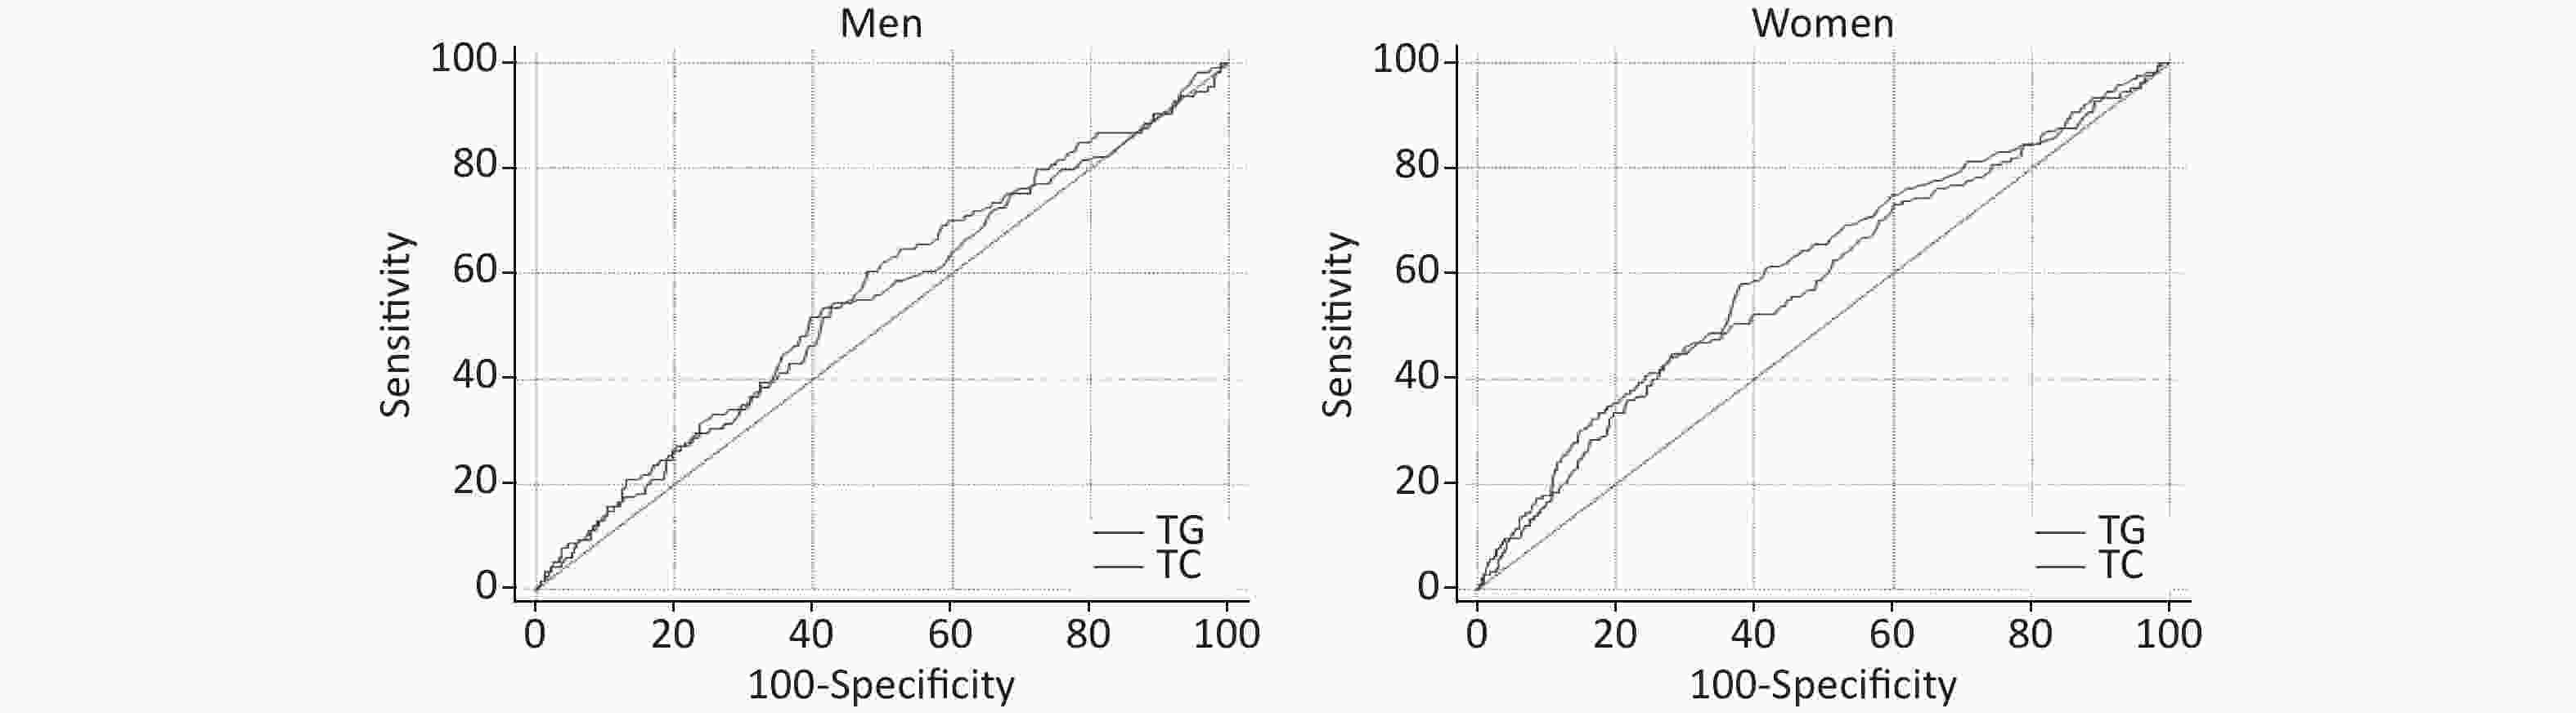
Figure 3. Receiver operating characteristic (ROC) of triglycerides (TG), total cholesterol (TC) predicting type 2 diabetes mellitus (T2DM) incidence in men and women
The optimal cutoff values, sensitivity, specificity, and accuracy of actually identifying subjects with type 2 diabetes for TG and TC are presented in Table 3. The optimal cutoff values of TG and TC were > 1.15 and > 5.17 mmol/L in men, respectively, with low sensitivity [TG: 53.5% (43.9%, 62.9%) TC: 60.5% (50.9%, 69.6%)], low specificity [TG: 58.6% (55.3%, 61.8%); TC: 52.0% (48.8%, 55.3%)], and minimal practical utility [LR+: TG, 1.29 (1.10, 1.60) and TC, 1.26 (1.10, 1.50); LR−: TG, 0.79 (0.60, 1.00) and TC, 0.76 (0.60, 1.00)]. The cutoff values of TG and TC in women were the same as in men with low sensitivity, specificity, and minimal practical utility.
Items AUROC Cut off (mmol/L) Sensitivity (95% CI) Specificity (95% CI) LR+ (95% CI) LR− (95% CI) Men TG 0.54 (0.51, 0.58) > 1.15 53.51 (43.9, 62.9) 58.58 (55.3, 61.8) 1.29 (1.10, 1.60) 0.79 (0.60, 1.00) TC 0.55 (0.52, 0.58) > 5.17 60.53 (50.9, 69.6) 52.04 (48.8, 55.3) 1.26 (1.10, 1.50) 0.76 (0.60, 1.00) Women TG 0.60 (0.58, 0.62) > 1.23 58.14 (50.4, 65.6) 61.65 (59.3, 64.0) 1.52 (1.30, 1.70) 0.68 (0.60, 0.80) TC 0.59 (0.57, 0.61) > 5.77 41.28 (33.8, 49.0) 75.15 (73.0, 77.2) 1.66 (1.40, 2.00) 0.78 (0.70, 0.90) Note. AUROC, area under receiver operating characteristic; T2DM, type 2 diabetes mellitus; 95% CI, 95% confidence interval; LR+, positive likelihood ratio; LR–, negative likelihood ratio. Table 3. AUROC, optimal cutoff value (mmol/L), sensitivity (%), specificity (%), and accuracy of actually identifying subjects with T2DM
-
The present cohort study investigated the association between TG and TC at baseline and T2DM incidence in the follow-up survey and further evaluated whether TG and TC at baseline predicted T2DM incidence in general Chinese adults. Our results confirmed the risk of TG and TC for T2DM incidence in Chinese population but showed no predictive capacity for TG and TC to predict T2DM incidence.
The current results confirmed some associations between elevated TG and TC levels and T2DM incidence in the previous studies. Our another published cross-sectional study of our Qingdao Diabetes Survey Group[12] showed that elevated TG was positively associated with T2DM in adults aged 35–74 years, and elevated TC was found in women. Several previous cohort studies also indicated elevated TG[7,8,15,16] and TC[10,11] levels risk factors for T2DM.
Some studies on TG predicting T2DM incidence have been reported in the past. The Iranian cohort study of 2,173 men and 3,028 women without diabetes aged ≥ 20 years[18] revealed that the optimal cutoff and AUROC of TG was 1.98 mmol/L and 0.62 (0.57, 0.66), respectively, in men, and 1.66 mmol/L and 0.67 (0.65, 0.72), respectively, in women. But the discriminatory power of TG for diabetes incidence indicated low. There were also some studies on TG predicting diabetes incidence in the Chinese population. A 15-year follow-up survey of 687 Chinese individuals[19] and a prospective, population-based cohort study of 571 T2DM cases and 571 controls nested aged 45–74 years[26] displayed that AUROC of TG was 0.747 (0.691–0.803) and 0.73 (0.70–0.75), respectively, and the discriminatory power of TG for diabetes was moderate accuracy, which was different from our current study. In addition, the cross-sectional population-based survey for TG to predict elderly American at risk for diabetes reported that TG, as a part of simple prediction rule, is a better predictor equally well as 2 h PG test[17]. Another cross-sectional study for elderly Greek with diabetes demonstrated that serum TG has the highest predictive capability for metabolic syndrome in the overall population[20]. However, the optimal cutoffs of TG predicting diabetes were not included in these studies. The optimal cutoffs of TG in our current study were lower than those in Iranian men and women[18], the Standards of Medical Care in Diabetes according to the American Diabetes Association, and the diagnostic criteria of metabolic syndrome (TG > 1.7 mmol/L) [27]. There was no study on single index of TC predicting diabetes incidence at present. Only an Iranian cohort study of TC/HDL-C predicting T2DM incidence[18] showed that the discriminatory power for diabetes incidence was low in accuracy, which was similar to our current study, and all were lower than the guideline value released by the Chinese Heart Association (TC ≥ 6.2 mmol/L) [23].
The different age ranges might partly explain our different discriminatory power for TG and TC from other studies. The age of current study was 35–74 years old, whereas other studies were mainly 60 or older[17,20]. The different table manners between Asian and European-American might be another reason for our difference.
Dyslipidemia (elevated TG and TC) and T2DM were closely related to diet, BMI, and exercise. Unger and Zhou[28] and Li et al.[29] pointed out that excessive fatty acid during periods of overnutrition by increasing TG and TC could cause nitric oxide-mediated lipotoxicity in the skeletal muscle and pancreas. Meanwhile, fatty acid overload could cause insulin resistance in the skeletal muscle, β cell dysfunction in pancreatic islets, and diabetes[28]. Autoimmunity was also found to be involved in the association between TG, TC level, and T2DM in Turkish adults[30,31]. Furthermore, it is also conceivable that dyslipidemia, such as evaluated TG and/or TC, is a direct cause of inflammation, endoplasmic reticulum stress, and/or other mechanisms resulting in T2DM[29]. In addition, a Mendelian randomization study[32] revealed that each additional risk allele in the genotype scores of TG was associated with a 2%–3% increased risk for T2DM.
There are some strengths in the current study. First, the current study was a prospective, population-based survey with a relatively large sample size. Second, the association between TG, TC, and T2DM was further explored based on the current study’s TG and T2DM. Third, T2DM incidence was obtained according to FPG, 2 h PG, and self-reported information. However, the current study has some limitations as well. First, the recall bias of demographic characters, socioeconomic information, and lifestyle factors might exist because of the data from self-reports of participants. Second, because of the data collected from an existing Qingdao Diabetes Prevention Program, some variables like low-density lipoprotein, T2DM comorbidities, or other chronic noncommunicable diseases (such as cardiovascular disease) and physical exercise were not collected. The details of smoking and alcohol consumption were missing. Third, the follow-up rate was only 53.1%, and only participants who lived in Qingdao were investigated; thus, the interpretation of our results should be careful. Comparing the baseline characteristics of the participants with that of nonparticipants in the follow-up survey, the nonparticipants group had fewer women, was slightly younger, had higher TG, TC, 2 h PG, and lower HDL-C than participants. However, there was no difference in marital status, smoking status, and FPG level. Therefore, the participants cannot represent the entire population, and our results should be carefully interpreted. Fourth, a 3-year average follow-up duration was short for lipid (TG, TC, etc.) and T2DM, which may have an impact on our results. Finally, the current study only analyzed the possible association between TG and TC at the baseline and T2DM incidence, although TG and TC were measured at both baseline and follow-up.
-
In summary, evaluated TG in men and women and TC in men at baseline were associated with increased T2DM incidence. The optimal cutoff values of TG were > 1.15 and > 1.23 mmol/L in men and women, respectively. And for TC, these values were > 5.17 and > 5.77 mmol/L in men and women, respectively. However, both TG and TC showed no practical utility to identify T2DM incidence in Chinese men and women. Hence, TG and TC levels in both Chinese men and women might be used to decrease the incidence of T2DM but no clinical predictive capacity for T2DM.
-
We thank the participants, primary care doctors, and nurses who participated in this survey. We are grateful to Prof. QIAO Qing and Prof. PANG Zeng Chang for helping us in experimental designing and manuscript preparation.

 Quick Links
 DownLoad: