


-
INTRODUCTION
Cardiovascular disease (CVD) was ranked as the leading global cause of death in 1990 and 2010. The global death rate associated with CVD for individuals aged 15 to 49 was 10.7% in female patients and 12.8% in male patients in 2010[1]. In China, the number of all-age deaths from CVD was approximately 3.7 million in 2013, which increased by 46% from 1990[2]. Increased carotid artery intima-media thickness (CIMT) and carotid plaque as manifestations of carotid atherosclerosis have been used as markers of CVD, and several studies have suggested that the predictive ability of carotid plaque for CVD is better than that of CIMT[3-8].
Metabolic syndrome (MetS) is characterized by a cluster of signs of metabolic disturbance, e.g., visceral obesity, dyslipidemia, hyperglycemia, and arterial hypertension[9]. The prevalence of MetS is about 27.0% in urban adults in Northeastern China[10], and MetS has reached epidemic proportions, even in adolescents[11]. Patients with MetS were more likely to have new plaques, carotid stenosis[12], and increased intima-media thickness (IMT)[13]. Association between MetS and IMT[14] was observed in various study populations[15-19], however, the findings were inconsistent [20,21]. In the current study, we explored the association between MetS and carotid atherosclerosis by measuring CIMT and carotid plaque.
HTML
-
From 2010 to 2014, all residents from the Jidong and Kailuan communities were invited to participate in this research. Previous publications have described the study design and population[22,23]. Only participants aged 40 years or older were evaluated for carotid plaques and CIMT by ultrasound. Participants were excluded when they did not meet the inclusion criteria as follows: (1) no history of stroke, transient ischemic attack, or coronary disease at baseline as assessed by a validated questionnaire; (2) absence of neurologic deficits indicating previous stroke determined via examination by experienced physicians; (3) all necessary data are completed and available. Finally, the present study included 8,933 participants. The study was conducted according to the guidelines of the Helsinki Declaration and was approved by the Ethics Committee of Jidong Oilfield Inc. Medical Centers and Kailuan General Hospital. Written informed consent was obtained from all participants. The participants were also informed of abnormal findings and the recommended treatment[24].
-
MetS was defined according to previously published criteria from the International Diabetes Federation[25]. The definition includes the presence of central obesity (waist circumference ≥ 90 cm for Chinese men and ≥ 80 cm for Chinese women), plus at least two of the following factors: triglycerides (TG) ≥ 150 mg/dL (1.7 mmol/L) or specific treatment for elevated triglyceride concentrations; high-density lipoprotein cholesterol (HDL-C) < 40 mg/dL (1.03 mmol/L) in men and < 50 mg/dL (1.29 mmol/L) in women, or specific treatment for low HDL-C; systolic blood pressure (SBP) ≥ 130 mmHg or diastolic blood pressure (DBP) ≥ 85 mmHg, or treatment of previously diagnosed arterial hypertension; fasting plasma glucose (FPG) ≥ 100 mg/dL (5.6 mmol/L) or previously diagnosed type 2 diabetes mellitus.
-
Carotid plaques were evaluated using duplex sonography (Philips iU-22 ultrasound system, Philips Medical Systems, Bothell, WA, USA) by two independent certified sonographers who were unaware of the baseline information and laboratory results of the participants. Bilateral carotid arteries, including the common carotid artery, carotid bifurcation, and internal and external carotid arteries, were examined. The carotid plaque was defined as either a focal structure encroaching into the arterial lumen by at least 0.5 mm or 50% of the surrounding CIMT value, or a focal structure with a thickness of 1.5 mm from the intima-lumen interface to the media adventitia interface. CIMT was measured at the far wall of the common carotid artery proximal to the bifurcation, along a plaque-free segment of ≥ 10 mm long at each side, with a quality index of ≥ 0.60. The mean value of bilateral common CIMT was used in the present study.
-
Questionnaires were used to collect information from the participants, including demographic variables, history of disease, lifestyle, and drug history. Clinical characteristics and biochemical indicators were assessed at Jidong Oilfield Inc Medical Centers and Kailuan General Hospital[22,23,26]. The covariates included age, sex, education level, monthly per capita income, smoking, alcohol intake, low-density lipoprotein cholesterol (LDL-C) and uric acid. Education level was classified as ‘illiteracy or primary school’ ‘middle school’ or ‘college or above’. Average monthly income was classified as ‘< ¥3,000’ ‘¥3,001−5,000’ or ‘> ¥5,000’. Smoking status and drinking status were classified as ‘current’ or ‘else’ (including ‘former’ or ‘never’). Physical activity was classified as inactive (none), moderately active (1−149 min/week of moderate intensity or 1−74 min/week of vigorous intensity), or very active (≥ 150 min/week of moderate intensity or ≥ 75 min/week of vigorous intensity).
-
The independent samples t-test was used to compare differences in CIMT between participants with and without MetS. Continuous variables were described using means ± standard deviations. Categorical variables were described using frequencie and percentages and compared using the chi-squared test. Logistic regression models were used to assess the association between MetS and carotid plaques. The association between MetS and CIMT was evaluated using multiple linear regression model analysis. All statistical tests were two sided, and the significance level was P < 0.05. The statistical analyses were carried out using SAS 9.4 software (SAS Institute Inc, Cary, NC, USA).
Study Design and Population
Definition of MetS
Assessments of Carotid Plaques and CIMT
Covariates
Statistical Analysis
-
Of the 8,933 participants, 3,461 were found to have metabolic syndrome. Compared to participants without MetS, those with MetS were significantly older, had a lower education level and family income, and were more likely to consume alcohol. Waist circumference, uric acid, FPG, SBP, DBP, TG, LDL-C, and total cholesterol (TC) were significantly higher in participants with MetS than those without MetS, while HDL-C was significantly lower (P < 0.001) (Table 1).
Characteristics Total With metabolic syndrome Without metabolic syndrome P-value N 8,933 3,461 5,472 Age (years) 54.21 ± 10.81 55.51 ± 10.03 53.38 ± 11.21 < 0.001 Male, n (%) 4,940 (55.30) 1,799 (57.40) 3,141 (51.98) < 0.001 Education, n (%) < 0.001 Illiteracy/primary school 907 (10.16) 394 (11.39) 513 (9.38) Middle school 5,631 (63.04) 2,243 (64.83) 3,388 (61.92) College or above 2,394 (26.80) 823 (23.79) 1,571 (28.71) Income, ¥/month, n (%) 0.001 < 3,000 6,449 (72.21) 2,535 (73.27) 3,914 (71.54) 3,001–5,000 2,070 (23.18) 801 (23.15) 1,269 (23.20) > 5,000 412 (4.61) 124 (3.58) 288 (5.26) Currently smoking, n (%) 2,063 (27.87) 799 (27.46) 1,264 (28.13) 0.527 Currently consuming alcohol, n (%) 1,821 (20.39) 759 (21.93) 1,062 (19.41) 0.039 Physical activity, n (%) 0.068 Inactive 3,144 (35.20) 1,175 (33.95) 1,969 (35.98) Moderately active 1,755 (19.65) 672 (19.42) 1,083(19.79) Very active 4,034 (45.16) 1,614 (46.63) 2,420 (44.23) Waist circumference (cm) 87.67 ± 9.83 93.68 ± 7.59 83.86 ± 9.17 < 0.001 Uric acid (µmol/L) 290.86 ± 87.39 312.20 ± 90.82 277.40 ± 82.37 < 0.001 FPG (mmol/L) 3.01 ± 2.22 3.46 ± 2.43 2.72 ± 2.02 < 0.001 SBP (mmHg) 131.11 ± 19.92 137.20 ± 19.43 127.25 ± 19.25 < 0.001 DBP (mmHg) 83.10 ± 12.00 86.37 ± 12.06 81.03 ± 11.48 < 0.001 TG (mmol/L) 1.69 ± 1.41 2.34 ± 1.77 1.27 ± 0.90 < 0.001 HDL-C (mmol/L) 1.47 ± 0.44 1.35 ± 0.41 1.54 ± 0.45 < 0.001 TC (mmol/L) 4.91 ± 0.98 5.23 ± 1.08 4.72 ± 0.86 < 0.001 LDL-C (mmol/L) 2.63 ± 0.71 2.82 ± 0.79 2.51 ± 0.62 < 0.001 Note. FPG, fasting plasma glucose; SBP, systolic blood pressure; DBP, diastolic blood pressure; TG, triglycerides; HDL-C, high-density lipoprotein cholesterol; TC, Total cholesterol; LDL-C, low-density lipoprotein cholesterol. Table 1. Characteristics of study population with and without metabolic syndrome
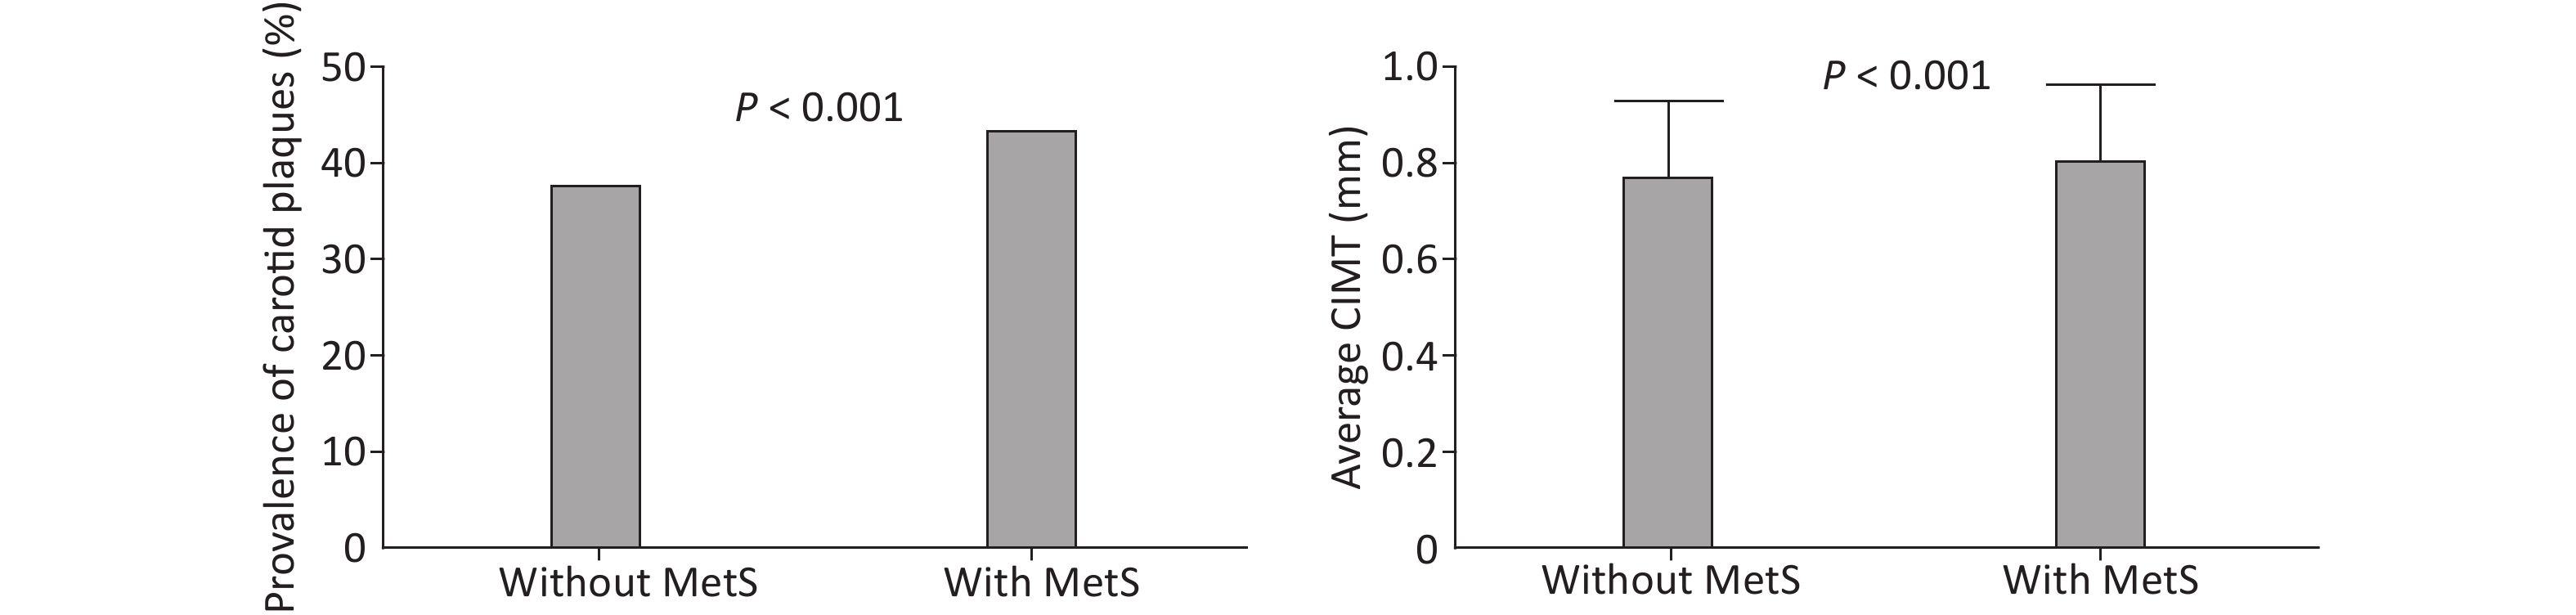
Table 2 shows the distribution of MetS as well as its components in participants with and without carotid plaques. Participants with carotid plaques were more likely to have MetS. The single components of MetS were also different between participants with and without carotid plaques (P < 0.001), except for central obesity. The prevalence of carotid plaques was higher in participants with MetS (P < 0.001) and the average CIMT increased significantly from 0.766 mm in participants without MetS to 0.801 mm in participants with MetS (Figure 1).
Items Total
N = 8,933Carotid plaques
n = 3,582No carotid plaques
n = 5,351P-value MetS, n (%) < 0.001 Yes 3,461 (38.74) 1,511 (42.18) 1,950 (36.44) No 5,472 (61.26) 2,071 (57.82) 3,401 (63.56) Single components of MetS, n (%) Central obesity 5,444 (60.94) 2,196 (61.31) 3,248 (60.70) 0.564 Raised TG 4,162 (46.59) 1,934 (53.99) 2,228 (41.64) < 0.001 Reduced HDL-C 5,086 (56.93) 2,102 (58.68) 2,984 (55.77) 0.006 Raised BP 5,394 (60.38) 2,633 (73.51) 2,761 (51.60) < 0.001 Raised FPG 1,667 (18.66) 758 (21.16) 909 (16.99) < 0.001 Num. of components of MetS, n (%) < 0.001 0 956 (10.70) 253 (7.06) 703 (13.14) 1 1,719 (19.24) 573 (16.00) 1,146 (21.42) 2 1,965 (22.00) 787 (21.97) 1,178 (22.01) 3 1,738 (19.46) 725 (20.24) 1,013 (18.93) 4 1,885 (21.10) 919 (25.66) 966 (18.05) 5 670 (7.50) 325 (9.07) 345 (6.45) Note. MetS, Metabolic syndrome; TG, triglycerides; HDL-C, high-density lipoprotein cholesterol; BP, blood pressure; FPG, fasting plasma glucose; Num., number. Table 2. Metabolic syndrome (MetS) and its components in participants with and without carotid plaques
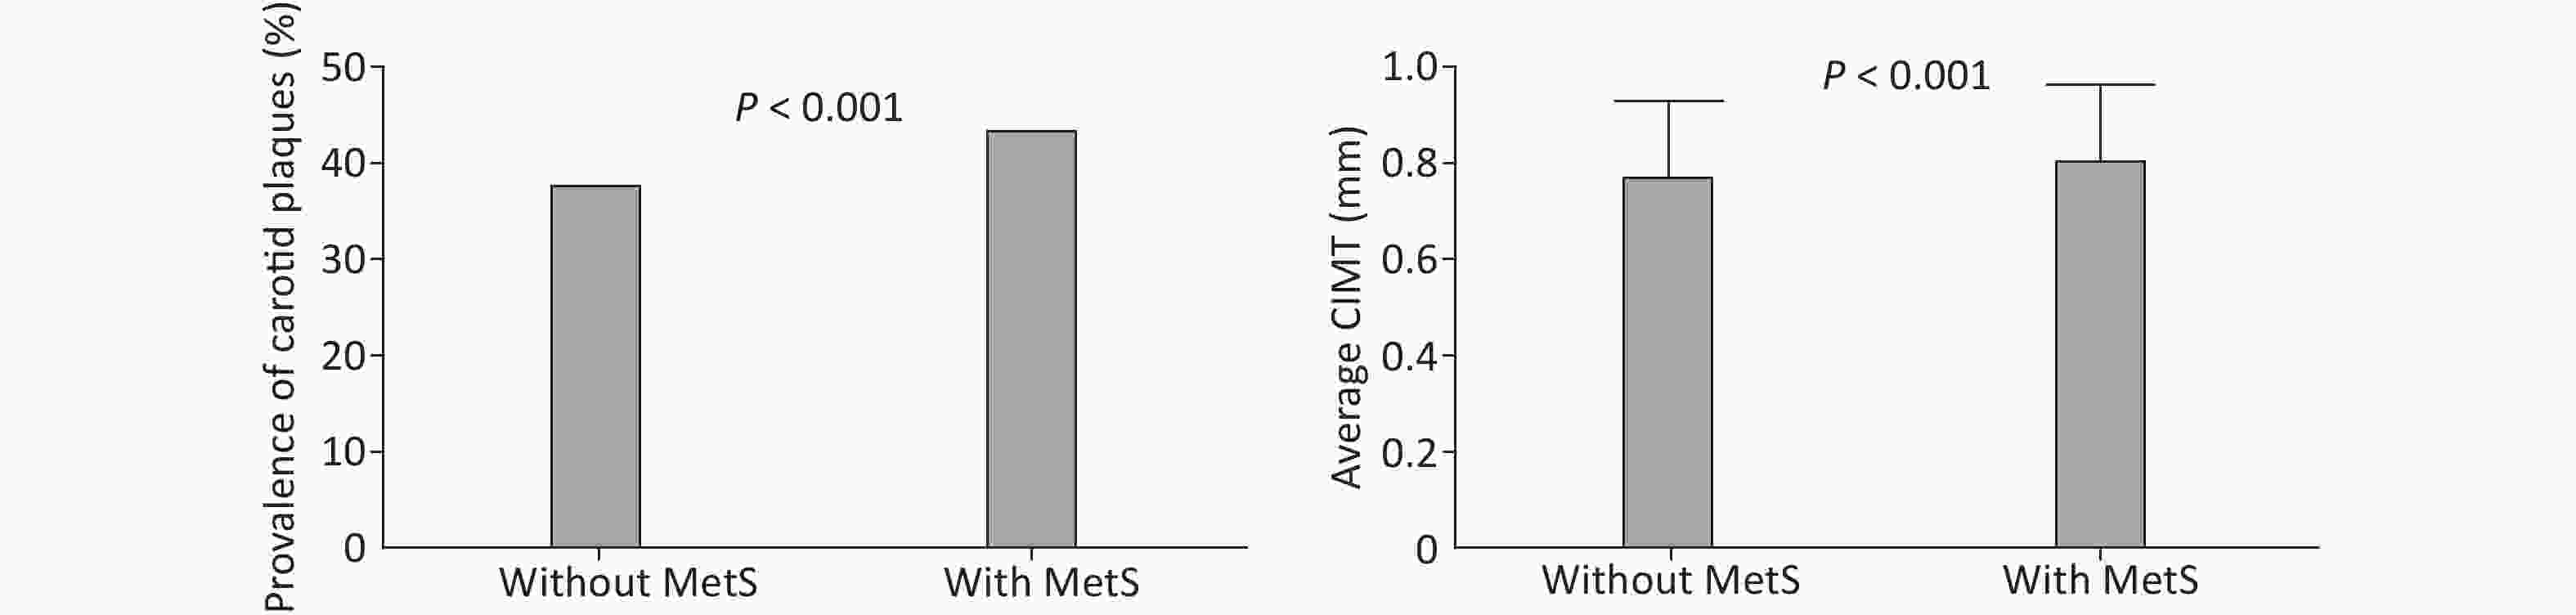
Figure 1. Prevalence of carotid plaques and average CIMT in participants with or without MetS. CIMT, intima-media thickness of common carotid artery; MetS, metabolic syndrome.
The odds ratio (OR) of carotid plaques for participants with MetS was 1.16 [95% confidence internal (CI): 1.03−1.30] after adjusting for possible confounding factors (Table 3). The adjusted ORs with 95% CIs of carotid plaques for participants with 1, 2, 3, 4 and 5 MetS components were 1.02 (0.81−1.28), 1.18 (0.95−1.48), 1.30 (1.03−1.63), 1.50 (1.19−1.88) and 1.45 (1.11−1.89), respectively, compared to participants without MetS components (P for trend < 0.001).
Item Model 1 OR (95% CI) Model 2 OR (95% CI) Model 3 OR (95% CI) MetS 1.27 (1.17−1.39) 1.18 (1.07−1.30) 1.16 (1.03−1.30) Num. of components of MetS 0 1 1 1 1 1.39 (1.17−1.66) 1.04 (0.85−1.27) 1.02 (0.81−1.28) 2 1.86 (1.57−2.20) 1.28 (1.06−1.55) 1.18 (0.95−1.48) 3 1.99 (1.67−2.36) 1.41 (1.16 −1.71) 1.30 (1.03−1.63) 4 2.64 (2.23−3.13) 1.67 (1.38−2.03) 1.50 (1.19−1.88) 5 2.62 (2.12−3.23) 1.45 (1.15−1.83) 1.45 (1.11−1.89) P for trend < 0.001 < 0.001 < 0.001 Note. Model 1, crude OR; Model 2, adjusted for age and sex; Model 3, adjusted for Model 2 and education level, income, smoking, alcohol consumption, low-density lipoprotein cholesterol and uric acid. OR, odds ratio; CI, confidence internal; MetS, metabolic syndrome; Num., number. Table 3. Association between MetS and carotid plaque
The average CIMT was greater by 0.020 mm (95% CI: 0.014−0.027) in participants with MetS than those without MetS (Table 4). In participants with multiple MetS components, CIMT increased by 0.023 mm, 0.022 mm, 0.042 mm, and 0.035 mm for 2, 3, 4, and 5 MetS components, respectively.
Item Model 1 Model 2 Model 3 β (95% CI) P β (95% CI) P β (95% CI) P MetS 0.035 (0.028−0.042) < 0.0001 0.023 (0.017−0.029) < 0.0001 0.020 (0.014−0.027) < 0.001 Num. of components of MetS 0 0 0 0 1 0.035 (0.022−0.047) < 0.0001 0.007 (−0.003−0.017) 0.192 0.010 (−0.001−0.022) 0.069 2 0.064 (0.052−0.076) < 0.0001 0.021 (0.012−0.032) < 0.0001 0.023 (0.011−0.033) < 0.001 3 0.063 (0.050−0.075) < 0.0001 0.021 (0.011−0.031) < 0.0001 0.022 (0.010−0.033) < 0.001 4 0.098 (0.086−0.110) < 0.0001 0.042 (0.032−0.052) < 0.0001 0.042 (0.030−0.054) < 0.001 5 0.104 (0.089−0.120) < 0.001 0.038 (0.025−0.051) < 0.001 0.035 (0.020−0.049) < 0.001 Note. Model 1, crude OR; Model 2, adjusted for age and sex; Model 3, adjusted for Model 2 and education level, income, smoking, alcohol consumption, low-density lipoprotein cholesterol and uric acid. MetS, metabolic syndrome; CIMT, carotid artery intima-media thickness; CI, confidence internal; Num, number. Table 4. Association between MetS and average CIMT
-
In this community-based study, a significant association was observed between MetS and carotid atherosclerosis. The rate of carotid plaques was 16% higher in participants with MetS. The participants with five MetS components have an approximately 50% increased risk of carotid plaque than participants with no MetS components. The average CIMT was significantly increased in participants with MetS compared to those without MetS. Increased CIMT was also found in participants with two to five components of MetS.
A follow-up study provided evidence that increased CIMT is associated with future cerebrovascular and cardiovascular events[27]. CIMT and plaques are different phenotypes indicating increased vascular disease risk, and CIMT without plaque remains a significant marker of an increased risk of vascular events[28]. A previous study evaluated the prevalence of carotid atherosclerosis in Hangzhou and mentioned that the prevalence and risk of carotid plaque and carotid atherosclerosis aggregated with an increasing number of MetS components[13]. Another study reported results consistent with this study, determining that MetS components were independently related to CIMT, and the risk of increased CIMT was significantly higher for those with two to five MetS components, compared to those with none[21].
However, some reports have indicated that there is not sufficient evidence to demonstrate that CIMT can be a factor for assessing the risk of CVD[29,30]. A Japanese study reported the risk of the total plaque score against the control (total plaque score = 0) to be significantly higher only in males, and the author ascribed the negative results in females to the limited number of women in the study[31]. Nobukazu Ishizaka reported that the association between MetS and carotid atherosclerosis was mediated entirely through the components of MetS, because MetS was not significantly associated with carotid plaque or intima-media thickening after a full adjustment including four components of MetS in their study[17]. Ishizaka determined in another study that MetS did not independently increase the risk of carotid atherosclerosis in participants whose blood pressures were high-normal[20]. In our study, after adjusting for confounding factors, MetS remained significantly associated with carotid plaques. Differences in race, definitions of major variables, and adjusted confounders may be possible reasons for these discrepancies.
Increased CIMT and carotid plaques are indicators of carotid atherosclerosis, and each reflects a different stage of the condition[32]. Increased CIMT represents the earlier stage of carotid atherosclerosis, while carotid plaques reflect the later stage. Moreover, advanced atherosclerosis can be expressed through the plaque formation[33]. A previous study indicated that insulin resistance mediates the association between MetS and carotid atherosclerosis. Insulin resistance is likely the critical pathophysiologic factor in a sequence of metabolic disorders, including atherogenic dyslipidemia (higher TG, apolipoprotein B, and LDL-C; lower HDL-C), inflammation, and prothrombotic state[34]. Effects of uric acid remain controversial[35,36]. As in previous reports[31,37], this study found that the number of MetS components was related to the severity of CIMT and carotid plaques. Yet, the specific mechanisms between MetS and carotid atherosclerosis need further investigation.
Although the present study had a large sample size, several limitations should be noted. First, all participants in this study are from the Jidong and Kailuan communities, whose residents have a higher income and more education than the general Chinese population. For this reason, we cannot generalize our results to the entire Chinese population. Second, this cross-sectional study cannot prove a causal relationship, which usually requires a longitudinal investigation.
In conclusion, our community-based study showed MetS to be significantly associated with carotid atherosclerosis, independent from additional risk factors for CVD. The average CIMT increased significantly in the participants with MetS compared to those without MetS. The present study indicates that MetS therapy can help reduce the risk of carotid atherosclerosis.
-
ZHOU Ping An and ZHANG Chen Huan designed the study and wrote the paper. CHEN Yan Ru, LI Dong, SONG Dai Yu, and LIU Hua Min helped with the acquisition and analyses of the data. ZHOU Ming Yue participated in the modification and edit of the manuscript. SONG Guo Shun helped coordinate the study within the communities. CHEN Sheng Yun reviewed the manuscript and made suggestions. All authors contributed to the development of the manuscript and all authors read and approved the manuscript.

 Quick Links
 DownLoad: