


-
Silicone oil (SO) has been widely used as an important endotamponade agent in pars plana vitrectomy (PPV) with characteristics of inertness, optical transparency, high surface tension, and high viscosity[1]. SO is the preferred intraocular tamponade in complicated situations such as proliferative diabetic retinopathy, giant retinal tears, and severe ocular trauma. Common postoperative complications include cataract, increased intraocular pressure (IOP), emulsification of SO, and keratopathy[2]. Furthermore, severe visual loss without any obvious morphological change has been reported since 2004[3]. According to previous studies, visual loss could be noticed one to five months after SO injection[4], or one day to one month after SO removal[3, 5]. The range of the incidence of this difficult situation has been reported from 1% to 33%[6-11]. Several hypotheses have been put forward, but the mechanism is still unknown.
Ganglion cell complex (GCC) is defined as the combination of retinal nerve fiber layer (RNFL), ganglion cell layer (GCL), and inner plexiform layer (IPL), which present axons, cell bodies, and dendrites of ganglion cells, respectively. Ganglion cells as one of the retinal neurons are involved in transmission of visual signals. Disconnection of ganglion cells is associated with impairment of visual function. A structure-function relationship has been found between GCL thickness and visual acuity in diabetic retinopathy[12]. GCC along with the RNFL are useful in diagnosing glaucoma, and GCC has been used as a predictor of progression of glaucoma[13]. In view of this, we hypothesize that SO-related visual loss could be associated with GCC loss.
Optical coherence tomography angiography (OCTA) is a new, non-invasive technique for vascular imaging. The split-spectrum amplitude decorrelation angiography (SSADA) algorithm has been widely used, and it provides a non-invasive and producible quantitative assessment of retinal microvasculature[14]. However, to our knowledge, there is no report of microvascular alteration in patients with SO-related visual loss.
Here we review the medical records of seven patients, who underwent PPV and SO tamponade for primary rhegmatogenous retinal detachment (RRD), and suffered unexpected visual loss. The OCTA and OCT data, including the retinal blood flow and thickness of GCC and RNFL, were also recorded.
-
This was a retrospective, cross-sectional study in seven patients with unexplained visual loss after SO tamponade at Beijing Tongren Hospital between January 2018 and January 2019. The study was approved by the Ethics Committee of Beijing Tongren Hospital (NO. TRECKY2017-10) and conducted in accordance with the Declaration of Helsinki. Inclusion criteria were as follows: 1) retinal tear located in the peripheral retina; 2) retinal reattachment was attained after surgery; 3) no intraoperative or postoperative complications; 4) the IOP during the whole period of SO tamponade was within normal limits; 5) compared with the best corrected visual acuity (BCVA) after retinal reattachment, final BCVA after SO removal has a loss of more than two lines of the Snellen chart; 6) visual loss could not be explained by refractive errors or media opacity; 7) morphology of the macula was normal on OCT. The exclusion criteria included the following: (1) history of systemic disease that could affect the retinal vasculature, such as diabetes and hypertension; (2) history of ocular disease other than ametropia; (3) history of ocular surgery; (4) bilateral BCVA was less than 20/25 before RRD; (5) refractory power between two eyes was more than 1D. Medical records of all patients were reviewed. Data collected included age, gender, macular status, duration of SO tamponade, and BCVA and IOP during SO tamponade and after SO removal. The OCTA results were also collected.
-
The RTVue-XR Avanti with AngioVue software (Optovue, Inc., v.2017.1.0.155), which consists of a combined OCTA and SD-OCT system, was used to acquire the thickness map of the RNFL and GCC, OCTA images of the macula (6 mm × 6 mm) as well as the optic disc (4.5 mm × 4.5 mm).
Thickness of the RNFL and GCC was measured with inherent ONH (optic nerve head) and GCC scanning protocols, respectively. The RNFL thickness measurement was at a 3.45 mm diameter around the center of the disc. Average RNFL thickness was automatically divided as the superior and inferior sectors for calculation. The GCC scanning protocol was centered 1 mm temporal to the fovea and a 7 mm × 7 mm map was created. The thickness of GCC was measured from the internal limiting membrane to the outer boundary of the inner plexiform layer (IPL). The thickness map was also automatically divided into the superior and inferior sectors. Pattern parameters of GCC thickness, global loss volume (GLV), and focal loss volume (FLV) were provided.
The technique of OCTA using the SSADA algorithm has been described in detail in a previous study[15]. The macular 6 mm × 6 mm scanning region was centered on the fovea, and it comprised of the foveal avascular zone (FAZ), parafoveal region, and perifoveal region. The FAZ was the innermost 1 mm-diameter area. The parafoveal region was the annular region with 3 mm-diameter outside the FAZ. The perifoveal region was the annular region with 6 mm-diameter outside the parafoveal region. Retinal scans underwent automated segmentation into the superficial capillary plexus (SCP) and the deep capillary plexus (DCP). Manual segmentation was performed by an experienced doctor (Y.M.) when inaccurate boundaries were noted. The vascular densities of the SCP and DCP in the macular region and the radial peripapillary capillary plexus (RPCP) around the optic disc were calculated. Vessel densities were originally divided into the superior and inferior sectors for calculation. The FAZ area was measured using the superficial retinal layer, and it was manually outlined. Scans with low signal strength index (SSI < 50) and significant motion artifacts and off-center scans were excluded.
-
The Shapiro-Wilk test (W score) was used to verify the normal distribution of the data. Student’s t test was used to compare the differences in variables between the affected and contralateral eyes. Spearman correlation test was used to explore the relation between variables. All data were expressed as mean ± SD, and tests were two-sided. Statistical significance was accepted at P < 0.05. All analyses were performed using SPSS for Windows software (version 23.0; IBM-SPSS, Chicago, IL, USA).
-
The mean age of patients was 51.60 ± 10.60 years (range, 30–62 years; median, 56 years). Four patients were male. The demographic characteristics of the patients are listed in Table 1. Past history was not remarkable except for ametropia, and the mean refractive power in these patients was −5.96 ± 2.01 diopter (range, −9 to −4.25 diopter; median, −6 diopter). According to the medical records of these patients, all patients underwent uncomplicated PPV and 5,000 centistoke SO tamponade, and four of them had macula-off RD when they underwent surgery. Retinal reattachment was attained after surgery in all eyes. No significant intraoperative or postoperative complications were noted. Visual acuity of all patients improved in the early postoperatively period, but four patients developed gradual visual loss at one to one and a half months postoperatively. All patients underwent SO removal around three months postoperatively. Three patients instantly complained of after SO removal. The mean BCVA during SO tamponade was 0.54 ± 0.29 (logMAR 0.27 ± 0.54), and the mean BCVA after SO removal was 0.05 ± 0.03 (logMAR 1.3 ± 1.5).
Patient Age (years) Sex Eye Refractive power (diopter) Macular status BCVA during SO tamponade BCVA after SO removal When visual loss was noticed 1 56 M OD −6.50 Off 0.50 0.04 1 month after SO tamponade 2 62 F OD −4 Off 0.40 0.05 After SO removal 3 48 M OS −6 On 0.80 0.02 After SO removal 4 58 F OD −4.25 Off 0.15 0.05 1.5 months after SO tamponade 5 57 M OD −4 Off 0.30 0.05 1 month after SO tamponade 6 30 M OD −8 On 0.60 0.10 After SO removal 7 50 F OD −9 On 1.00 0.02 1 month after SO tamponade Average 51.60 ± 10.60 −5.96 ± 2.01 0.54 ± 0.29 0.05 ± 0.03 Note. BCVA: best corrected visual acuity; SO: silicone oil; M: male; F: female. Table 1. Summary of cases of SO-related visual loss
-
Quantitative analysis of OCTA images revealed a significant reduction in vessel density (VD) in the superficial macula in the affected eyes compared with contralateral eyes (Table 2, Figure 1A1, B1). The superior section of RPCP VD was significantly reduced (P = 0.007), while the inferior section of RPCP VD was not reduced (P = 0.054, Figure 1A3, B3). The FAZ area was not significantly different between the two groups (P = 0.397). There was no significant change in DCP VD between the two groups (superior parafovea P = 0.404; inferior parafovea P = 0.915; superior perifovea P = 0.220; inferior perifovea P = 0.136).
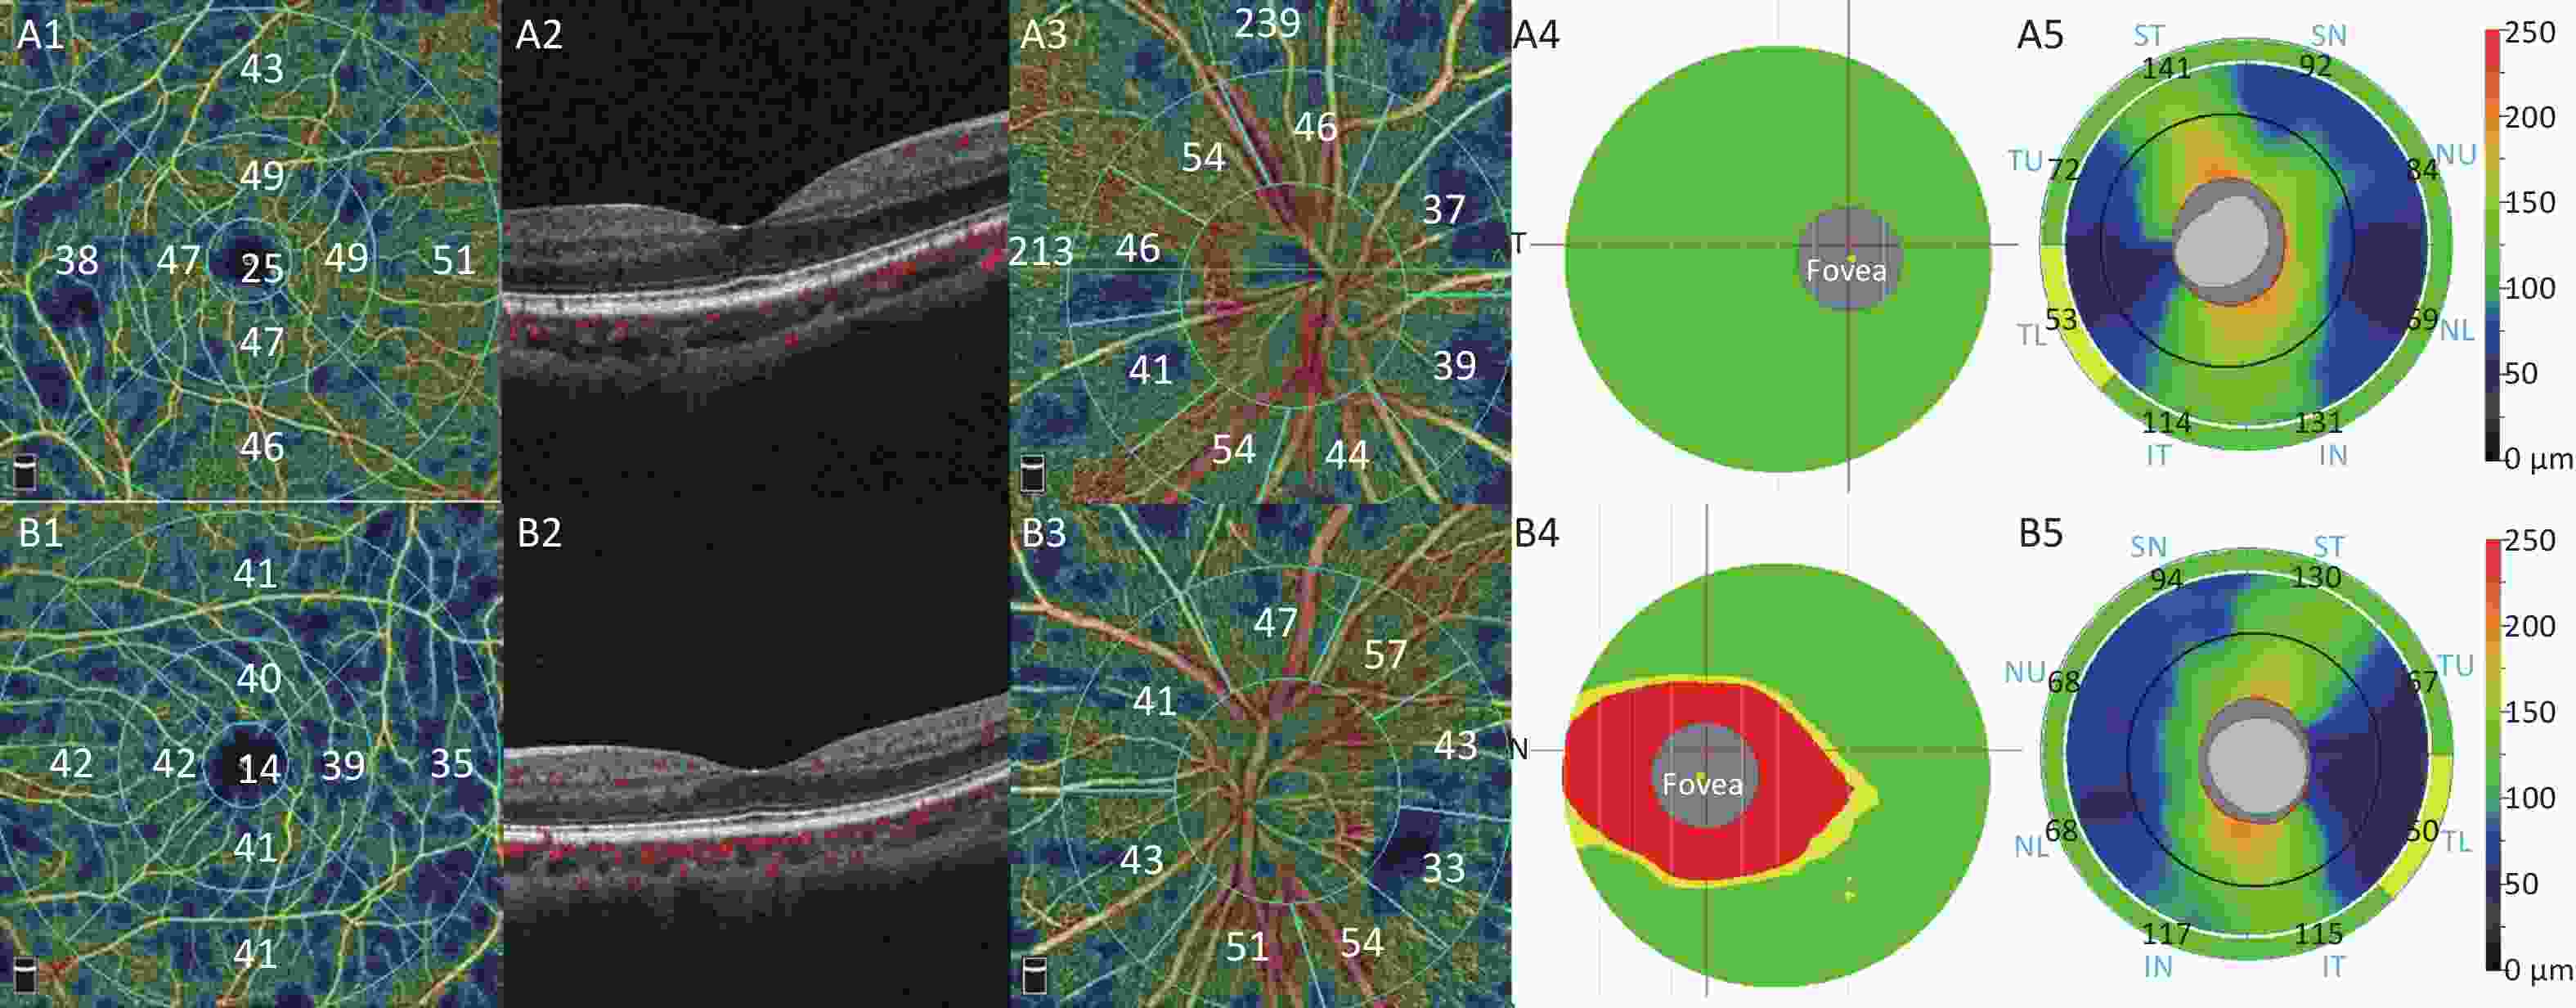
Figure 1. Representative OCTA and OCT images of one patient with SO-related visual loss (A1–A5: unaffected fellow eye, B1–B5: affected eye). (A1, B1) The macular superficial vessel density. (A2, B2) Morphology of the macula was normal on B-scan. (A3, B3) The radial peripapillary capillary plexus vessel density. (A4, B4) The ganglion cell complex significance map. The color coding for the normative display uses a green (within normal range), yellow (borderline normal range) and red (outside normal range). (A5, B5) The optic nerve head (ONH) results showed peripapillary RNFL thickness. Warmer colors represent relatively thicker regions and cooler colors represent relatively thinner regions.
Item Involved eye Contralateral eye P value* Foveal avascular zone area (mm2) 0.31 ± 0.12 0.25 ± 0.12 0.397 Vessel density (%) Superficial parafovea Superior 43.46 ± 3.97 50.31 ± 4.11 0.008 Inferior 41.83 ± 4.46 49.80 ± 3.89 0.004 Deep parafovea Superior 49.70 ± 4.00 51.75 ± 4.85 0.404 Inferior 49.79 ± 3.64 50.06 ± 5.47 0.915 Superficial perifovea Superior 40.07 ± 4.29 46.97 ± 3.66 0.007 Inferior 39.44 ± 4.31 46.81 ± 3.40 0.004 Deep perifovea Superior 43.04 ± 5.16 47.34 ± 7.11 0.220 Inferior 40.10 ± 6.94 45.69 ± 6.10 0.136 Peripapillary Superior 45.03 ± 3.84 51.30 ± 3.28 0.007 Inferior 45.43 ± 1.99 50.09 ± 5.38 0.054 Note. *Analyzed using Student’s t test. Table 2. Quantitative analysis of FAZ area and flow density in patients
-
Although no significant difference was found in the average GCC thickness (superior P = 0.097; inferior P = 0.055), FLV and GLV of GCC were significantly higher in the affected eyes (both P < 0.001, Table 3, Figure 1A4, B4). No significant difference was found in RNFL thickness (superior P = 0.900, inferior P = 0.528, Figure 1A5, B5).
Item Involved eye Contralateral eye P value* Superior GCC (μm) 87.57 ± 8.48 94.43 ± 5.47 0.097 Inferior GCC (μm) 85.57 ± 7.89 93.43 ± 5.74 0.055 FLV (%) 9.75 ± 2.09 0.51 ± 0.55 < 0.001 GLV (%) 12.11 ± 2.74 3.64 ± 3.47 < 0.001 Superior RNFL (μm) 96.71 ± 10.19 97.29 ± 5.91 0.900 Inferior RNFL (μm) 98.29 ± 11.31 95.00 ± 5.90 0.528 Note. *Analyzed using t-test; GCC, ganglion cell complex; FLV, focal loss volume; GLV, global loss volume; RNFL, retinal nerve fiber layer. Table 3. Quantitative analysis of GCC thickness and RNFL thickness in patients
-
Correlation analyses between all variables were conducted. Superficial retinal blood flow was inversely correlated with FLV as well as GLV (Table 4). No correlation was found among the FAZ area, deep retinal blood flow, or RNFL thickness (not listed).
Item Superior GCC Inferior GCC FLV GLV Superficial parafovea superior VD 0.496 (0.071) 0.532 (0.050) −0.671 (0.009) −0.715 (0.004) Superficial parafovea inferior VD 0.597 (0.024) 0.491 (0.074) −0.760 (0.002) −0.774 (0.001) Superficial perifovea superior VD 0.527 (0.053) 0.541 (0.046) −0.772 (0.001) −0.774 (0.001) Superficial perifovea inferior VD 0.565 (0.035) 0.544 (0.045) −0.818 (< 0.001) −0.868 (< 0.001) Peripapillary superior VD 0.417 (0.138) 0.435 (0.120) −0.676 (0.008) −0.517 (0.058) Peripapillary inferior VD 0.082 (0.780) 0.210 (0.471) −0.516 (0.059) −0.323 (0.261) Note. *Analyzed using Pearson’s coefficient of correlation and presented with Pearson’s r (P value); Statistically significant correlation (P < 0.05) are bold faced; GCC, ganglion cell complex; FLV, focal loss volume; GLV, global loss volume; RNFL, retinal nerve fiber layer. Table 4. Correlation between GCC and retinal blood flow
-
In our study, we compared the affected eyes to the fellow eyes of patients with SO-related visual loss, and we found a significant reduction in the superficial retinal blood flow and thickness of GCL and IPL.
The pathogenesis of SO-related visual loss is still obscure. Several hypotheses have been put forward, such as failure of potassium ion siphoning by Müller cells, which causes overload of extracellular potassium ion concentration in retinal and neuronal apoptosis[16]. Alteration in the concentration of growth factors or inflammatory cytokines in the retro-oil fluid has been taken into account[17, 18]. Light- induced injury has also been proposed. Macular pigments can keep photoreceptors away from light damage. It is said the SO could dissolve the macular pigments and cause photoreceptor exposure to high intensity light[19]. Moreover, SO as a highly transparent vitreous substitute would exacerbate phototoxicity[20].
Transparency of SO would increase light exposure of retinal ganglion cells. Unlike the outer retina, ganglion cells are not protected by macular pigments. Light exposure of retinal ganglion cells would cause oxidative stress and generate reactive oxygen intermediates (ROI). In healthy ganglion cells, mitochondria are capable of removing these intermediates[21]. When the homeostasis is compromised due to any reason, such as reduced blood supply, the mitochondria have limited ability to scavenge ROI, and the ganglion cells are at risk of light-induced injury[22]. Furthermore, Yamada et al. put forward that SO-associated vignetting effect during SO removal surgery would exacerbate light-induced injury to macula[23]. Therefore, SO-related visual loss could happen during SO tamponade and instantly after SO removal. We hypothesized that diminished blood supply of ganglion cells together with light exposure contributed to ganglion cell apoptosis.
GLV and FLV are pattern analyses of GCC. GLV represents the percentage of decreased GCC volume within the scanned area compared to the age-matched normative database. FLV represents the percentage of significant GCC loss[24]. Compared with the average GCC thickness, pattern parameters are more sensitive or more specific[25]. Therefore, although the results showed no significant reduction in average GCC thickness, GLV and FLV were higher in the affected eyes, which means the GCC thickness was actually reduced after corrected by age. The GCC showed a decrease in thickness while the RNFL did not show a decrease in thickness, which means that the cell bodies and dendrites of ganglion cells were affected. Our results corresponded to previous findings, which indicated involvement of the inner retinal layer, especially GCL, morphologically[9, 11, 26] and functionally[5]. Shalchi et al. found that vacuoles in the inner nuclear layer were associated with profound RNFL loss of the papillomacular bundle after long term follow-up of patients with SO-related visual loss[27]. But in our study, the RNFL thickness was normal and no obvious morphologic abnormality was noted. A longitudinal follow-up is needed to reveal the subsequent changes in GCC, especially the RNFL.
Previous studies have shown that the retinal blood flow was reduced when the retina was detached[28] and it recovered after retinal reattachment[29, 30]. But SO was not used in these studies. The SCP is primarily located within the ganglion cell layer and the DCP is predominately located within the INL[31]. We found a significant reduction in SCP VD and loss of ganglion cells, while there was no difference in DCP VD. We postulated that when patients strictly lie in the prone position in the first month postoperatively, the mechanical compression by SO would compress the SCP and cause ischemia and apoptosis in the GCL.
We acknowledge that there are several limitations in our study, including the small number of patients and the cross-sectional analysis. However, SO-related visual loss is a rare complication of PPV surgery; hence, it is difficult to collect a large group to achieve good statistical power. Further studies with a long-term follow-up would provide additional information on blood flow alterations in patients treated with SO tamponade and after SO removal.
In spite of these limitations, this is the first study to show that loss of ganglion cells is associated with reduced blood flow in the superficial retina among patients with SO-related visual loss. This study may provide evidence for further study to elucidate the etiology of this difficult situation.
-
The authors have no conflict of interest to declare. We thank LetPub (www.letpub.com) for its linguistic assistance during the preparation of this manuscript.
-
MY and PXY designed experiments and wrote the manuscript. ZXQ collected the medical records of patients.
Funds:
The study was supported by Capital Medical University Affiliated Beijing Tongren Hospital Key Medical Development Plan [trzdyxzy201801]; The funding organization had no role in the design or conduct of this research

 Quick Links
 DownLoad: