-
A steady increase in the average stature has been documented among the population of most high-resource countries since the end of the 19th century[1]. This phenomenon was labeled as the ‘secular trend’, a term later extended to include human traits other than height[2]. In general, the secular trend in stature was attributed to improvements in the standard of living[3], hygienic conditions[4], and nutrition[5], as a result of global economic development. This hypothesis is consistent with the poor anthropometric indices observed during periods of social precarity, such as wars or famines, in which a remarkable decline in the mean stature of the population was often documented[6]. For instance, during the Chinese famine of 1959–1961—the largest ever that occurred in human history—the average body height of the rural population declined by 1.7 cm and 1.3 cm in men and women, respectively[7]. Similarly, in Europe, there was a substantial drop in the average stature, soon after the First World War[8]. Hence, average stature is considered a concise measure of the level of socioeconomic development achieved by a given population.
Sardinia, the second largest island in the Mediterranean Sea, is an interesting case study. Although this region belongs to Italy, its population remained isolated for many centuries and was historically characterized by the short stature of its inhabitants, as evidenced by data retrieved from the Italian military registers[9−12]. This feature has been mostly attributed to genetic factors[13], although the harsh socioeconomic background up until the mid-1950s might have played a significant role as well[14]. Until the Second World War (WWII), Sardinia was considered a low resource region in Italy, with a population exposed to significantly high infant and adult mortality, factors that entailed a shorter life expectancy[15]. However, after 1930, political efforts aimed at modernization, including intensive cereal farming and repeated attempts to eradicate endemic malaria, produced a considerable improvement in living conditions. Despite these efforts, the main economic resources of the island remained agriculture and animal rearing, to such an extent that nowadays, the island accounts for 49% of the overall sheep and goat livestock found in Italy[16]. Consequently, milk and dairy product consumption in Sardinia, based on family expenditure, is the highest in Italy[17]. This factor may have had significant implications for the stature of the population, given that prospective studies showed that high milk consumption is associated with faster linear growth of the fetus and the infant[18, 19]. Moreover, the socioeconomic status and sibship composition of families may have had a substantial impact on the individual height of Sardinians, as suggested by Sanna et al[20].
However, after WWII, the Sardinian population experienced a rapid economic recovery. Hence, the magnitude of the secular trend in height quickly became one of the highest and most persistent in Europe. More specifically, the growth rate of body height among Sardinians from 1894 to 1990 was 1.13 cm per decade, higher than the 1.06 cm per decade value recorded in mainland Italy[21]. In contrast, in the rest of Italy, there was a stoppage in stature increase, during the period from 1994 to 1998, comparable to several North European countries[22, 23]. A similar pattern was also reported in Eastern[24] and Southern European countries such as Greece[25] and Turkey[26].
Age-period-cohort (APC) analysis is a general method widely used in epidemiology to investigate time-varying phenomena[27]. In particular, APC analysis allows researchers to separate three types of time-varying elements: those associated with the process of ageing (age effects), those associated with the year in which the subjects are being observed (period effects), and those depending on birth generation (cohort effects). Several statistical approaches have been developed to address this task[28]. In the present study, the hypothesis that there has been a leveling off in stature secular trend was tested in the Northern Sardinian population by using APC modeling.
-
To perform this observational study, we took advantage of a large database of patients who underwent endoscopic procedures (for any reasons) between January 2001 and December 2018, referred to the Gastroenterology Section, Department of Internal Medicine, University of Sassari, Italy. Detailed information regarding the demographic data and anthropometric measures was retrieved. Body height was measured in each patient, without shoes, using a stadiometer with the patient’s head aligned according to the Frankfurt horizontal plane[29]. Data consistency was guaranteed mainly by (i) the use of the same structured chart, and (ii) completion under the supervision of the same attending gastroenterologist (M.P.D.) throughout the duration of the study. Institutional Review Board approval was obtained from the local ethics committee (Prot. No 2099/CE). No written informed consent was necessary.
-
The study excluded patients with celiac disease or with genetic conditions that are common in Sardinia and associated with shorter stature, as well as Down’s Syndrome, thalassemia major, cretinism, and body malformations, among others. Similarly, individuals with disorders that predispose them to a taller height, such as acromegaly, were excluded. Additional exclusion criteria were a history and/or the presence of major eating disorders, inflammatory bowel diseases, and malignancy before the age of 25. Moreover, subjects not born or residing in Sardinia and those younger than 25 years of age were excluded from the analysis.
-
All patients were stratified by age in 10-year intervals and by birth year in 5-year intervals. Considering the well-known sexual dimorphism of body height, all analyses were performed separately in males and females. Means and standard errors (SEs) were calculated for continuous variables, whereas the absolute and relative frequencies were calculated for categorical variables. To estimate the separate contribution of age, time period, and birth cohort on the average body height, a standard generalized linear model cannot be used owing to the collinearity originated by the perfect linear relationship between age, period, and cohort (period = age + cohort). To circumvent this problem, a principal component regression (PCR) model was used, as recommended by Saikia and Singh[30]. Briefly, Z-scores of the variables age at clinical examination (age), year of examination (period), and year of birth (cohort) of the study participants, as well as their stature, were created using the formula Z = (X ‒ μ)/σ, where μ is the mean and σ the standard deviation. Then, the eigenvalues of the correlation matrix of standardized variables were calculated and ordered from the highest to the lowest. The optimal number of principal components (PC) that explained the total variance of the dataset was determined by retaining only factors with eigenvalues ≥ 1.0 (see supplemental material). Then, by regressing stature on PCs with ordinary least squares, we verified that the problem of multicollinearity was eliminated. Finally, the PCR coefficients were adjusted back to their original scale to calculate β coefficients for age, period, and birth cohort. All statistical analyses were performed using the open source ‘R’ software (http://www.r-project.org/), and the PCR model was developed using the package ‘pls’. The significance level was set up at 0.05 (two-sided tests).
-
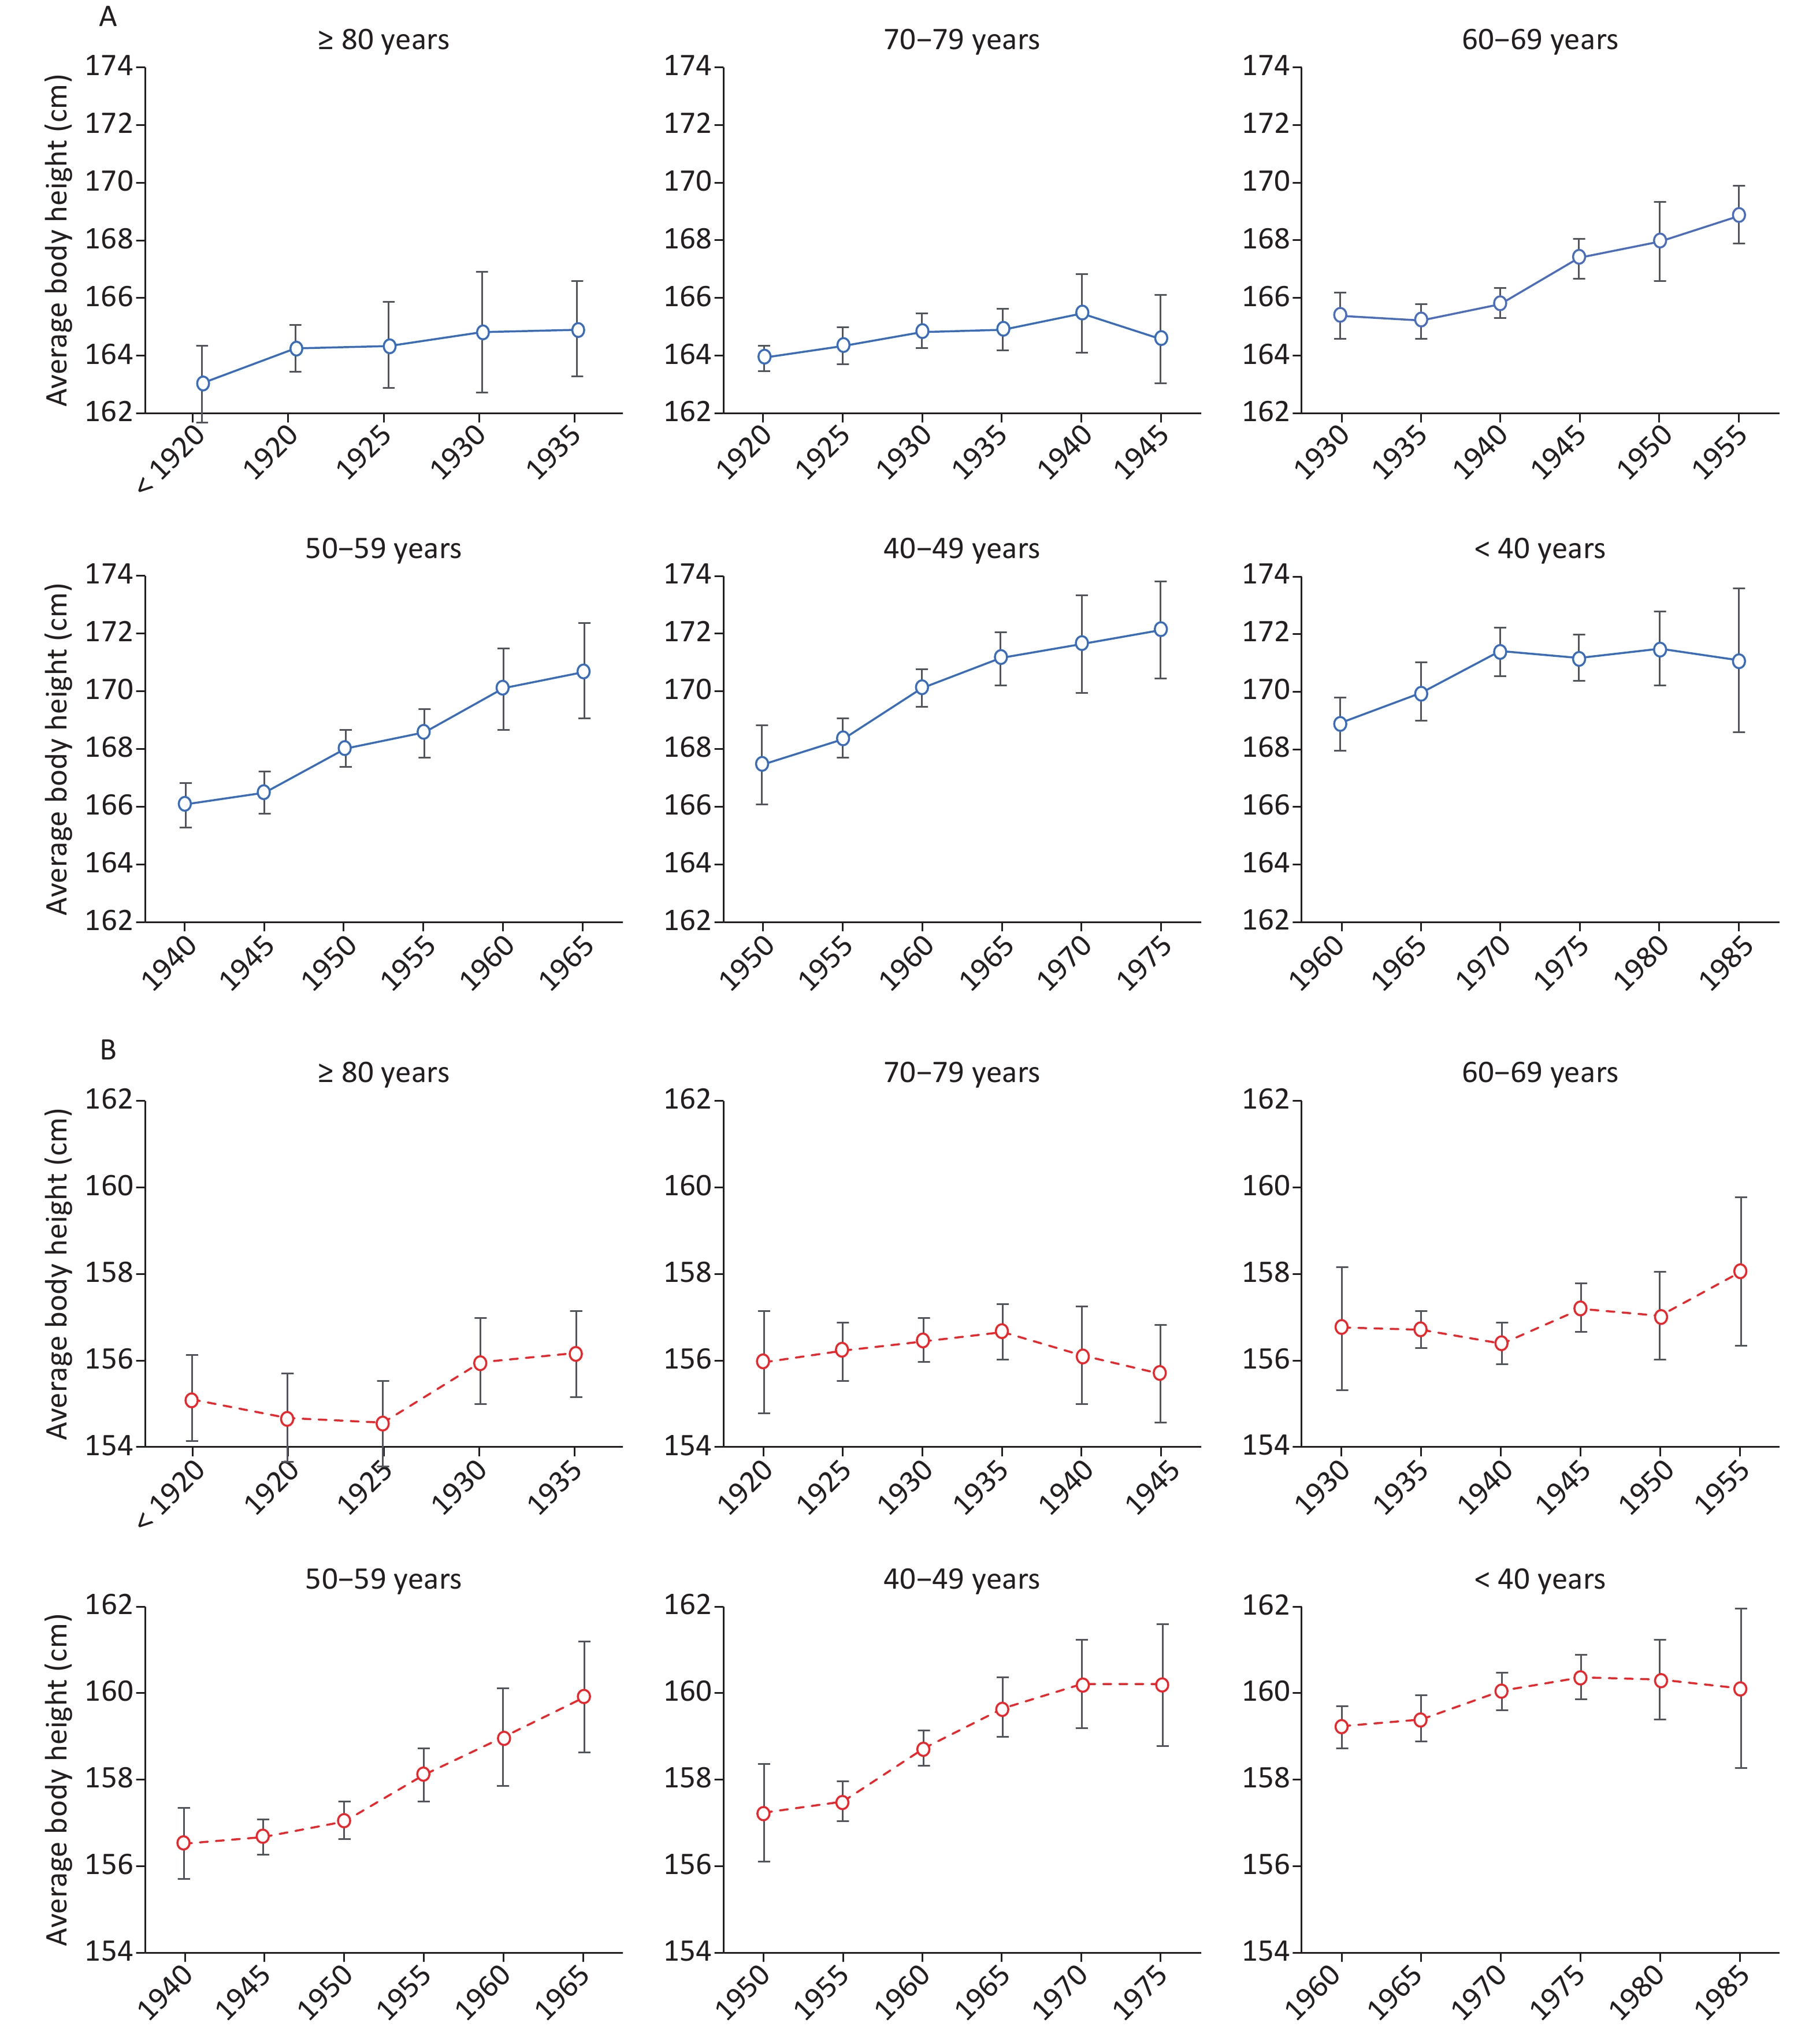
A total of 10,360 clinical records, including birth cohorts from 1920 to 1990, were included in the analysis. All study participants were from Northern Sardinia and shared the same genetic background. Figure 1 reports the variation of average body height according to birth cohort and age groups, separately for men (panel A) and women (panel B). The corresponding values are reported in Supplementary Tables S1 and S2 available in www.besjournal.com.
Men Age (years) SE Year of birth < 30 30‒39 40‒49 50‒59 60‒69 70‒79 ≥ 80 < 0.40 < 1920 163.0 0.40‒0.59 1920‒24 163.9 164.2 0.60‒0.79 1925‒29 164.4 164.3 0.80‒0.99 1930‒34 165.4 164.9 164.8 ≥ 1.0 1935‒39 165.2 164.9 164.9 1940‒44 166.0 165.8 165.5 1945‒49 166.5 167.4 164.6 1950‒54 167.5 168.0 168.0 1955‒59 168.4 168.6 168.9 1960‒64 168.9 170.2 170.1 1965‒69 170.0 171.2 170.7 1970‒74 170.4 171.4 171.7 1975‒79 170.7 171.2 172.2 1980‒84 171.5 171.5 1985‒89 171.0 171.1 Table S1. Average stature (cm) in 4,046 Sardinian men according to year of birth and decade of age (Sardinia, Italy, 2001‒2018)
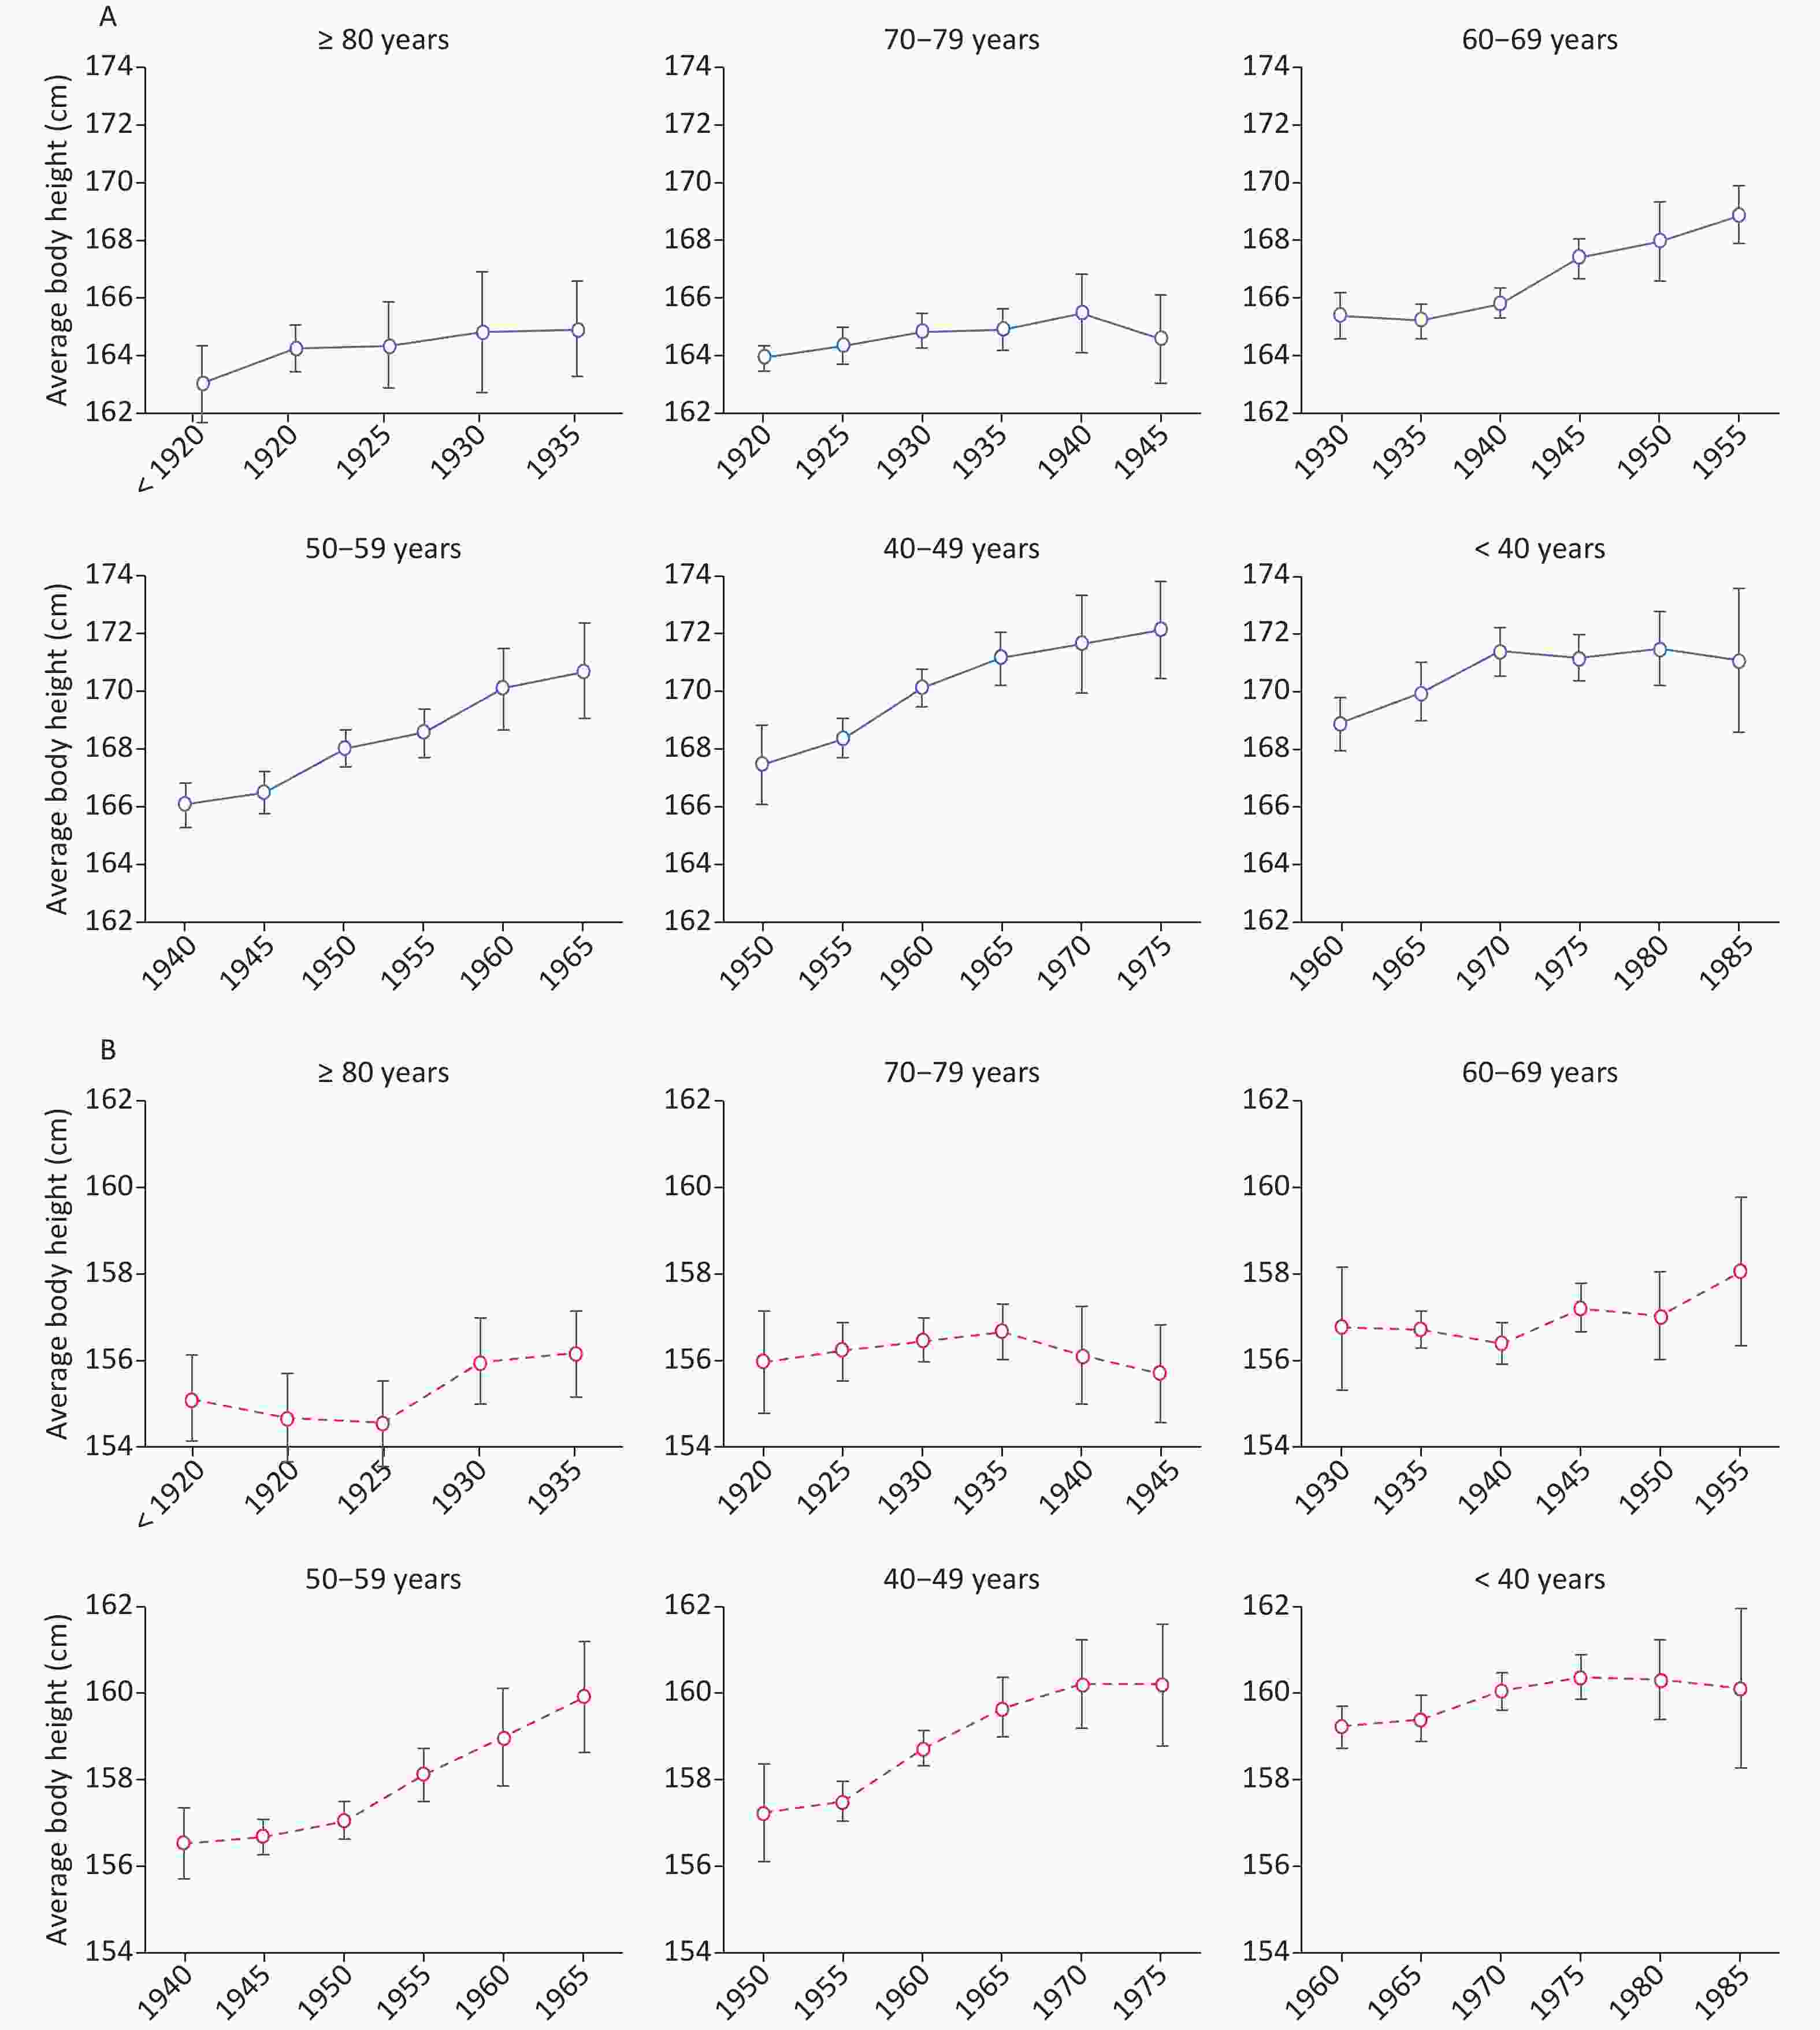
Figure 1. Variation in body height according to birth cohort age groups (cohort effect). A for men; B for women
Women Age (years) ES Year of birth < 30 30‒39 40‒49 50‒59 60‒69 70‒79 ≥ 80 < 0.40 < 1920 155.1 0.40‒0.59 1920‒24 156.0 154.7 0.60‒0.79 1925‒29 156.2 154.5 0.80‒0.99 1930‒34 156.7 156.4 156.0 ≥ 1.0 1935‒39 156.7 156.6 156.1 1940‒44 156.5 156.4 156.1 1945‒49 156.7 157.2 155.7 1950‒54 157.2 157.1 157.0 1955‒59 157.5 158.1 158.0 1960‒64 159.2 158.7 158.7 1965‒69 159.4 159.7 159.9 1970‒74 159.7 160.0 160.2 1975‒79 160.4 160.4 160.2 1980‒84 160.1 160.3 1985‒89 159.8 160.1 Table S2. Average stature (cm) in 6,314 Sardinian women according to year of birth and decade of age (Sardinia, Italy, 2001‒2018)
Variations of secular trend were significantly evident in male subjects who were in their 40 s and 50 s, with a net increase of 1.97 cm and 1.83 cm per decade, respectively. The gain in body height for subjects whose birth years ranged between 1940 and 1969 compared with subjects born 30 or 20 years earlier was 3.6 cm and 3.4 cm, respectively. Similarly, in females, the trend increased in the fourth and fifth decades, albeit to a lesser degree, with a difference in body height of 1.8 cm and 1.4 cm, respectively, compared with female subjects born two and three decades earlier. Notably, the rate of increase in stature declined in generations born after 1970 and finally leveled off (Figure 1, panels A and B). Accordingly, the average stature has remained quite stable over the past 30 years (Figure 1, panels A and B). Moreover, the SE of mean values increased over the years, falling between 1995 and 2018 in both sexes, and almost doubled during this time interval. More specifically, this index of variability became significantly wider (P < 0.0001) in both sexes starting from generations born in 1980, and it nearly doubled in generations 30–39 and < 30 years old. These data suggest the presence of subgroups characterized by different rates of linear growth.
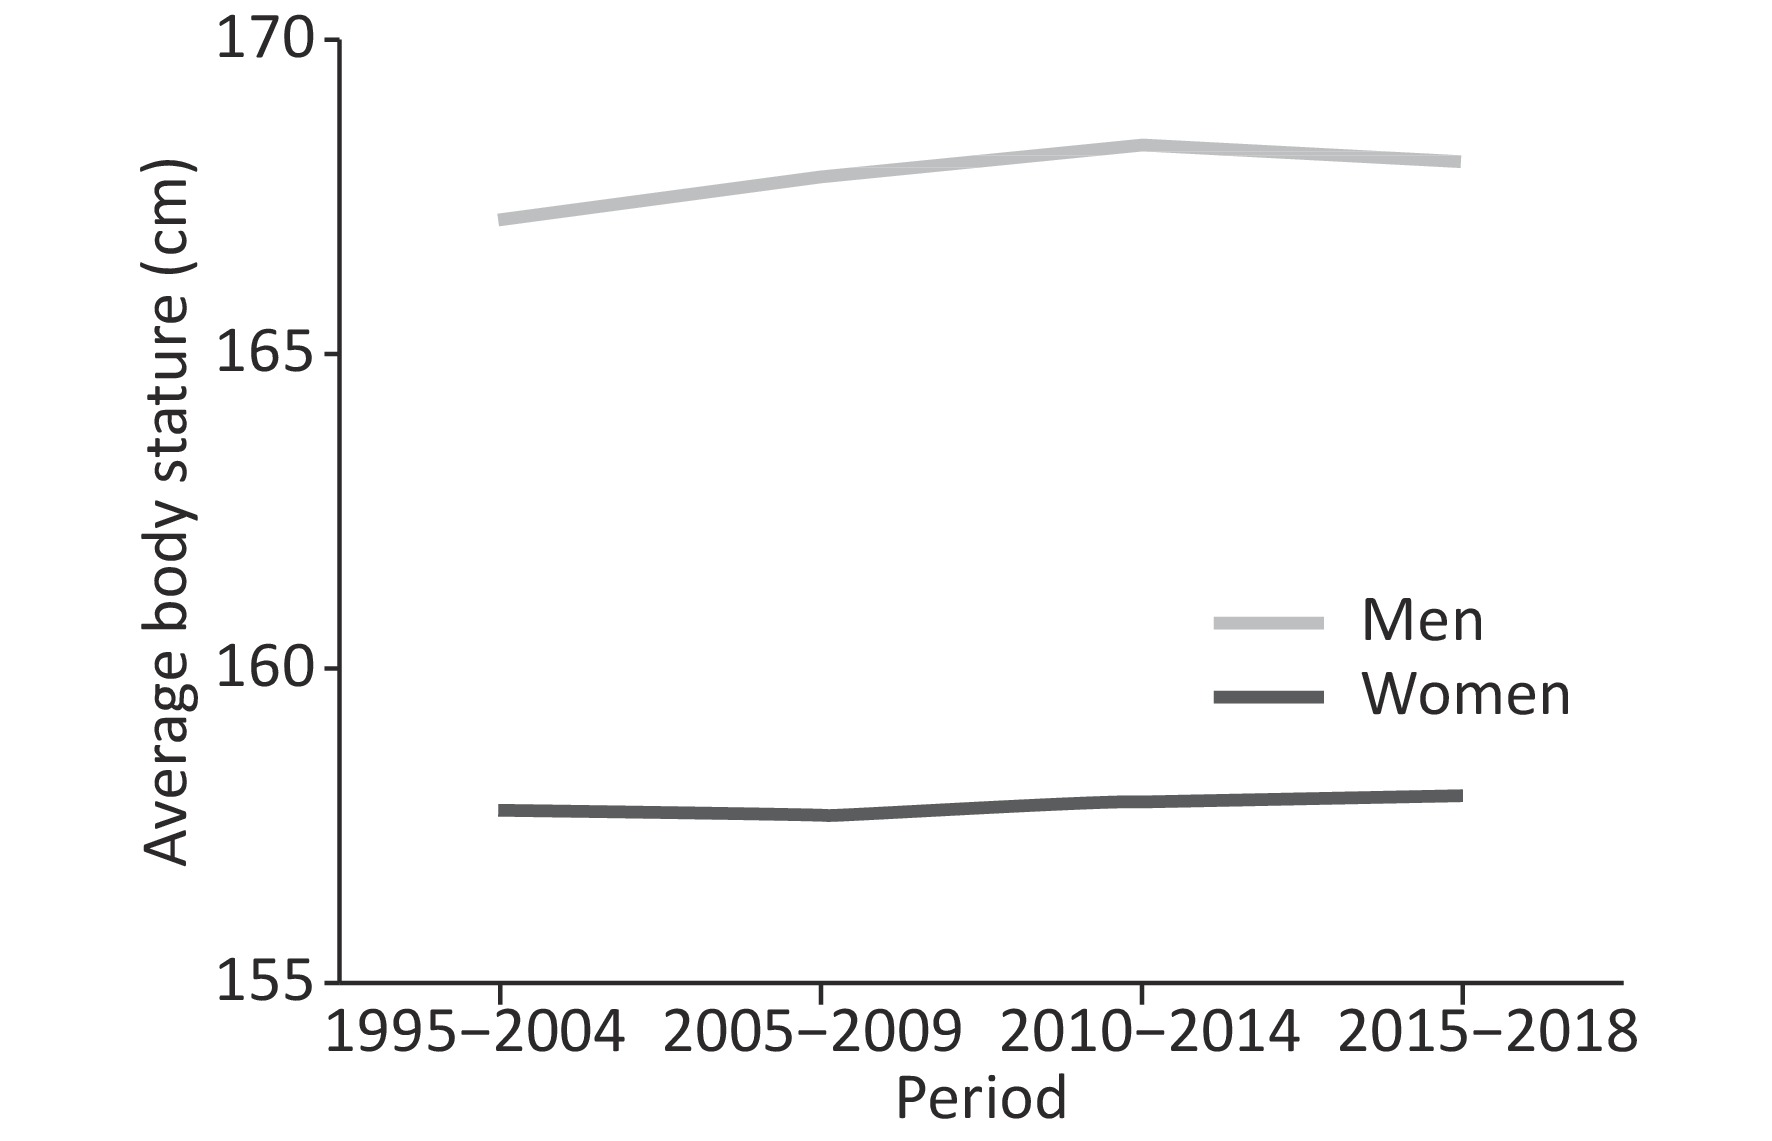
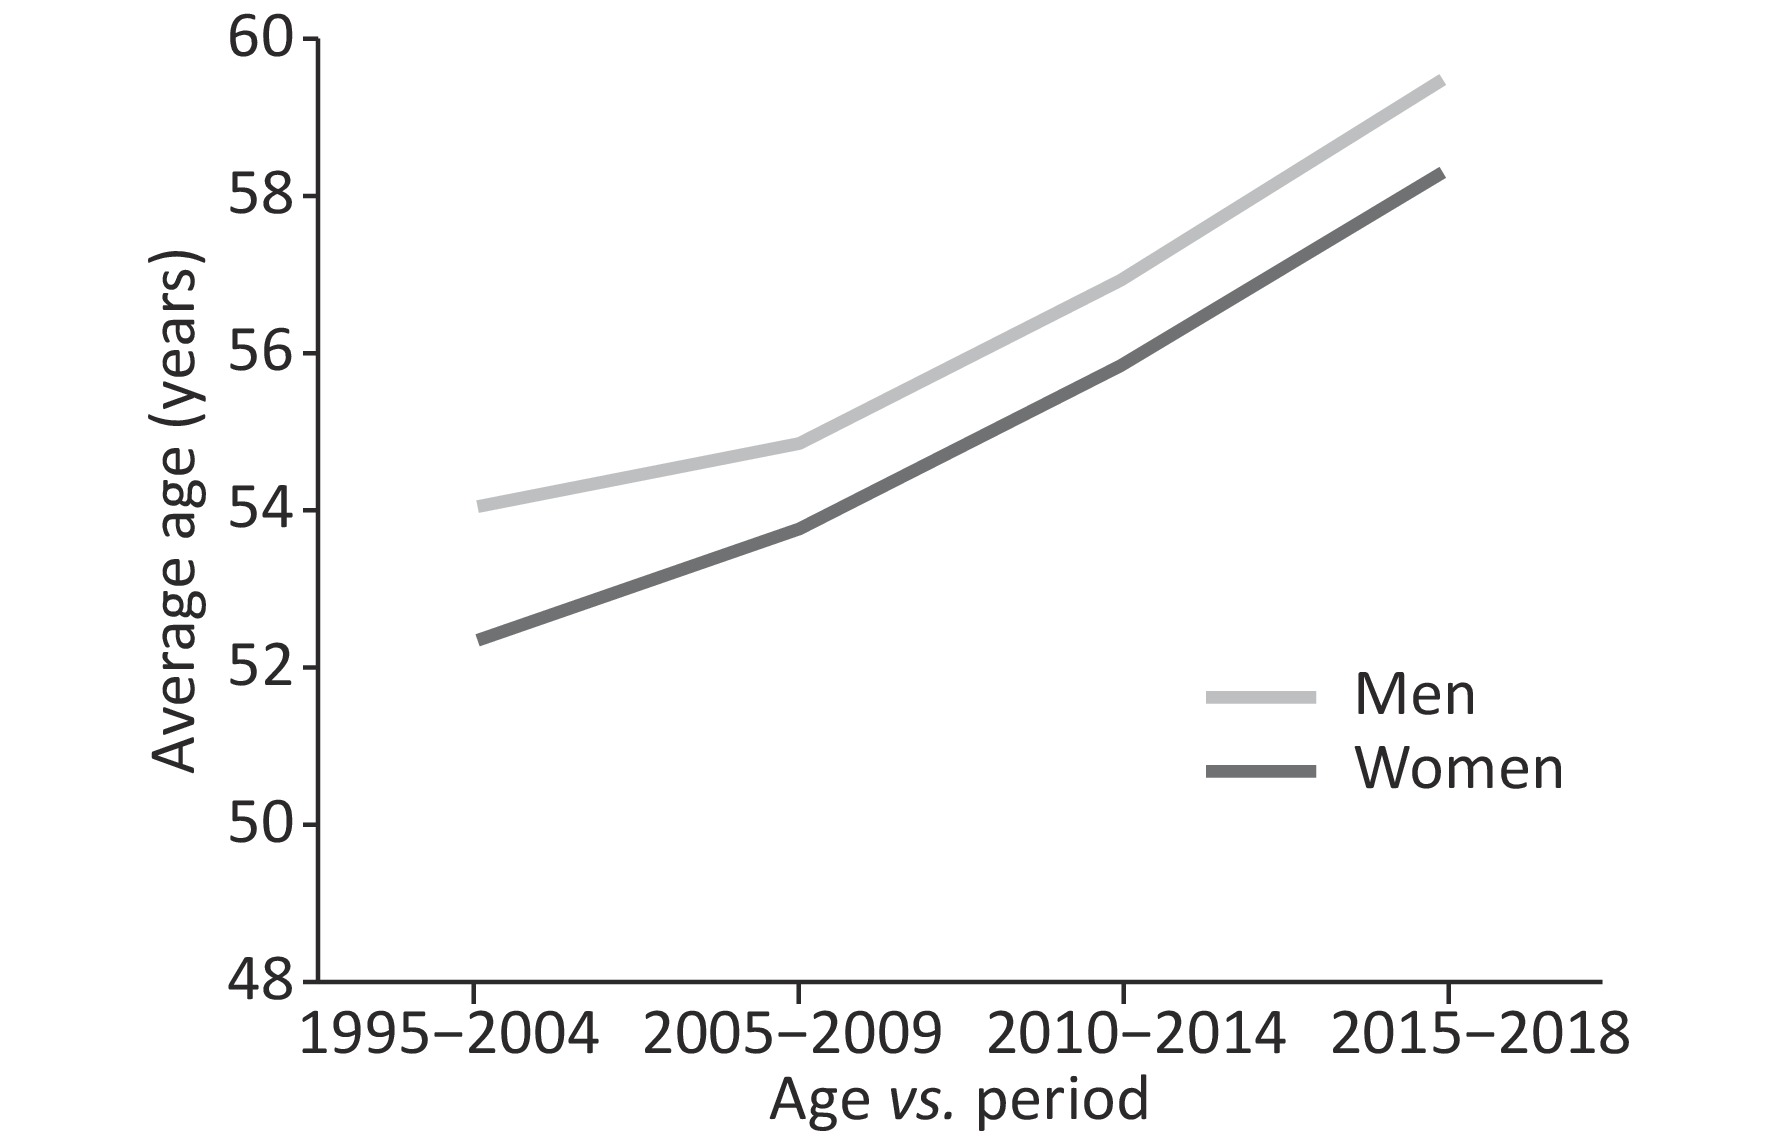
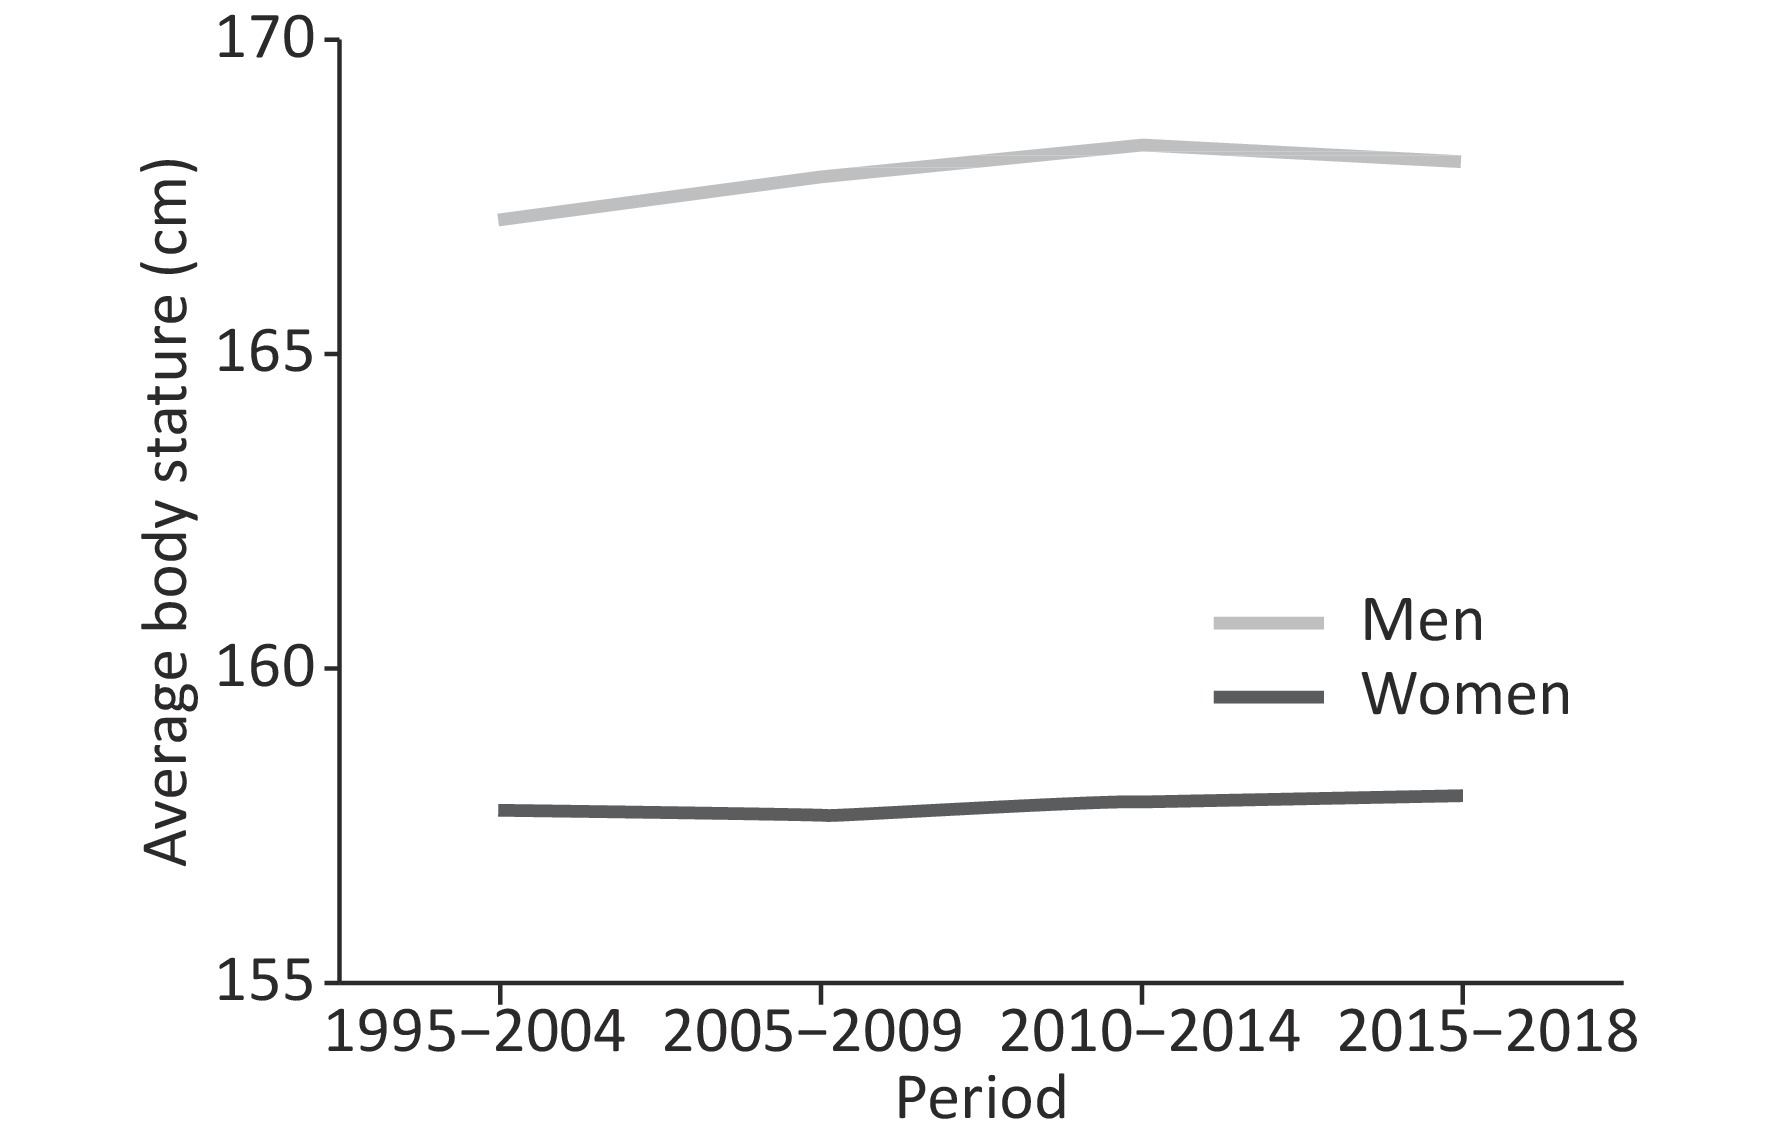
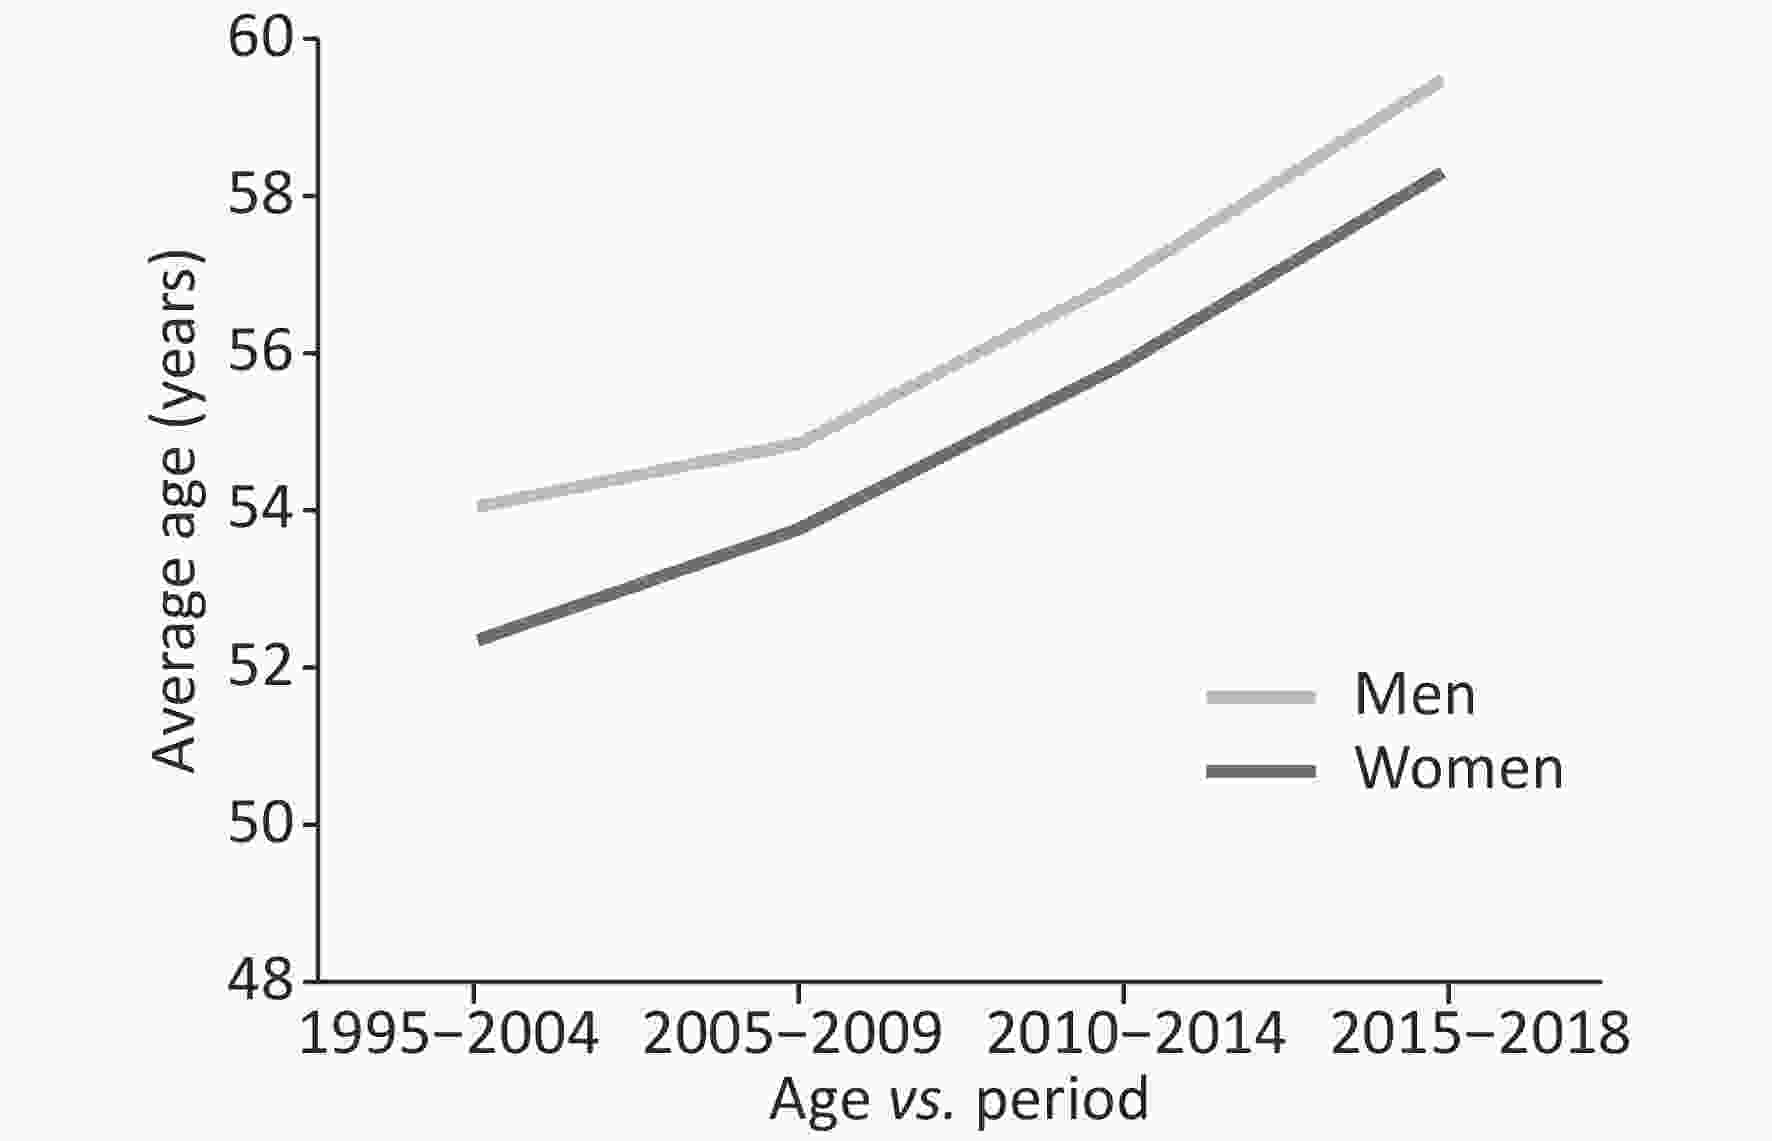
The variation in body height in relation to the study periods and sex is illustrated in Figure 2. Notably, the curves representing the average body height values remained stable over the past 20 years. The explanation for this phenomenon is likely to be found in the mixture of the studied cohort. As a general consequence of population ageing, a progressive rise occurs in the proportion of ailing elderly people who require diagnostic procedures, including upper endoscopy. Hence, Figure 3 confirmed that the average age of patients undergoing endoscopy was increased, so that the apparent stability of body height may well be the combined effect of two opposing factors, i.e., ageing and the secular trend. Figure 4 illustrates the average body height as a function of age and birth cohort in both sexes.
The results of PCR analysis are reported in Table 1. The strongest predictor of the secular trend was birth cohort (β coefficient = 0.157 among males and 0.077 among females), followed by age (β coefficient = ‒0.092 among males and ‒0.020 among females). The study period was the apparent weakest predictor (β coefficient = 0.075 among males and 0.018 among females).
Variable Men Women Beta coefficients t P Beta coefficients t P Age ‒0.092 ‒1.379 0.168 ‒0.020 ‒1.298 0.195 Period 0.075 1.594 0.111 0.018 0.442 0.659 Cohort 0.157 7.743 < 0.0001 0.077 4.887 < 0.0001 Table 1. Association of age, period, and birth cohort with body height for men and women in Norther Sardinia from 2001 to 2018
-
The results of this study suggest a considerable slowdown in the secular trend of stature among adult subjects from Northern Sardinia over the past three decades. More specifically, men and women born after 1970 seem to have experienced a considerable deceleration in the trend towards being taller compared to previous generations. Our findings are consistent with the results of previous investigations conducted in Italy[22, 31] and in a number of Southern European countries[25, 26]. On the contrary, Sanna et al. reported an ongoing secular trend in Southern Sardinia (Cagliari area) compared with the Rieti population (a city close to Rome), which showed a slower or even static average stature growth. However, after adjusting for socioeconomic variables, including occupation of the family head and sibship size, this alleged persistence of the secular trend largely disappeared[20].
The secular trend in stature among Sardinians has displayed a variable pattern throughout their history. Up to 1930, the stature growth was modest (0.50 and 0.25 cm per decade among males and females, respectively), and gradually rose until the mid-1950 before increasing sharply over the following two decades. During this period, corresponding to the epoch of nutrition transition[17], the socioeconomic conditions of Sardinia improved rapidly as a result of strong governmental interventions. Indeed, these times were associated with a better nutritional state and a faster stature growth rate, making Sardinians the population with the greatest linear growth in Europe[20, 21]. In the following decade, however, the previously observed movement towards reaching greater average heights showed clear evidence of leveling off and, in generations born after 1990, it eventually ended up in a near zero increment among men and even a slight negative trend among women.
The interpretation of our findings is speculative and might rely on a number of potential factors already proposed in the literature[19, 32-36]. The first factor to be considered is the genetic background. In most Western societies, heritability of height was estimated to be between 0.60 and 0.95[32], greater in men[33], and negatively influenced by a poor standard of living[34]. A theoretical possibility is that the Sardinian generations born after 1970 experienced genetic admixture as a result of the immigration of individuals of distant ethnic origin who may have introduced short-statured genetic lineages. However, this eventuality seems very unlikely due to the generally low migratory flow recorded in the Sardinian population[35]. Besides, in our study, this bias was minimized by excluding all foreign patients from the analysis.
In addition to the genetic influence, the impact of improved life conditions plays an important role in stature growth, as shown by the wide variations observed in geographic areas with different economic resources. For centuries, a harsh living environment and poor nutritional conditions prevented the Sardinian population from reaching its genetic stature potential. However, after the transition era, the improved diet, along with other factors, allowed the population to express a spectacular secular trend in stature. The rising trend in height was to such an extent that it would have already reached the maximum genetically attainable stature. This explanation is plausible because, of course, an increasing trend should not persist without time limits, so that in the end, further environmental improvements are no longer able to exert any influence.
Another important issue is the eradication of endemic infectious diseases on the island. Historically, malaria was a scourge in Sardinia until approximately 1950. Thanks to the efforts of the Rockefeller Foundation after WWII, the disease was eradicated, a factor that rapidly eliminated a major constraint to stature growth[11].
The average diet of families is considered important for the linear growth of children[36]. Consumption of cow’s milk has been consistently related to the child’s growth after weaning. Data from the 1999–2002 NHANES study indicates that milk consumption at ages 5–12 and 13–17 is positively associated with adult height[37] and is a significant predictor of height at age 12–18. Cow's milk contains calories, proteins, and calcium, among other nutrients, as well as bioactive components such as insulin-like growth factor I, which facilitates bone growth[18]. Interestingly, the TARGET Kids Collaboration study showed a dose dependent association between non-cow’s milk consumption and height in 5,034 children[38]. After WWII, the Sardinian government sponsored a nutritional program recommending milk consumption in children; it was widely promoted through social media advertising. It is very probable that the high consumption of cow’s milk could partly explain the faster maturation of children between 1950 and 1970, who rapidly reached a peak in secular trend stature. However, in the following years, (i) breastfeeding became less frequent among mothers from developed countries, including Northern Sardinia, (ii) the pressure exerted by parents upon their children to consume milk became weaker, and (iii) the progressive increase in the price of milk resulted in a reduction of its consumption[39]. More importantly, the ultra-high temperature (UHT) processed milk available on the market is deprived of several nutrients compared to fresh milk.
In addition, bone growth is regulated by the amount of physical activity[40], and the latest generation of children and adolescents are more prone to sedentariness than children from previous generations. Hormonal factors also must be considered as central players of children’s growth. Hypothyroidism has been associated with a delayed skeletal growth in childhood and a shorter stature with respect to the biological age[41]. Before the era of L-thyroxine replacement therapy, hypothyroidism was common on the island, due to iodine-restrictive diets and genetically-determined autoimmune processes[42]. Several preventive health programs, such as dietary supplementation with iodized salt or replacement therapy, curtailed the prevalence of hypothyroidism in the general Sardinian population, and may explain, at least in part, the rapid gain in stature[11]. Currently, hypothyroidism is no longer such a diffuse trait in the Sardinian population. However, additional hormonal factors, such as the abundance in the market of meat from farm animals treated with testosterone or endocrine disruptors, may interfere with the growth process in children.
Finally, adult height is influenced by environmental factors, from gestation. Compared with their Italian peers, Sardinian women have progressively shown a tendency towards late motherhood[43], and generations born after 1970 were often the offspring of older mothers with a less healthy lifestyle (smoking, alcohol consumption, and addiction to social drugs, among others), all of which can cause the birth of babies with low birth weight[44] and reduced post-natal growth[45].
Our study has some limitations. For instance, its retrospective design impedes any causal inference. It also lacks details about dietary habits and socioeconomic status. Moreover, the study cohort is not representative of the whole island, although the well-known genetic and sociocultural homogeneity of Sardinians might allow the reader to extend the results to the entire population[46, 47]. Even with these limitations, this study has some strengths, including the large sample size and the inclusion of female data, which is usually rare in stature studies.
In conclusion, the findings in this study underscore the complex interactions between genetic endowment and environmental influence in the determination of body height. Before the epidemiological transition, the majority of the Sardinians grew up in rural areas characterized by nutritional deprivation, and exposed to infectious diseases, mostly malaria, factors that resulted in an average adult height that was reported as the shortest within the Mediterranean area. These aspects were mitigated after the transitional era, when economic development, improved nutrition and hygienic conditions, vaccines, eradication of endemic infectious diseases, physical activity (children played on the street; computers, videogames, and cell phones were not yet in sight), in addition to an enhanced health care for pregnancy, entirely or in part, increased the standards of Sardinians’ living. In these conditions, the genetic endowment of Sardinians had the opportunity to exert its maximum potential, leading to the greatest increase in secular trends observed in the Mediterranean area. Several factors, including the consumption of low-quality food, sedentariness, and late motherhood, among others, or merely the fact that the maximum genetic potential has been attained, may explain the trend of the leveling off in height recently observed in Sardinia. However, all these speculations, although conceivable, require additional scientific evidence.
The Rise and Fall of the Secular Trend in Body Height in Sardinia: An Age-Period-Cohort Analysis
doi: 10.3967/bes2020.025
- Received Date: 2019-11-15
- Accepted Date: 2019-12-24
-
Key words:
- Body height /
- Secular trend /
- Socioeconomic status /
- Sardinia
Abstract:
| Citation: | Giovanni Mario PES, Roberta SALIS, Alessandra ERRIGO, Marco SATURNO, Stefano BIBBO', Bianca Maria QUARTA COLOSSO, Nunzio Pio LONGO, Maria Pina DORE. The Rise and Fall of the Secular Trend in Body Height in Sardinia: An Age-Period-Cohort Analysis[J]. Biomedical and Environmental Sciences, 2020, 33(3): 183-190. doi: 10.3967/bes2020.025 |





 Quick Links
 DownLoad:
