


HTML
-
The prevalence of obesity has grown rapidly in the Chinese population over the past decade. Between the periods of 2002 and 2012, according to the China Nutrition and Health Survey (CNHS), the obesity rate increased from 7.1% to 11.9% in Chinese adults[1,2]. According to a recent estimate, 0.13 billion adults are obese [body mass index (BMI) ≥ 28 kg/m2] in China[3]. Compared with the general obesity rate, the prevalence of abdominal obesity in the Chinese population was higher. Approximately 26.0% men [waist circumference (WC) ≥ 90 cm] and 25.3% women (WC ≥ 85 cm) adults had abdominal obesity in 2012. The age-adjusted prevalence of abdominal obesity increased by 42.1% among men and 26.5% among women from 2002 to 2012[4].
High BMI has been identified as the fourth leading risk factor for global death, following high systolic blood pressure, smoking, and high fasting plasma glucose; it was reported to cause 4.72 million deaths and 148 million DALYs globally by a 2017 GBD study[5]. However, Asians have higher prevalence of abdominal obesity despite the relatively lower prevalence of general obesity than other races[6]. Adverse health consequences associated with obesity may be increasingly underestimated by trends in BMI alone[7]. Unfortunately, BMI does not consider the distribution of body fat, but a number of diseases and mortality are more closely related to visceral fatty tissue accumulation than overall body fatness[8–11]. Moreover, BMI has undetermined validity for use as a measure of fatness in older people, as aging is generally associated with a considerable loss in lean body mass and some increase in fat mass[12]. Accumulating evidence showed that measurement of abdominal obesity is strongly and positively associated with all-cause, CVD, and cancer mortality independent of general obesity[13,14]; it may be a better predictor for the risk of myocardial infarction[15], type 2 diabetes[16], and metabolic syndrome than others[17]. Given that abdominal obesity is widely prevalent and rapidly growing in China, few studies have evaluated WC in association with mortality in Chinese. Thus, this study aimed to determine the degree of WC prediction for all-cause mortality. Moreover, whether there are gender-specific or age-specific particularities regarding the associations among Chinese adults was investigated using the Shanxi Nutrition and Chronic Diseases Family Cohort (Shanxi Cohort).
-
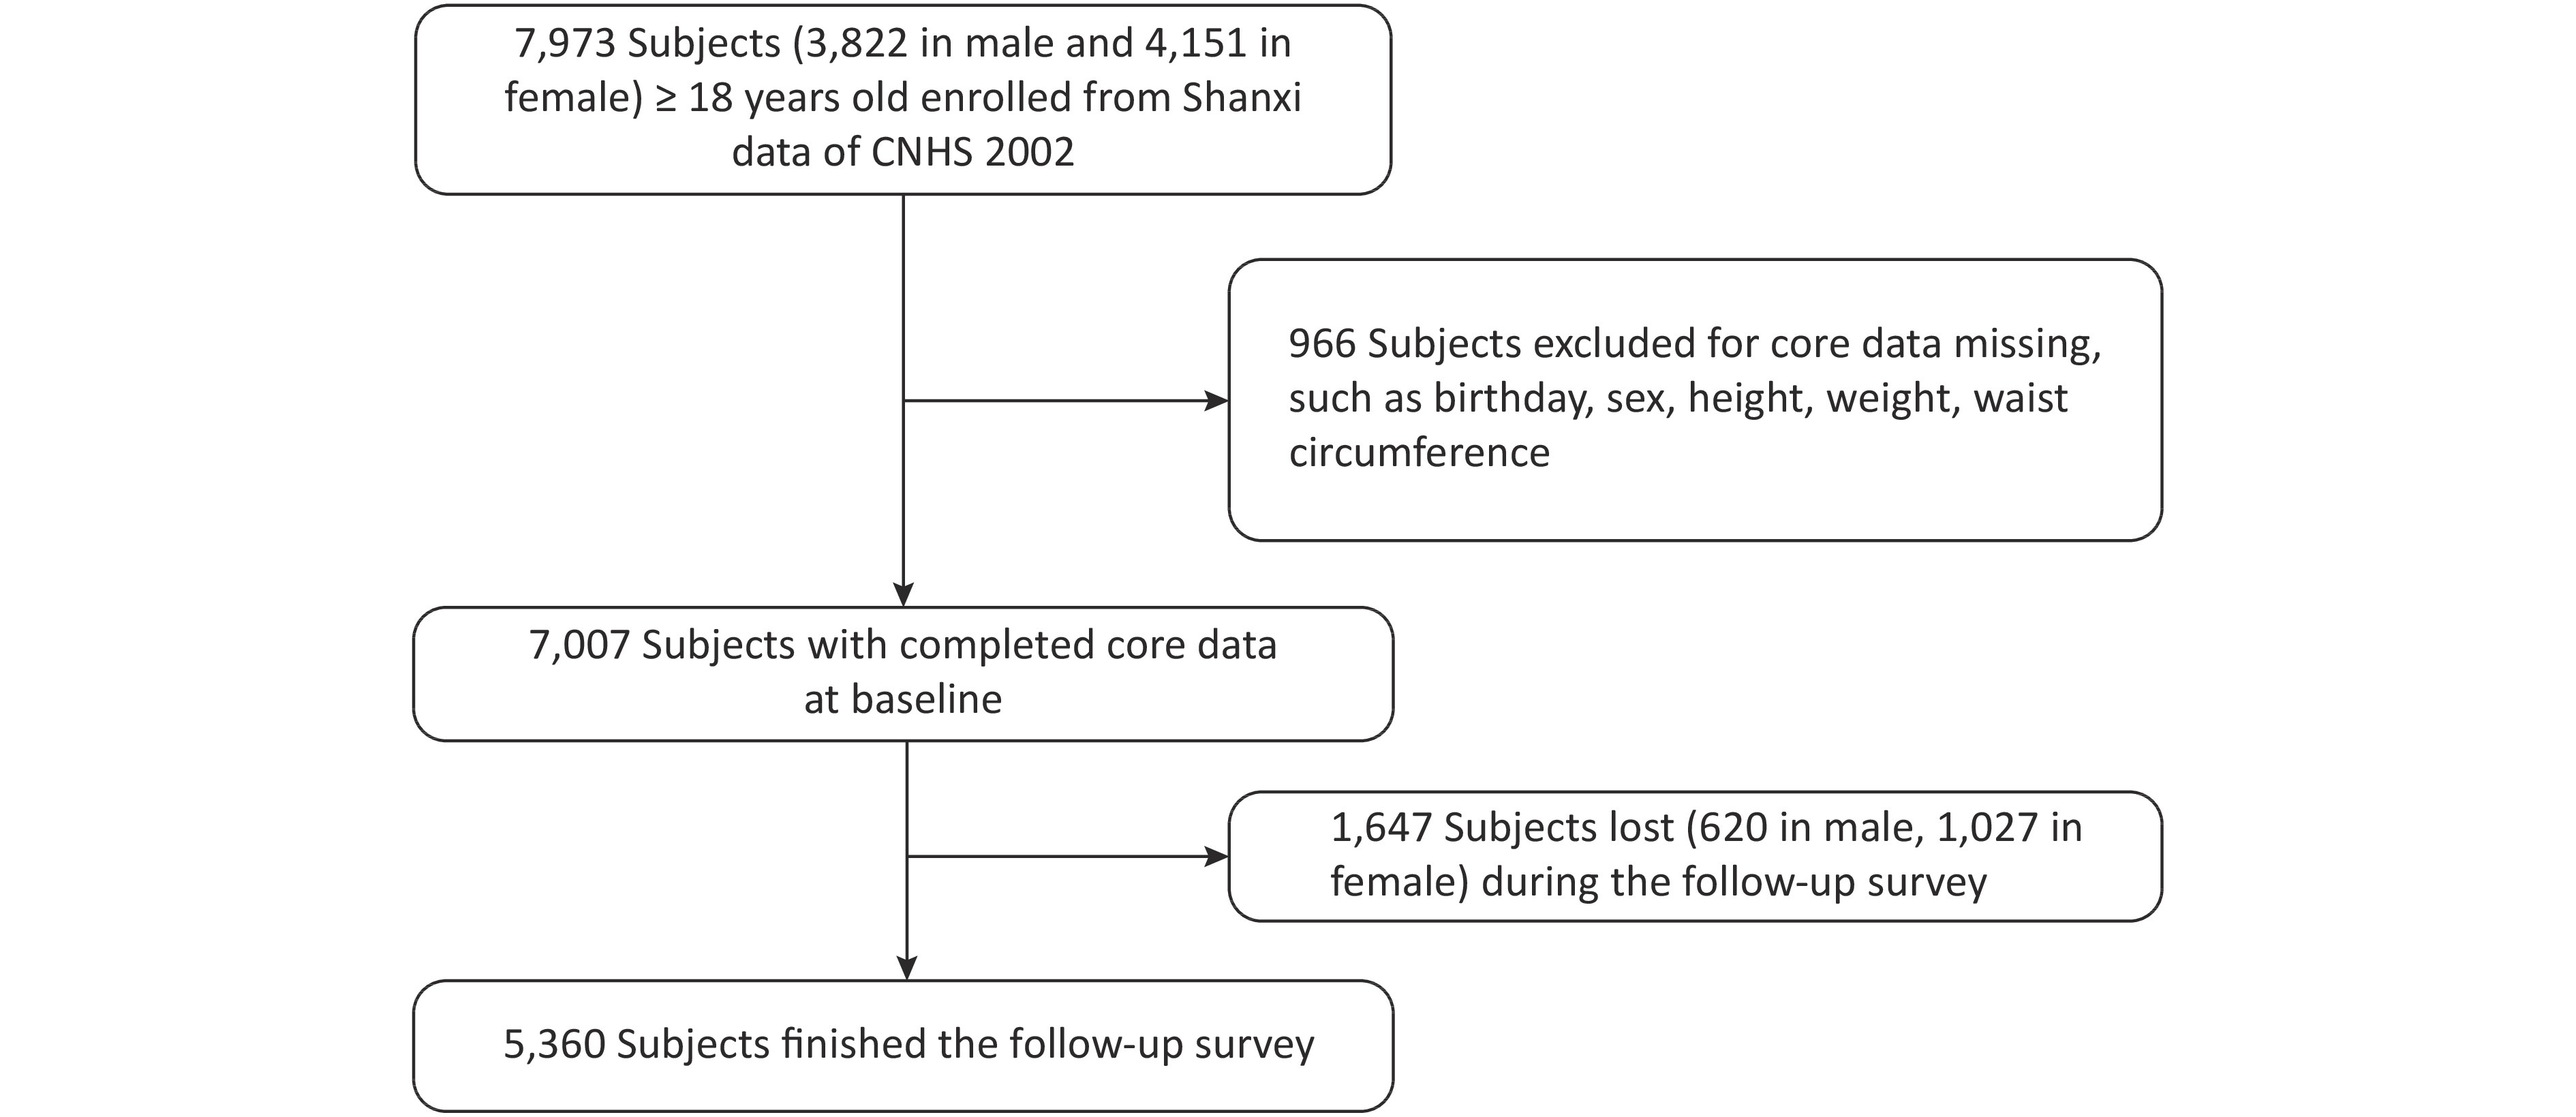
CNHS was conducted in 2002, which covered 31 provinces, autonomous regions, and municipalities of China and used a multi-stage and proportional to population size sampling design to select participants. Nutrition and Health Survey of Shanxi Province was part of CNHS, including six monitoring sites. Shanxi Nutrition and Chronic Diseases Family Cohort (Shanxi cohort) was a follow-up survey of Shanxi participants who participated in CNHS 2002. We used the data from the Shanxi part of CNHS as the baseline. Shanxi participants were invited to participate in a follow-up survey or death cause review during December 2015 and March 2016. In baseline, there were 7,007 people with complete core information, such as birth date, gender, height, weight, and WC. Pregnant women were excluded. A total of 5,360 respondents were followed up in 2015/2016, and the response rate was 76.5% (see Figure 1). The Shanxi cohort was approved by the ethics committee of the National Institute for Nutrition and Health of the Chinese Center for Disease Control and Prevention, and written informed consent was obtained from all participants (or their proxies).

Figure 1. Flow chart of participants’ enrolment in Shanxi Nutrition and Chronic Diseases Family Cohort.
-
The follow-up survey included inquiries and physical examinations in 2002 and 2015/2016. The inquiring survey covered basic information such as birth date, nationality, marital status, education, occupation, and financial income of the family members. Smoking was dichotomized as current smokers and noncurrent smokers. Current smokers were defined as a person aged 20 years and above who had smoked continuously or cumulatively for 6 months or more and had smoked within 30 days before the survey; or a person aged 18–19 years old who had smoked continuously or cumulatively for 3 months or more and had smoked within 30 days before the survey. Drinking was divided into four categories: no drinking, 1–2 times a week, 3–4 times a week, and ≥ 5 times a week. Exercise was dichotomized as regular exercise and no exercise. Regular exercise was defined as various regular physical activities for the purpose of improving health and more than 20 min each time. Education was grouped into three categories: ≤ 9 years of schooling (junior high school or lower), 10–12 years of schooling (high school), and ≥ 13 years of schooling (junior college or higher). Occupation was categorized as manual occupation, non-manual occupation, and others: (1) manual occupation: business and service employees; agriculture, forestry, animal husbandry, and fishery employees; and various production and transportation enterprises employees. (2) Non-manual occupation: managerial workers, officials, and proprietors of organizations, enterprises, and institutions; professional and technical personnel; clerical, sales, and kindred workers; members of the Armed Forces; and other workers. (3) Others: students at school, unemployed persons, and retirees. Marital status was dichotomized as follows: (1) unmarried, including single, widowed, or separated; and (2) married.
Physical examinations were performed by health professionals from the local county center for disease control and prevention (local CDC). Body height and weight were measured using standard protocols (without shoes and outerwear). Height was measured to the nearest 0.1 cm on a column stadiometer and weighed to the nearest 0.1 kg on a lever weight scale. BMI was calculated as weight (kg)/height squared (m2). WC was measured to the nearest 0.1 cm by a non-elastic flexible tape. We used the method recommended by the World Health Organization (WHO), which consists measuring midway between the lowest rib margin and the iliac crest at the mid-axillary line[18]. We divided WC into seven levels, such as WC < 75.0, 75.0–79.9, 80.0–84.9, 85.0–89.9, 90.0–94.9, 95.0–99.9, ≥ 100 cm for males; WC < 70.0, 70.0–74.9, 75.0–79.9, 80.0–84.9, 85.0–89.9, 90.0–94.9, and ≥ 95.0 cm for females.
-
The endpoint considered in our study was all-cause mortality. Participants who died between 2002 and 2016 were included in a retrospective investigation of causes of death in a 2015/2016 follow-up survey. The death cause data were collected using a standard protocol by trained staff from local CDC. The core information included identity card number, date of death, location of death, diagnosis of death, highest diagnostic hospital, highest diagnostic basis, death investigation record, and underlying death causes. All death causes were coded based on the International Classification of Diseases (ICD-10). There were three ways to investigate the death cause. First, the staff of local CDC visited the local hospital to check the medical and death records of the deceased, verify the cause of death, and fill in the death cause review questionnaire and household survey. Second, a family member of the deceased provided a medical certificate of the death cause to the staff of the local CDC. The death information was transcribed by an investigator. Third, if the above conditions were not met, the staff of local CDC would ask the family members of the deceased to review the death process and infer the death cause.
All investigators of death cause review from the local CDC received two unified training and assessments by death monitoring experts of China CDC and Shanxi CDC. The professional quality controllers were responsible for death cause review quality assessment, including the completeness, coding, and internal logic of each items reported on death certificates. Subsequently, 100% death records were reviewed, and the underlying cause of death was confirmed by the death monitoring experts of China CDC. The failed death records were returned to the local CDC. The investigator conducted information re-check and supplementary collection by household or telephone survey until the death cause was confirmed.
-
All data analysis was performed by gender stratification. We compared the baseline information between follow-up and lost subjects by gender. Baseline characteristics in the subgroups were expressed as means ± standard deviation (SD) for continuous variables or proportion (%) for categorical variables. The t-test and chi-square test were used. Censored referred to subjects who survived in the 2015–2016 follow-up survey. Person-years were calculated through the following formulas. Person-years of the deceased subjects = (death year − 2002) + (death month − 2002 survey month) / 12 + (death day − 2002 survey day) / 365. Person-years of living subjects = (follow-up year − 2002) + (Follow-up month − 2002 survey month) / 12 + (follow-up day − 2002 survey day) / 365. Death density was calculated through the number of deaths divided by 100,000 follow-up years in each WC group. The fifth WC group was used as the reference category, such as 90.0–94.9 cm in the male subgroup and 85.0–89.9 cm in the female subgroup. Cox proportional hazard models were used to estimate the hazard ratio (HR) for the association between WC groups and mortality. The floating absolute risk method was used to estimate group-specific 95% confidence intervals (CIs). Use of floating methods does not alter the estimates of HR but yields floating SE and floating CI (FCI) that enable valid comparisons to be made between any two WC groups, even if neither is the reference group[19]. The model was adjusted for age, BMI, demographic characteristics (education, marital status, and occupation), and health-related risk factors (smoking, drinking, and regular exercise). We conducted stratified analysis by gender and age groups (≥ 60 or < 60 years old). Several sensitivity analyses were conducted to test the robustness of the results: (1) excluding current smokers; (2) excluding participants who had self-reported stroke, self-reported hypertension and diabetes, or detected at baseline physical examination; (3) excluding participants who died from accidental causes; and (4) excluding participants who died during the first 2 years of follow-up to scrutinize the possibility of reverse causation. Two-sided P < 0.05 was considered statistically significant. All analyses were performed using SAS software, version 9.4 (SAS Institute Inc., Carey, NC, USA).
-
There were 7,007 participants aged 18 years old and above, and complete core information was recorded at the baseline database. The mean (SD) age was 43.8 (14.2) years, and 54.5% were women. A total of 5,360 participants (2,572 males and 2,788 females) attended the follow-up survey, and 1,647 participants (620 males and 1,027 females) were lost during 2015 and 2016. Table 1 shows details of the study participants at baseline by comparing the general information between the follow-up and lost subjects. The male follow-up subjects were older and had a lower WC than their lost counterparts. The proportion of marital status and drinking significantly differed between the follow-up and lost males. The female follow-up subjects were older and had a lower height and WC than their lost counterparts. The proportion of education level, occupation, and marital status and the prevalence of hypertension significantly differed between the follow-up and lost females.
Item Male (n = 3,192) Female (n = 3,815) Follow-up Lost Statistical value* P Follow-up Lost Statistical value* P N 2,572 620 2,788 1,027 Age (Mean ± SD, years) 45.9 ± 14.0 44.2 ± 14.8 2.80 0.005 44.0 ± 13.6 38.0 ± 14.5 11.57 < 0.001 Height (Mean ± SD, cm) 167.3 ± 6.1 167.8 ± 6.9 −1.66 0.097 156.3 ± 5.9 157.4 ± 5.6 −5.32 < 0.001 Weight (Mean ± SD, kg) 65.8 ± 9.9 66.6 ± 10.0 −1.78 0.075 58.5 ± 9.2 58.7 ± 8.9 −0.69 0.490 BMI (Mean ± SD, kg/m2) 23.5 ± 3.1 23.7 ± 3.2 −1.13 0.258 24.0 ± 3.5 23.7 ± 3.3 1.98 0.048 WC (Mean ± SD, cm) 80.4 ± 9.2 81.3 ± 9.2 −2.10 0.035 76.7 ± 9.1 78.6 ± 9.9 −5.37 < 0.001 Education, N (%) 2,562 (100) 619 (100) 3.05 0.218 2,782 (100) 1,027 (100) 81.21 < 0.001 Junior high school or lower 1,888 (73.7) 440 (71.1) 2,299 (82.6) 717 (69.8) High school 513 (20.0) 129 (20.8) 383 (13.8) 223 (21.7) College or higher 161 (2.3) 50 (8.1) 100 (3.6) 87 (8.5) Occupation, N (%) 2,571 (100) 617 (100) 4.04 0.133 2,786 (100) 1,026 (100) 72.67 < 0.001 Non-manual 553 (21.5) 127 (20.6) 274 (9.8) 202 (19.7) Manual 1,616 (62.8) 373 (60.4) 864 (31.0) 244 (23.8) Others 402 (15.7) 117 (19.0) 1,648 (59.2) 580 (56.5) Marital status, N (%) 2,569 (100) 619 (100) 32.00 < 0.001 2,788 (100) 861 (100) 41.96 < 0.001 Married 2,331 (90.7) 513 (82.9) 2,542 (91.2) 861 (83.8) No spouse 238 (9.3) 106 (17.1) 246 (8.8) 166 (16.2) Smoking, N (%) 2,495 (100) 579 (100) 0.80 0.371 2,723 (100) 973 (100) 2.13 0.144 Current smoking 1,588 (63.6) 357 (61.7) 22 (0.8) 13 (1.3) No smoking 907 (36.4) 222 (38.3) 2,701(99.2) 960 (98.7) Drinking, N (%) 2,498 (100) 582 (100) 11.26 0.010 2,721 (100) 974 (100) 1.58 0.664 No drinking 1,625 (65.0) 343 (58.9) 2,687 (98.8) 965 (99.1) 1–2 times per week 549 (22.0) 155 (26.7) 20 (0.7) 5 (0.5) 3–4 times per week 166 (6.7) 52 (8.9) 1 (0.0) 1 (0.1) ≥ 5 times per week 158 (6.3) 32 (5.5) 13 (0.5) 3 (0.3) Regular exercise, N (%) 2,499 (100) 582 (100) 0.10 0.748 2,721 (100) 966 (100) 1.12 0.290 Yes 304 (12.2) 68 (11.7) 298 (10.9) 94 (9.7) No 2,195 (87.8) 514 (88.3) 2,423 (89.1) 872 (90.3) Hypertension, N (%) 2,572 (100) 620 (100) 1.97 0.160 2,788 (100) 1,027 (100) 17.24 < 0.001 Yes 629 (24.5) 135 (21.8) 655 (23.5) 177 (17.2) No 1,943 (75.5) 485 (78.2) 2,133 (76.5) 850 (82.8) Diabetes, N (%) 2,572 (100) 620 (100) 1.89 0.169 2,788 (100) 1,027 (100) 0.14 0.709 Yes 55 (2.1) 19 (3.1) 57 (2.0) 23 (2.2) No 2,517 (97.9) 601 (96.9) 2,731 (98.0) 1,004 (97.8) Stroke, N (%) 2,492 (100) 578 (100) 0.19 0.661 2,707 (100) 969 (100) 0.18 0.675 Yes 17 (0.7) 3 (0.5) 11 (0.4) 3 (0.3) No 2,475 (99.3) 575 (99.5) 2,696 (99.6) 966 (99.7) Note. *When comparing between continuous variable groups, the statistic value represents the t value; when the categorical variable group is compared, the statistic value represents the chi-square value. Table 1. Baseline characteristics of participants at follow-up or lost by gender
-
During a mean of 12.5 years of follow-up, 615 death events (364 for males and 251 for females) were documented among 5,360 participants. In the male subgroup, the lowest density of death was 698/100,000 person-years in the fifth WC group (90.0–94.9 cm). With WC group 5 as the reference group, Cox regression analysis showed that the risk of death increased in groups 1, 2, 3, and 7. The HR value and 95%
FCIs of groups 1, 2, 3, and 7 were 2.13 (1.79–2.52), 1.70 (1.35–2.14), 1.34 (1.05–1.72), and 2.17 (1.20–3.92), respectively. After adjusting for age, BMI, education, occupation, marital status, smoking, drinking, and regular exercise, WC groups 1 [1.60 (1.35–1.90)] and 2 [1.40 (1.11–1.76)] were significantly associated with high risk of all-cause mortality. In the female subgroup, the lowest density of death was 588/100,000 person-years in the sixth WC group (90.0–94.9 cm). With WC group 5 as the reference group, Cox regression analysis showed that the risk of death increased in group 7. The HR value and 95% FCI were 2.01 (1.19–3.39). After multivariable adjustment, groups 1, 2, and 7 were significantly associated with high risk of all-cause mortality. The adjusted HRs of groups 1, 2, and 7 were 1.43 (1.11–1.83), 1.39 (1.05–1.84), and 1.91 (1.13–3.22), respectively (Table 2).
WC groups (cm) Death (n) Persons years Death density
(/100 thousand PY)HR
(95% FCI)Adjusted HR*
(95% FCI)Male 1 < 75.0 134 8,975 1,493 2.13 (1.79−2.52) 1.60 (1.35−1.90) 2 75.0−79.9 76 6,243 1,217 1.70 (1.35−2.14) 1.40 (1.11−1.76) 3 80.0−84.9 62 6,620 937 1.34 (1.05−1.72) 1.15 (0.90−1.48) 4 85.0−89.9 44 4,606 955 1.34 (0.99−1.80) 1.22 (0.90−1.64) 5 90.0−94.9 22 3,152 698 1.00 (0.66−1.52) 1.00 (0.66−1.52) 6 95.0−99.9 15 1,399 1,072 1.54 (0.93−2.55) 0.93 (0.56−1.54) 7 ≥ 100.0 11 730 1,507 2.17 (1.20−3.92) 1.72 (0.95−3.11) Female 1 < 70.0 63 8,068 781 1.22 (0.95−1.57) 1.43 (1.11−1.83) 2 70.0−74.9 49 7,170 683 1.09 (0.82−1.44) 1.39 (1.05−1.84) 3 75.0−79.9 50 7,718 648 1.03 (0.78−1.36) 1.23 (0.94−1.63) 4 80.0−84.9 41 5,979 686 1.09 (0.80−1.48) 1.14 (0.84−1.55) 5 85.0−89.9 23 3,653 630 1.00 (0.66−1.50) 1.00 (0.66−1.50) 6 90.0−94.9 10 1,702 588 0.93 (0.50−1.73) 0.61 (0.33−1.14) 7 ≥ 95.0 15 1,114 1,346 2.01 (1.19−3.39) 1.91 (1.13−3.22) Note. *Adjusted by age, BMI, education, occupation, marital status, smoking, drinking, and regular exercise. Table 2. Death density and multivariate adjusted HR (95% FCI) by gender and WC groups
-
The lowest densities of death were 436/100,000 person-years for males younger than 60 years old and 2,498/100,000 person-years for elderly males (age ≥ 60 years old) in the fifth WC group (90.0–94.9 cm). For males younger than 60 years old, Cox regression analysis showed that WC was not significantly associated with high risk of all-cause mortality in each group. Different results were found in elderly males. The risk of death increased in groups 1, 2, and 3 after multivariate adjustment. The adjusted HR values and 95%
FCIs of groups 1, 2, and 3 were 2.03 (1.65–2.49), 1.67 (1.24–2.25), and 1.41 (1.02–1.95), respectively (Table 3). WC groups (cm) Death (n) Persons years Death density
(/100 thousand PY)HR
(95% FCI)Adjusted HR*
(95% FCI)Male < 60 years old (N = 2,088) 1 < 75.0 43 7,284 590 1.32 (0.98−1.79) 1.34 (0.99−1.82) 2 75.0−79.9 31 5,265 589 1.35 (0.95−1.92) 1.30 (0.91−1.84) 3 80.0−84.9 25 5,673 441 1.01 (0.68−1.49) 0.96 (0.65−1.43) 4 85.0−89.9 21 3,973 529 1.15 (0.74−1.79) 1.19 (0.76−1.84) 5 90.0−94.9 12 2,751 436 1.00 (0.57−1.76) 1.00 (0.57−1.76) 6 95.0−99.9 6 1,186 506 1.16 (0.52−2.59) 1.17 (0.52−2.59) 7 ≥ 100.0 4 615 651 1.50 (0.56−4.00) 1.44 (0.54−3.83) ≥ 60 years old (N = 484) 1 < 75.0 91 1,691 5,381 2.22 (1.81−2.73) 2.03 (1.65−2.49) 2 75.0−79.9 45 978 4,600 1.78 (1.32−2.41) 1.67 (1.24−2.25) 3 80.0−84.9 37 947 3,905 1.59 (1.15−2.19) 1.41 (1.02−1.95) 4 85.0−89.9 23 633 3,634 1.46 (0.97−2.20) 1.35 (0.90−2.04) 5 90.0−94.9 10 400 2,498 1.00 (0.54−1.86) 1.00 (0.54−1.86) 6 95.0−99.9 9 213 4,216 1.73 (0.90−3.32) 1.06 (0.55−2.03) 7 ≥ 100.0 7 115 6,068 2.54 (1.21−5.33) 1.98 (0.94−4.15) Female < 60 years old (N = 2,381) 1 < 70.0 20 7,122 281 1.47 (0.95−2.28) 1.73 (1.11−2.67) 2 70.0−74.9 16 6,443 248 1.30 (0.80−2.12) 1.38 (0.85−2.26) 3 75.0−79.9 21 6,759 311 1.62 (1.06−2.49) 1.66 (1.08−2.55) 4 80.0−84.9 14 5,151 272 1.42 (0.84−2.40) 1.49 (0.88−2.52) 5 85.0−89.9 6 3,134 191 1.00 (0.45−2.23) 1.00 (0.45−2.23) 6 90.0−94.9 5 1,424 351 1.84 (0.76−4.41) 1.73 (0.72−4.16) 7 ≥ 95.0 5 947 528 2.77 (1.15−6.64) 2.55 (1.06−6.13) ≥ 60 years old (N = 407) 1 < 70.0 43 945 4,549 1.38 (1.02−1.87) 1.23 (0.91−1.66) 2 70.0−74.9 33 727 4,541 1.43 (1.02−2.01) 1.42 (1.01−2.00) 3 75.0−79.9 29 960 3,022 0.92 (0.64−1.32) 0.91 (0.63−1.30) 4 80.0−84.9 27 828 3,262 1.00 (0.69−1.47) 1.13 (0.78−1.65) 5 85.0−89.9 17 519 3,274 1.00 (0.62−1.61) 1.00 (0.62−1.61) 6 90.0−94.9 5 278 1,800 0.54 (0.22−1.29) 0.35 (0.15−0.85) 7 ≥ 95.0 10 168 5,957 1.70 (0.88−3.27) 2.11 (1.10−4.06) Note. *Adjusted by BMI, education, occupation, marital status, smoking, drinking, and regular exercise. Table 3. Death density and multivariate adjusted HR (95% FCI) by gender, age, and WC groups
The lowest densities of death were 191/100,000 person-years for females younger than 60 years old in the fifth WC group (85.0–89.9 cm) and 1,800/100,000 person-years for elderly females (aged ≥ 60 years old) in the sixth WC group (90–94.9 cm). With WC group 5 as the reference group, after multivariable adjustment, those in groups 1, 3, and 7 had high risks for all-cause mortality among female age < 60 years old. The adjusted HR values and 95%
FCIs of groups 1, 3, and 7 were 1.73 (1.11–2.67), 1.66 (1.08–2.55), and 2.55 (1.06–6.13), respectively. However, for elderly females, WC groups 2 [1.42 (1.01–2.00)] and 7 [2.11 (1.10–4.06)] were significantly associated with high risk of all-cause mortality after multivariable adjustment. In addition, WC group 6 [0.35 (0.15–0.85)] was significantly associated with low risk of all-cause mortality (Table 3). -
Table 4 shows the detailed results of sensitivity analysis by various methods. Excluding current smokers modified the HR estimates materially. Multivariable-adjusted HRs fluctuated; they decreased in groups 1–3 and increased in groups 6 and 7 among men. Adjusted HRs rose slightly in each group among women. By excluding the participants who had self-reported stroke, self-reported hypertension and diabetes, or detected at baseline, adjusted HRs for males decreased in groups 2 and 3 and increased in groups 1, 4, 6, and 7; adjusted HR for female decreased in each group. Excluding participants who died from accidental causes, adjusted HR declined in each group except in group 7 among males; adjusted HRs decreased in groups 1–4 and stabilized in groups 6 and 7 among females. Excluding participants who died during the first 2 years of follow-up, adjusted HRs declined in each group, except in group 6 and 7 among men, and declined in each group, except in group 2 among women.
WC groups
(cm)Excluding current
smokersExcluding subjects with stroke, hypertension or diabetes at baseline Excluding accidental
deathExcluding death within the first 2 years of
follow-upHR
(95% FCI) Adjusted HR*
(95% FCI)HR
(95% FCI)Adjusted HR*
(95% FCI)HR
(95% FCI)Adjusted HR*
(95% FCI)HR
(95% FCI)Adjusted HR*
(95% FCI)Male N = 984 N = 1,903 N = 2,545 N = 2,530 1 < 75.0 1.82
(1.38−2.40)1.52
(1.15−2.00)2.87
(2.34−3.51)1.74
(1.42−2.13)2.12
(1.78−2.52)1.55
(1.30−1.84)2.16
(1.81−2.58)1.46
(1.23−1.75)2 75.0−79.9 1.41
(0.99−2.02)1.27
(0.89−1.82)1.84
(1.37−2.48)1.21
(0.90−1.63)1.64
(1.29−2.08)1.31
(1.03−1.66)1.57
(1.23−2.02)1.21
(0.94−1.55)3 80.0−84.9 1.10
(0.75−1.62)0.95
(0.65−1.39)1.37
(0.96−1.96)1.09
(0.76−1.56)1.21
(0.92−1.58)1.05
(0.80−1.38)1.38
(1.07−1.79)1.14
(0.88−1.47)4 85.0−89.9 1.37
(0.89−2.09)1.23
(0.80−1.89)1.42
(0.93−2.18)1.32
(0.86−2.03)1.34
(0.98−1.82)1.20
(0.88−1.63)1.17
(0.83−1.63)1.03
(0.73−1.44)5 90.0−94.9 1.00
(0.55−1.81)1.00
(0.55−1.81)1.00
(0.52−1.92)1.00
(0.52−1.92)1.00
(0.65−1.53)1.00
(0.65−1.53)1.00
(0.65−1.55)1.00
(0.65−1.55)6 95.0−99.9 1.50
(0.71−3.14)1.15
(0.55−2.42)1.36
(0.51−3.62)1.08
(0.41−2.88)1.50
(0.89−2.54)0.88
(0.52−1.49)1.59
(0.94−2.68)0.98
(0.58−1.66)7 ≥ 100.0 2.82
(1.35−5.92)1.79
(0.86−3.76)1.46
(0.36−5.82)1.93
(0.48−7.72)2.27
(1.26−4.10)1.80
(0.99−3.24)2.40
(1.33−4.34)2.08
(1.15−3.76)Female N = 2,766 N = 2,094 N = 2,779 N = 2,755 1 < 70.0 1.27
(0.99−1.63)1.48
(1.16−1.90)1.23
(0.90−1.67)0.84
(0.62−1.14)1.16
(0.90−1.50)1.35
(1.05−1.75)1.03
(0.78−1.36)1.31
(0.99−1.73)2 70.0−74.9 1.13
(0.85−1.49)1.45
(1.10−1.92)1.07
(0.75−1.53)0.83
(0.58−1.18)1.07
(0.80−1.41)1.38
(1.04−1.83)1.07
(0.80−1.43)1.44
(1.07−1.92)3 75.0−79.9 1.04
(0.79−1.38)1.27
(0.96−1.68)0.75
(0.49−1.14)0.65
(0.42−0.99)1.01
(0.76−1.33)1.22
(0.92−1.61)0.95
(0.70−1.27)1.14
(0.85−1.54)4 80.0−84.9 1.13
(0.83−1.54)1.20
(0.89−1.64)0.49
(0.25−0.93)0.37
(0.19−0.71)1.02
(0.74−1.40)1.08
(0.78−1.48)0.97
(0.70−1.36)1.02
(0.73−1.43)5 85.0−89.9 1.00
(0.66−1.52)1.00
(0.66−1.52)1.00
(0.55−1.81)1.00
(0.55−1.81)1.00
(0.66−1.50)1.00
(0.66−1.50)1.00
(0.66−1.52)1.00
(0.66−1.52)6 90.0−94.9 0.98
(0.53−1.83)0.68
(0.36−1.26)0.96
(0.36−2.56)0.47
(0.18−1.24)0.93
(0.50−1.73)0.61
(0.33−1.13)0.78
(0.39−1.55)0.55
(0.27−1.10)7 ≥ 95.0 2.10
(1.24−3.54)2.03
(1.20−3.43)1.82
(0.82−4.05)1.63
(0.73−3.62)2.01
(1.19−3.39)1.91
(1.13−3.22)1.96
(1.14−3.37)1.80
(1.05−3.10)Note. *Adjusted by age, BMI, education, occupation, marital status, smoking, drinking, and regular exercise. Table 4. Multivariate adjusted HR (95% FCI) in sensitivity analysis
-
In some previous studies, the relationship between WC and total death was J-shaped[20] or a positive linear relationship[21-24]. A combined analysis of six prospective cohorts of 650,000 white people aged 20–83 years found a strong positive linear relationship between WC and all-cause death after multivariable adjustment. The HR values of each 5 cm of WC were 1.07 (1.06–1.08) for males and 1.09 (1.08–1.09) for females[25]. Another cohort study of 41,313 subjects (2,822 deaths) in Australia showed a linear association between WC and all-cause mortality for men, whereas a U-shaped association was observed for women[26]. Similarly, gender differences were found in our research. We found that WC had a U-shaped relationship with all-cause mortality among women but not in men. In addition, the relationship between WC and all-cause death differed by body composition related to race. There was an opposite research conclusion in relatively lean Japanese subjects. After multifactor adjustment, compared with the lowest quintile, the highest quintile of WC in men was associated with a linear reduction in all-cause mortality risk (adjusted HR = 0.73, 95% CI: 0.60–0.89) but not in women[27].
Age is also a key factor in the relationship between WC and death. Changes in body composition with age have been depicted in longitudinal studies, including decreased lean body mass, and increased fat mass with central body fat redistribution[28]. Whether WC is the most appropriate indicator for assessing the relationship between disease and death for elderly people remains controversial. A 14.7-year follow-up prospective Japanese community-based study has shown that increased WC does not influence all-cause or CVD mortality risk in elderly men, whereas a small WC increases this risk[27]. An American Cardiovascular Health Study with 1,564 deaths and 9-year follow-up found that mortality risk increased 13% for each SD increase in WC after adjusting for BMI among the subjects aged 65 and older[29]. In a sample of 57,053 Danish men and women aged 50–64 years, the study reported that WC showed a positive dose-response relationship with 5-year mortality when controlled for BMI[30]. In a sample of 2,739 American postmenopausal women with coronary heart disease, a study reported that, within a given BMI category, there was an increasing risk of mortality with increasing WC[31]. In the present study, we found a difference in the relationship between WC and death by age stratification analysis. WC did not influence all-cause mortality risk in younger men, but the low WC (< 85.0 cm) increased the risk of all-cause mortality for the elderly men. A U-shaped relationship between WC and all-cause mortality was reported among younger and older women.
Smoking is associated with high mortality[21, 32, 33] and WC[33-35]. Smokers tend to have a metabolically more adverse fat distribution profile with higher central adiposity than nonsmokers[36]. Therefore, this study excluded the confounding factor of smoking and further analyzed the relationship between abdominal obesity and risk of death. We found that the risk of all-cause mortality in each WC group increased slightly among women but decreased in the WC group < 85.0 cm and increased in the WC group ≥ 95.0 cm among men. Other studies also reported different dose-response relationships between WC and total mortality risk in nonsmokers and smokers. For example, a European Prospective Investigation into Cancer and Nutrition (EPIC) study showed that former and current male smokers have a stronger association between WC and all-cause mortality than their counterparts (P-interaction = 0.02)[37]. However, a study including 46,651 Caucasians from 12 cohorts in four European countries found that the relationship between WC and mortality was not substantially altered by smoking status[38].
Pre-existing illness has also been known to contribute to increased mortality risk among individuals with low BMI[39], so the individuals with low BMI at baseline possibly had a history of existing disease that contributed to the increased risk of death observed among low BMI participants. According to this point of view, our study excluded the participants with stroke, hypertension, and diabetes; accidental death; and died within first 2 years of follow-up. The adjusted HR decline of most subgroups in sensitivity analyses suggested that reverse causality was driving the relationship between central adiposity and mortality in this study. However, in a European study, the potential influence of reverse causality was checked by excluding the first 5 years of follow-up of which less than 7% of the study population and 25% of the mortality events were excluded, and the results were not altered[38].
The response rate was 76.5% in our study. Nearly a quarter of the participants were lost to follow-up. The individuals lost to follow-up had higher WC measurements than those who were still alive at follow-up. Adipose tissue, particularly tissue from visceral fat deposits, secretes potential mediators in the development of chronic diseases[40]; this process may explain why abdominal fat distribution was related to the risk of death independent of BMI[37]. Further combined with the sensitivity analysis results of excluding stroke, hypertension, and diabetes, we speculated that if these people were not lost to follow-up, then the risk of death may increase slightly.
This study has several key strengths, including population-based recruitment and use of a long-term 12.5-year mortality follow-up reported to date for assessing the association of WC with mortality. This study was based on data from the Chinese population where little is known on the association of WC and mortality. In addition, all anthropometric measures were collected in a standardized way by trained staff according to standard protocols as opposed to self-reported. Ensuring high internal validity is one of the top priorities of any cohort study[6]. Our study has certain limitations. WC measures were assessed at only one point in time, so the estimates could not account for changes in WC during follow-up. A dynamic measure of weight status was found to be more predictive of mortality than a static measure[41]. Given that the baseline data were from a cross-sectional survey, our sample size was still relatively limited. We did not analyze the relationship between WC and cause-specific mortality. The thresholds detected for all-cause mortality reflect a mixed relationship between abdominal obesity and different causes of death. This relationship may be affected by differences in constitutions of the causes of death across countries[38].
-
In conclusion, the relationship between WC and all-cause mortality differed by gender- and age-stratified analyses in the study population. Low WC (< 80.0 cm) for men and low WC (< 75.0 cm) and high WC (≥ 95.0 cm) for women are predictors of all-cause death. Our results strongly suggest that WC serves as an important predictor of mortality in the general Chinese population.
-
The authors declare no conflict of interest.
-
The authors appreciate the subjects for participation in this study. The authors also thank the staff of China CDC and local CDCs for conducting the study activities.

 Quick Links
 DownLoad: