


-
Selenium, which has both nutritional and toxicological properties, is one of the most essential trace elements for human health. It is a type of micronutrient that maintains biological functions through the action of selenium-containing proteins known as selenoproteins; a group of critically important enzymes[1,2]. In its protective role against oxidative stress, selenium has shown benefits in preventing cardiovascular disease, cancer, and other chronic diseases[2,3]. The human health effects related to selenium exposure have long interested researchers, but have also raised some vexing challenges[3,4].
Evidence linking selenium to glucose metabolism is conflicting[3]. Previous studies demonstrated insulin-like effects of selenium in animal models[5], and a link between lower selenium exposure was also observed in patients with type 2 diabetes[6]. However, subsequent human trials demonstrated that selenium plays a dual role in the initiation and development of diabetes[3]. Some laboratory studies indicated that a few selenium forms and selenoproteins adversely affect glucose metabolism[7], thus providing biological plausibility for an effect on occurrence of diabetes[8]. A likely U-shaped non-linear dose-response relationship exists between serum selenium levels and type 2 diabetes and populations with relatively low levels and high levels of serum selenium have a significantly higher prevalence of type 2 diabetes[9]. A recent meta-analysis confirmed that selenium may increase the risk of type 2 diabetes across a wide range of exposure levels[10].
In China, several studies examined the association between selenium and diabetes, but this relationship is still controversial[11-14]. An intervention trial in Chinese people suggested that selenium supplementation only improved some indices of antioxidant capacity in people with adequate selenium intake[15].
Selenium enters the food chain through plants, which take it up from the soil. Human dietary intakes of selenium also range from high to low according to geography[2]. Since the current selenium level of human body is consistent with the environmental selenium levels, there is a positive correlation between soil and serum selenium in local residents[16]. Distribution of soil selenium around the world is not uniform and has significant spatial variability. China is a selenium-deficient country[17,18] and therefore, the effect of selenium on diabetes from other selenium-rich countries or regions may not be generalizable to the Chinese population.
In this article, the association between selenium soil levels and the risk of diabetes was explored using data from the China Chronic Diseases and Behavioral Risk Factors Surveillance survey in 2010[19] and the Atlas of Soil Environmental Background in China[17] published in 1994. This study aims to provide new epidemiological evidence to this research area as well as valuable references for many selenium-deficient countries.
-
Data used in this study were derived from the 2010 survey of the China Chronic Diseases and Behavioral Risk Factors Surveillance, which has been described in detail elsewhere[19,20]. A multi-stage stratified clustering sampling method was employed and a nationally representative sample of the general population was selected. The major geographic areas in all 31 provinces in mainland China were covered. Data collection was conducted in physical examination centers at local health stations or community clinics in the participants’ residential area by trained staff according to a standard protocol. A questionnaire, which included information on demographic characteristics, medical history, and lifestyle factors, was administered by trained interviewers. The study protocol was approved by the ethical review committees of the Chinese Center for Disease Control and Prevention (China CDC) and all participating institutions. Written informed consent was obtained from all participants.
In this study, four out of a total of 162 districts/counties were excluded due to missing data on selenium concentrations in soil. A total of 69,690 participants aged 35–74 years from 158 districts/counties took part in the survey, of which, participants with missing data on diabetes (n = 358) were excluded. Finally, a total of 69,332 participants (31,144 males and 38,188 females) were analyzed.
-
In accordance with the American Diabetes Association (ADA) criteria[21], diabetes was defined as (1) a self-reported previous diagnosis by health care professionals; (2) a fasting plasma glucose level of 126 mg/dL or higher (to convert to millimoles per liter, multiply by 0.0555); (3) a 2-h plasma glucose level of 200 mg/dL or higher; or (4) a glycated hemoglobin or Hemoglobin A1C (HbA1c) concentration of 6.5% or more. A binary outcome for diabetes was used, with diabetes coded as 1, and non-diabetes coded as 0.
-
Selenium concentrations in soil were obtained from the Atlas of Soil Environmental Background Values in China[17] published in 1994, which recorded background values of 61 chemical elements. The values were estimated by sampling from 4,095 sites, including 41 soil groups throughout mainland China[22]. Environmental background soil values were influenced by long-term stability physical factors, such as climate, geology, hydrology, vegetative cover, and so on; hence, no noticeable changes were seen during the study period. Soil selenium concentrations of each district/county were divided into four grades by quartile values (P25 = 0.185 mg/kg, P50 = 0.219 mg/kg, P75 = 0.248 mg/kg) among the 158 districts/counties: Quartile 1, 0.119–0.185 mg/kg; Quartile 2, 0.186–0.219 mg/kg; Quartile 3, 0.220–0.248 mg/kg; Quartile 4, 0.249–0.344 mg/kg. Soil selenium concentrations were used as dummy variables by treating Quartile 2, which had the lowest risk for diabetes, as the reference.
-
Four demographic characteristics (sex, age, household income, and family history of diabetes) were included in the analysis. Sex was a dichotomous variable, age was divided into four groups (35–44 years, 45–54 years, 55–64 years, and 65–74 years), family history of diabetes was defined as either of the participant’s parents as having diabetes or not, and household income was estimated by per capita annual incomes of households in 2009, which was divided into four grades by quartile values (P25 = 3,500 RMB, P50 = 7,200 RMB, P75 = 12,600 RMB) among the 69,332 participants: Quartile 1, 3,500 RMB or lower; Quartile 2, 3,501–7,200 RMB; Quartile 3, 7,201–12,600 RMB; and Quartile 4, more than 12,600 RMB.
Four lifestyle factors were used in the analysis. Current smoking was defined as having smoked 100 cigarettes in one’s lifetime or as currently smoking cigarettes; current drinking was defined as alcohol intake more than once a month during the past 12 months; daily consumption of red meat was assessed according to the recommendation by the World Cancer Research Fund, (more than 100 g per day was defined as excessive consumption)[23]; the Global Physical Activity Questionnaire was used to assess physical activity, (inadequate physical activity was defined as less than 600 metabolic equivalent [MET]-minutes per week)[24].
Body mass index (BMI) was included as health information. Body weight and height were measured according to a standard protocol, and BMI was calculated as weight in kilograms divided by height in meters squared. Overweight was defined as a BMI of 25.0 to 29.9 kg/m2, and obesity was defined as a BMI of 30.0 kg/m2 or higher[25].
Local economic development of 158 districts/counties was estimated by per capita Gross Regional Products (GRP) in 2010[26]. This was divided into four grades by quartile values (P25 = 13.5 thousand RMB, P50 = 23.5 thousand RMB, P75 = 42.0 thousand RMB) among the 158 districts/counties, namely: Quartile 1, 5.1–13.5 thousand RMB; Quartile 2, 13.5–23.5 thousand RMB; Quartile 3, 23.6–42.0 thousand RMB; Quartile 4, 42.1–177.2 thousand RMB.
-
The Chi-Square test was used to examine differences in baseline characteristics between diabetics and non-diabetics. The Cochran-Armitage test was used to examine the trend of ordinal variables. Selenium concentration and per capita GRP in districts/counties were considered at the second level. Spearman coefficient was used to examine the correlation between soil selenium concentration and per capita GRP. Taking into account the characteristic of hierarchically structured data and the clustering effect of participants within districts/counties, a two-level binary logistic regression model was used to determine the association of soil selenium concentrations with diabetes after adjusting for several confounders of interest, with participants (level 1) nested within districts/counties (level 2). The two-level binary logistic regression model with random intercept was as follows:
$\text{Diabetes}{_{ij}} - \text{Binomial}\left( {{n_{ij}}\text{, } {\pi _{ij}}} \right)$ for$$ \begin{array}{l} \text{logit} \left( {{P_{ij}}} \right) = {\beta _{0j}} + {\beta _1}{x_{1ij}} + {\beta _2}x_{{2ij}} + \cdots + {\beta _k}{x_{kij}}\\ {\beta _{0j}} = {\beta _0} + {u_{0j}}\text{, } {u_{0j}} - N\left( {0\text{, } \sigma _{{u_0}}^2} \right)\text{, } Var\left( {{P_{ij}}} \right) = \delta {\pi _{ij}}\left( {1 - {\pi _{ij}}} \right)/{n_{ij}} \end{array} $$ Where i represents the i-th participant presented to the j-th district/county;
${\beta _0}$ is the overall intercept;${\beta _{0j}}$ is the intercept for the j-th district/county;${\beta _1}{x_{1ij}}\text{, } {\beta _2}x_{{2ij}}\text{, } \cdots \text{, } {\beta _k}{x_{kij}}$ are explanatory variables and their associated coefficients.${u_{0j}}$ is a random variable and its variance (${\sigma _{{u_0}}^2}$ ) the random coefficient reflects the variation among districts/counties. δ is the scale parameter, which should be 1 or close to 1 in the binary logistic regression model.The focusing variable in this study is selenium concentration of districts/counties (the second level variable). When performing analyses, confounding factors such as sex, age, household income, smoking status, drinking status, daily consumption of red meat, physical activity, family history of diabetes, BMI (first level variables), and per capita GRP (second level variable) were included in the model. The model intercept within districts/counties was treated as random effect and all variables were included as fixed effects in the model.
All P values were two-tailed and a P value of less than 0.05 was considered statistically significant. All statistical analyses were performed using SAS for Windows, version 9.4 (SAS Institute Inc.) and MLwiN software, version 2.30 (Centre for Multilevel Modeling, University of Bristol).
-
Initially, 69,690 participants aged 35–74 years, from 158 districts/counties were included. Subsequently, 358 subjects who had missing information on diabetes were excluded, and the final sample for analysis involved 69,332 participants (99.5%) (Table 1).
Item Non-diabetes Diabetes P value No. % No. % Total 59,034 − 10,298 − Sex < 0.001 Female 32,811 55.6 5,377 52.2 Male 26,223 44.4 4,921 47.8 Age groups (years)* < 0.001* 35–44 20,050 34.0 1,758 17.1 45–54 18,503 31.3 3,043 29.5 55–64 14,082 23.9 3,439 33.4 65–74 6,399 10.8 2,058 20.0 Household income (RMB)# < 0.001* Quartile 1 (3,500 or lower) 11,597 22.7 1,717 19.7 Quartile 2 (3,501–7,200) 13,910 27.2 2,095 24.0 Quartile 3 (7,201–12,600) 12,901 25.2 2,227 25.5 Quartile 4 (more than 12,600) 12,762 24.9 2,687 30.8 Family history of diabetes < 0.001 No 48,599 93.6 7,356 85.8 Yes 3,310 6.4 1,216 14.2 Smoking status 0.604 Non-smoker 40,155 68.0 7,031 68.3 Smoker 18,876 32.0 3,266 31.7 Drinking status < 0.001 Non-drinker 41,985 71.1 7,535 73.2 Drinker 17,042 28.9 2,762 26.8 Daily consumption of red meat (g/d) 0.524 Non-excessive, ≤ 100 45,166 76.8 7,896 77.1 Excessive, > 100 13,668 23.2 2,351 22.9 Physical activity (MET-minutes per week) < 0.001 Adequate, ≥ 600 50,272 85.2 8,456 82.1 Inadequate, < 600 8,757 14.8 1,840 17.9 Body-mass index < 0.001* < 25 37,527 63.7 4,469 43.6 25–29 18,234 31.0 4,573 44.6 ≥ 30 3,120 5.3 1,207 11.8 Note. *P < 0.05 for linear trend. #Household income was estimated by per capita annual incomes of households in 2,009, which was divided into four grades by quartile values (P25 = 3,500 RMB, P50 = 7,200 RMB, P75 = 12,600 RMB) among the 69,332 participants. Table 1. General characteristics of study participants
All sociodemographic (sex, age, household income, and family history of diabetes), behavioral (drinking status and physical activity), and health information (BMI) variables differed between participants with and without diabetes, with the exception of smoking status and daily consumption of red meat (Table 1). In addition, the risk of diabetes was seen to increase with age and household income as well as in overweight and obese participants (Table 1).
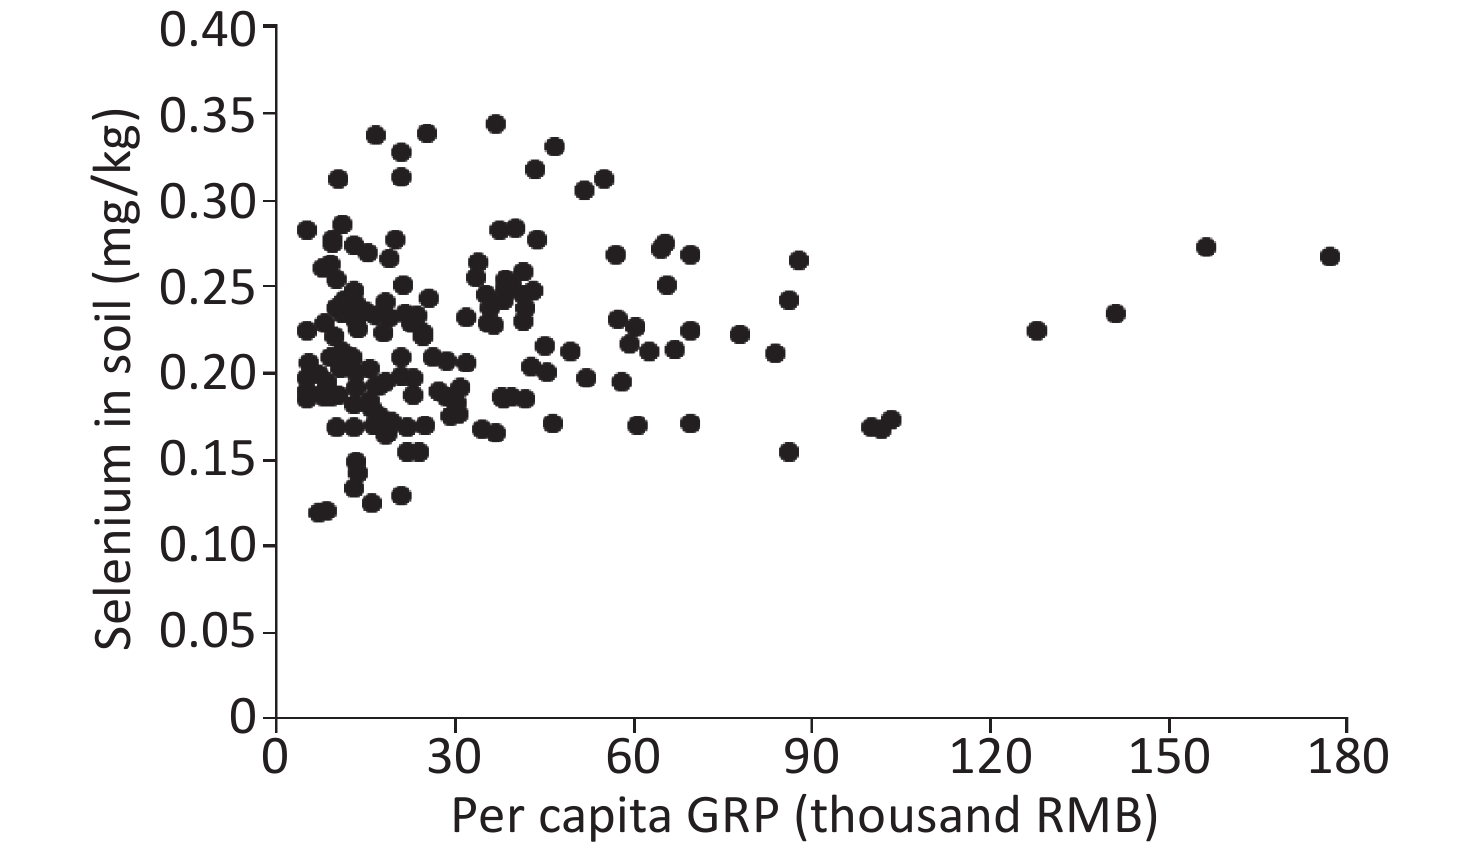
The average concentrations of selenium in soil varied greatly across the 158 districts/counties, ranging from 0.119 to 0.344 mg/kg. The 95% confidence interval (CI) for concentration values ranged from 0.129 to 0.330 mg/kg. The median concentration of selenium in soil was 0.219 mg/kg [interquartile range (IQR): 0.185–0.248]. Furthermore, per capita GRP varied greatly across districts/counties, with ranges of 5.1–177.2 thousand RMB, and the 95% CI for per capita GRP ranged from 5.4 to 128.3 thousand RMB. The median per capita GRP was 23.5 thousand RMB (IQR: 13.4–42.0). There were no significant correlations between soil selenium concentration and per capita GRP (rs = 0.152, P = 0.057) (Figure 1).
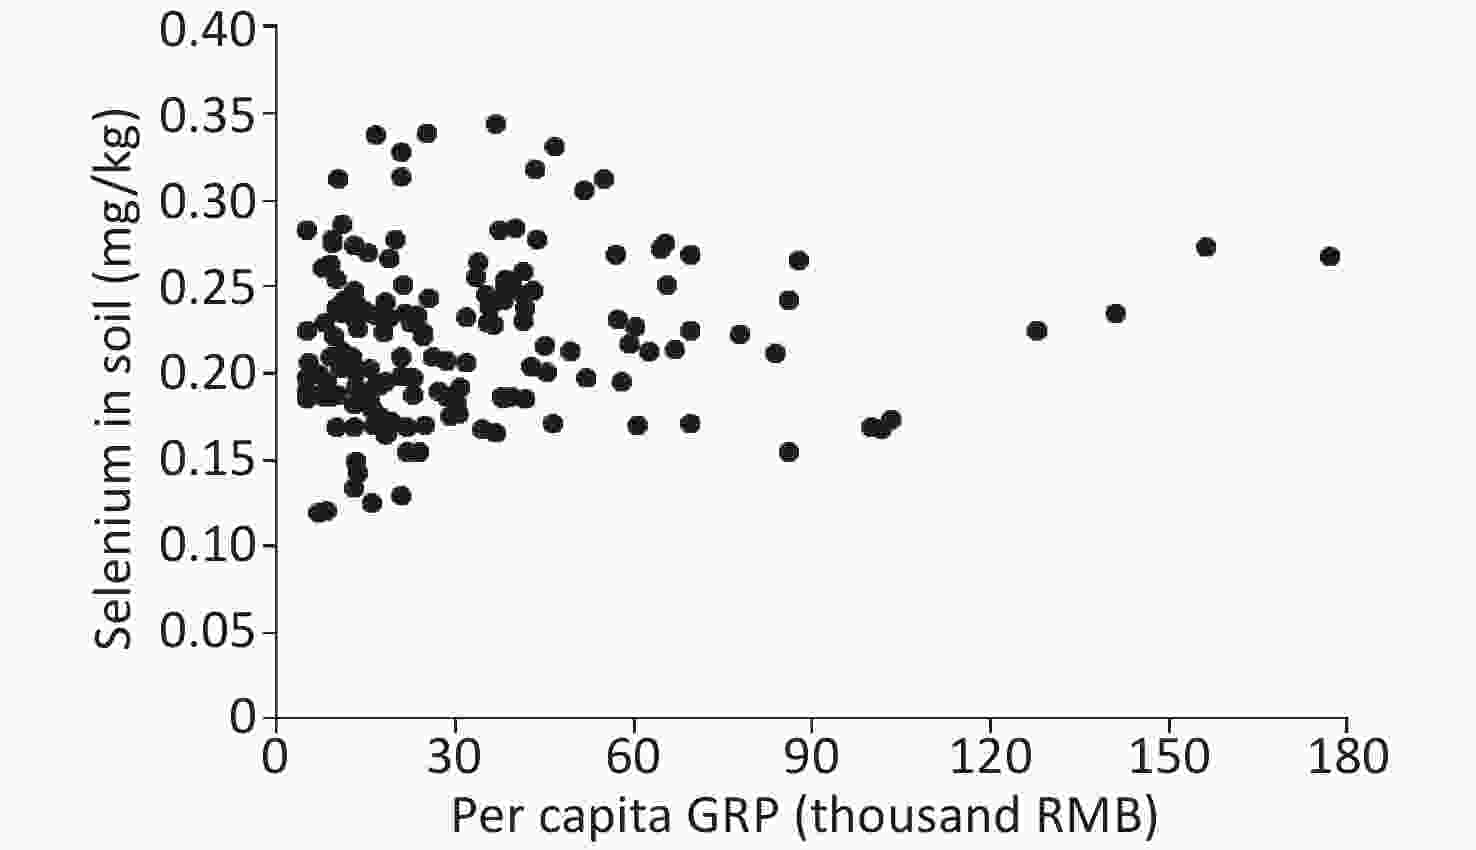
Figure 1. Correlation of selenium in soil and per capita GRP of the 158 districts/counties
The risk of diabetes differed across different concentrations of selenium in soil and economic development of districts/counties (Table 2). For the four grades of selenium concentrations in soil, Quartile 4 had the highest proportion of diabetes, followed by Quartile 1, Quartile 3, and Quartile 2, which had the lowest proportion. The risk of diabetes increased with economic development, demonstrating a significant linear trend (P < 0.001) (Table 2).
Item No. of districts/counties Non-diabetes Diabetes P value No. % No. % Selenium concentrations in soil (mg/kg)# < 0.001 Quartile 1 (0.119–0.185) 40 14,451 24.5 2,622 25.5 Quartile 2 (0.186–0.219) 39 15,467 26.2 2,319 22.5 Quartile 3 (0.220–0.248) 40 14,127 23.9 2,505 24.3 Quartile 4 (0.249–0.344) 39 14,989 25.4 2,852 27.7 Local economic development (thousand RMB)† < 0.001* Quartile 1 (5.1–13.5) 39 14,436 24.5 1,960 19.0 Quartile 2 (13.5–23.5) 40 15,032 25.5 2,382 23.1 Quartile 3 (23.6–42.0) 40 14,804 25.1 2,853 27.7 Quartile 4 (42.1–177.2) 39 14,762 25.0 3,103 30.1 Note. *P value for linear trend. #Selenium concentrations in soil were divided into four grades by quartile values (P25 = 0.185 mg/kg, P50 = 0.219 mg/kg, P75 = 0.248 mg/kg) in 158 districts/counties. †Local economic development was estimated by local per capita GRP, which was divided into four grades by quartile values (P25 = 13.5 thousand RMB, P50 = 23.5 thousand RMB, P75 = 42.0 thousand RMB) in 158 districts/counties. Table 2. General characteristics of the 158 districts/counties and risk of prevalent diabetes
The association between selenium concentration in soil and risk of diabetes is presented in Table 3. Both Quartile 1 (0.119–0.185 mg/kg) and Quartile 4 (0.249–0.344 mg/kg) groups were positively associated with diabetes compared to the Quartile 2 (0.186–0.219 mg/kg) group [crude odds ratios (ORs) 95% CI were 1.227 (1.003–1.502)] and 1.280 (1.048–1.563) and P values were 0.045 and 0.013, for Quartile 1 and Quartile 4 groups, respectively (Model II). The associations changed along with different covariates added to the multivariate model. The difference between Quartile 4 and Quartile 2 became suggestively significant after adjusted for local economic development (Model III) in level 2, and demographic characteristics (Model IV) and lifestyle factors (Model V) in level 1 (P values were 0.056, 0.061, and 0.054, respectively). After BMI was added to Model VI, to adjust for all confounding factors of interest, the risk of the Quartile 4 group increased and became significant again, with an adjusted OR (95% CI) of 1.203 (1.018–1.421) compared to the Quartile 2 group (P = 0.030). The risk of the Quartile 1 group compared to the Quartile 2 group decreased gradually in models II–VI, but not significantly so. There was no significant difference in diabetes risk for the Quartile 3 group (0.220–0.248 mg/kg) compared to the reference group (Quartile 2).
Model† Random coefficients Fixed effect of selenium concentrations in soil# Quartile 1
(0.119–0.185 mg/kg)Quartile 2
(0.186–
0.219 mg/kg)Quartile 3
(0.220–0.248 mg/kg)Quartile 4
(0.249–0.344 mg/kg)$\sigma _{{u_0}}^2$ ± Std error P value (Adjusted OR, 95% CI) P value (Adjusted OR, 95% CI) P value (Adjusted OR, 95% CI) P value Model I†1 0.190 ± 0.024 < 0.001 − − − − Model II†2 0.182 ± 0.023 < 0.001 1.227
(1.003, 1.502)0.045 ref. 1.199
(0.980, 1.467)0.095 1.280
(1.048, 1.563)0.013 Model III†3 0.155 ± 0.020 < 0.001 1.188
(0.984, 1.434)0.071 ref. 1.134
(0.937, 1.371)0.196 1.202
(0.995, 1.450)0.056 Model IV†4 0.123 ± 0.017 < 0.001 1.128
(0.946, 1.346)0.181 ref. 1.142
(0.955, 1.365)0.144 1.182
(0.991, 1.411)0.061 Model V†5 0.121 ± 0.017 < 0.001 1.133
(0.949, 1.351)0.161 ref. 1.143
(0.958, 1.363)0.138 1.186
(0.996, 1.412)0.054 Model VI†6 0.108 ± 0.016 < 0.001 1.112
(0.940, 1.317)0.213 ref. 1.139
(0.961, 1.351)0.131 1.203
(1.018, 1.421)0.030 Note. *A two-level binary logistic regression model with intercept as a random effect was used to estimate adjusted OR. Data were adjusted for demographic characteristics (sex, age, household income, and family history of diabetes), lifestyle factors (smoking status, drinking status, daily consumption of red meat, and physical activity), health information (BMI) at level 1 and local economic development (per capita GRP) at level 2. BMI = body mass index; CI = confidence interval; OR = odds ratio. #Selenium concentrations in soil were divided into four grades by quartile values (P25 = 0.185 mg/kg, P50 = 0.219 mg/kg, P75 = 0.248 mg/kg) in 158 districts/counties. OR was calculated for Quartile 1, Quartile 3, and Quartile 4 and compared to the reference (Quartile 2), respectively. †1The two-level binary logistic regression model with intercept as a random effect without covariables. †2Model I + selenium concentrations in soil at level 2. †3Model II + local economic development (per capita GRP) at level 2. †4Model III + demographic characteristics of sex, age, household income, and family history of diabetes at level 1. †5Model IV + lifestyle factors of smoking status, drinking status, daily consumption of red meat, and physical activity at level 1. †6Model V + health information on BMI at level 1. Table 3. Adjusted OR for diabetes associated with selenium concentrations in soil*
-
This large population-based study, which was derived from a nationally representative sample, showed that selenium in soil might play a dual role in the prevalence of diabetes in Chinese adults. After adjustment for all confounding factors of interest, higher concentrations of selenium in soil were significantly associated with an increased risk of diabetes, whilst lower concentrations of selenium in soil were not statistically significant. The finding of high concentrations is consistent with that presented in a meta-analysis of five observational studies in 2016 that reported a likely U-shaped, non-linear dose-response relationship between serum selenium levels and prevalence of type 2 diabetes[9]. Our study found that low selenium concentrations may be of no risk after adjusting for local economic development and individual characteristics.
The median concentration of selenium in soil for all 158 districts/counties in our study was 0.219 mg/kg, which is similar to the national level of 0.207 mg/kg[22]. However, the 95% CI for concentration values of selenium in soil in our study ranged between 0.129 and 0.330 mg/kg, which was narrower than the range of 0.047–0.993 mg/kg across China[22]. Previous studies revealed that selenium may increase the risk of type 2 diabetes across a wide range of exposure levels[7,14,27-32]. We failed to analyze the association in the highest or lowest areas, but a significant risk effect was observed under the narrower range, implying that more attention needs to be paid to these results.
China is a selenium-deficient country[3,18], and due to the known antioxidant effects of selenium, supplements containing selenium are increasing. A recent systematic review of randomized controlled trials demonstrated that currently there is no evidence to support the effectiveness of selenium supplementation in patients with type 2 diabetes[4]. An interventional trial in Chinese subjects suggested that selenium supplementation only improved some indices of antioxidant capacity in those people with adequate selenium intake[15]. Actually, some research reported that supplementation of additional selenium in people who already have adequate intake might increase their risk of developing type 2 diabetes[3,33].
In a previous study, Tan[34] divided China’s soil into four levels of selenium concentrations, based on the soil’s environmental background value of selenium in Keshan disease areas: selenium-lacking soil (< 0.125 mg/kg), selenium-low soil (0.125–0.175 mg/kg), selenium-adequate soil (0.176–0.450 mg/kg) and selenium-rich soil (0.451–3.000 mg/kg). Using this measure, a total of 130 (82.3%, 130/158) districts/counties were in the selenium-adequate soil range in the present study. An increased risk of diabetes had been observed among this range, with an adjusted OR of selenium concentration in soil of 0.249–0.344 mg/kg of 1.203 (95% CI, 1.018–1.421) over a concentration of 0.186–0.219 mg/kg. The relative increase in risk is small but of possible public health importance because of the high incidence of diabetes and the prevalence of selenium exposure[10]. Moreover, while selenium supplementation may be beneficial in populations with selenium deficiency, only few people may still be at risk of selenium deficiency due to the transportation of food from selenium-rich regions and the increase in availability of selenium-enriched foods.
This study has several potential limitations. First, selenium concentrations in soil mainly reflected the environmental background of selenium concentrations, but failed to reflect the effect of selenium intake due to cross-regional food circulation. Second, a questionnaire was adopted to compile information related to exposures such as smoking, drinking, physical activity, household income, and dietary habits; thus, recall bias could not be avoided and misclassification might have occurred. Additionally, these factors are temporally unstable and might have been modified by participants with diabetes as non-pharmacological approaches to control disease progression. Third, although the cross-sectional study design was able to highlight the association between the exposure and outcome, it was unable to establish a causal relationship.
In conclusion, this large population-based study clearly demonstrates that excessive intake of selenium might increase the risk of diabetes in Chinese adults aged 35–74 years. The risk of low selenium concentrations in soil became non-significant after adjusting for local economic development and individual characteristics. Future prospective studies with more accurate selenium measurements are warranted to confirm these findings.
-
The funders had no role in the study design, data collection, analysis, interpretation, or writing of the report.
-
The corresponding authors had full access to all study data and were responsible for the decision to submit for publication. Study concept and design: YAO Hong Yan, WANG Qi Qi, YU Shi Cheng, LIU Jian Jun, ZHAO Wen Hua, and BI Yu Fang. Acquisition of data: WANG Qi Qi, XU Cheng Dong, LI Yuan Qiu, ZHANG Man Hui, LONG Xiao Juan, YAO Hong Yan, ZHAO Wen Hua, and BI Yu Fang. Statistical analysis and interpretation of data: WANG Qi Qi, YU Shi Cheng, XU Cheng Dong, ZHANG Man Hui, LIU Yun Ning, and YAO Hong Yan. Drafting of the manuscript: WANG Qi Qi and YU Shi Cheng. Critical revision of the manuscript for important intellectual content: WANG Qi Qi, YU Shi Cheng, XU Cheng Dong, LIU Jian Jun, YAO Hong Yan, ZHAO Wen Hua, and BI Yu Fang. Administrative, technical, or material support: YAO Hong Yan, LIU Jian Jun, ZHANG Man Hui, BI Yu Fang, and LIU Yun Ning. Study supervision: YAO Hong Yan, LIU Jian Jun, ZHAO Wen Hua, and BI Yu Fang.
-
The authors report no relationships that could be construed as a conflict of interest.
-
We thank all research staffs from local Centers for Disease Control and Prevention for their collection of data and blood samples. We also thank all the study participants for their participation and contribution.
Association between Selenium in Soil and Diabetes in Chinese Residents Aged 35–74 Years: Results from the 2010 National Survey of Chronic Diseases and Behavioral Risk Factors Surveillance
doi: 10.3967/bes2020.035
Funds:
National Key Research and Development Programme [2018YFC1315305]; China CDC’s Scientific Research Project [JY18-2-22]; China CDC’s Public Health and Emergency Response Mechanism Programme [131031001000150001]
- Received Date: 2019-09-28
- Accepted Date: 2020-01-13
-
Key words:
- Selenium /
- Diabetes /
- Odds ratio /
- Behavioral risk factors /
- Survey
Abstract:
| Citation: | WANG Qi Qi, YU Shi Cheng, XU Cheng Dong, LIU Jian Jun, LI Yuan Qiu, ZHANG Man Hui, LONG Xiao Juan, LIU Yun Ning, BI Yu Fang, ZHAO Wen Hua, YAO Hong Yan. Association between Selenium in Soil and Diabetes in Chinese Residents Aged 35–74 Years: Results from the 2010 National Survey of Chronic Diseases and Behavioral Risk Factors Surveillance[J]. Biomedical and Environmental Sciences, 2020, 33(4): 260-268. doi: 10.3967/bes2020.035

|


 Quick Links
 DownLoad: