

-
PM2.5 refers to urban fine particles with an aerodynamic diameter of less than 2.5 µmol/L, which affect human health when inhaled through the respiratory system. During the last few decades, owing to the continuous industrial and urban developments in China, an increase in the occurrence of haze events and air pollution characterized by high PM2.5 concentrations has been observed, especially in the most developed regions with the highest aggregation of industry such as Beijing-Tianjin-Hebei (BTH), Yangtze River Delta (YRD), and Pearl River Delta (PRD) regions[1-3]. Exposure to high PM2.5 concentrations was associated with many diseases, including acute or chronic respiratory diseases and cardiovascular and cerebrovascular diseases[4-6]. Consistently, it was found that a 10 μg/m3 increase in 4-d averaged PM2.5 concentration corresponds to a 1.76% increase in total mortality, 2.19% in cardiovascular mortality, and 1.68% in respiratory mortality in six Chinese cities from the PRD region[7].
Air is an important transmission medium for many infectious pathogens which cause respiratory tract infection[8,9]. PM2.5 is a complicated and dynamic mixture of components with chemical, physical, and biological origins and different chemical and physical properties[10]. Previous literature in which the non-biological component (physical and chemical properties) of PM2.5 and PM10 pollutants were extensively studied has fully elucidated the environmental and public health impact of particulate matter (PM)[11]. However, relatively little is known about the potential health hazards of the inhalable biological component of airborne PM, such as bacteria, fungi, and viruses[12]. Increasing evidence suggests that the components of biological origin may play a significant role in the effects of PM on human health and contribute as much as 25% to atmospheric aerosol[13,14]. Thus, research on pathogenic microbial components of PM2.5 is necessary.
Recently, sequences of several respiratory microbial allergens and pathogens in PM were identified in Beijing, and their relative abundance appeared to have increased with increased concentrations of PM pollution[15]. Different from Beijing, Guangzhou, a northern Chinese city located in the northern hemisphere of the tropics, has a generally warm and humid subtropical monsoon climate that is very suitable for diverse microbiota growth. Unfortunately, its air pollution diffusion condition is very poor[16].
This study used the 16S rDNA library technique to determine the composition and diversity of microbiota associated with bioaerosols in the spring in Guangzhou, China. It aimed to determine the diversity and particularity of the microbiota composition in Guangzhou (one of the four megacities in China) PM2.5.
-
PM2.5 samples were collected at the Jinan University (23°07′43.35″ N, 113°20′32.56″ E), a center area in Guangzhou without major pollution nearby, using three middle volume air samplers (TH-150C, Wuhan Tianhong Instrument, China). The samplers were positioned at a height of 1.5 m and equipped with PM2.5 fractionation inlets, and in March, 2016, the average flow rate of ambient collection was set at 100 L/min (From 10:00 AM to 9:00 AM the following day) per sampling day for 6 days. Owing to the extremely poor air pollution diffusion condition in Guangzhou, sampling days were all in March as spring is one of the worst pollution seasons in Guangzhou[17].
PM2.5 samples were collected on 90 mm diameter quartz fiber filters (PALL, NY, U.S.), and each filter packaged in tinfoil were sterilized by pre-baking in a Muffle furnace at 500 °C for 6 h before weighing before and after sampling with a high-precision digital analytical balance at a controlled temperature (20 ± 1 °C) and relative humidity (50% ± 5% RH). Each filter was weighed three times, and the average weight was calculated from the duplicate weight. The acceptance criterion difference between the two values was < 0.25 mg, and the net weights of each filter was recorded at mg accuracy. Each filter was kept in a sealed bag before loading into the sampler and −80 °C refrigerator after sampling. Samplers and all the tools used for changing filters were sterilized with 75% ethanol or autoclaved daily before use.
-
The filters collected on the same day were used for pretreatment and DNA extraction. They were shredded into small pieces and transferred into a 2 mL microcentrifuge tube. Then, 1 mL TENS lysis, 50 μL 10% SDS, and 100 μL Protease-K (20 mg/mL) were added into the tube before allowing it to stand at room temperature overnight. After cell lysis and refrigeration, 1 mL phenol/chloroform/isopropanol was added into the tube and thoroughly mixed by inverting the tube five times before centrifuging at ≥ 12,000 for 10 min at 25 °C. Then, 900 μL of the supernatant was transferred into a new 2 mL microcentrifuge tube and 2/3 tube of isopropanol and 10% 3 mol/L Sodium acetate (CH3COONa) were added before an overnight incubation at −20 °C, followed by thorough mixing by inverting the tube for 20–30 times. The following day, the supernatant was carefully aspirated and discarded, ensuring that the DNA pellet was not disturbed, and 750 μL absolute ethyl alcohol was added after centrifuging at ≥ 12,000 ×g for 10 min at 25 °C. The tube with 750 μL absolute ethyl alcohol was vortex for 10 s to dissolve the DNA pellet and centrifuged at ≥ 12,000 ×g for 10 min at 25 °C. Then, the supernatant was collected and dried for 3–5 min before adding moderate TE (pH8.0) ×g.
-
The bacterial 16S rDNA genes of samples were amplified using PCR primers targeting the V4 region; 515F (3′-GTGCCAGCMGCCGCGGTAA-5′) and 806R (3′-GGACTACHVGGGTWTCTAAT-5′). DNA qualified for application in 16s rDNA sequencing was only extracted from samples collected on March 5th and 7th, and the qualified DNA amplicon was used to construct a library. In library preparation, the starting DNA amount of each sample was 5 ng, while the cycles of PCR amplification are set 12 to avoid the possible bias. The Illumina Hiseq 2500 sequencing system was used for sequencing based on PE250 strategy (Beijing Genomics institution).Truncation of sequence reads not having an average quality of 20 over a 25 bp sliding window based on the phred algorithm, and trimmed reads having less than 75% of their original length, as well as paired reads, were removed[18]. After filtering contaminative adapter and low-quality reads from the raw data, the quality-reads were spliced to tags by FLASH (Fast Length Adjustment of Short reads, v1.2.11)[19]. High-quality reads with minimal overlapping length of 15 bp and mismatching ratio of overlapped region ≤ 0.1 were combined to tags, and then the paired end reads without overlaps were removed. In total, 61,702 tags with an average length of 253 bp were obtained, with averagely 30,851 tags per sample. OTU unique representative sequences were obtained by using UPARSE to cluster the tags into OTU (Operational Taxonomic Unit) with a 97% threshold, and UCHIME (v4.2.40) was used to filter out chimeras[20]. The 16S rDNA sequences were screened for chimeras by mapping to gold database (v20110519). All tags were mapped to OTU representative sequences using USEARCH GLOBAL[21], and the tags number of each OTU in each sample was summarized on an OTU abundance table. The OTU representative sequences were taxonomically classified using Ribosomal Database Project (RDP) Classifier v.2.2 and trained on the Greengenes database using 0.8 confidence values as cutoff. The Greengenes database sequences with available information on bacteria habitats were classified into the different categories without overlaps. The OTU reads were annotated with the Greengenes database of 97% sequence similarity[22].
For the phylogenetic analysis, the OTU representative sequences were aligned against the Silva core set (Silva 108 core aligned seqs) by ‘align seqs.py’ using PyNAST. The tags with the highest abundance of each genus were chosen as the corresponding genus representative sequences. A representative genus level phylogenetic tree was constructed using the iTOL built-in scripts, and Bootstrap analysis was performed using data resampled 1,000 times. The trees were constructed by calculating Kimura distances.
-
Mann-Whitney U test was used to analyze the similarity between two samples. Statistical analyses were performed using SPSS 25.0 software, and a P-value < 0.05 indicates a significant difference between groups (confidence level 95%).
-
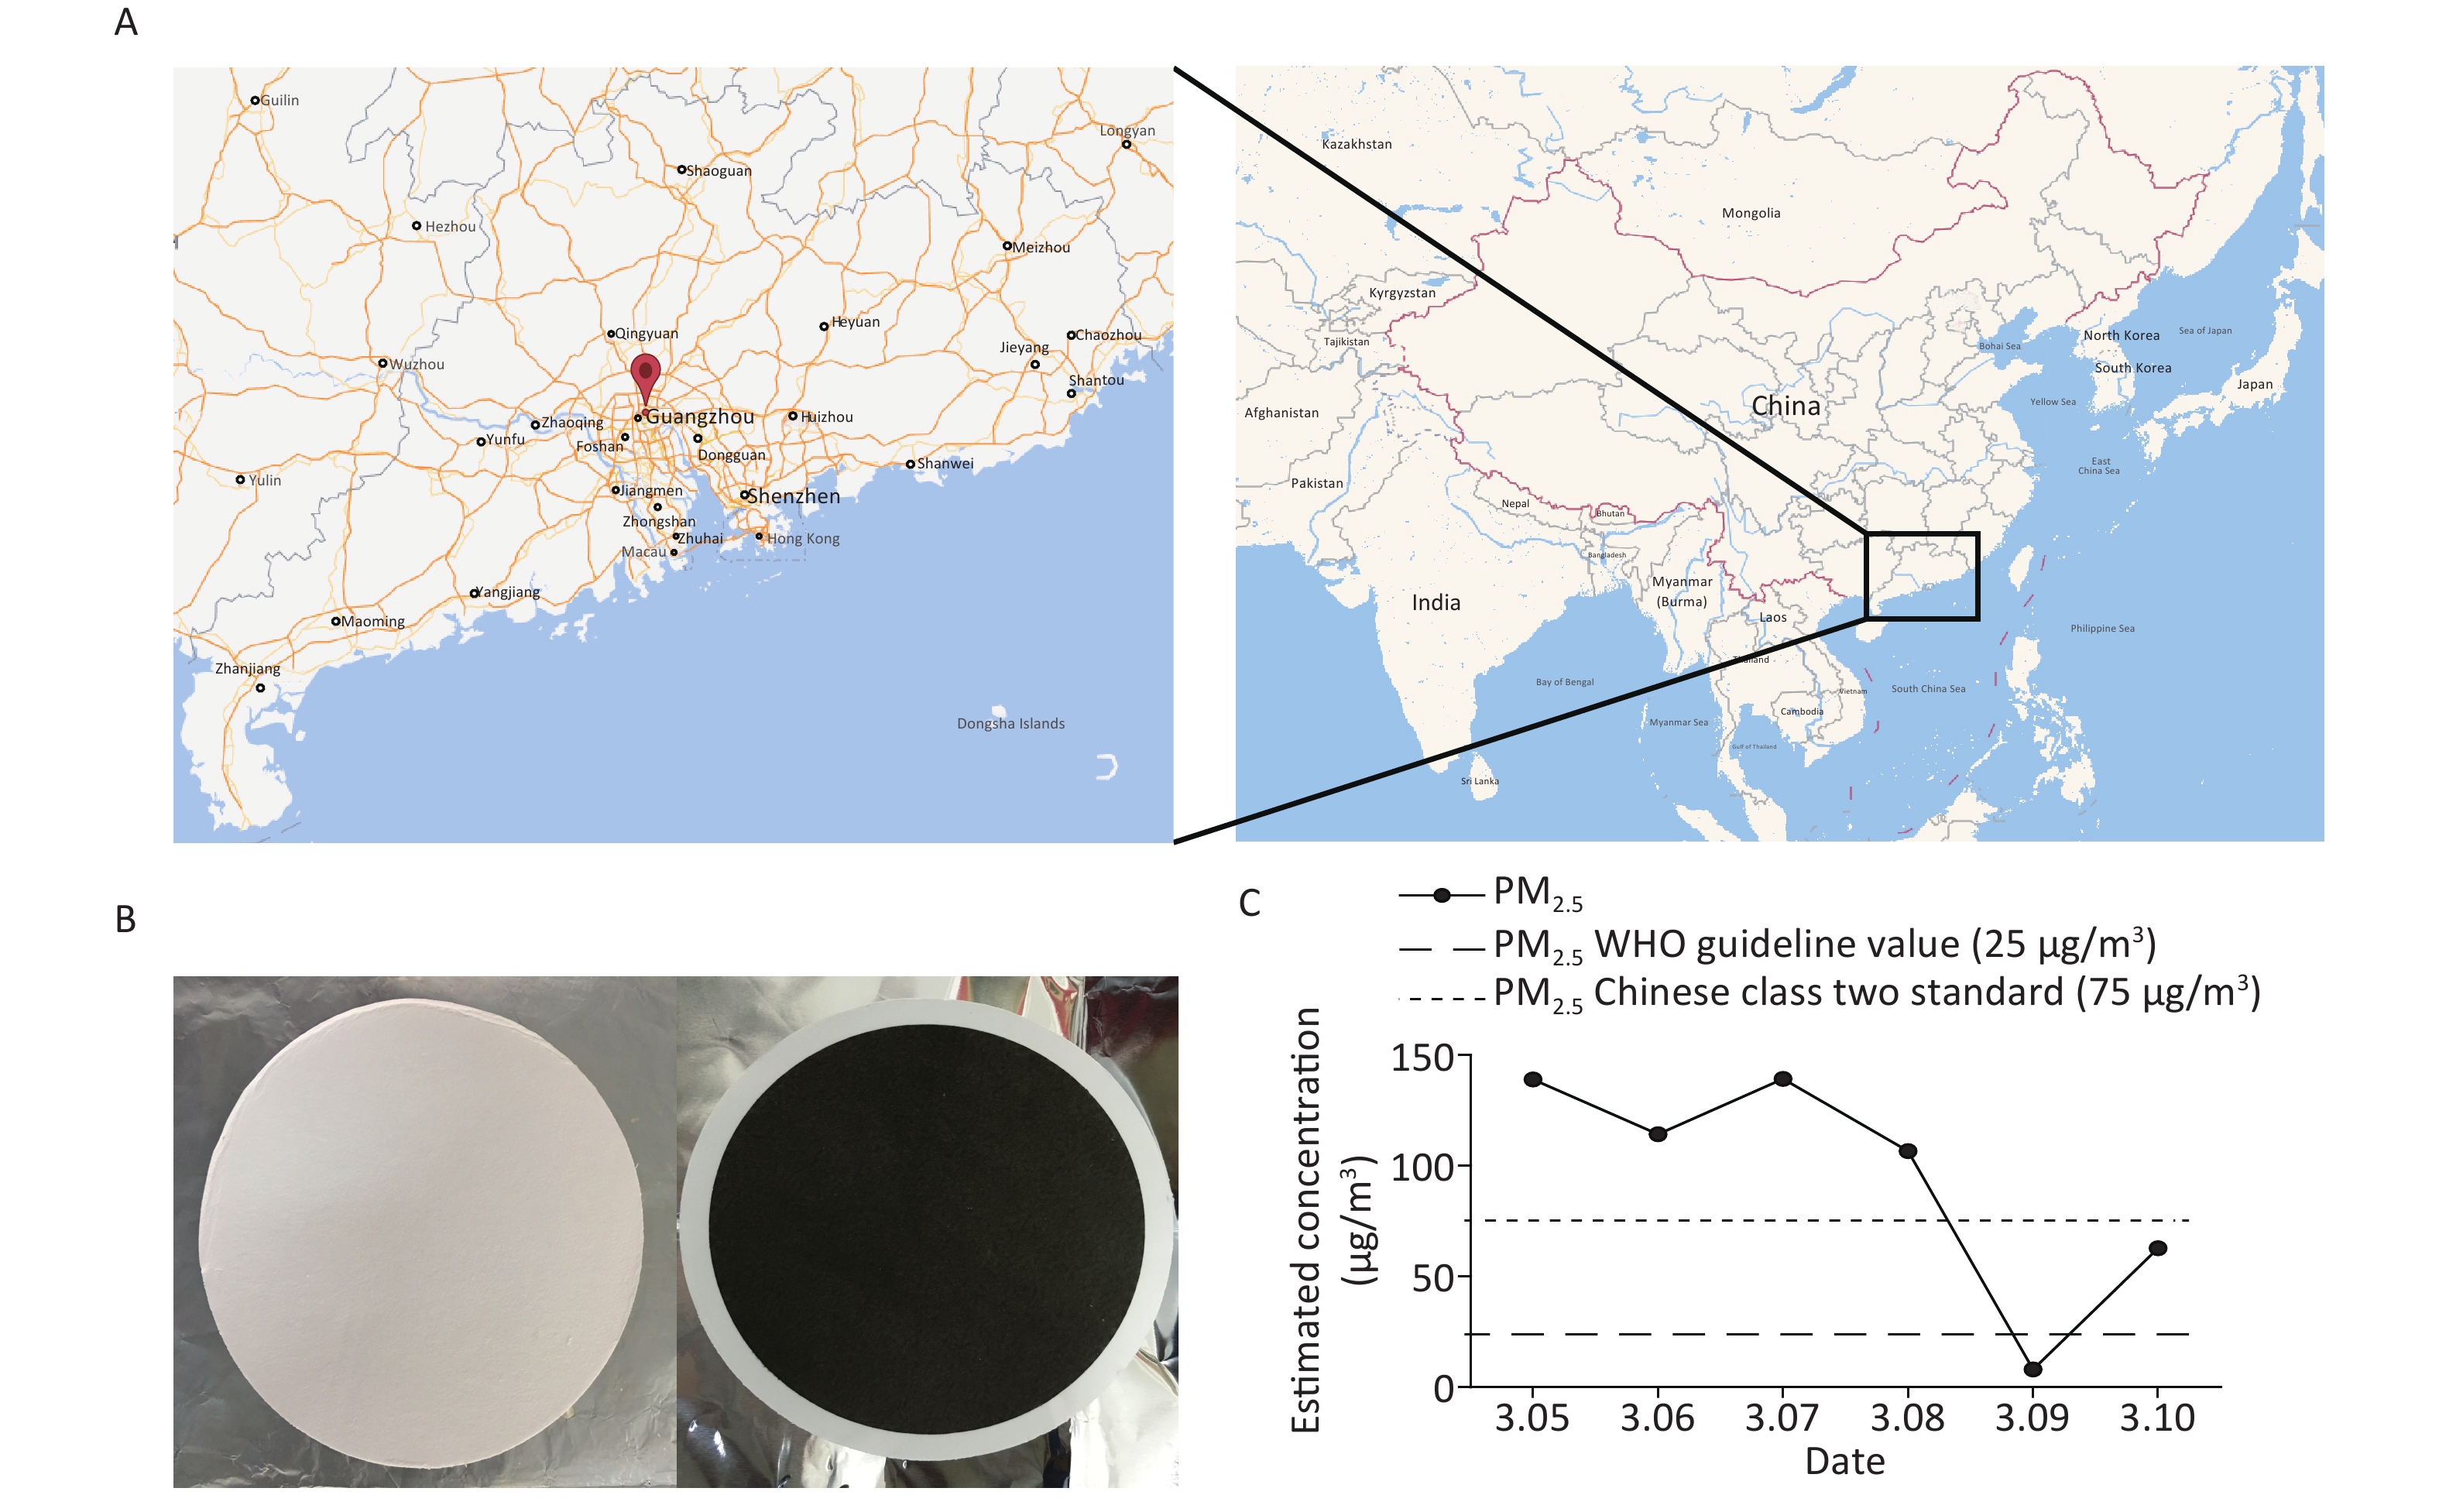
We collected inhalable airborne microbiota of PM2.5 in Guangzhou from March 5th to 10th, 2016, during a continuous wet weather. The mean PM2.5 concentration (95.04 μg/m3) was higher than the class II Chinese National Ambient Air Quality Standard (75 μg/m3) and the WHO guideline value (25 μg/m3). Furthermore, the highest PM2.5 concentration was obtained on March 5th, the second on March 7th, and the lowest on March 9th due to rain (Figure 1). Considering that 16s rDNA sequencing requires a high concentration of DNA extract from samples, we selected samples that were collected on March 5th and 7th for subsequent study. Although the PM2.5 concentrations of the samples collected on March 6th and 8th were higher than standard, their quality and quantity of extracted DNA did not suffice for further sequencing. The three filters collected daily were combined into one specimen, labeled Sample 1 and Sample 2. There is evidence that the PM2.5 concentration is positively correlated with the concentration of microorganisms and has no significant influence on the abundances and community of microbial[23]. The above results suggested that the PM2.5 pollution in Guangzhou was heavier and the samples we collected were significant.

Figure 1. Basic situation of the sample. (A) The location of particulate matters collection . (B) Tissue quartz before and after 23 h of PM2.5 collection. (C) Daily average PM2.5 concentration estimated from the collected samples.
-
The taxonomic composition distribution (phylum, order, class, family, genus level) of each sample is shown in Figure 2. Proteobacteria, Bacteroidetes, Actinobacteria, Cyanobacteria, and Firmicutes were the most common bacterial phyla in all PM2.5 samples (each sequencing sample contained three filter membranes collected at the same time), with average relative abundances of 62.54%, 18.06%, 5.89%, 5.66%, and 4.50%, respectively (Figure 2A). Gammaproteobacteria, Betaproteobacteria, Saprospirae, Alphaproteobacteria, and Actinobacteria were the dominant bacteria classes with average relative abundances of 28.55%, 20.46%, 14.66%, 13.15%, and 5.62%, respectively (Figure 2B). In order classification level, the most abundant orders were Xanthomonadales (22.93%), Burkholderiales (20.15%), Saprospiraes (14.66%), Actinomycetales (5.55%), and Streptophyta (4.31%) (Figure 2C). At the family level, Xanthomonadaceae, Comamonadaceae, and Chitinophagaceae represented more than 55% of the total OTUs with percentages ranging from 14% to 23% (Figure 2D). From the largest to smallest, the genera were Stenotrophomonas, Chitinophaga, and Brevundimonas. However, the genus level had more than 30% unclassified genera (Figure 2E).
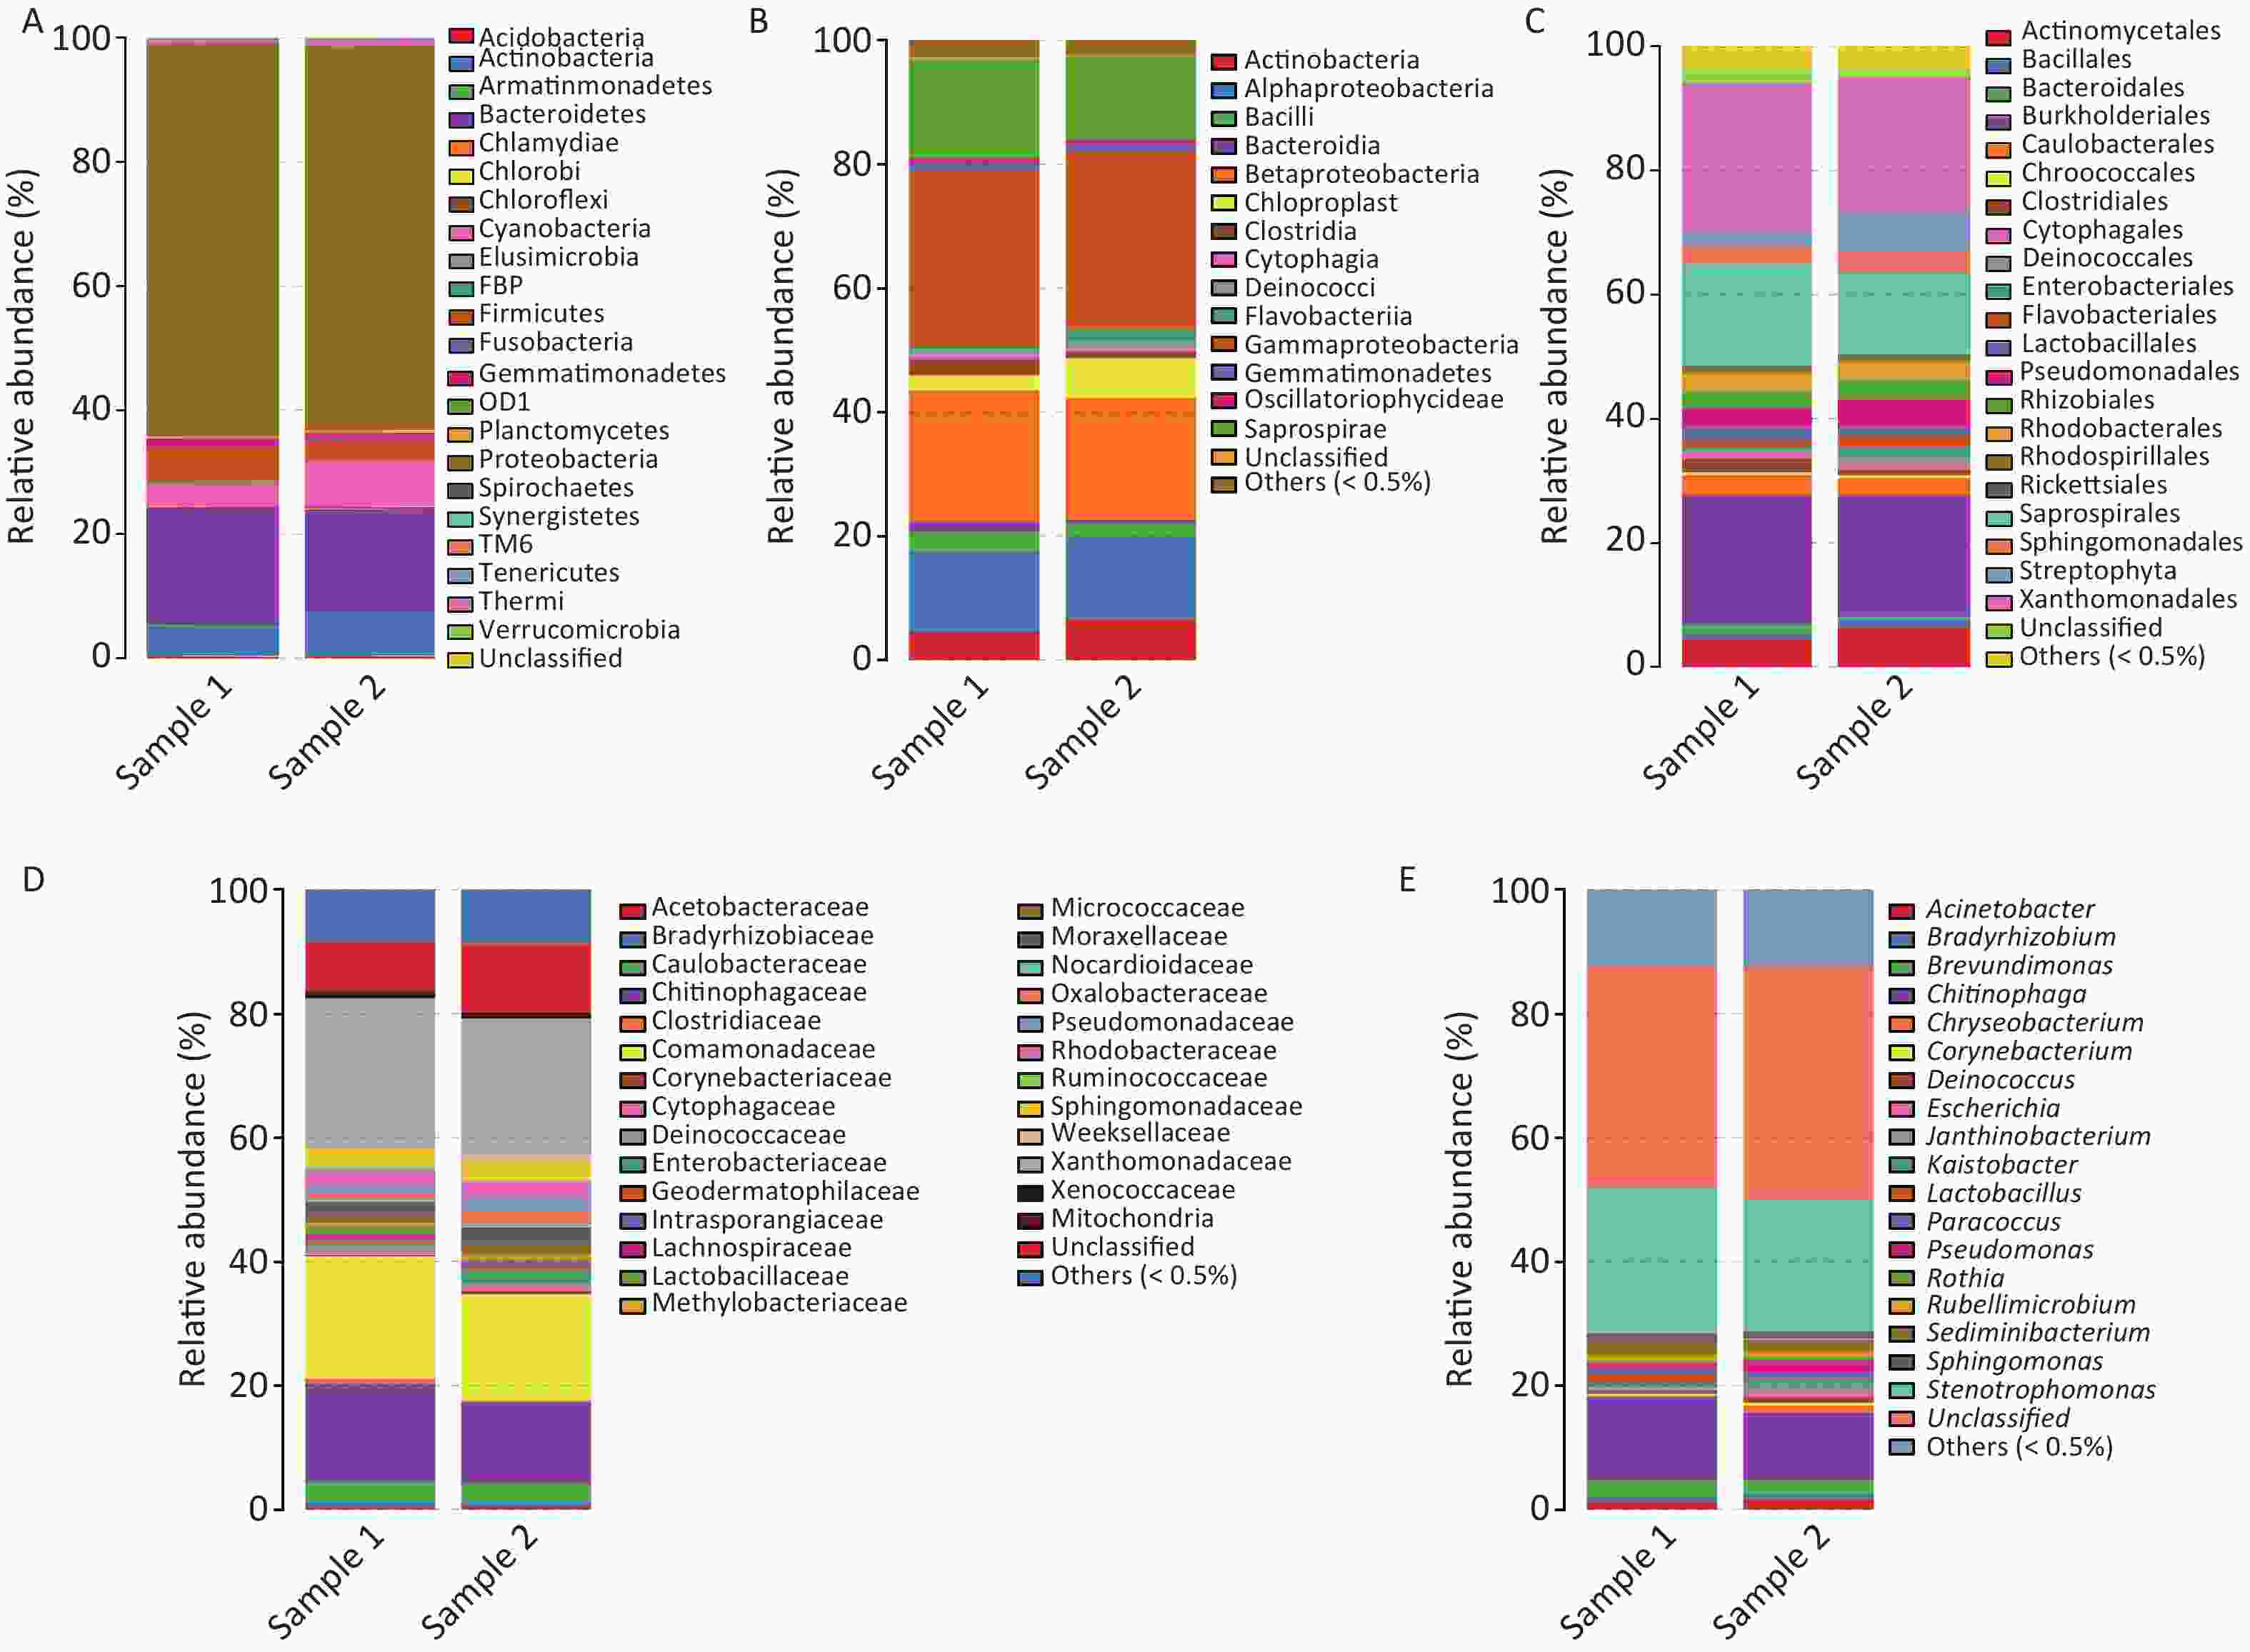
Figure 2. Relative abundance maps of bacterium. (A) Phylum classification level histogram, (B) Class classification level histogram, (C) Order classification level histogram, (D) Family classification level histogram, and (E) Genus classification level histogram. At the Phylum level, all species were used to draw the histogram. The species with abundance was less than 0.5% in all samples were classified into ‘others’ in other ranks.
The airborne bacteria in both samples contained both gram-positive and gram-negative bacteria. Gram-negative Stenotrophomonas (23.57%) was the most dominant genus. The Gram-positive bacteria found were Lactobacillus, Rothia, and Corynebacterium.
The detailed classifications of the genera noted in both samples are presented in Table 1. Mann-Whitney U test results showed that there was no obvious difference between both samples (P > 0.05). Overall, the dominant airborne bacteria genera that were detected in both samples were Stenotrophomonas, Chitinophaga, Brevundimonas, Sediminibacterium, Acinetobacter, Pseudomonas, and Sphingomonas (relative abundance > 1%), which accounted for more than 40% of the total airborne bacteria. In details, the dominant bacterial genera in Sample 1 were Stenotrophomonas (23.57%), Chitinophaga (13.36%), Brevundimonas (2.79%), Sediminibacterium (2.31%), Acinetobacter (1.21%), Sphingomonas (1.13%), Paracossus (1.04%), Lactobacillus (1.02%), and Pseudomonas (1.02%). For Sample 2, the dominant bacterial genera were Stenotrophomonas (21.30%), Chitinophaga (10.90%), Brevundimonas (2.47%), Sediminibacterium (1.94%), Pseudomonas (1.94%), Acinetobacter (1.72%), Janthinobacterium (1.35%), Sphingomonas (1.30%), and Chryseobacterium (1.09%). From the results, it is obvious that diverse microorganisms are present in Guangzhou PM2.5.
Phylum Class Order Family Genus Sample 1 Sample 2 P value Proteobacteria Gammaproteobacteria Pseudomonadales Moraxellaceae Acinetobacter G− 1.21 1.72 0.70 Gammaproteobacteria Enterobacteriales Enterobacteriaceae Escherichia G− 0.14 0.71 − Gammaproteobacteria Pseudomonadales Pseudomonadaceae Pseudomonas G− 1.02 1.94 0.40 Gammaproteobacteria Xanthomonadales Xanthomonadaceae Stenotrophomonas G− 23.57 21.30 1.00 Alphaproteobacteria Rhizobiales Bradyrhizobiaceae Bradyrhizobium G− 0.77 0.64 − Alphaproteobacteria Sphingomonadales Sphingomonadaceae Sphingomonas G− 1.13 1.30 0.73 Alpha Proteobacteria Caulobacterales Caulobacteraceae Brevundimonas G− 2.79 2.47 − Alpha Proteobacteria Rhodobacterales Rhodobacteraceae Rubellimicrobium G− 0.93 0.88 0.86 Alphaproteobacteria Sphingomonadales Sphingomonadaceae Kaistobacter G− 0.70 0.70 0.89 Betaproteobacteria Burkholderiales Oxalobacteraceae Janthinobacterium G− 0.44 1.35 0.40 Bacteroidetes Flavobacteria Flavobacteriales Flavobacteriaceae Chryseobacterium G− 0.31 1.09 0.13 Sphingobacteriia Sphingobacteriales Chitinophagaceae Chitinophaga G− 13.36 10.90 − NA NA NA Sediminibacterium G− 2.31 1.94 − Actinobacteria NA Actinomycetales Corynebacteriaceae Corynebacterium G+ 0.26 0.50 1.00 Actinobacteria Actinomycetales Micrococcaceae Rothia G+ 0.34 0.65 − Deinococcus-Thermus Deinococci Deinococcales Deinococcaceae Deinococcus G− 0.62 0.81 0.97 Firmicutes Bacilli Lactobacillales Lactobacillaceae Lactobacillus G+ 1.02 0.28 0.13 Arthropoda Insecta Lepidoptera Cossidae Paracossus 1.04 0.93 0.49 Unclassified 35.69 37.39 0.45 Others (< 0.5%) 12.35 12.51 0.18 Table 1. Distribution of bacteria at the genera level during March in Guangzhou
-
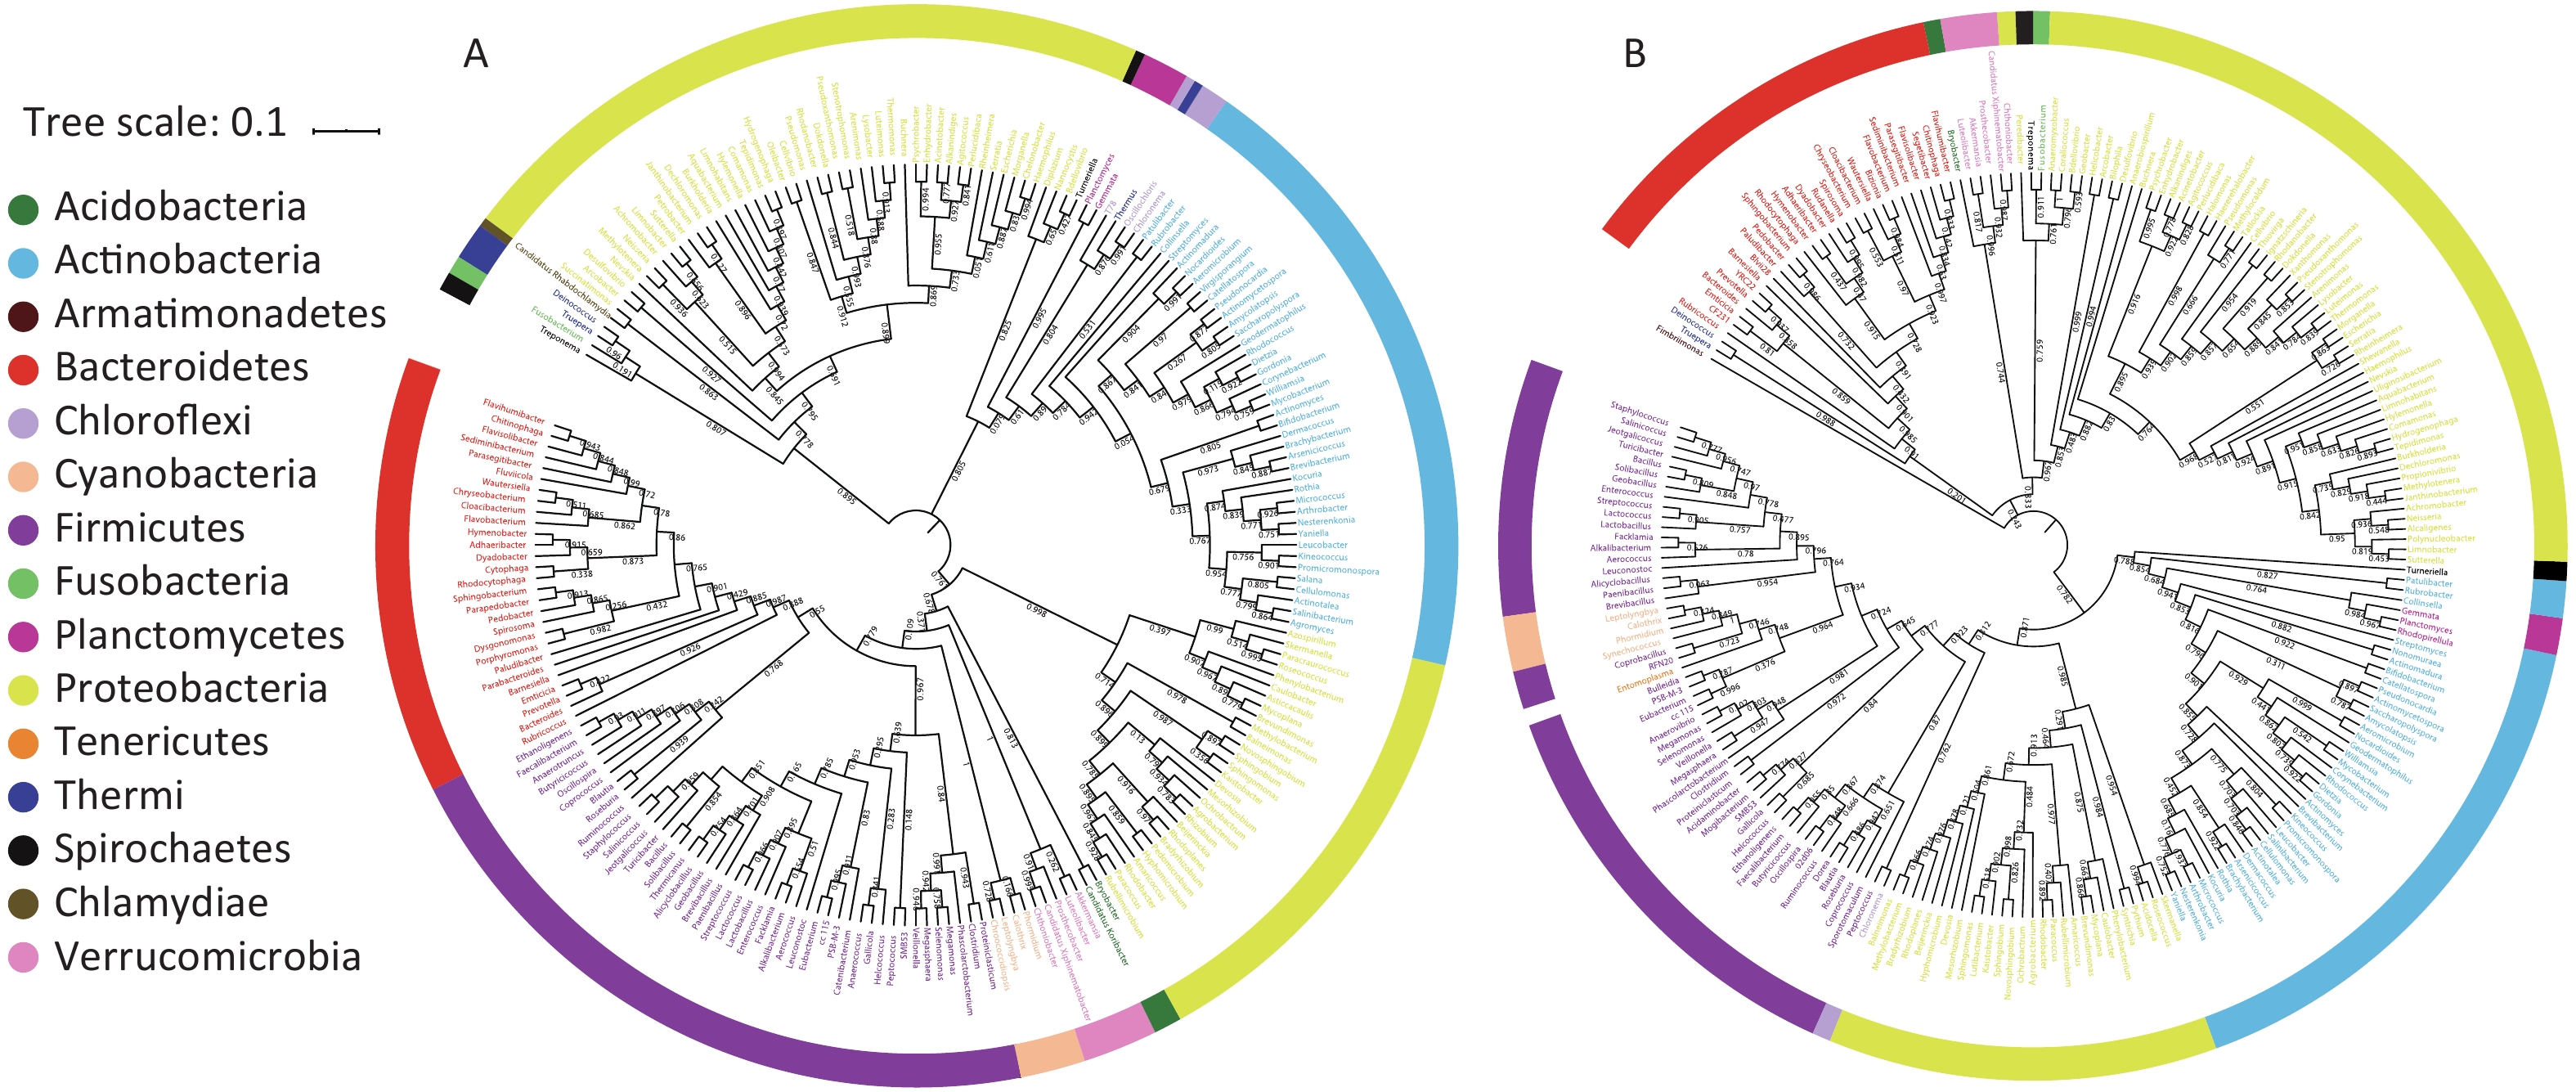
A bacterial phylogeny tree was used to reveal the relationships between bacteria, in order to identify the prokaryotic species and estimate their phylogenetic distance. The length of the branch represents the difference of their evolutionary distance. Thus, as species evolution distance move closer, the distance in species phylogeny tree becomes shorter. The average bootstrap values for the sample 1 and sample 2 trees were 76.50% and 78.10%, respectively. Additionally, more than 80% of the branches in each tree exhibited bootstrap values > 70%. The phylogeny tree presented 15 phyla; Acidobacteria, Acitinobacteria, Armatimonadetes, Bacteroidetes, Chlamydiae, Chloroflexi, Cyanobacteria, Firmicutes, Fusobacteria, Planctomycetes, Proteobacteria, Spirochaetes, Tenerioutes, Thermi, and Verrucomicrobia (Figure 3). The above results indicated that Guangzhou PM2.5 carries a variety of bacteria, a span multiple phylum.
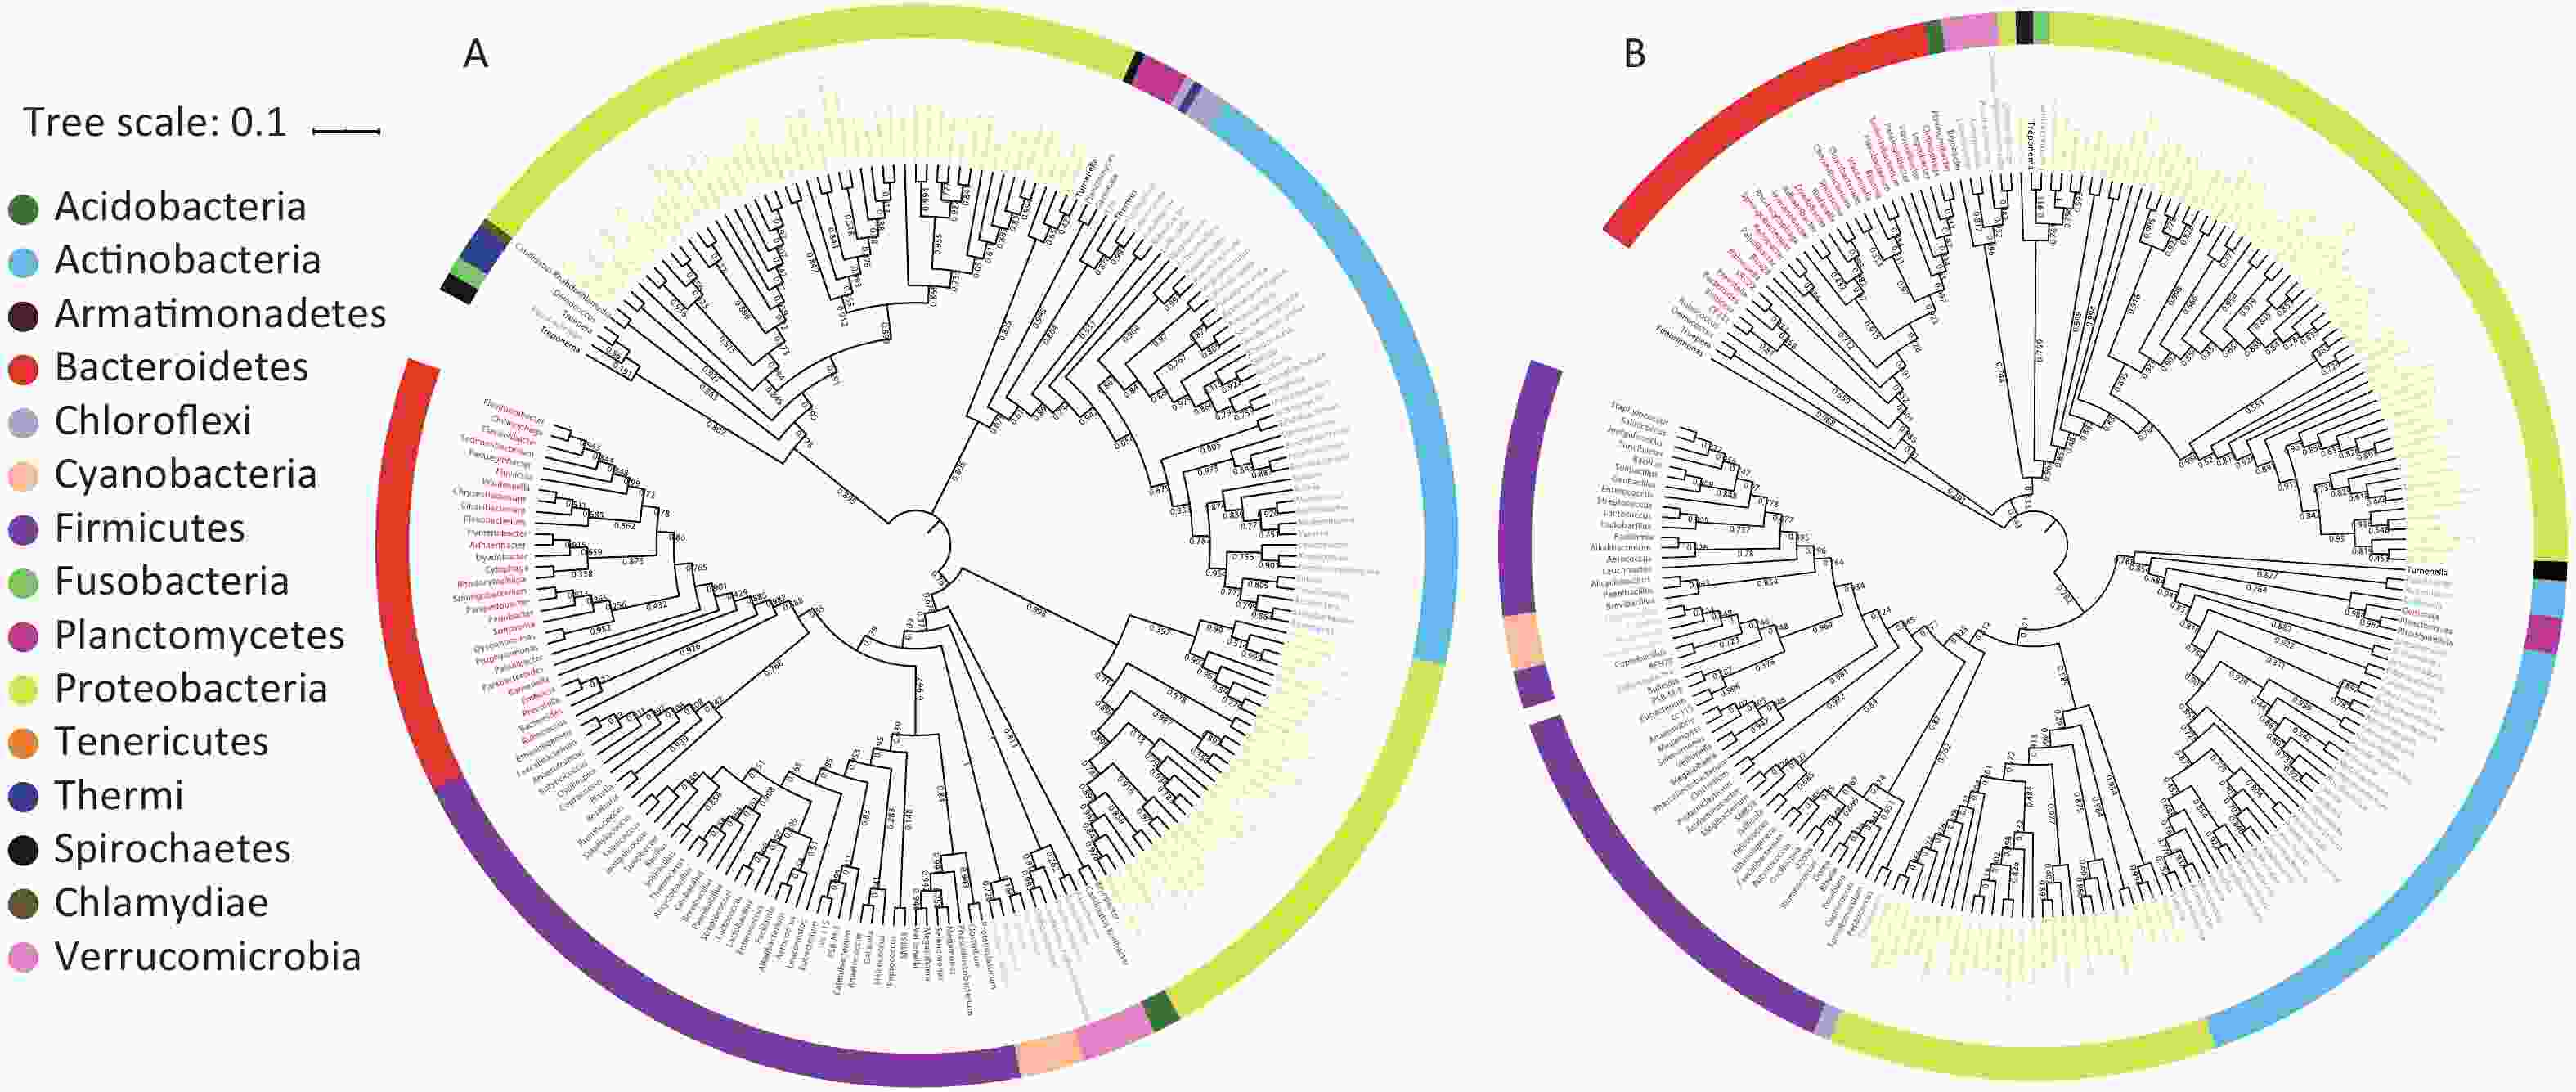
Figure 3. Phylogenetic tree of the bacteria identified from PM2.5 samples. Different genus belong to a same phylum were represented by a color. (A) Phylogenetic tree of PM2.5 sample 1. (B) Phylogenetic tree of PM2.5 sample 2. Numbers near internal branches indicate the bootstrap values.
-
We found that Proteobacteria, Bacteroidetes, Firmicutes, Cyanobacteria, and Actinobacteria were the dominant (relative abundance > 4%) phyla among the total bacteria, and they accounted for more than 90% of the total bacteria in Guangzhou’s samples. First, the Proteobacteria is a major phylum of Gram-negative bacteria which includes a variety of pathogens, such as Escherichia, Salmonella, Vibrio, Helicobacter, and Yersinia, and many other notable genera[24]. Proteobacteria invasion may increase the likelihood of asthma[25]. Second, Bacteroidetes is widely distributed among the environment as opportunistic pathogens. Although other classes of the genus Bacteroides are rarely pathogenic to humans, for immunodeficiency patients, the health risk is still not negligible[26,27]. Third, most Firmicutes are Gram-positive bacteria and produce endospores which make them resistant to extreme conditions. Bacilli are one of the most famous Firmicutes classes[28]. This class contains Bacillus anthracis, a well-known pathogen that causes anthrax[29]. Finally, Actinobacteria can be[27] terrestrial or aquatic[30,31]. Most of those in the soil can fix nitrogen for plants, but their threat to human health is unknown.
At the genus level, both samples contained Corynebacterium, Rothia, and Lactobacillus. Corynebacterium dominant profiles were associated with a low likelihood of bronchiolitis[32]. Rothiamuciloginous, a member of normal flora, rarely causes invasive disease. However, immunosuppressed patients have an increased risk for severe infection[33]. Lactobacillus species produce hydrogen peroxide which inhibits the growth and virulence of the fungal pathogen Candida albicans in vitro and in vivo[34]. At the genus level, it can be seen that bacteria in Guangzhou PM2.5 may be related to respiratory infections.
Gram-negative Stenotrophomonas (23.57%), a type of pathogenic bacteria which causes different opportunistic infections, was the most dominant genus in our research. Stenotrophomonas maltophilia, a member of Stenotrophomonas, is one of the most common non-fermentative Gram-negative Bacillus isolated from clinical specimens[35,36]. Infections resulting from it are particularly difficult to manage because they show resistance to many classes of antimicrobial agents[37]. A previous review of the literature shows that among bacterial infections in patients, a 37.5% mortality rate can be directly attributed to Stenotrophomonas maltophilia[38]. Acinetobacter (accounting for 1.21%–1.72%) are important soil organisms that contribute to soil mineralization such as aromatic compounds. They are a key source of infection in hospitalized debilitated patients; particularly, the species Acinetobacter baumannii is a frequent cause of hospital-acquired pneumonia and has been shown in some studies to increase mortality and hospital length of stay[39,40]. Stenotrophomonas and Acinetobacter are considered as soil-borne bacteria that cause serious health damage[41,42]. In the present study, they were detected in air, and hence may suggest a new pathogen propagation mode.
Some differences were found when Guangzhou PM2.5 studies were compared with a research in Beijing[15]. Due to limitations and differences in sequencing methods, the similarities and differences between microbiota samples from Guangzhou and Beijing were not assessed. However, we found some interesting views of the bacterial distribution between southern or northern area in China. Escherichia were only found in Guangzhou. Given that Escherichia is more likely to grow in warm and wet environments[43], we speculate that one possible reason why it only grew in Guangzhou was because Guangzhou belongs to the subtropical region with a tropical climate and high air humidity, which is conducive for its growth. Previous research had shown that Escherichia can survive in the environment for a long time and directly infect humans[44]. It can also affect human health by indirectly causing digestive tract infections when adsorbed in crops or food[45,46]. Therefore, the difference of bacterial distribution in the air in the southern or northern area in China may provide new tips for the epidemiological study of bacterial infectious diarrhea.
Our results showed that Proteobacteria, Bacteroidetes, Actinobacteria, Cyanobacteria, and Firmicutes were the dominant airborne bacteria in Guangzhou, similar to the New York[47] and Hong Kong, China study[48]. One limitation of these two studies is that they only focused on the bacterial composition of indoor air; hence, they are unable to represent the overall situation. One innovation in our research was the exhaustive analysis on the global contribution of microorganisms carried by PM2.5. This is also the first time that the 16S rDNA V4 region sequencing was applied to the analysis of bacterial population distribution in Guangzhou PM2.5. Our study has some limitations. We only provided bioinformatic evidence; hence, more clinical and epidemiological investigations must be undertaken so that our results can be better applied in other aspects.
This study provides basic bacterial distribution data of Guangzhou PM2.5. In conclusion, microorganisms in PM2.5 have strong specificity under different climatic conditions. Atmospheric flora of Guangzhou PM2.5 is rich in genus, and some clues reflected that it may contain many pathogenic bacteria. Therefore, the composition and distribution of microorganisms in fine particles of cities may be used as a reference for future pathogenic microbial monitoring and prevention.
-
The authors declare no conflict of interest.
-
Date Analyzed, illustration prepared, and manuscript writed was by DONG Shi Rui, HAN Ya Jing, and WU Jing; Sample collection: ZENG Cheng Li, ZHU Ke Hui, CHEN Xiao Jing, LIU Yu Mei, ZOU Xiao Qian, and ZHENG Shao Ling; Participated in the experiment: WEN Zi Hao, LIU Dan Dan, WANG Yao, HUANG Xiu Xia, and DU Xiu Ben; Technical support: GUO Shu; Manuscript revised: HAO Jian Lei and WANG Huan Yu; Funding acquisition and conceived and designed the experiments: YANG Guang and JING Chun Xia.
Distribution of Microbiota in Fine Particulate Matter Particles in Guangzhou, China
doi: 10.3967/bes2020.042
Funds:
This work was supported in part by the Major Research Plan of the National Natural Science Foundation of China [91543132]; National Natural Science Foundation of China [81541070, 30901249, 81101267, and 81630025]; Natural Science Foundation of Guangdong [10151063201000036, S2011010002526, and 2016A030313089]; Guangdong Province Medical Research Foundation [A2015310]; Project from Jinan university [21612426, 21615426, JNUPHPM2016001, and JNUPHPM2016002]; and Traditional Chinese Medicine Bureau of Guangdong Province [20181071]
- Received Date: 2019-10-02
- Accepted Date: 2020-01-13
-
Key words:
- PM2.5 /
- Microbiota /
- Guangzhou /
- Diversity
Abstract:
| Citation: | DONG Shi Rui, HAN Ya Jing, WU Jing, ZENG Cheng Li, ZHU Ke Hui, CHEN Xiao Jing, LIU Yu Mei, ZOU Xiao Qian, ZHENG Shao Ling, WEN Zi Hao, LIU Dan Dan, WANG Yao, HUANG Xiu Xia, DU Xiu Ben, HAO Jian Lei, WANG Huan Yu, GUO Shu, JING Chun Xia, YANG Guang. Distribution of Microbiota in Fine Particulate Matter Particles in Guangzhou, China[J]. Biomedical and Environmental Sciences, 2020, 33(5): 306-314. doi: 10.3967/bes2020.042

|

 Quick Links
 DownLoad: