-
Diabetes mellitus (DM) is a major risk factor for cardiovascular diseases, which affects a large number of patients. DM has become a global health problem, especially in low- and middle-income countries[1,2]. In 2010, 12.9 million deaths worldwide were attributed to DM[3,4]. The number of adults with DM in the world increased from 108 million in 1980 to 422 million in 2014[5]. The global prevalence of DM rose from 4.3% in 1980 to 9.0% in 2014 in men and from 5.0% to 7.9% in women, respectively. Similarly, the prevalence of DM has increased rapidly in China. Four large-scale nationwide surveys[6-9] performed in 1994, 2000, 2008, and 2013 showed that the prevalence of DM among adults in China was 2.5%, 5.5%, 9.7%, and 10.9%, respectively. Findings from the 2016 Global Burden of Disease (GBD) study indicated that from 1996 to 2016, the all-age prevalence of diabetes rose from 3.7% to 6.6%[10]. The 2019 International Diabetes Federation (IDF) Diabetes Atlas 9th edition estimated that 10.9% of adults aged 20–79 years in China had diabetes, equal to 116.4 million people with diabetes, i.e., more than a quarter of cases in the world (463.0 million)[11].
DM has become a major public health problem, its prevalence, complications, and mortality are higher among older individuals than young people[12]. The prevalence of DM was 16.7% among elderly people aged ≥ 60 years in Ecuador[13]. Between 2011 and 2012, the reported prevalence of DM in the US among people aged ≥ 65 years was 33.0%[14]. As reported in China, the prevalence of DM was 20.2% in the population aged ≥ 60 years[9]. In a very elderly population, DM can lead to a number of short- and long-term health complications, hypoglycemia, heart disease, nerve damage and amputation, and vision problems[15]. In the Japanese population, DM increased the risk of mortality, especially pneumonia-related mortality among people aged ≥ 80 years[16]. Research also showed that very old men with type 2 diabetes had an elevated risk of vascular brain damage and neurodegenerative changes[17].
Globally, the number of people aged ≥ 80 years (oldest old persons[18]) in 2019 is 143 million, which will triple in 2050 to reach 426 million, projected by the Population Division of the Department of Economic and Social Affairs of the United Nations[19]. In China, the number of people aged ≥ 80 years in 2019 is 26.1 million, which will increase more than four-fold in 2050 to reach 115.3 million[20]. Data from the China Health and Retirement Longitudinal Study (CHARLS) 2011 indicated the very elderly population (≥ 80 years; 26.5%) had the highest prevalence of diabetes among people aged ≥ 45 years[21]. Notwithstanding, epidemiological studies on the prevalence of DM in the very elderly population are scarce in China. In view of China’s large and rapid growth of its very elderly population, we carried out a cross-sectional survey of DM among the very elderly population (≥ 80 years) to investigate the prevalence of DM and explore the associated factors, providing a scientific basis to prevent and control DM in the very elderly population.
-
From September 2015 to June 2016, a cross-sectional survey of DM was carried out in urban communities of Chengdu which is the center of science, technology, and commercial and financial affairs, as well as the traffic and communication hub of southwest China. This research program was approved by the ethics committee of the Second People’s Hospital of Chengdu (No. 2015030). All the participants provided written informed consent before the survey.
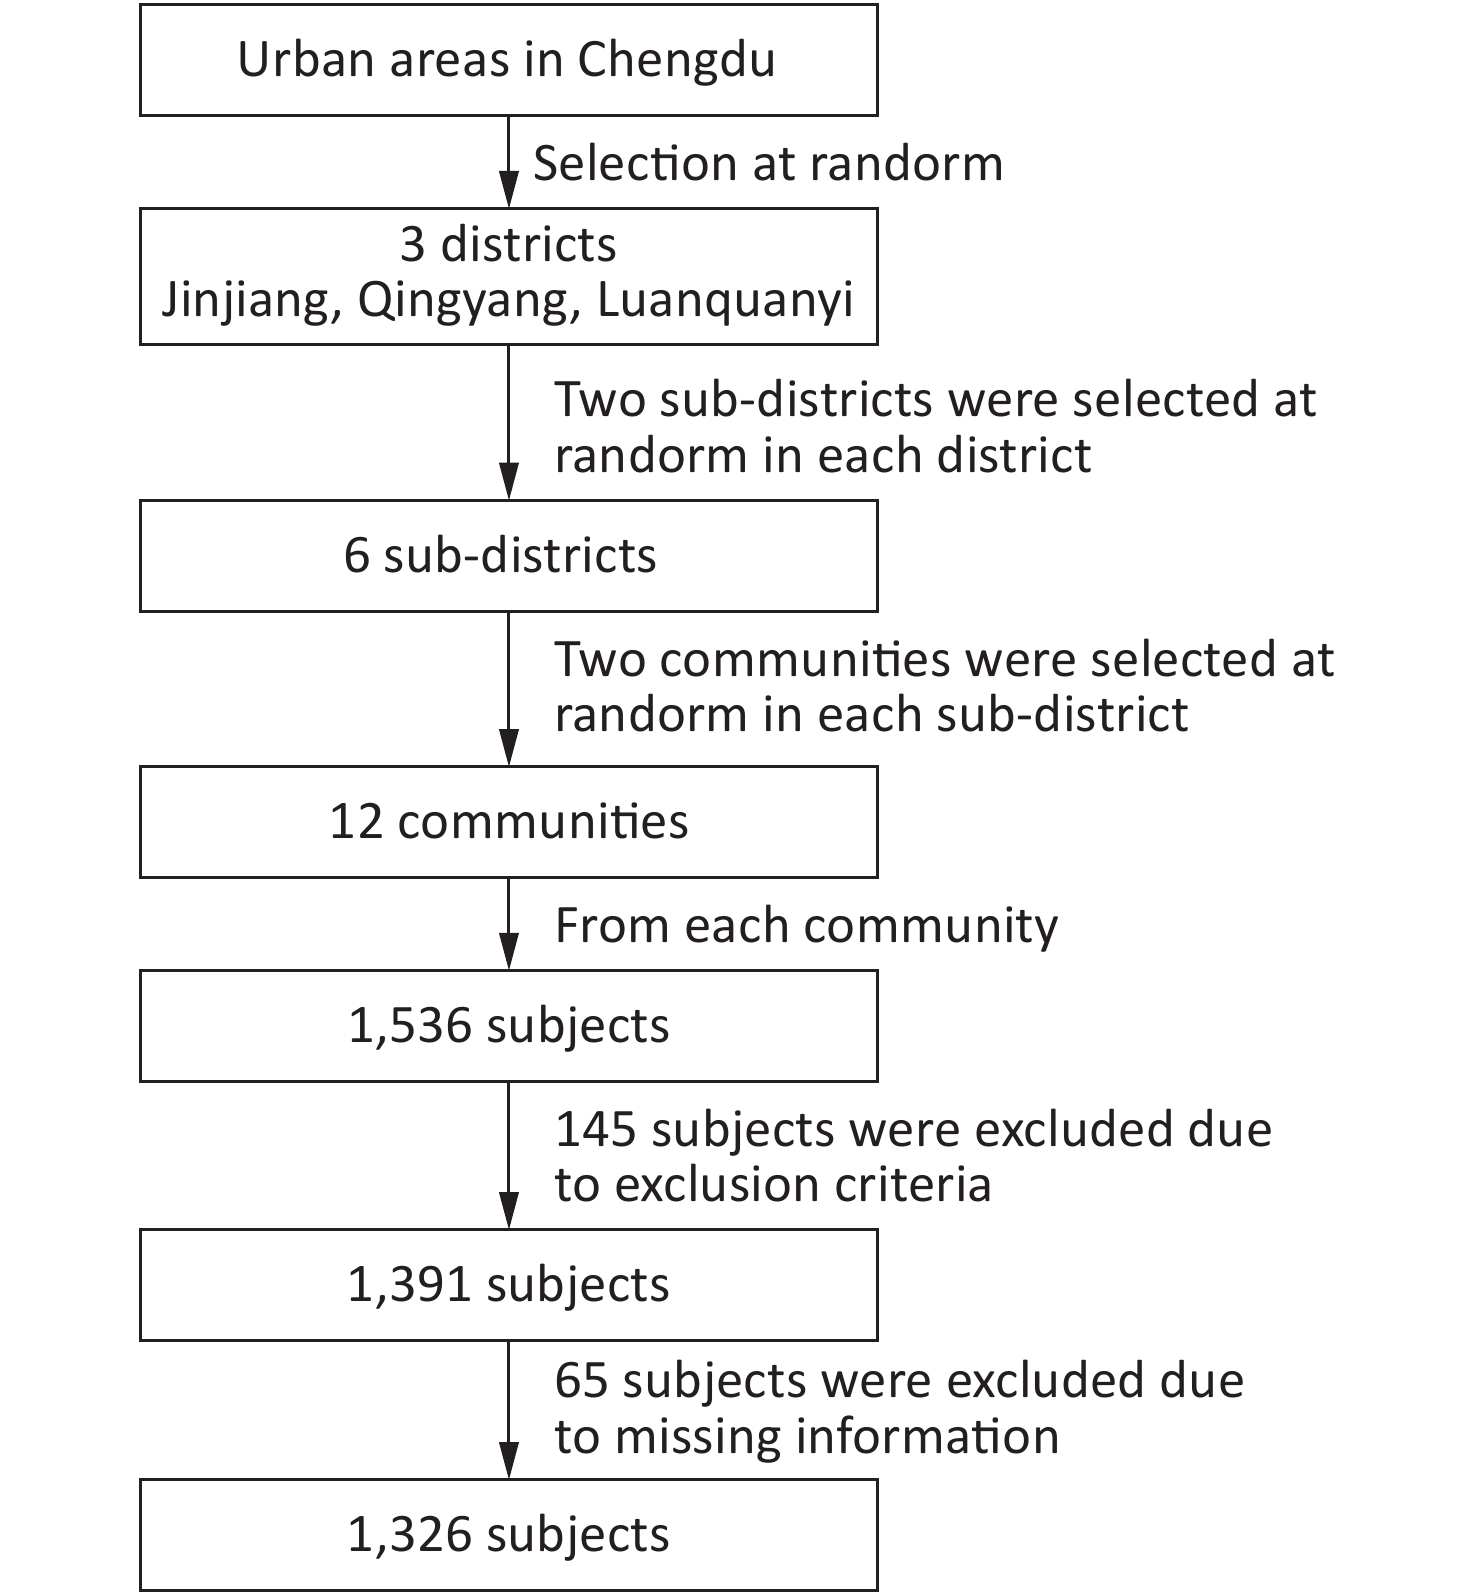
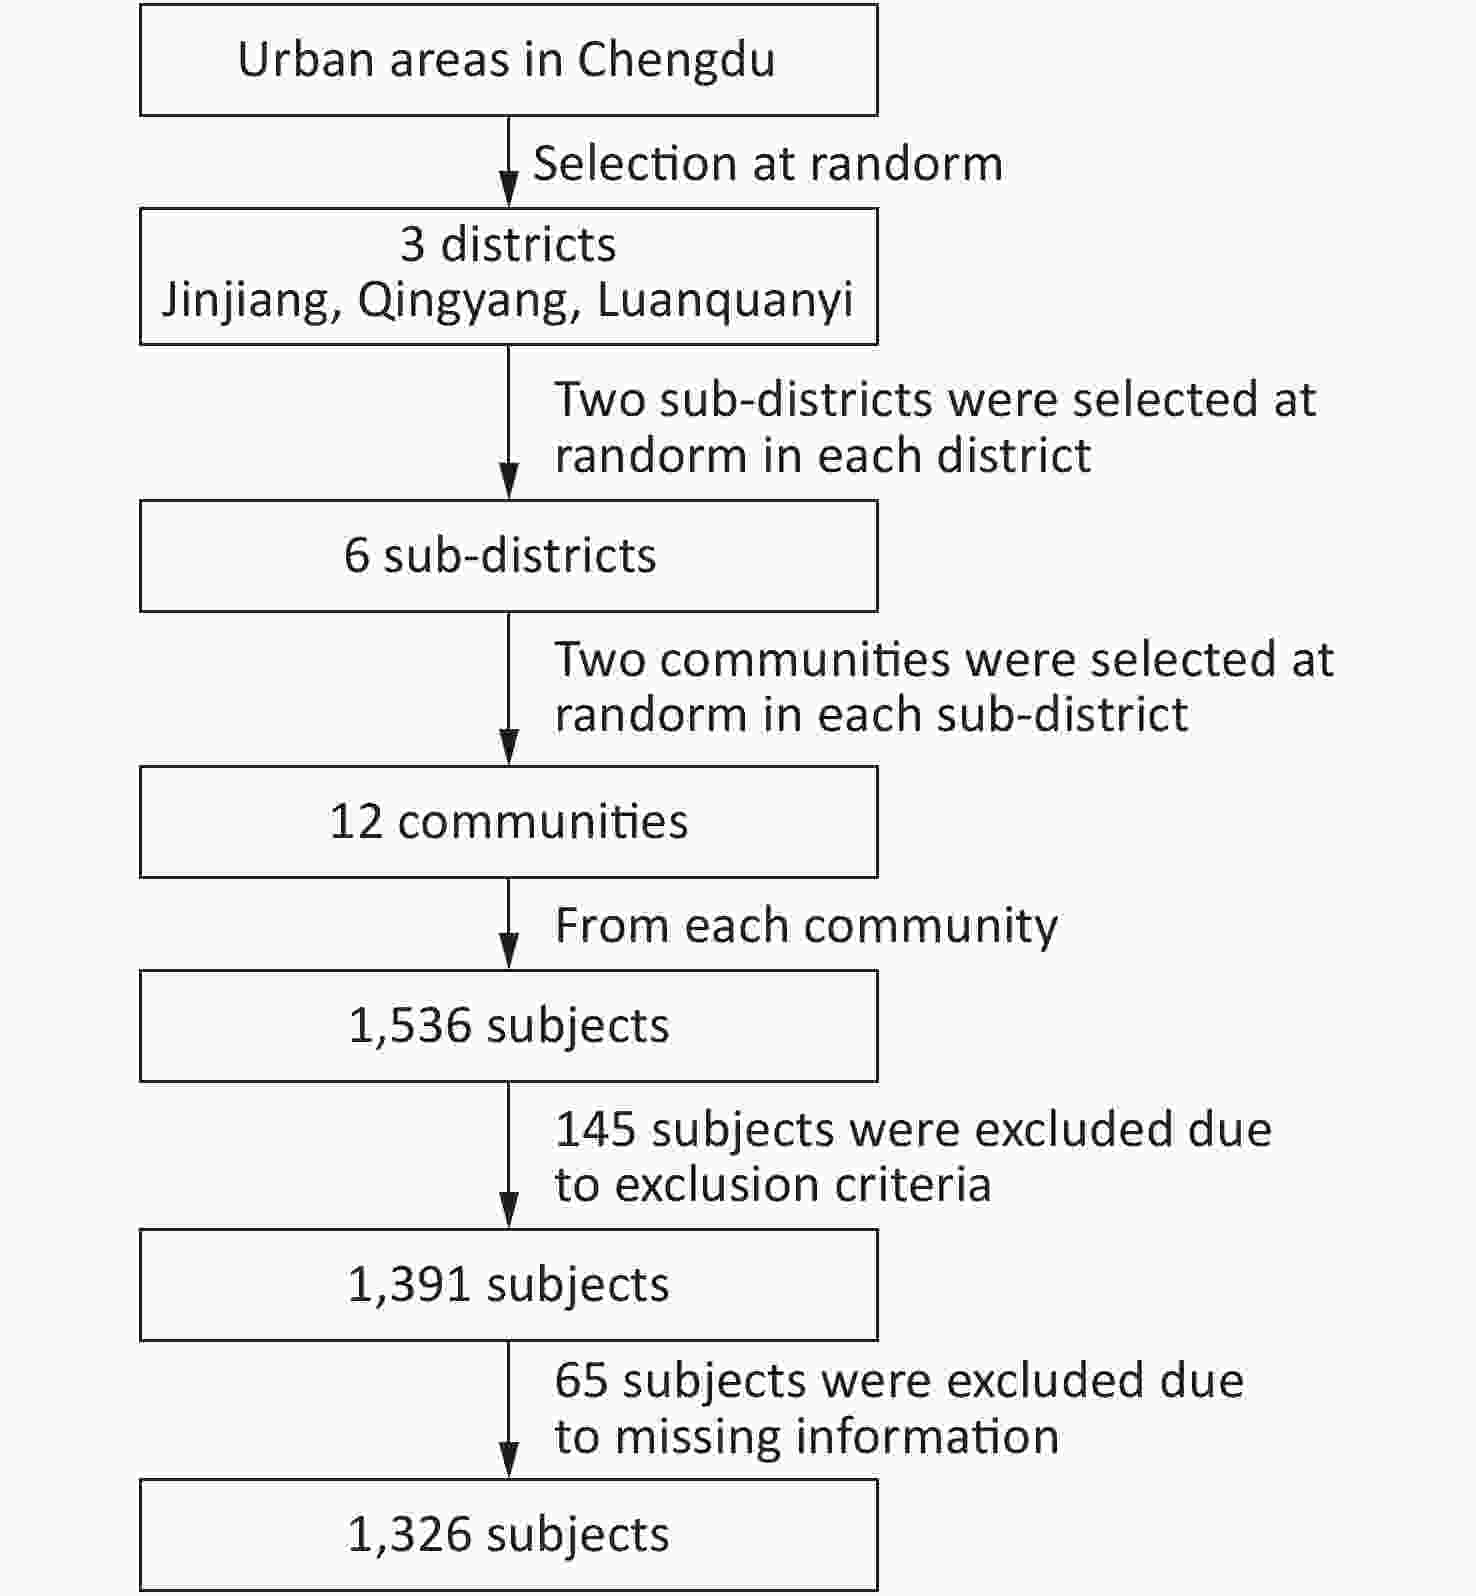
The participants were recruited using stratified cluster sampling methods. In the first phase, three districts were randomly selected in the urban area of Chengdu: Jinjiang, Qingyang, and Longquanyi. In the second phase, two random sub districts were selected in each district. In the third stage, two communities were randomly selected in each sub district. Thus, twelve random communities were selected in total. Participants aged ≥ 80 years who had been residing in the community for 3 years were included. Participants with neurological and psychological diseases, including Alzheimer’s disease, renal failure, end-stage cancer, and severe frailty, were excluded, in addition to those who were unwilling to participate in the study. Based on the above inclusion and exclusion criteria, 1,391 out of 1,536 raw sample set were enrolled in this study. A total of 65 individuals were then excluded due to missing demographic information or blood biochemistry data. Thus, 1,326 participants were included in the final analysis (Figure 1).
-
After rigorous training, more than 20 medical staff were qualified as fieldworkers in this study. Based on cardiovascular survey methods[22], we designed a questionnaire that included demographic characteristics (such as age and gender), personal medical history, and lifestyle associated factors (smoking and drinking). All subjects completed the questionnaire.
-
According to the World Health Organization MONICA project, the heights and weights of the participants were measured with each subject barefoot, wearing light clothes, and no headgear. During each measurement, the subjects stood with their backs square against the wall, eyes looking straight ahead, with a right-angle triangle resting on their scalp. For a small number of participants who found it difficult to stand, the individual laid on a bed and the person’s height was then measured using a tape measure. The body mass index (BMI) was calculated as weight (kg)/height (m)2. Waist circumference (WC) was measured as the minimum circumference between the inferior margin of the ribcage and the crest of the iliac[23]. After resting on a seat for 10 min, blood pressure (BP) was measured using standardized mercury sphygmomanometers.
-
After fasting for 12 hours, venous blood was drawn. Fasting blood glucose (FBG), lipids, and uric acid (UA) levels were measured in all blood samples. Participants with no history of DM were invited to undergo a 2-h oral glucose tolerance test (OGTT). Briefly, 75 g of glucose were dissolved in 300 mL of warm water and then given orally within 5 min. Venous blood was drawn 2 h later, and 2-h plasma glucose (2-hPG) was measured in these blood samples. All blood samples were sent to the Clinical Laboratory Center of the Second People’s Hospital of Chengdu. Total cholesterol (TC), triglycerides (TG), and blood glucose were measured by enzymatic methods. The phosphotungstic acid method was used for UA measurements.
-
According to the diagnostic criteria of the World Health Organization, patients with FPG levels ≥ 7.0 mmol/L, 2-hPG levels ≥ 11.1 mmol/L, or a previous clinical diagnosis were diagnosed with DM[24]. Whether the participant had a DM history was determined by prior blood testing in the hospital. According to the Seventh Report of the Joint National Committee, participants with an systolic blood pressure (SBP) ≥ 140 mmHg, diastolic blood pressure (DBP) ≥ 90 mmHg, and/or a history of hypertension and are currently receiving antihypertensive drug treatment were diagnosed with hypertension[25]. Overweight was defined as a BMI between 25.0 and 29.9 kg/m2, and obesity was considered as a BMI ≥ 30 kg/m2[22]. Abdominal obesity was defined as a WC ≥ 85 cm for men and WC ≥ 80 cm for women[26]. Hypertriglyceridemia and hypercholesterolemia were defined as TG ≥ 2.26 mmol/L and TC ≥ 6.22 mmol/L, respectively[27]. Smoking was defined as smoking at least once per day and smoking continuously ≥ 1 year recently or quitting smoking < 3 years. Drinking was considered drinking at least once a week and drinking continuously ≥ 1 year recently or quitting alcohol < 3 years.
-
Epi Data 3.1 (The Epi Data Association Odense, Denmark) was used with dual entry to guarantee the entry quality and SAS 9.3 (SAS Institute Inc. Cary, NC, USA) was used to conduct the statistical analyses. A t-test and chi-squared test were used for comparisons of continuous and categorical variables, respectively. A logistic regression model was used to calculate the odds ratios (OR) and 95% confidence intervals (CIs). According to the characteristics of DM, factors that may affect the prevalence of DM were included in a multivariate logistic regression model. When considering the correlation, variables were selected using the maximum likelihood estimated forward stepwise regression method (α = 0.05). P-values < 0.05 were considered significantly different.
-
In total, 1,326 participants (males: 48.9%) from twelve communities were enrolled in the final analysis. The mean participant age was 83.5 ± 3.1 years, with no significant sex-specific differences. Among all participants, 11.8% were current smokers and 10.2% were current alcohol drinkers. The weight, BMI, WC, FBG, and UA levels of males were significantly higher than those of females (all P < 0.05). The TC, high-density lipoprotein cholesterol (HDL-C), low-density lipoprotein cholesterol (LDL-C), and TG levels in females were markedly higher than those in males (all P < 0.01). There were no significant differences in DBP, heart rate, and 2-hPG level of males and females (Table 1).
Groups Overall (N = 1,326) Male (n = 645) Female (n = 681) P-values Age, mean ± SD 83.9 ± 3.5 84.0 ± 3.5 83.8 ± 3.5 0.353 Weight, kg, mean ± SD 54.7 ± 11.5 60.2 ± 10.1 49.4 ± 10.2 < 0.001 BMI, kg/m2, mean ± SD 23.0 ± 3.9 23.3 ± 3.6 22.8 ± 4.1 0.022 WC, cm, mean ± SD 88.5 ± 10.5 89.6 ± 10.2 87.5 ± 10.7 < 0.001 Current smoking (%) 157 ± 11.8 112 ± 17.4 45 ± 6.6 < 0.001 Current drinking (%) 135 ± 10.2 118 ± 18.3 17 ± 2.5 < 0.001 SBP, mmHg, mean ± SD 149.3 ± 21.7 147.2 ± 20.1 151.2 ± 23.0 0.001 DBP, mmHg, mean ± SD 74.0 ± 12.1 74.5 ± 11.5 73.7 ± 12.7 0.223 Heart rate/min, mean ± SD 76.1 ± 12.4 76.3 ± 13.7 75.9 ± 11.0 0.487 TC, mmol/L, mean ± SD 4.8 ± 0.9 4.6 ± 0.9 5.0 ± 0.9 < 0.001 HDL-C, mmol/L, mean ± SD 1.6 ± 0.4 1.5 ± 0.4 1.7 ± 0.4 < 0.001 LDL-C, mmol/L, mean ± SD 2.6 ± 0.8 2.5 ± 0.7 2.7 ± 0.8 < 0.001 TG, mmol/L, mean ± SD 1.4 ± 0.7 1.3 ± 0.6 1.4 ± 0.7 < 0.001 FPG, mmol/L, mean ± SD 5.6 ± 2.1 5.8 ± 2.3 5.5 ± 2.0 0.043 2-hPG, mmol/L, mean ± SD 8.6 ± 3.7 8.7 ± 2.8 8.4 ± 4.4 0.238 UA, mmol/L, mean ± SD 334.6 ± 117.7 360.1 ± 118.4 310.4 ± 112.0 < 0.001 Note. BMI, body mass index; WC, waist circumference; DBP, diastolic blood pressure; SBP, systolic blood pressure; TC, total cholesterol; HDL-C, high-density lipoprotein cholesterol; LDL-C, low-density lipoprotein cholesterol; TG, triglyceride; FPG, fasting plasma glucose; 2-hPG, 2-h plasma glucose; UA, uric acid; SD, standard deviation. Table 1. Baseline characteristics of the very elderly population
-
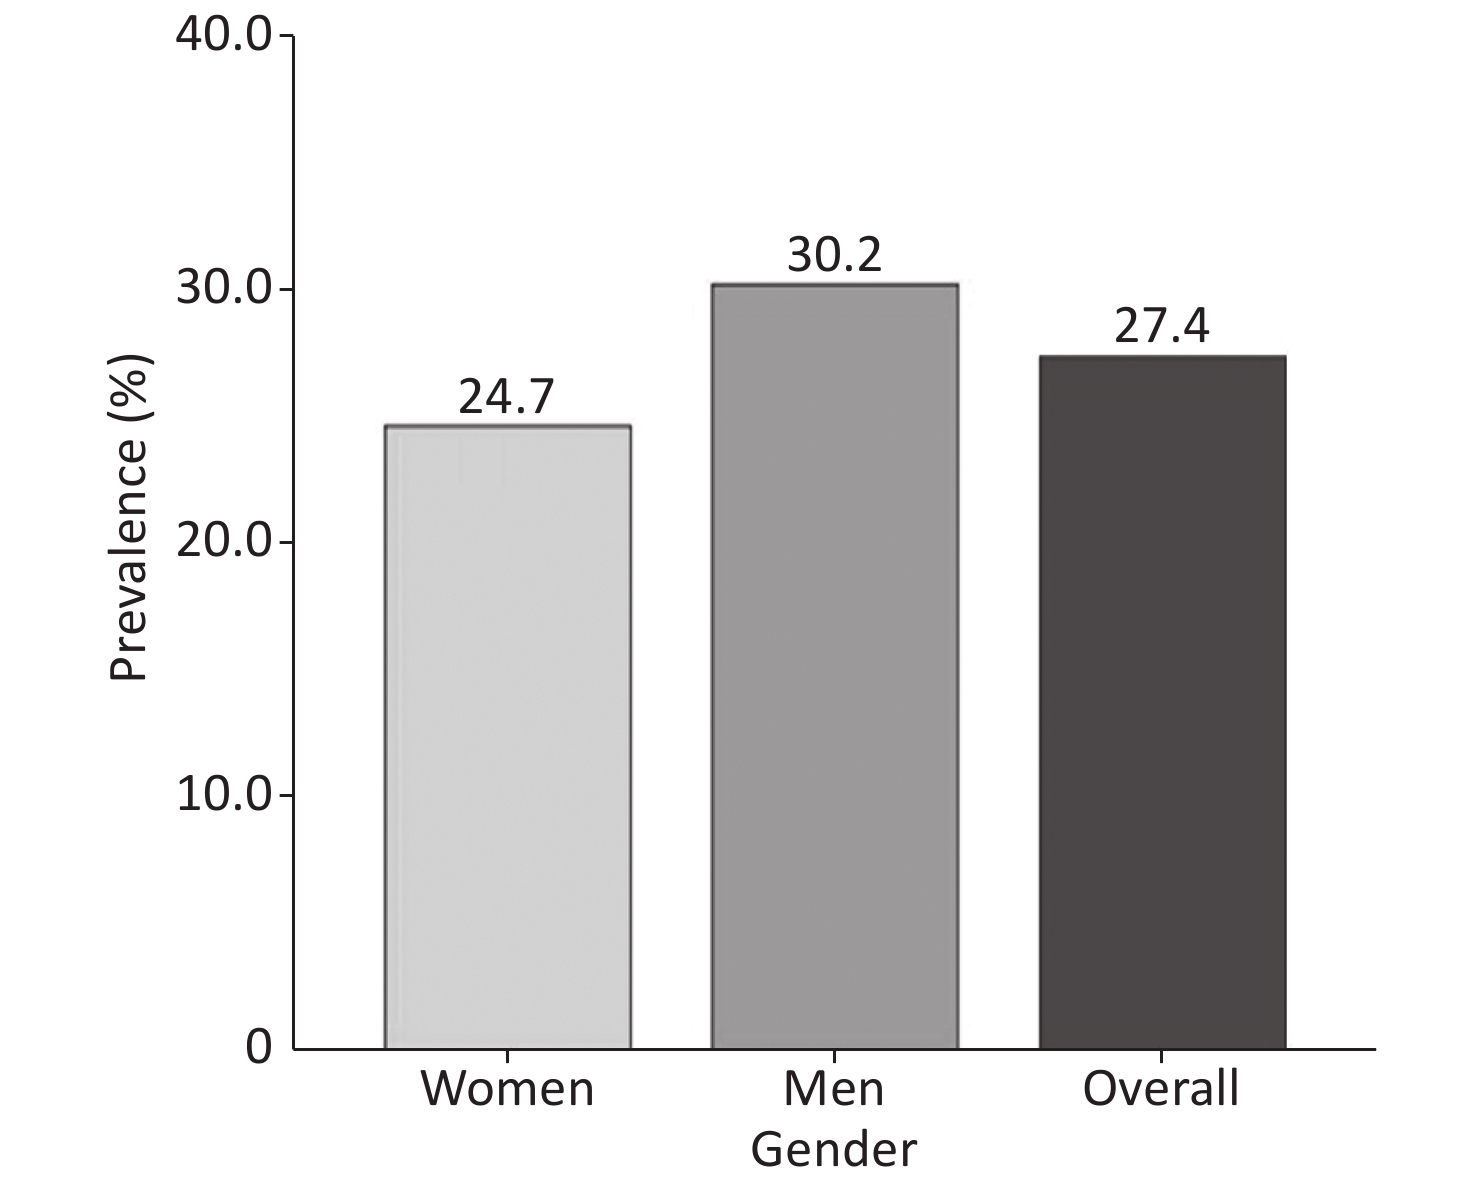
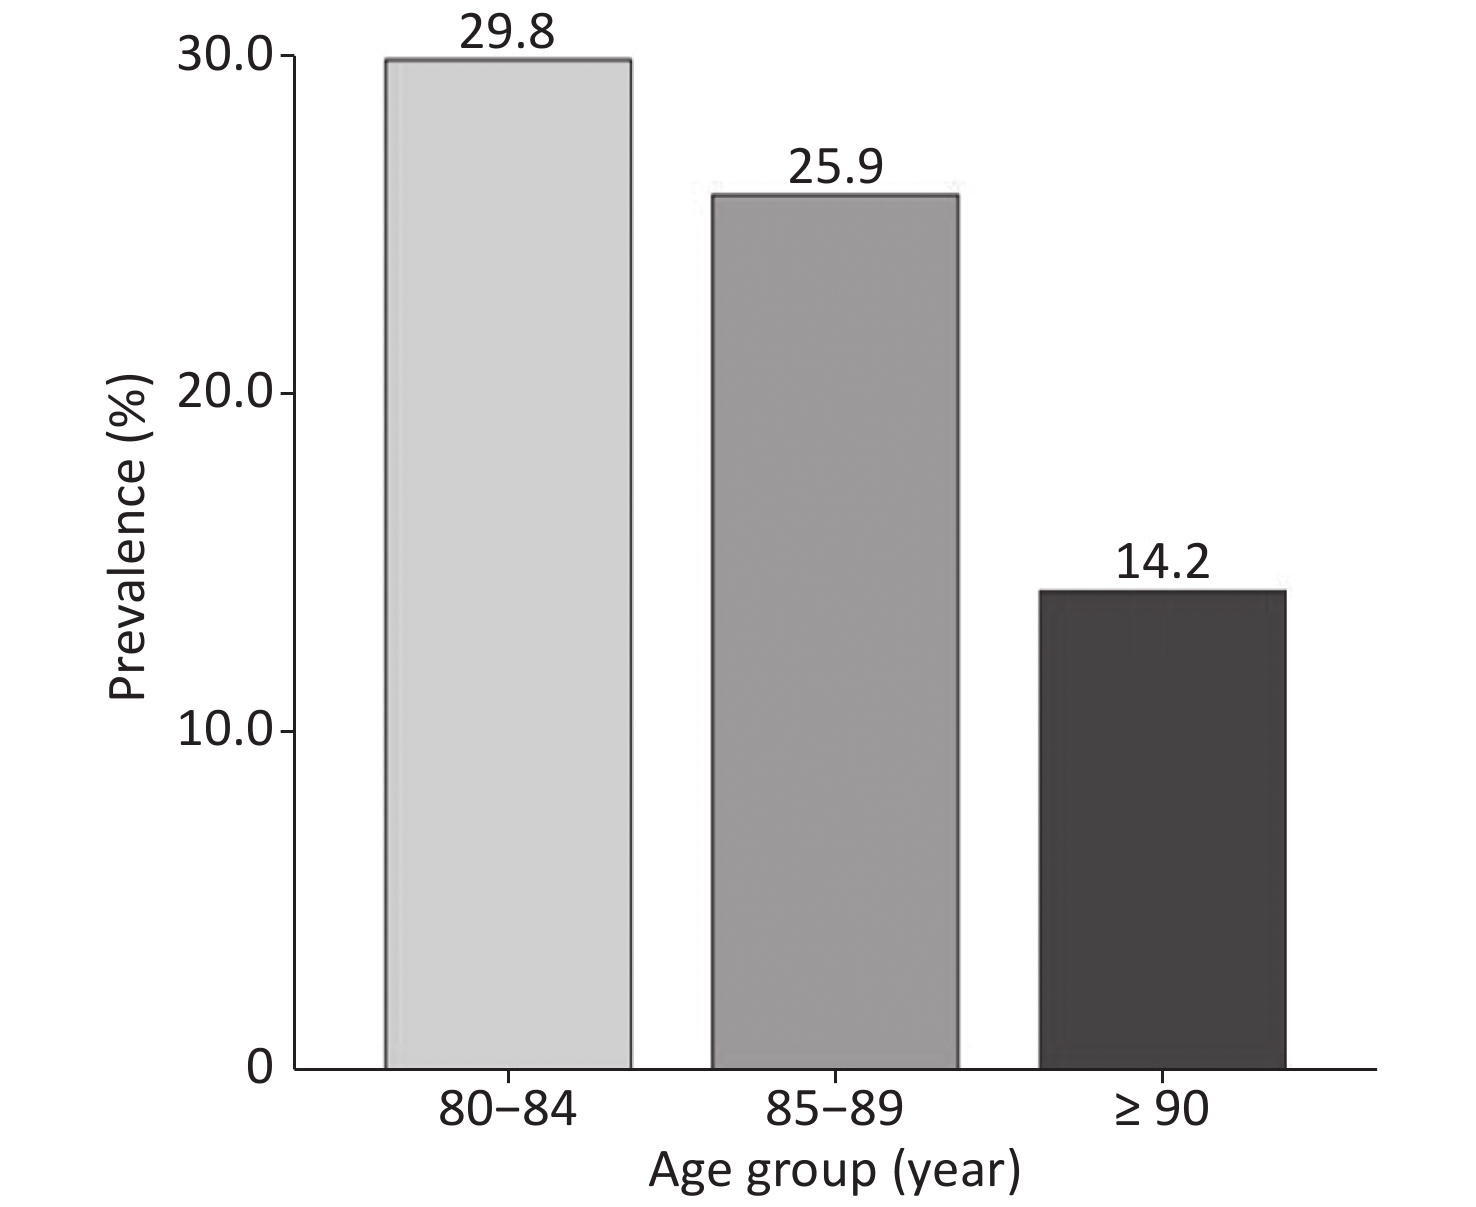
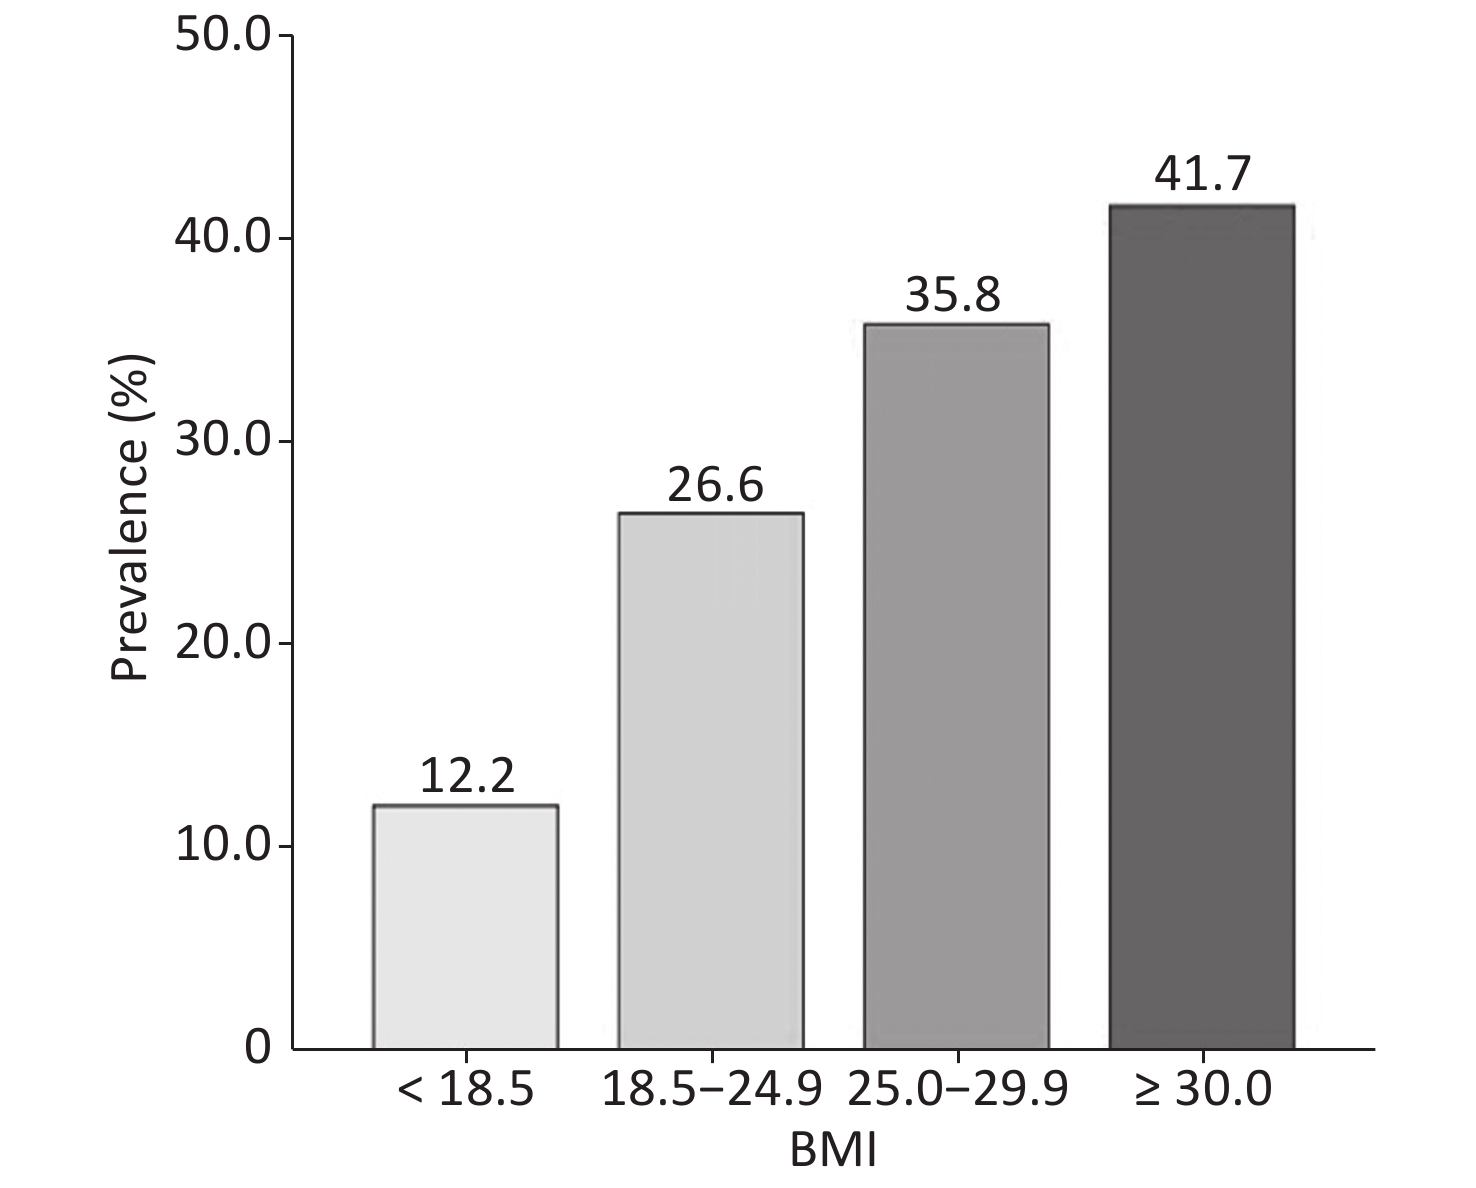
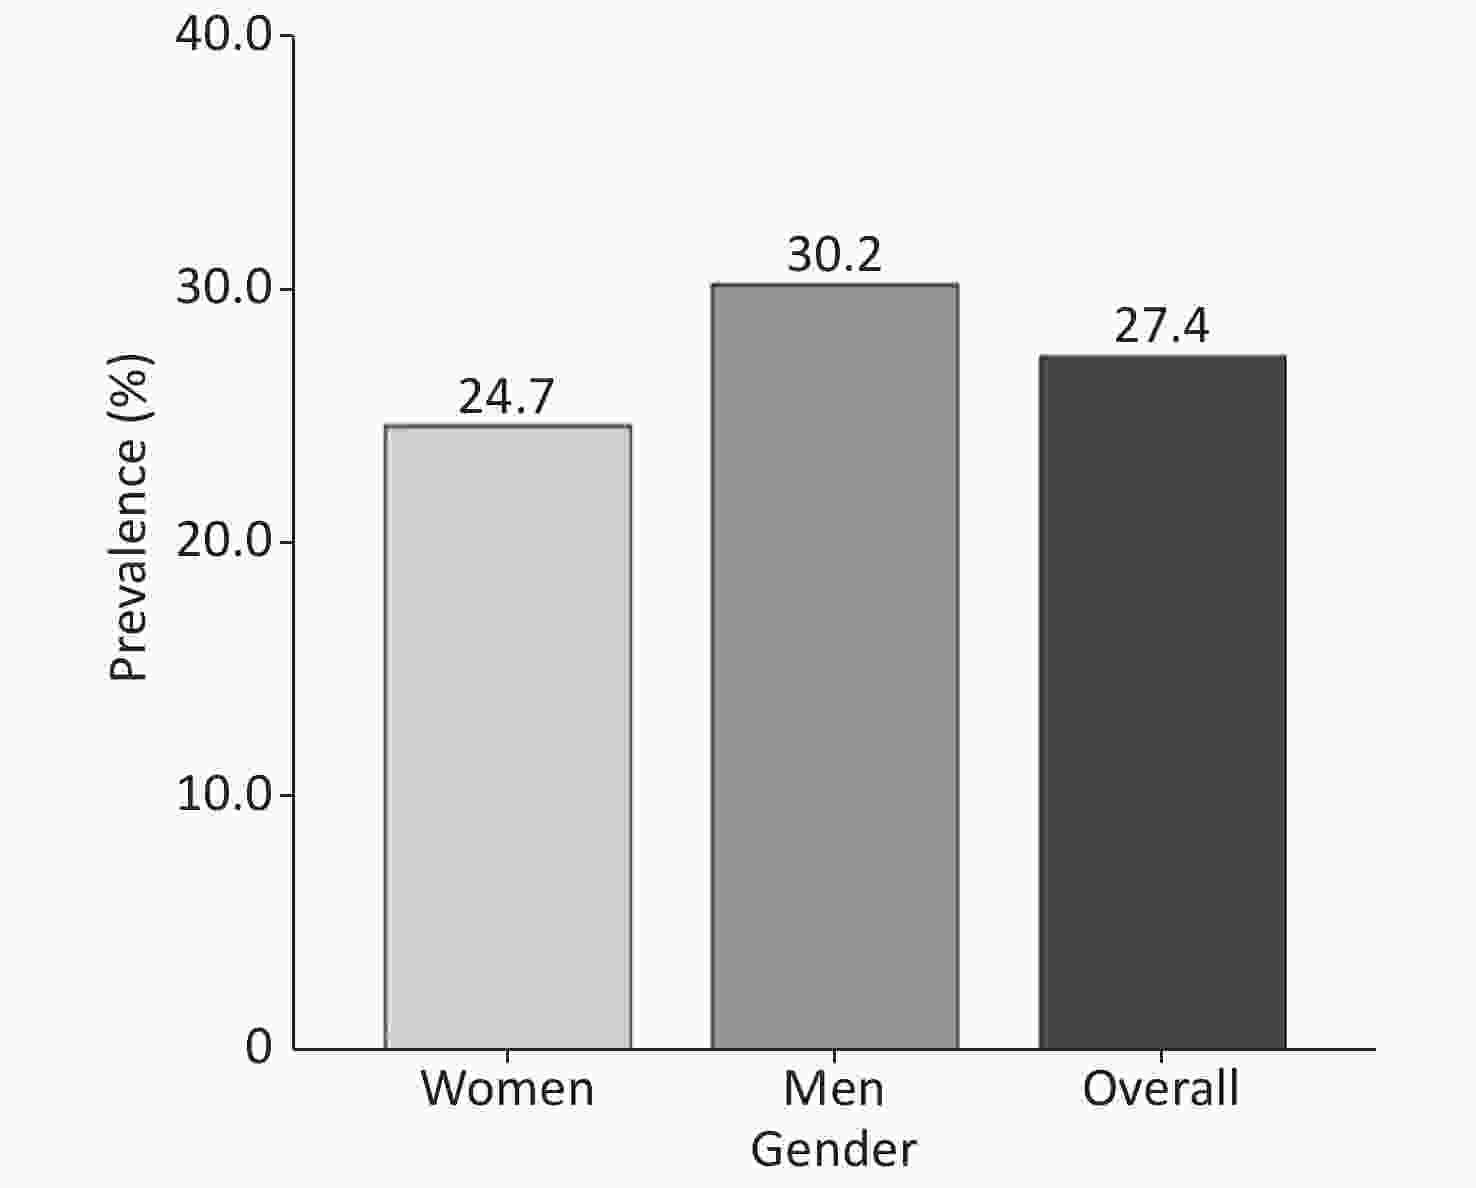
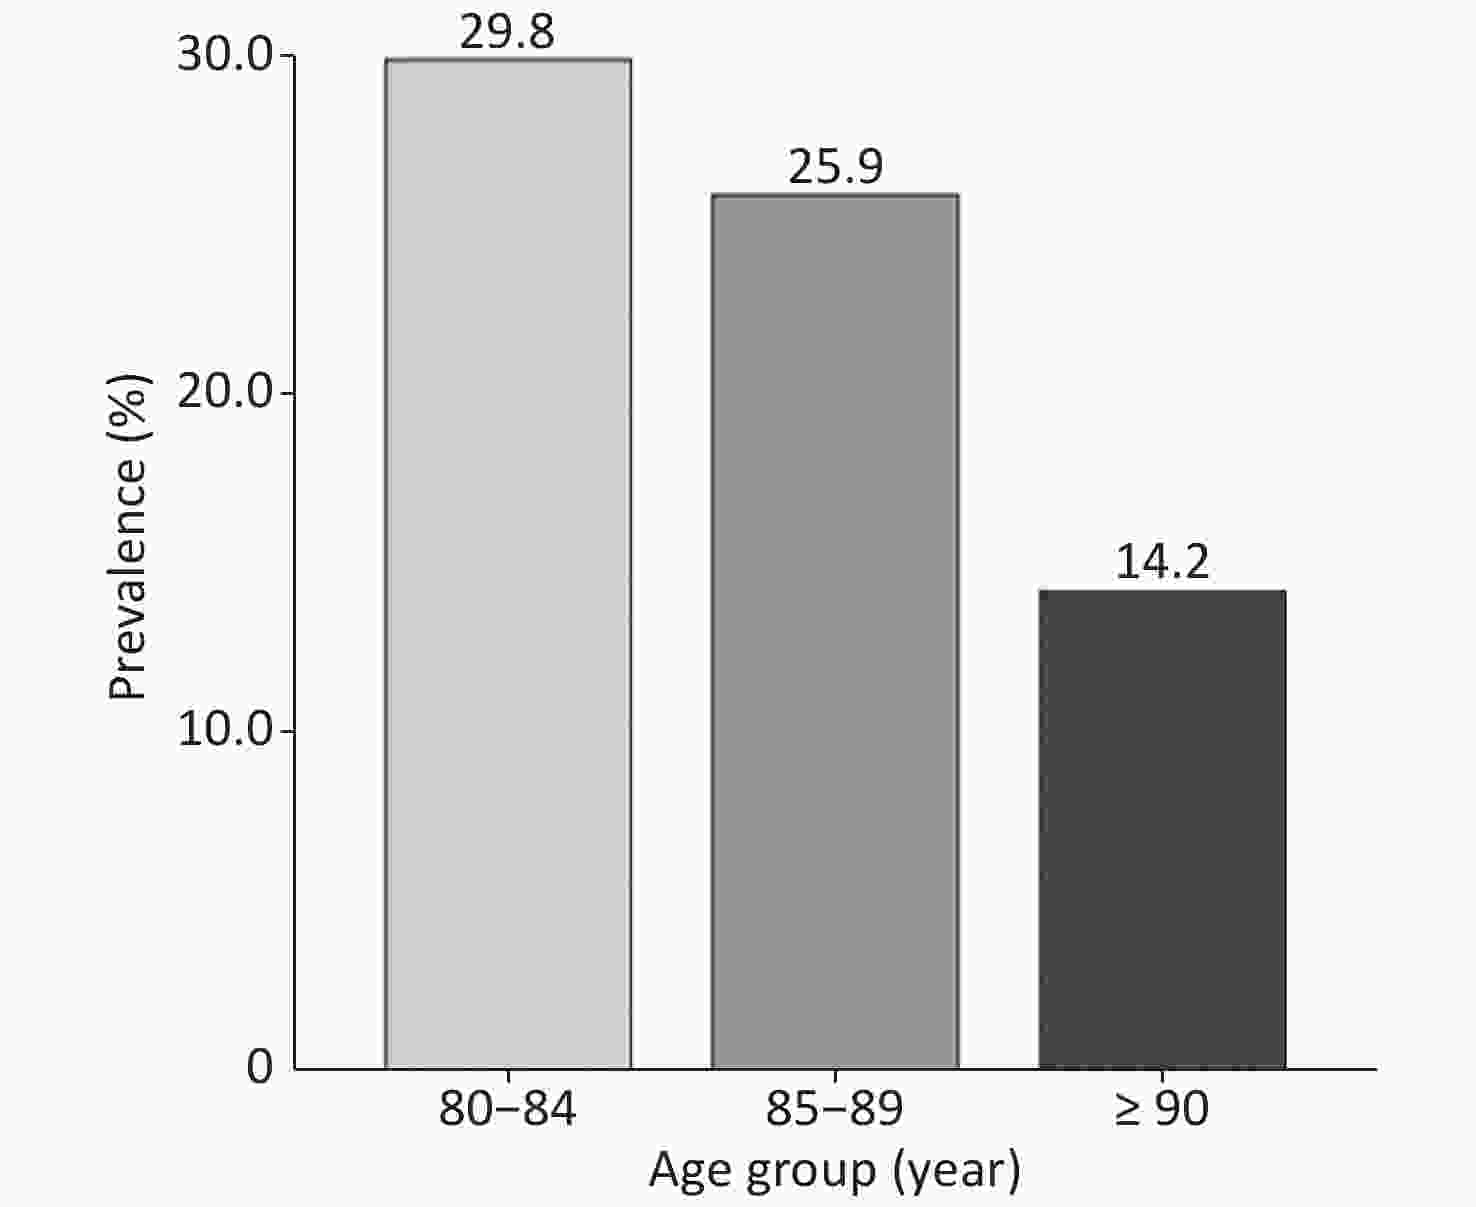
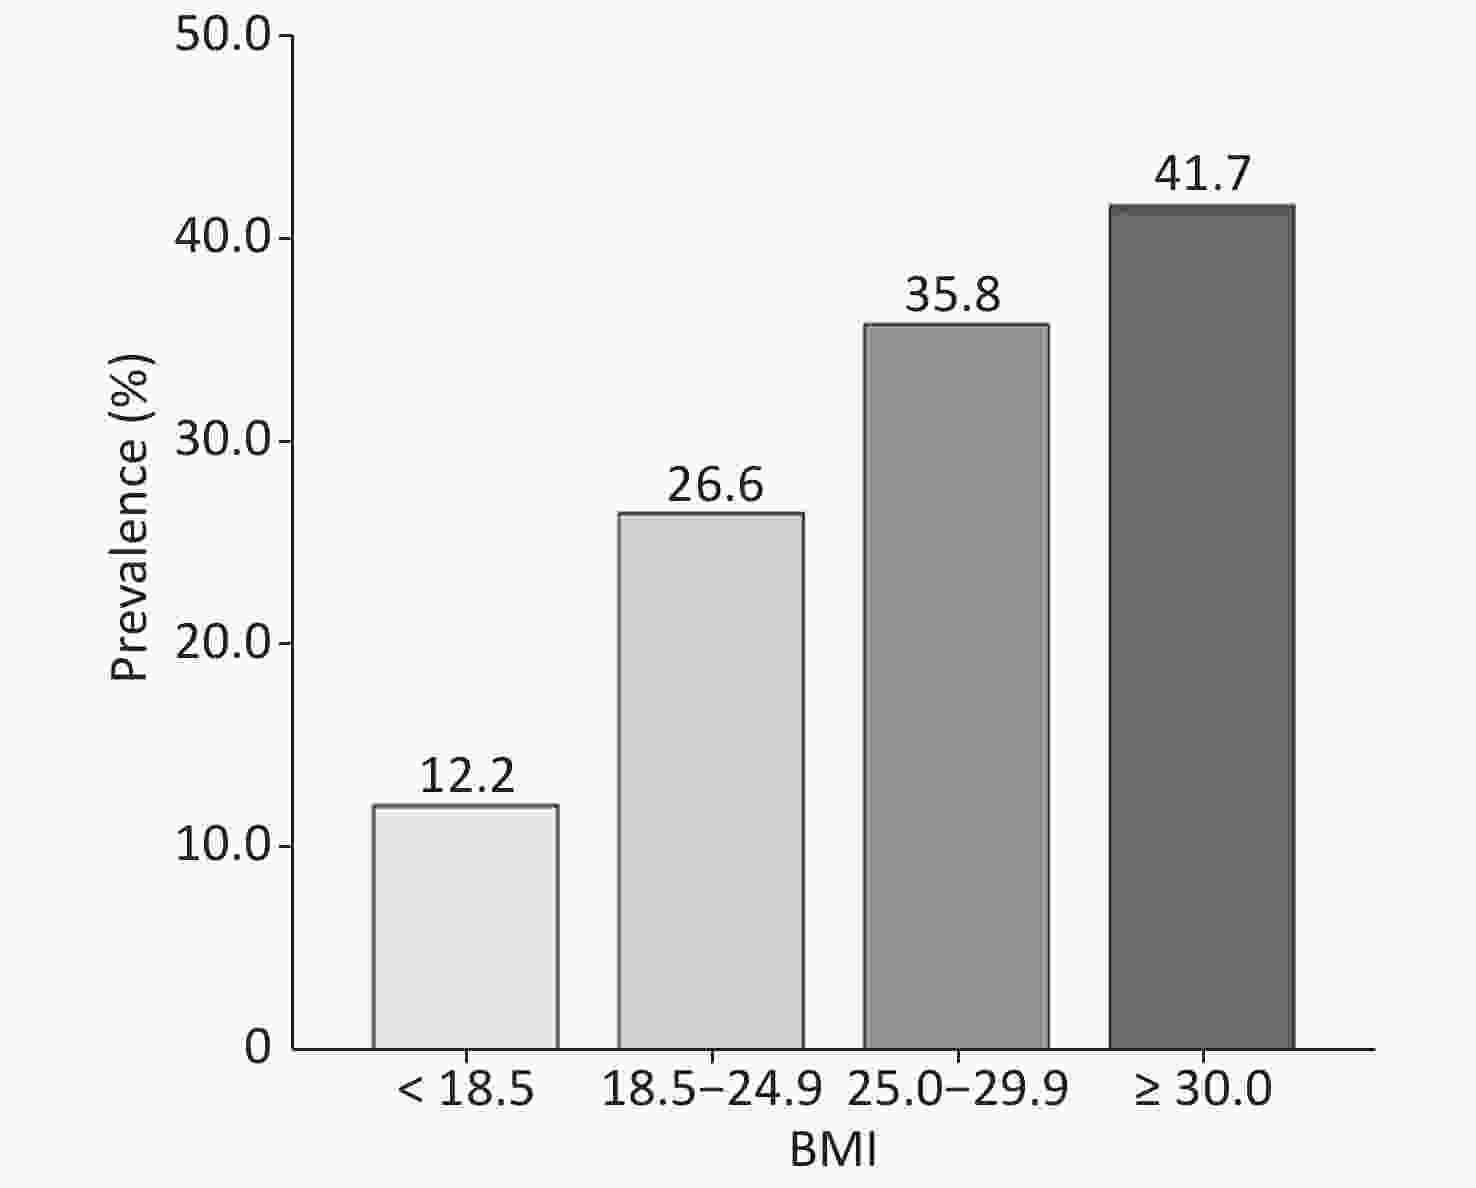
The overall prevalence of DM was 27.4% (Figure 2). The prevalence of DM in males was 30.2% (195/645), whereas it was 24.7% (168/681) in females (P = 0.02). The prevalence of DM in the very elderly population aged 80–84, 85–89, and ≥ 90 years was 29.8%, 25.9%, and 14.2%, respectively. Overall, the prevalence of DM in the very elderly population negatively correlated with age (P < 0.001) (Figure 3). With regards to BMI, the prevalence of DM was 8.2%, 26.6%, 35.8%, and 41.7% in those with a BMI of < 18.5, 18.5–24.9, 25.0–29.9, and ≥ 30 kg/m2, respectively. Therefore, the prevalence of DM positively correlated with BMI (Figure 4) (P < 0.001).
Of the 363 diabetic patients, 229 had been previously diagnosed, and 134 were newly diagnosed. Newly diagnosed DM cases accounted for 36.9% of all DM patients. The ratio of newly diagnosed DM cases was 42.1% in males and 31.0% in females (P = 0.03). Among the participants aged 80–84 years, 34.6% were newly diagnosed, whereas 50.0% of participants aged ≥ 90 years were newly diagnosed DM cases (Table 2).
Parameter Previous diagnosed Newly diagnosed Proportion of newly diagnosed N (%) 229 (17.3) 134 (10.1) 36.9 Gender, n (%) Male 113 (17.5) 82 (12.7) 42.1 Female 116 (17.0) 52 (7.6) 31.0 Age group, n (%) 80–84 195 (19.7) 103 (10.4) 34.6 85–89 29 (11.2) 26 (10.1) 47.3 ≥ 90 5 (6.3) 5 (6.3) 50.0 Table 2. Diabetes detection in the very elderly population
-
The results of the univariate logistic regression analysis and the ORs and 95% CIs for the different associated factors are shown in Table 3. The results showed that male sex (OR = 1.323; 95% CI, 1.039–1.687), hypertension (OR = 1.543; 95% CI, 1.164–2.064), hypertriglyceridemia (OR = 1.869; 95% CI, 1.259–2.752), overweight or obesity (OR = 1.859; 95% CI, 1.437–2.403), high heart rate (OR = 1.298; 95% CI, 1.019–1.654), and abdominal obesity (OR = 1.823; 95% CI, 1.422–2.346) were all positively correlated with DM. However, age was negatively correlated with DM (OR = 0.943; 95% CI, 0.908–0.978). Next, potential factors related to DM in this very elderly population were included in the multivariate logistic regression model analysis. The results revealed that male sex (OR = 1.433; 95% CI, 1.116–1.843), hypertension (OR = 1.439; 95% CI, 1.079–1.936), overweight or obesity (OR = 1.371; 95% CI, 1.023–1.834), high heart rate (OR = 1.362; 95% CI, 1.063–1.745), and abdominal obesity (OR = 1.615; 95% CI, 1.216–2.149) were all positively correlated with DM, whereas age was negatively correlated with DM (OR = 0.952; 95% CI, 0.916–0.989) (Table 4).
Variable β SE Wald P-value OR 95% CI Age −0.059 0.019 9.632 0.002 0.943 (0.908–0.978) Sex (reference: Female) 0.280 0.124 5.143 0.023 1.323 (1.039–1.687) Hypertension 0.434 0.146 8.840 0.003 1.543 (1.164–2.064) Overweight or obesity (BMI ≥ 25) 0.620 0.131 22.374 < 0.001 1.859 (1.437–2.403) Heart rate (≥ 75 per minute) 0.261 0.124 4.449 0.035 1.298 (1.019–1.654) Center obesity 0.600 0.128 22.105 < 0.001 1.823 (1.422–2.346) Hypertriglyceridemia 0.626 0.199 9.871 0.002 1.869 (1.259–2.752) Note. β, partial regression coefficient; SE, standard error of partial regression coefficient; OR, odds ratio; CI, confidence interval. Table 3. Logistic regression for DM among the very elderly population (univariate analysis)
Variable β SE Wald P-value OR 95% CI Age −0.0491 0.0196 6.287 0.012 0.952 (0.916–0.989) Sex (reference: Female) 0.360 0.128 7.919 0.005 1.433 (1.116–1.843) Hypertension 0.364 0.149 5.968 0.015 1.439 (1.079–1.936) Overweight or obesity 0.315 0.149 4.488 0.034 1.371 (1.023–1.834) Heart rate (> 75 beats/min) 0.309 0.126 6.000 0.015 1.362 (1.063–1.745) Center obesity 0.480 0.145 10.928 0.001 1.615 (1.216–2.149) Note. β, partial regression coefficient; SE, standard error of partial regression coefficient; OR, odds ratio; CI, confidence interval. Table 4. Logistic regression for DM among the very elderly population (multivariable analysis)
-
This is the first study to report the prevalence of DM in a very elderly Chinese population living in the community, providing a scientific basis to prevent and control DM in this population. The findings showed that the prevalence of DM in individuals aged ≥ 80 years was 27.4% in 2015–2016 in Chengdu, suggesting that approximately 3 in 10 people aged ≥ 80 years were diabetic. The prevalence of DM in the present study was higher than that found in the Chinese population aged ≥ 60 years (20.2%) from a previous study[9] and higher than in individuals aged ≥ 60 years in Thailand (14%)[28]. In addition, the prevalence of DM in this very elderly Chinese population was lower than that found in very elderly men living in cadre sanitariums in Beijing, China (38.1%)[29], indicating that income levels may be positively correlated with the prevalence of DM in the very elderly population. A study in India reported that financial status was associated with DM, with a higher financial status linked to an increased prevalence of DM[30]. However, studies in the US and Canada suggested that a low income increased the prevalence of DM[31,32]. In conclusion, these findings suggest that the prevalence of DM is increased among those with a higher income in developing countries. In our study, the education level of many individuals in this very elderly population was junior high school or below. In the present study, the prevalence of DM among very elderly men (30.2%) was higher than that among very elderly women (24.7%). This result is similar to previous population studies[8,9,33,34]. Previous studies showed that the prevalence of DM increased in accordance with an increase in age, in which age was divided as follows: ≤ 39, 40–59, and ≥ 60 years[8,9]. However, among the very elderly population in China, the prevalence trend of DM with age was not clear. In our study, the DM prevalence in participants aged 80–84, 85–89, and ≥ 90 years was 29.8%, 25.9%, and 14.2%, respectively. These results suggested that the prevalence of DM in people aged ≥ 80 years decreased gradually with increasing age. In a previous survey of elderly diabetics in the Chengdu area[35], the prevalence of DM was 30% among people aged 70–79 years. Taken together, these findings indicate that the prevalence of DM did not rise in people aged ≥ 80 years and that the prevalence was even lower among people aged ≥ 90 years. In patients with diabetes, hypoglycemia, cardiovascular complications, and mortality developed with age, especially in people aged ≥ 80 years. We speculate that the decreasing prevalence of DM with age in the study population may be due to a large number of deaths from complications.
Our study also found that the prevalence of DM in this very elderly Chinese population tended to increase gradually with BMI, similar to previous studies in China[8,9]. More than one-third of overweight and obese people aged ≥ 80 years suffer from DM[3]. Obesity leads to insulin resistance, making the individual prone to DM[36]. In our study, not only overall but also central obesity was significantly associated with the prevalence of DM. Therefore, very elderly adults who are overweight, obese, or have central obesity require regular monitoring of their FBG and postprandial blood glucose. To diagnose and implement practical DM-based interventions, we recommend that these individuals undergo blood glucose monitoring at least every 6 months.
In the current study, the overall prevalence of DM in the very elderly population was 27.4%, and the new diagnosis rate was 10.1%. In total, newly diagnosed DM cases accounted for 36.9% of all DM cases, more than one-third of the very elderly participants. Therefore, the non-diagnostic rate of DM was high in the study population. Among the patients aged ≥ 90 years, individuals with newly diagnosed diabetes accounted for one-half of DM cases. Thus, in this population, the diagnosis of DM was generally missed, and DM screening should be strengthened.
Similar to previous studies in the general population, high heart rate was positively correlated with DM in the very elderly[37,38]. Heart rate is believed to respond to autonomic nervous system activity in the human body and is associated with DM. Previous studies reported that elevated sympathetic nervous system activity led to insulin resistance[39,40], which resulted in DM. Therefore, maintaining a relaxed mood and trying to avoid emotional fluctuations and long-term anxiety may effectively reduce sympathetic nervous system activation and thus lower the associated development of DM.
There are several limitations of this study. First, we did not measure the glycated hemoglobin index level, so adding this index will provide more accuracy[41]. The second limitation is that this study does not reflect the prevalence of DM among the rural population, as it was carried out in an urban community. Third, some lifestyle factors (e.g., dietary intake, exercise) were not considered, which may be associated with DM. In addition, participants with neurological and psychological diseases were excluded, which may affect the estimation of DM prevalence. Moreover, BMI may not be a perfect parameter to assess the nutritional status of the very elderly population due to changes in body composition with aging. Finally, this study is unlikely to infer the causality between the associated factors and DM due to the weak evidence that results from a cross-sectional study.
In conclusion, the prevalence of DM in the Chinese population aged ≥ 80 years was high, especially newly diagnosed DM. The prevalence of DM in very elderly men was higher than that in very elderly women. Moreover, the prevalence of DM decreased with age and increased with BMI. Furthermore, male sex, hypertension, overweight or obesity, high heart rate, and abdominal obesity were all significantly positively associated with DM. These results provide a scientific basis to prevent and control DM in very elderly populations.
-
We sincerely thank all the staff and participants for their valuable contributions.
-
No conflict of interest to declare.
Prevalence and Associated Factors of Diabetes Mellitus in a Very Elderly Chinese Population: A Cross-sectional Study
doi: 10.3967/bes2020.043
- Received Date: 2019-09-26
- Accepted Date: 2020-03-20
-
Key words:
- Diabetes /
- Very Elderly Chinese /
- Prevalence
Abstract:
| Citation: | LIANG Bin, TANG Wei Wei, ZHANG Wen Qiang, HUANG Chuan, LIU Ya, XU Fan, LIU Xin, YUAN Ning, LIU Jian Xiong, YI Yan Jing, XU Rong Hua, HU Dan, HUANG Xiao Bo, CAO Xin. Prevalence and Associated Factors of Diabetes Mellitus in a Very Elderly Chinese Population: A Cross-sectional Study[J]. Biomedical and Environmental Sciences, 2020, 33(5): 315-322. doi: 10.3967/bes2020.043 |




 Quick Links
 DownLoad:
