


-
In China, Centers for Disease Control and Prevention (CDCs) are governmental technical organizations specializing in disease control and prevention that are considered indispensable parts of the national public health system. The mission of the CDC system is to create a safe and healthy environment, maintain social stability, ensure national security, and promote the health of people through prevention and control of disease, injury, and disability. There are 3,456 local CDCs in China[1]. The national infectious diseases surveillance system can provide real-time reports of cases anywhere in the country within four hours[2], effecting swift emergency responses to earthquakes and other natural catastrophes[3] and showing great accomplishments of central management of public health services. At the same time, resource allocation to address inequalities in the health system has attracted increasing societal and political attention[4]. Undoubtably, health equity involves equity in the distribution of healthcare services and allocation of health-related resources. Equity in health is important[5], and reform of the healthcare system is a top priority to address equity problems in China[6,7]. Studies that address health equity have provided many evidence-based recommendations for reforming the healthcare system.
After the severe acute respiratory distress syndrome (SARS) epidemic in 2003, the Chinese government accelerated building the public health infrastructure and fundamentally reformed the healthcare system[8,9]. In particular, the Healthy China 2030 Plan, which is the most important national strategy for the next 15 years issued by the Chinese Communist Party Congress and the State Council in 2016, has made health equity a priority and promotes reform of the public health system[10,11]. For the larger concept of health equity, equity in healthcare implies fair arrangements that allow equal geographic, economic, and cultural access to services for those in need of care[5,12]. Much attention has been drawn to the fact that in recent years public health staff have been unevenly distributed[13,14]. The public health workforce, which works mostly in the CDC system, remains poorly trained and unmotivated in many areas[3]. This drawback is especially serious in poor parts of China where both existing and newly emerging infectious diseases coexist. Wealthier areas face the deeply-serious problem of high staff turnover despite ever-increasing population sizes and densities, newly emerging infectious diseases, and accelerated behavioral shifts, challenging the provision of high-quality public health services. Exacerbating the problem, some staff may move to nearby wealthier areas for better training and better lifestyles.
Although previous studies have examined human resources for health (HRH) in China, most measure inequalities of the workforce with respect to the entire health system, using either quantitative or qualitative comparisons of Gini coefficients and Theil indices. Studies have used geo-mapping and spatial analyses of the distribution of HRH, and these strategies can identify geographical details, support visualization, and provide valuable information about HRH inequality. Bin Zhu et al.[15,16] introduced the local Moran’s I measure to describe and compare the spatial distributions of urban and rural health workforces in China. Xue Feng et al.[17] used the global Moran’s I and a bivariate local indicator of spatial autocorrelation (LISA) to estimate spatial autocorrelations between availability of the dental workforce and use of dental services. However, to date, there is a lack of research that has analyzed inequality of the public health workforce distribution that uses a combination of traditional methods and geographical information techniques. Policymakers should take spatial independence into consideration when discussing reform of the public health system.
The objective of this study was to evaluate the distribution of inequality of the public health workforce, using classic traditional methods and spatial statistics, by depicting geographical distributions and assessing inequality of human resources of the CDCs system across different regions in China during 2008–2017. We believe that our findings can provide a basis for public health policymakers to address human resource allocation and growing health inequities.
-
Data on the CDC system workforce were available from two sources - China Health Statistical Yearbooks (CHSY)[1], which are published annually by the National Health Commission (NHC, formerly the Chinese Ministry of Health) and the Chinese Center for Disease Control and Prevention basic information system. We analyzed discrepancies across the two data sources, which use different data collection instruments and methodologies. Because the basic information system was newly established in 2004, we used province level data for the CDC system workforce and resident population data from CHSY during the period 2008–2017, covering 31 provinces, municipalities, and autonomous regions of China, with the exception of Hong Kong, Macao, and Taiwan.
-
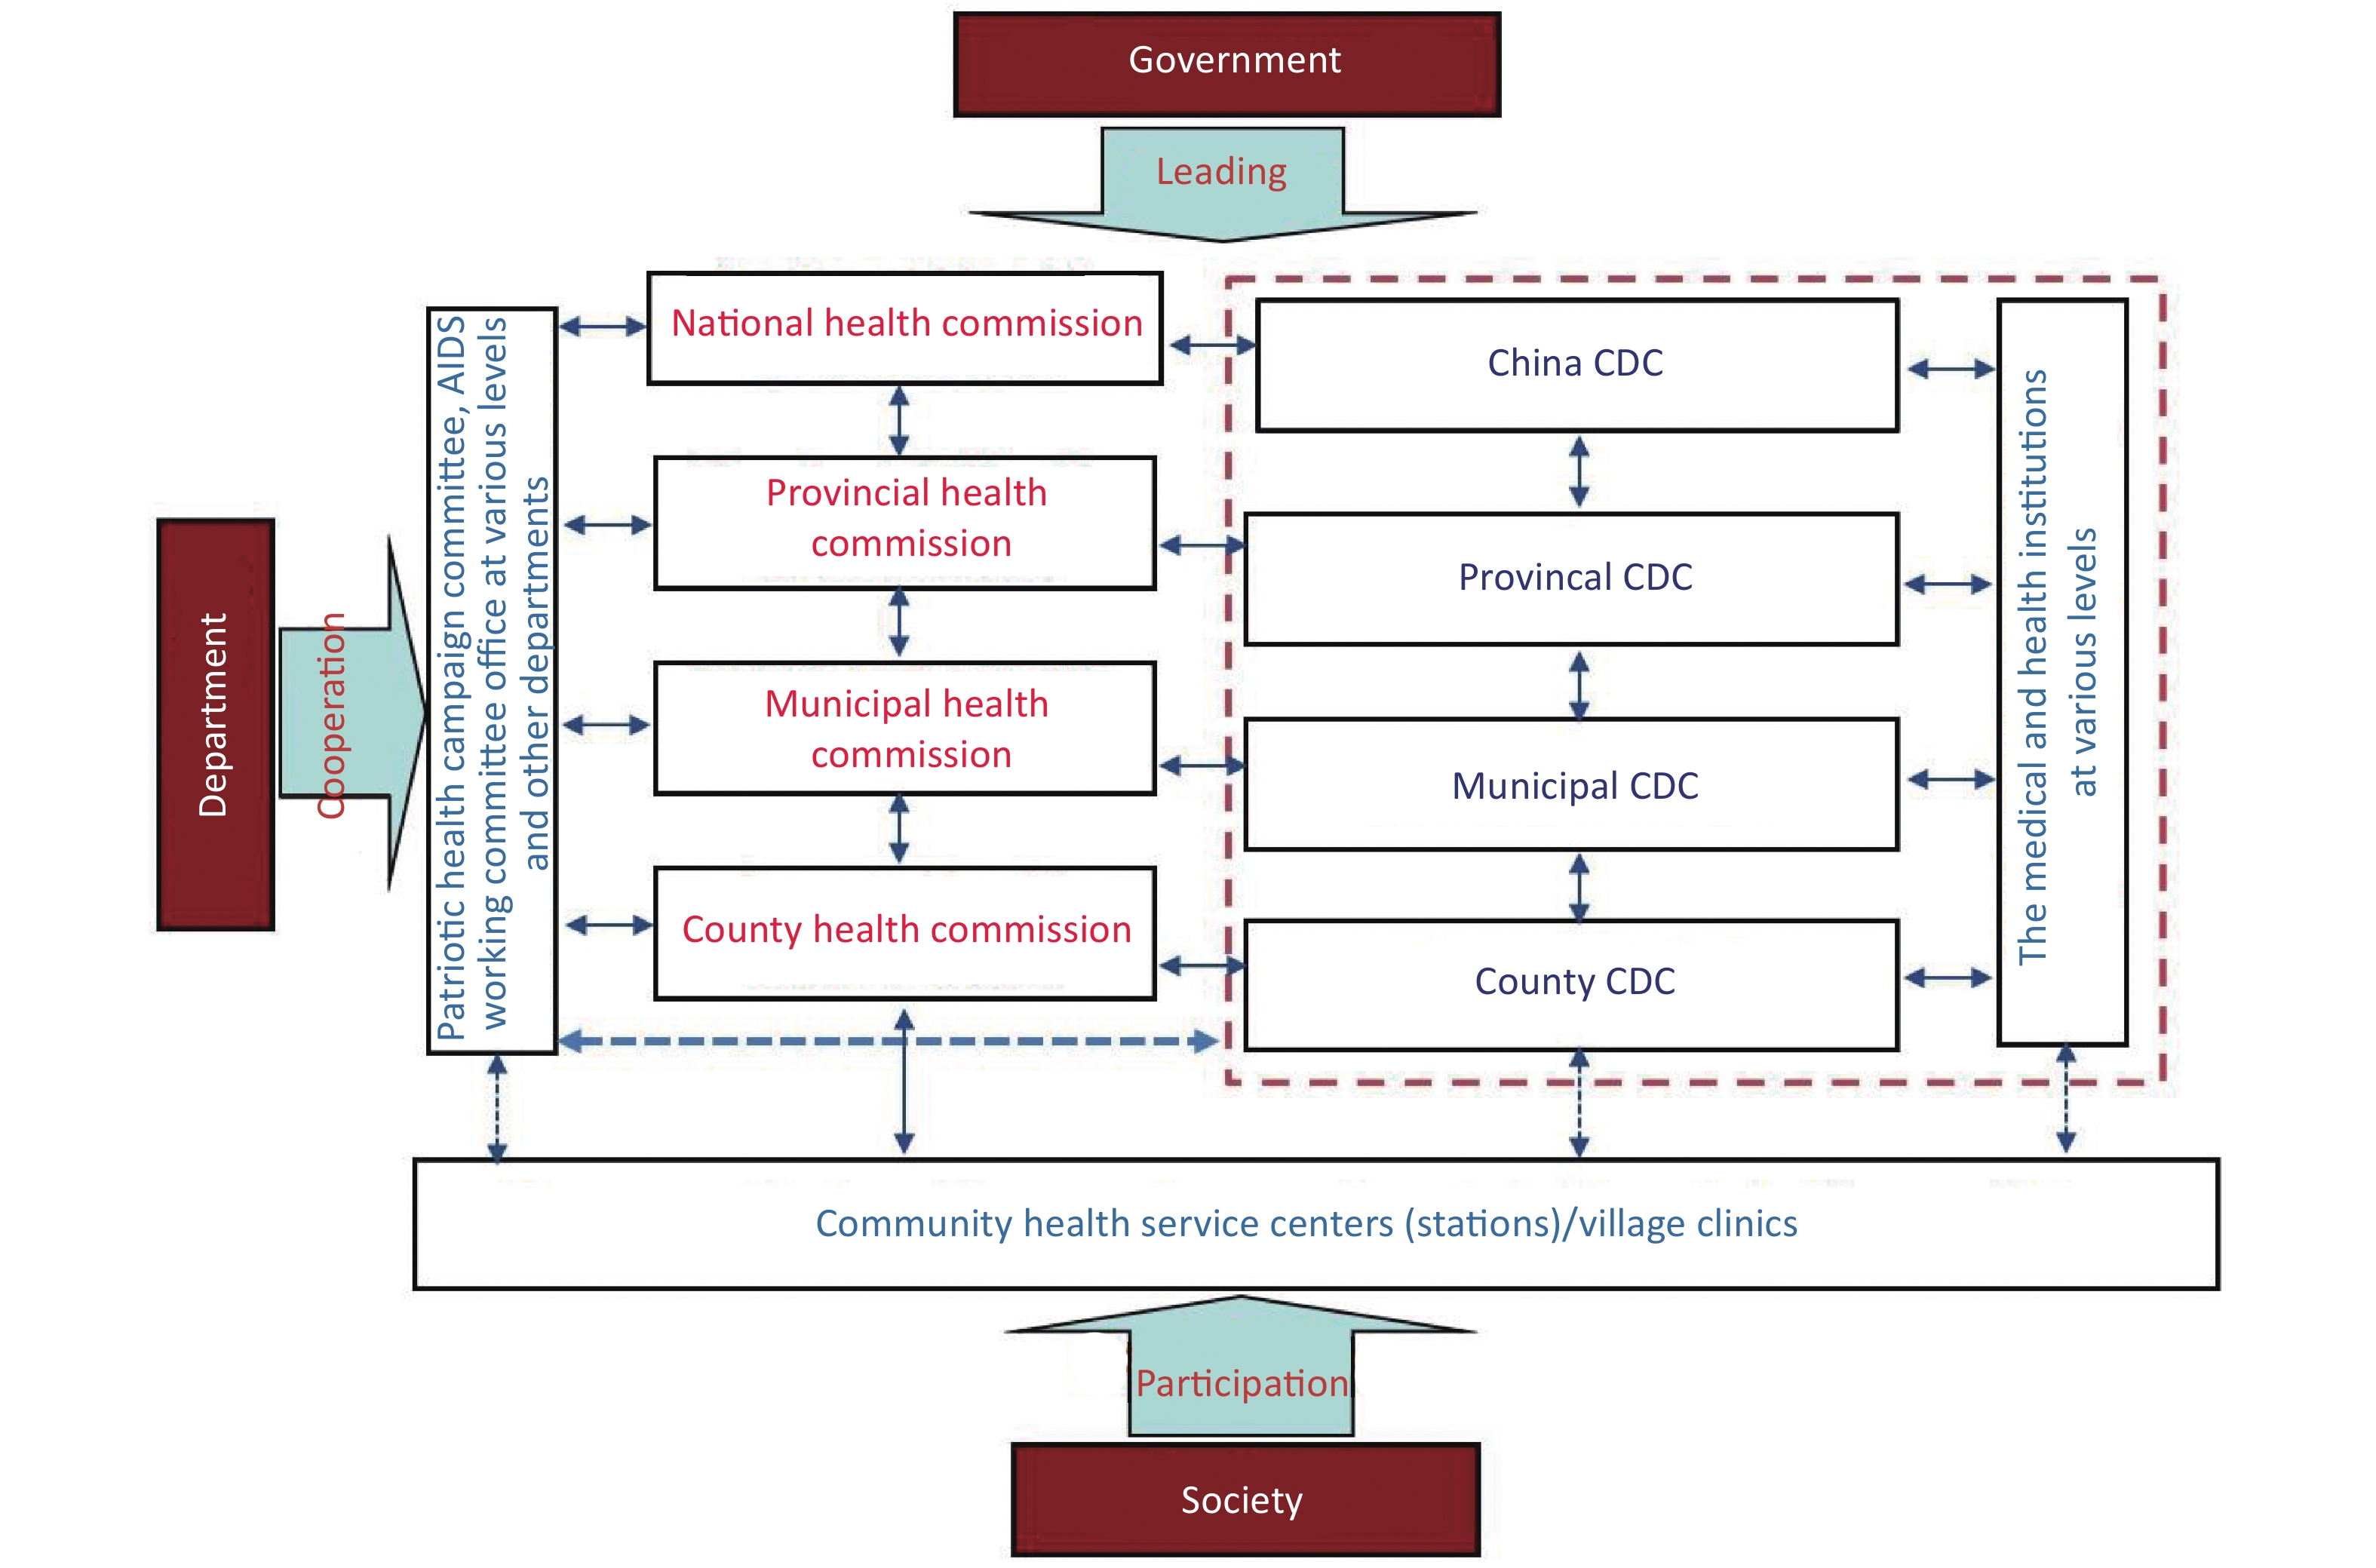
According to the document, ‘Opinions of the CPC Central Committee and the State Council on Deepening the Health Care System Reform’ in 2009[18], CDCs and professional public health agencies involved in health education, maternal and child health, mental health, emergency response, blood, health supervision, and family planning, based on primary level medical and health care networks, must work together to develop a functional public health system. As the most integral part of a highly efficient and sustainable public health system, CDCs are pyramidal in structure and have a centralized system of administration that runs from their center (the Chinese Center for Disease Control and Prevention [China CDC]), through an intermediary level (provincial CDCs), culminating at the primary level (municipal CDCs and district/county CDCs). The different levels of health commission/government have authority to enforce collaboration between corresponding health-related agencies/departments and CDCs (Figure 1). In 2017, in additon to China CDC, there were 3456 CDCs covering all counties/municipalities/provinces throughout China [1] (Table 1).
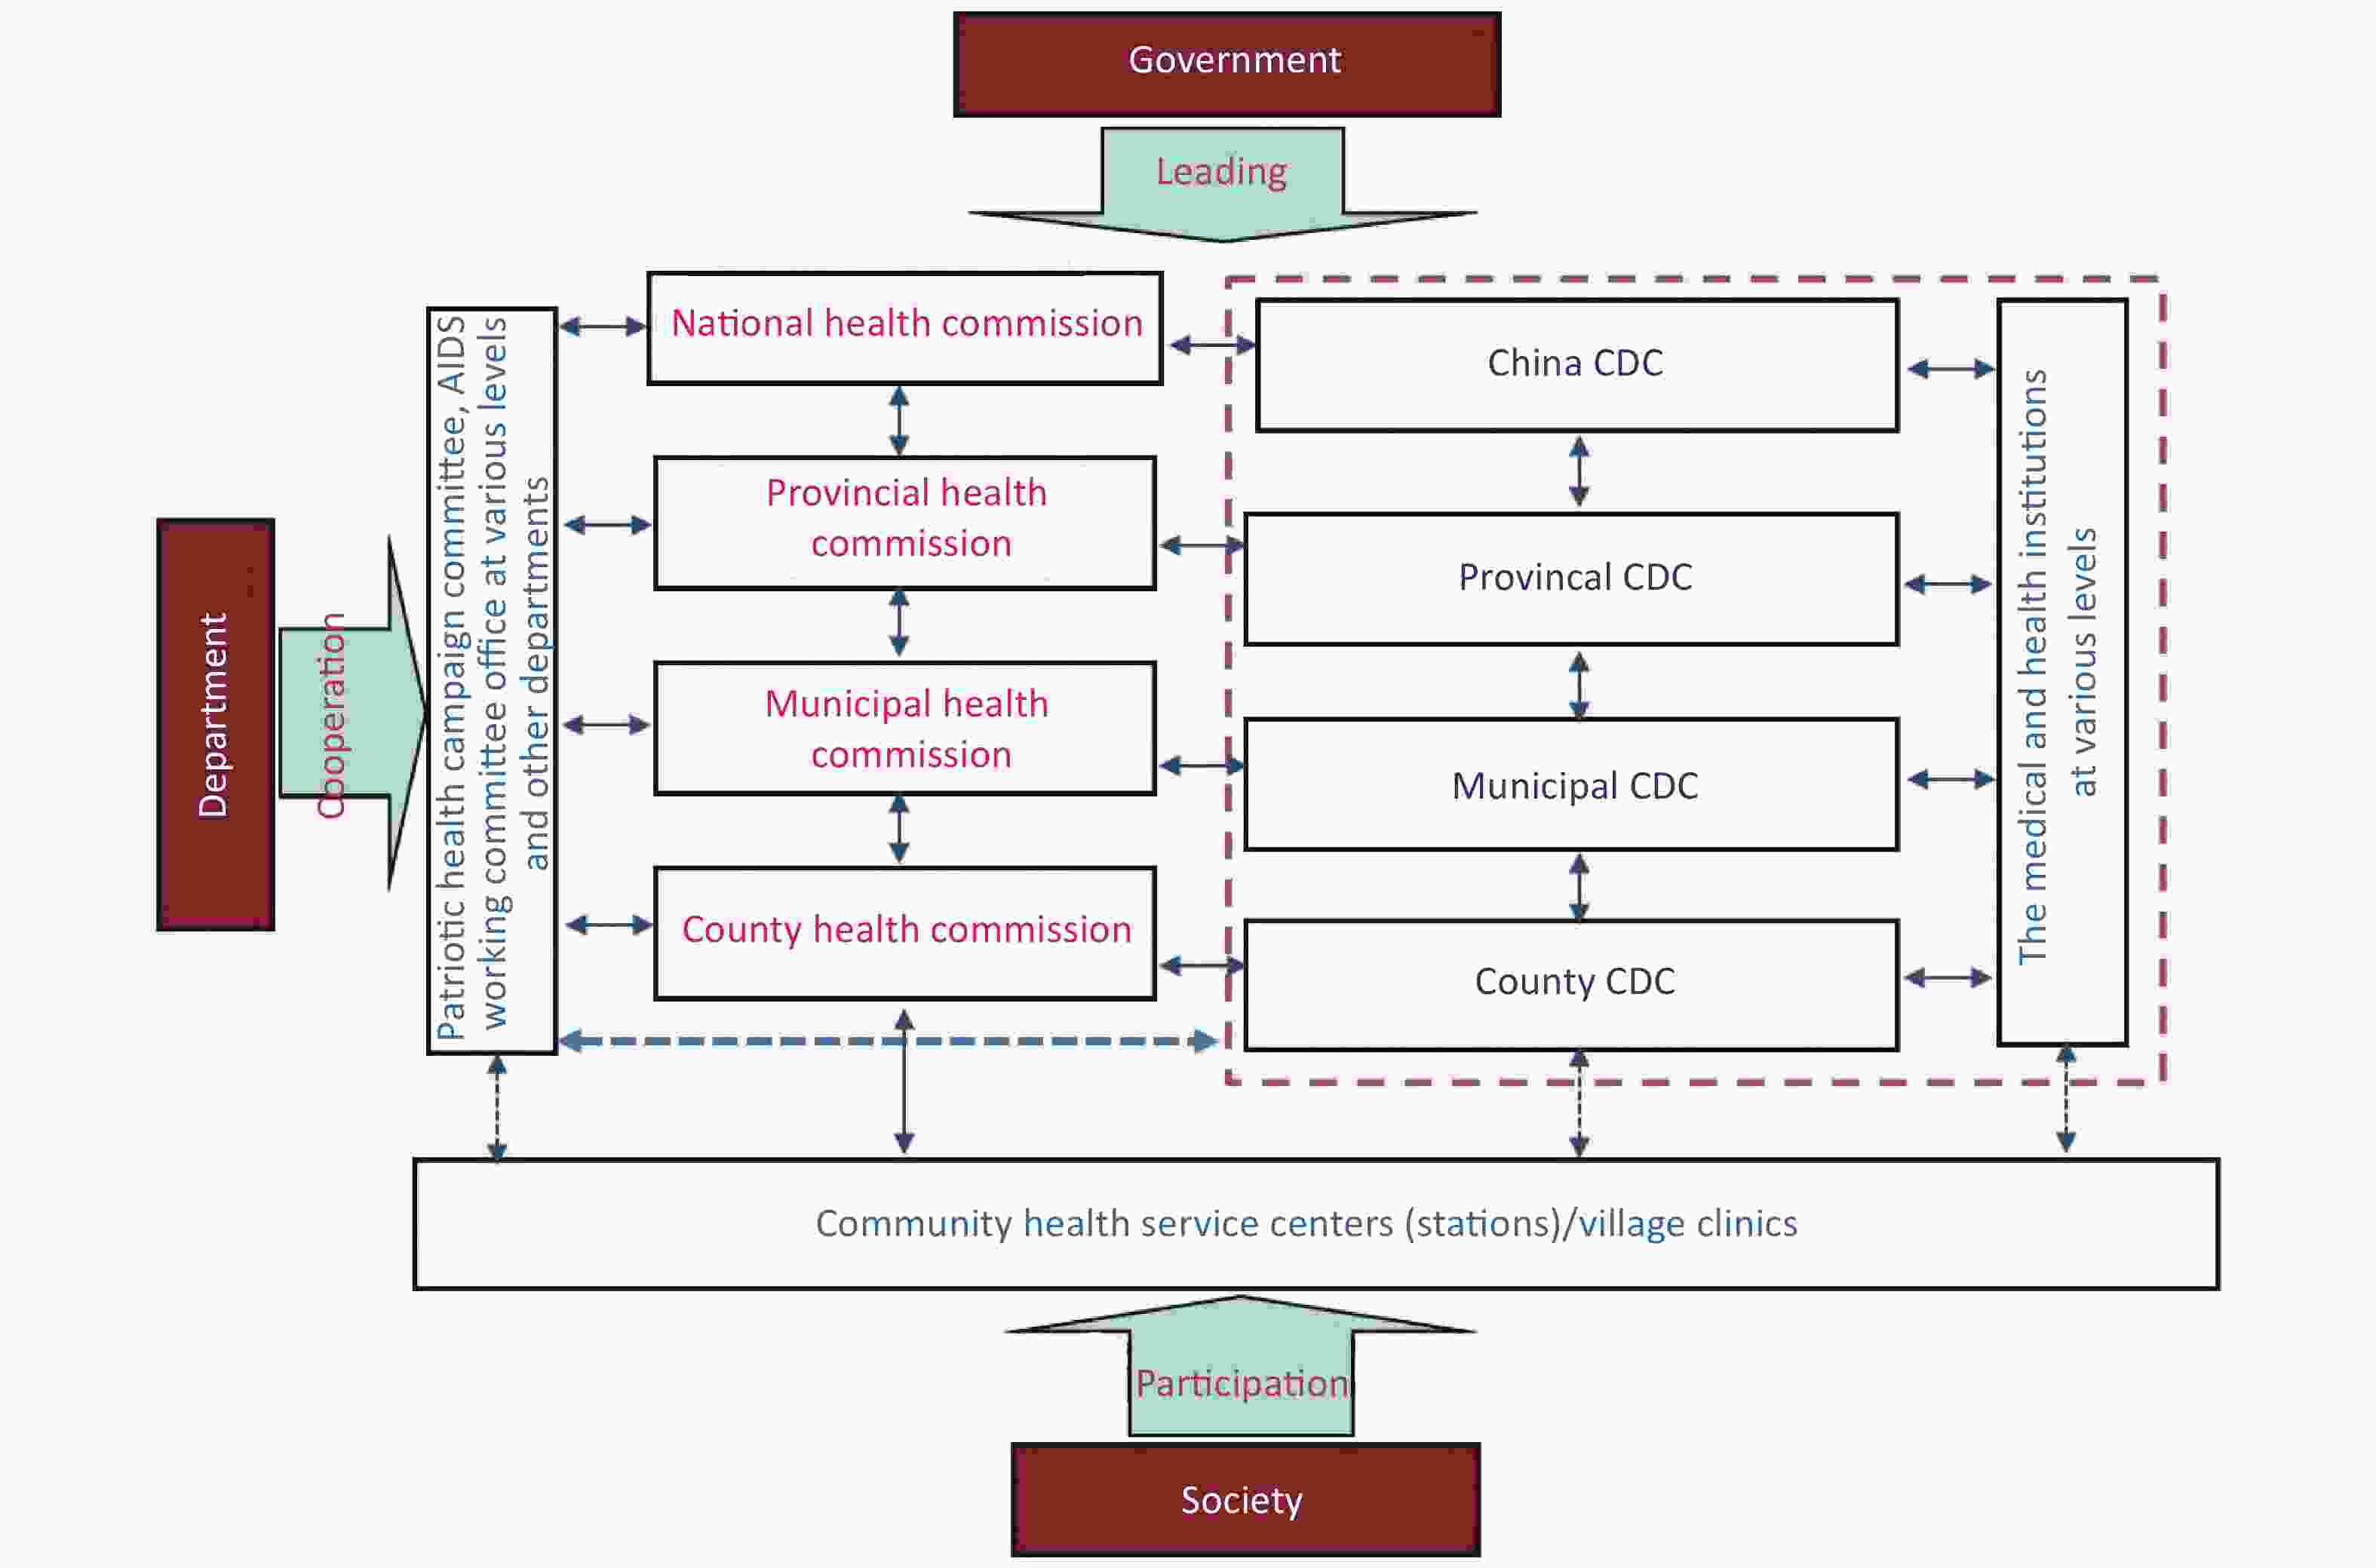
Figure 1. Work flow and structure of the CDC system in China
Level of CDCs Number of CDCs Public health workforce size CDCs health workers Provincial 31 11,129 7,801 Municipal/city 411 42,654 32,237 County-level city 1,220 60,429 44,982 County 1,553 69,501 51,795 Othersb 241 7,017 5,299 Total 3,456 190,730 142,114 Note. aThe latest data are from the 2018 CHSY, providing information from the previous year; bThe category of ‘others’ includes CDCs owned by railway, agriculture, and reclamation, or other systems. Table 1. Numbers of CDCs and size of workforce, 2017a
-
By type of work performed, there were four public health workforce categories[1]: (i) health workers; (ii) other technicians; (iii) management staff; and (iv) logistics staff. They are defined as follows:
Health workers: doctor or assistant doctor, nurse, pharmacist, laboratory technician, and other technical staff in CDCs (of which 81.8% are licensed staff who pass a licensing examination or are registered at a county or higher level health authority) — representing 74.5% of the total workforce.
Other technicians: professionals who engage in engineering, economics, information technology, editors, and other non health-related workers in the CDCs — representing 7.7% of the total.
Management staff: individuals responsible for managing or administering staff and systems to enhance the quality and efficiency in CDCs — representing 7.3% of the total.
Logistics staff: individuals who provide logistics support and services — representing 10.5% of the total.
Employees of immunization clinics, specialized preventive institutions, and women and child care agencies were not included in the study.
-
The density of the public health workforce of CDCs was measured by the combined number of public health workers per 10,000 population, defined as
$$ {\text{D}} ={\text{h} _{\text{i}}}{\rm{/}}{{\text{p} }_{\text{i} }} $$ Where hi refers to the number of public health workers in province i, and pi refers to the total population of province i.
-
According to the traditional administrative district definition by the National Bureau of Statistics, China is stratified into three distinct regions (East, Central and West), excluding Hong Kong, Macao, and Taiwan[1]. The East includes 11 provinces or directly-controlled cities: Beijing, Tianjin, Hebei, Liaoning, Shanghai, Jiangsu, Zhejiang, Fujian, Shandong, Guangdong, and Hainan; Central China includes eight provinces: Shanxi, Jilin, Heilongjiang, Anhui, Jiangxi, Henan, Hubei, and Hunan; and the West covers 12 provinces, autonomous regions, or directly-controlled cities: Inner Mongolia, Chongqing, Guangxi, Sichuan, Guizhou, Yunnan, Tibet, Shaanxi, Gansu, Qinghai, Ningxia, and Xinjiang.
-
We used three indices to measure inequality of density of the CDCs public health workforce: the Gini coefficient, Theil L, and Theil T[19]. The Gini index is widely used to measure aggregate level of inequality and ranges between 0 and 1, with higher values indicating higher levels of inequality. A Gini coefficient < 0.2 is considered absolute equality, 0.2–0.3 is considered proper inequality, 0.4–0.5 is considered large inequality, and > 0.5 is considered severe inequality. The Theil index is a relative indicator, with no universal assessment standard, that shows contributions within subgroups and between subgroups on the basis of a calculated contribution rate. Values range from 0 to 1, with higher values indicating lower levels of inequality.
-
Spatial autocorrelation uses variable values and their spatial locations, and reflects the degree of spatial dependence between random variable values in geographic terms. The global Moran’s I method has been widely used to reflect the degree of spatial autocorrelation of variables and to estimate spatial agglomeration and divergence distributions[20]. It is defined by the equation:
$$ I=\frac{N{\sum }_{i}{\sum }_{j}{W}_{ij}({X}_{i}-\stackrel{-}{X})({X}_{j}-\stackrel{-}{X})}{{\left({\sum }_{i}{\sum }_{j}{W}_{ij}\right){\sum }_{i}({X}_{i}-\stackrel{-}{X})}^{\text{2}}} $$ where N is the total number of provinces in the study area; Xi and Xj are the public health workforce indices of the ith and jth provincial units;
$ \stackrel{-}{X} $ is the mean of the variable and Wij is the spatial weight matrix. The global Moran’s I value range is [–1,1]. Positive values indicate spatial agglomeration; negative values indicate spatial divergence.We used local spatial autocorrelation to explore distributions of provinces. A Moran scatterplot can be divided into four quadrants: the first quadrant is high value and high value (H–H), which indicates a province that has a high workforce density that is adjacent to a province with a high workforce density; the second quadrant is low value and high value (L–H), indicating a province with a low workforce density adjacent to a province with a high workforce density; the third quadrant is low value and low value (L–L), indicating low density in two adjacent provinces; and the fourth quadrant is high value and low value (H–L), indicating a province with a high density neighboring a province with low workforce density. H–H and L–L quadrants show spatial clusters, while H–L and L–H quadrants are regarded as spatial outliers.
-
The inequality indices were computed using Excel 2007. GeoDa 1.14.0 was used to produce a LISA map for identifying spatial clusters and outliers and for calculating the global Moran’s I and local Moran’s I. Spatial weights were analyzed by the neighboring weights method. The first order queen contiguity was selected as the rule for spatial weights, and Hainan province was considered to be connected with Guangdong province. The density distribution was mapped by ArcGIS 10 (Esri Inc., Redlands, CA, USA)
-
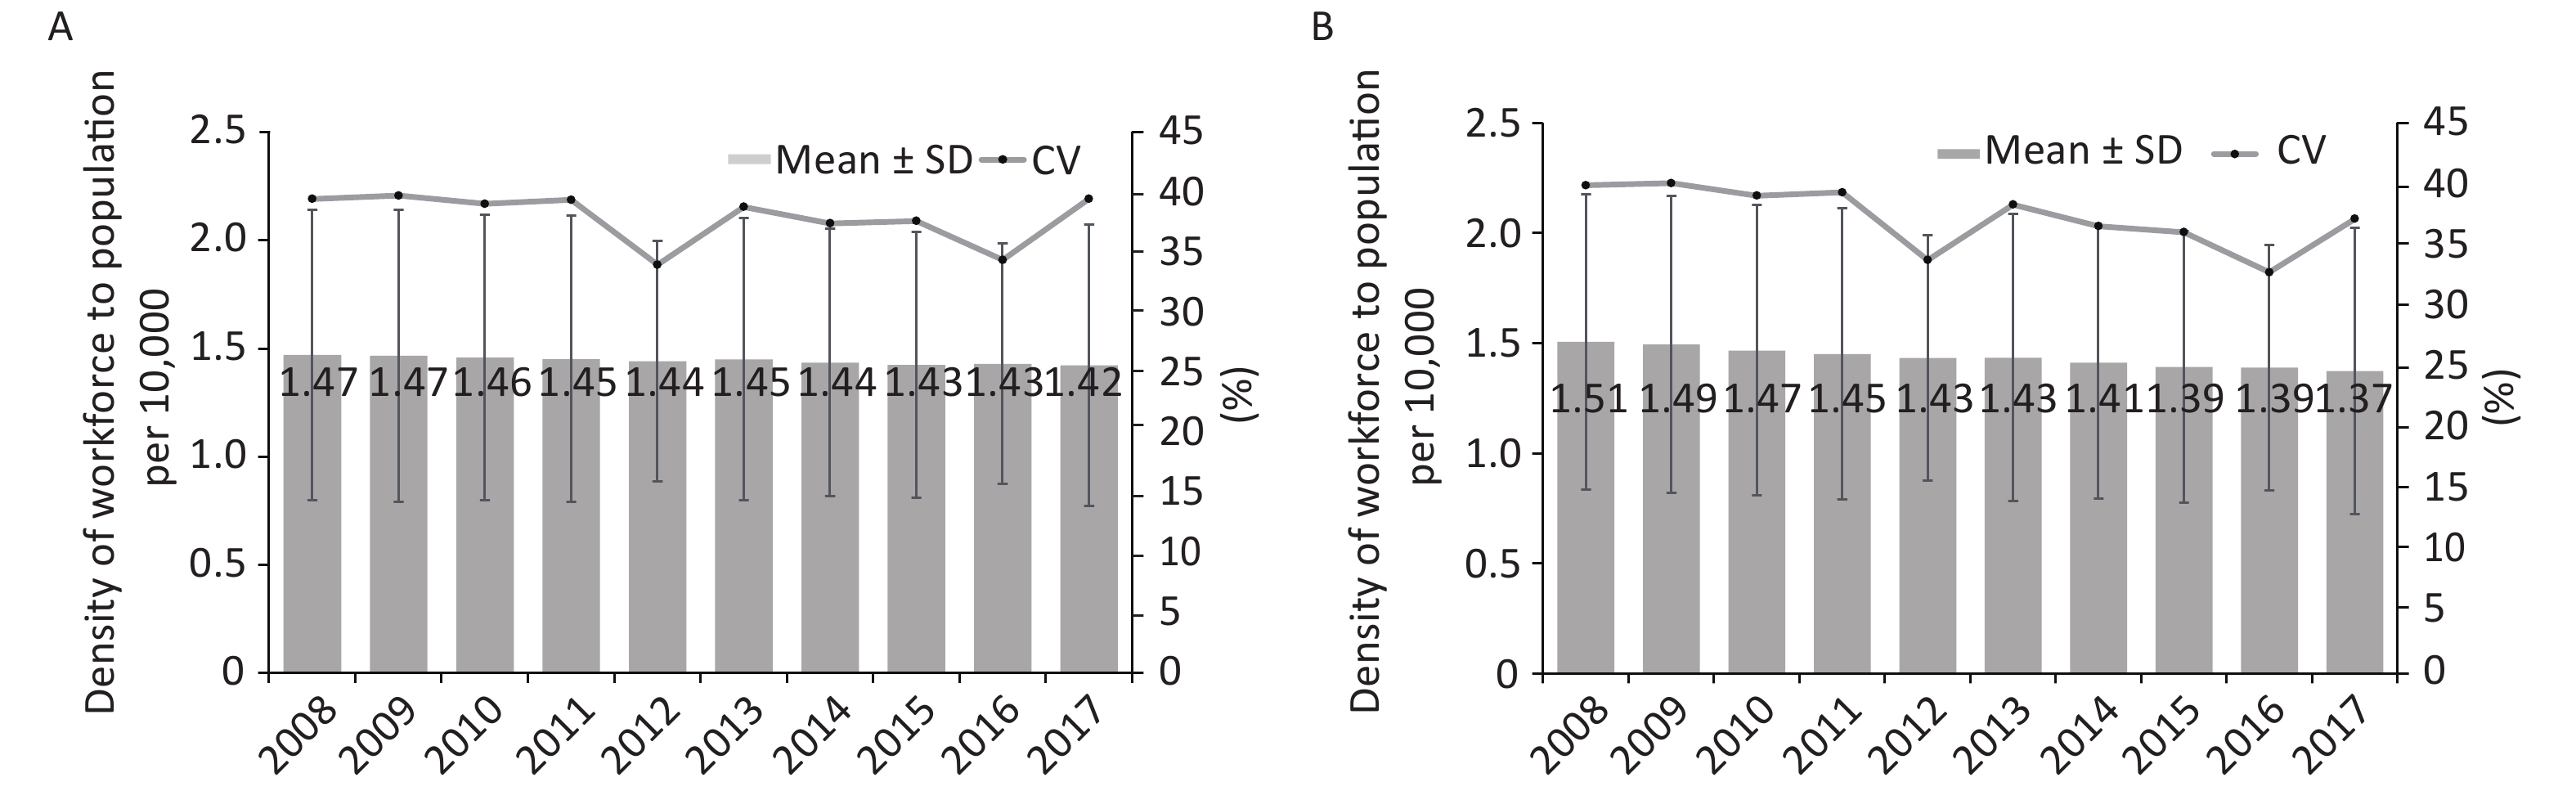
The public health workforce density decreased year by year. The aggregate ratio of workforce to population decreased from 1.47 to 1.42 per 10,000 from 2008 to 2017, consistently lower than the NHC’s recommended critical shortage threshold of 1.75 per 10,000. The standard deviation (SD) of the ratio varied between 0.56 and 0.67, while the coefficient of variation (CV) ranged from 34% to 40% during the ten years (Figure 2A). When the population refers to the population of the corresponding year, the aggregate density decreased more sharply than when calculated using 2010 as the year of reference (Figure 2B).
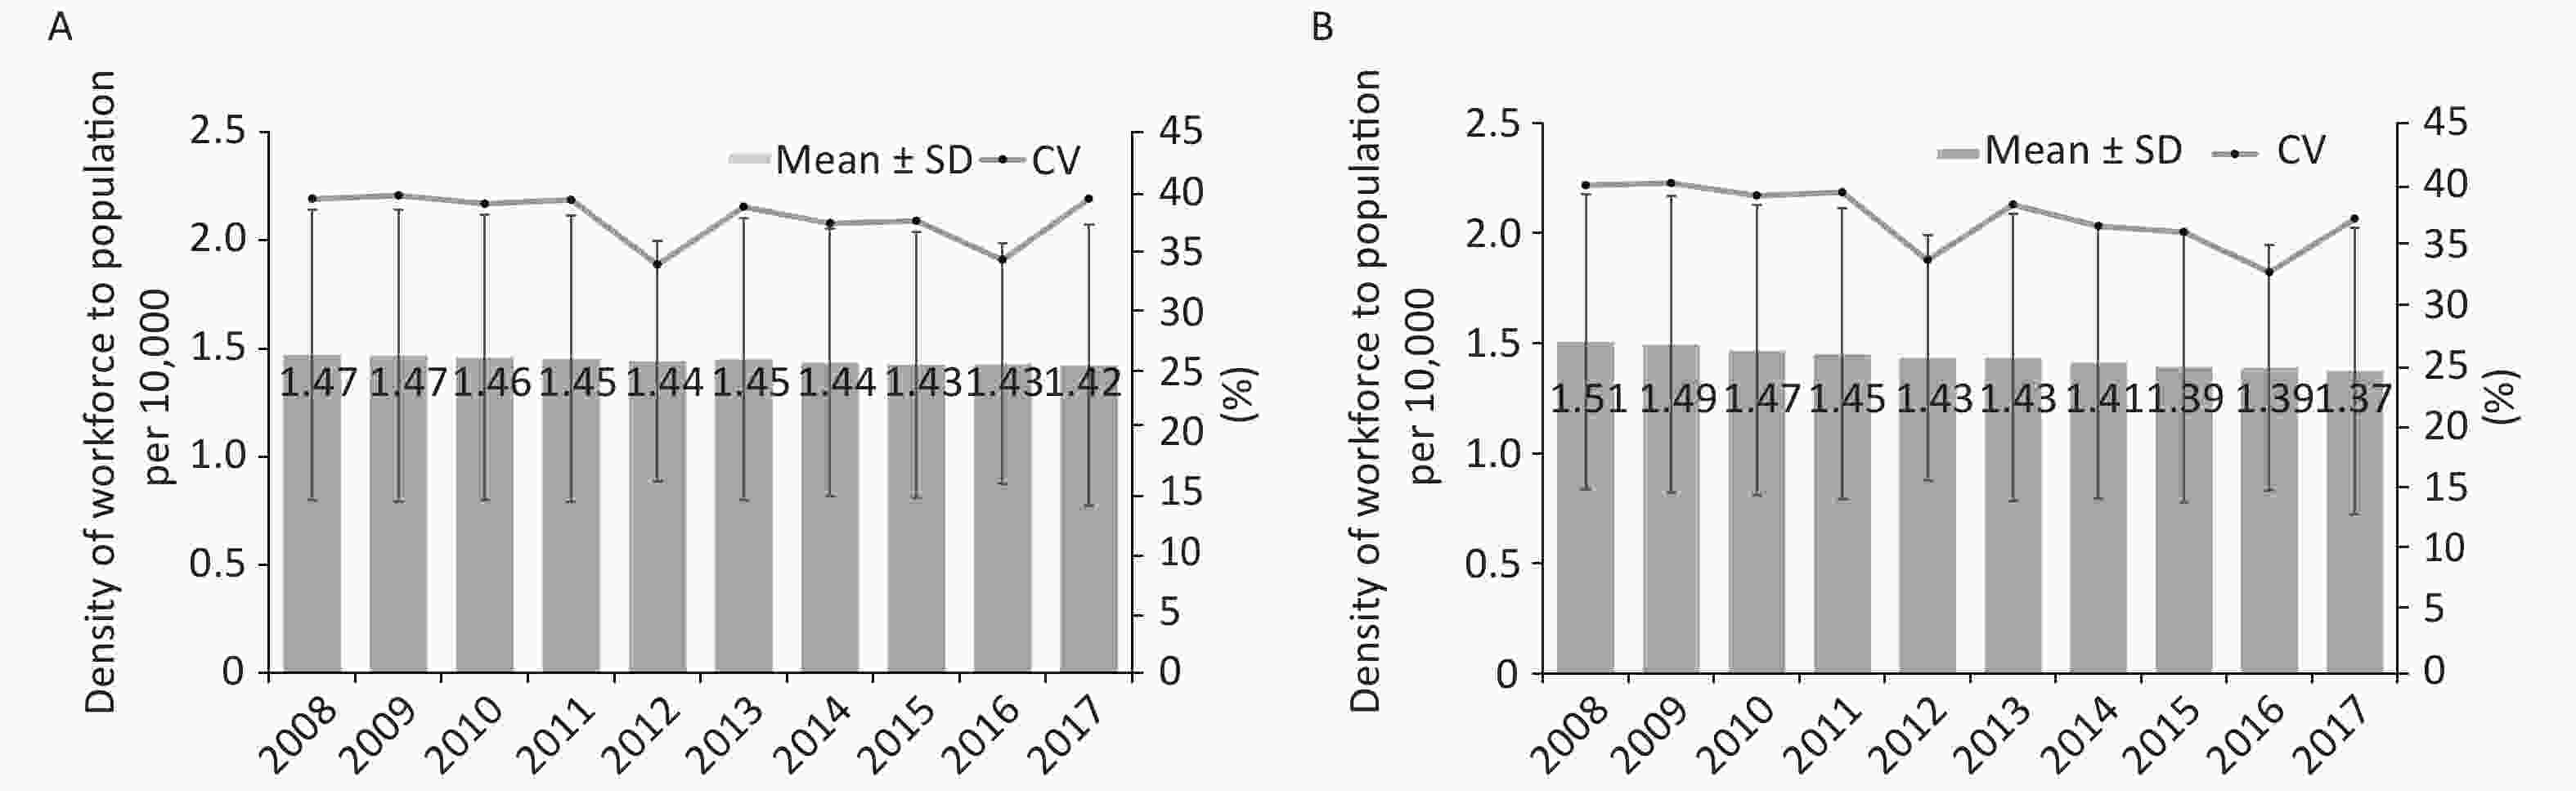
Figure 2. Mean, SD, and coefficient for density of public health workforce to population per 10,000, 2008–2017. (A) The population refers specifically to 2010. ‘The guidelines for the establishment standards for CDCs’ issued by the Chinese government in 2014, require that the population of the 6th national population census in 2010 is taken as the reference year. (B) The population refers to the corresponding year.
-
Table 2 summarizes the three inequality measures of the public health workforce distribution in each of the three regions — East, Central, and West. Based on regional population sizes and available public health personnel, inequality in each category was higher in the West than the East and Central regions. Gini coefficients ranged from 0.147 to 0.165 nationwide, and ranged from 0.087 to 0.135 in East China, 0.127 to 0.144 in Central China, and 0.113 to 0.186 in West China during 2008 to 2017. Theil L and Theil T inequalities were almost twice as high in the West than in the East. The density of the public health workforce in West China was 1.688 per 10,000 population compared with 1.146 in East China, and 1.404 in Central China in 2017. The density range in the East was 1.146 to 1.372 per 10,000 population compared with 1.602 to 1.688 in the West.
Year Nation East region Central region West region Mean
densityGini Theil L Theil T Mean
densityGini Theil L Theil T Mean
densityGini Theil L Theil T Mean
densityGini Theil L Theil T 2008 1.507 0.165 0.019 0.019 1.372 0.135 0.013 0.014 1.582 0.143 0.016 0.015 1.613 0.186 0.025 0.027 2009 1.494 0.163 0.018 0.019 1.354 0.125 0.012 0.012 1.575 0.144 0.016 0.015 1.602 0.185 0.025 0.027 2010 1.467 0.161 0.018 0.019 1.277 0.118 0.010 0.011 1.565 0.140 0.015 0.014 1.641 0.177 0.023 0.024 2011 1.452 0.158 0.017 0.018 1.257 0.112 0.009 0.010 1.546 0.135 0.014 0.013 1.640 0.171 0.022 0.023 2012 1.433 0.155 0.017 0.017 1.230 0.109 0.009 0.009 1.514 0.135 0.015 0.013 1.650 0.153 0.018 0.018 2013 1.434 0.155 0.017 0.017 1.232 0.113 0.010 0.010 1.497 0.132 0.014 0.013 1.671 0.149 0.017 0.018 2014 1.412 0.151 0.016 0.016 1.208 0.103 0.008 0.009 1.464 0.127 0.014 0.012 1.665 0.141 0.016 0.016 2015 1.393 0.149 0.015 0.016 1.188 0.096 0.008 0.008 1.434 0.128 0.014 0.013 1.660 0.133 0.014 0.014 2016 1.389 0.147 0.015 0.015 1.180 0.092 0.007 0.008 1.421 0.129 0.014 0.013 1.671 0.117 0.012 0.012 2017 1.374 0.150 0.016 0.016 1.146 0.087 0.007 0.007 1.404 0.128 0.014 0.013 1.688 0.113 0.011 0.011 Table 2. Density and inequality measures by regional strata and year, 2008–2017
-
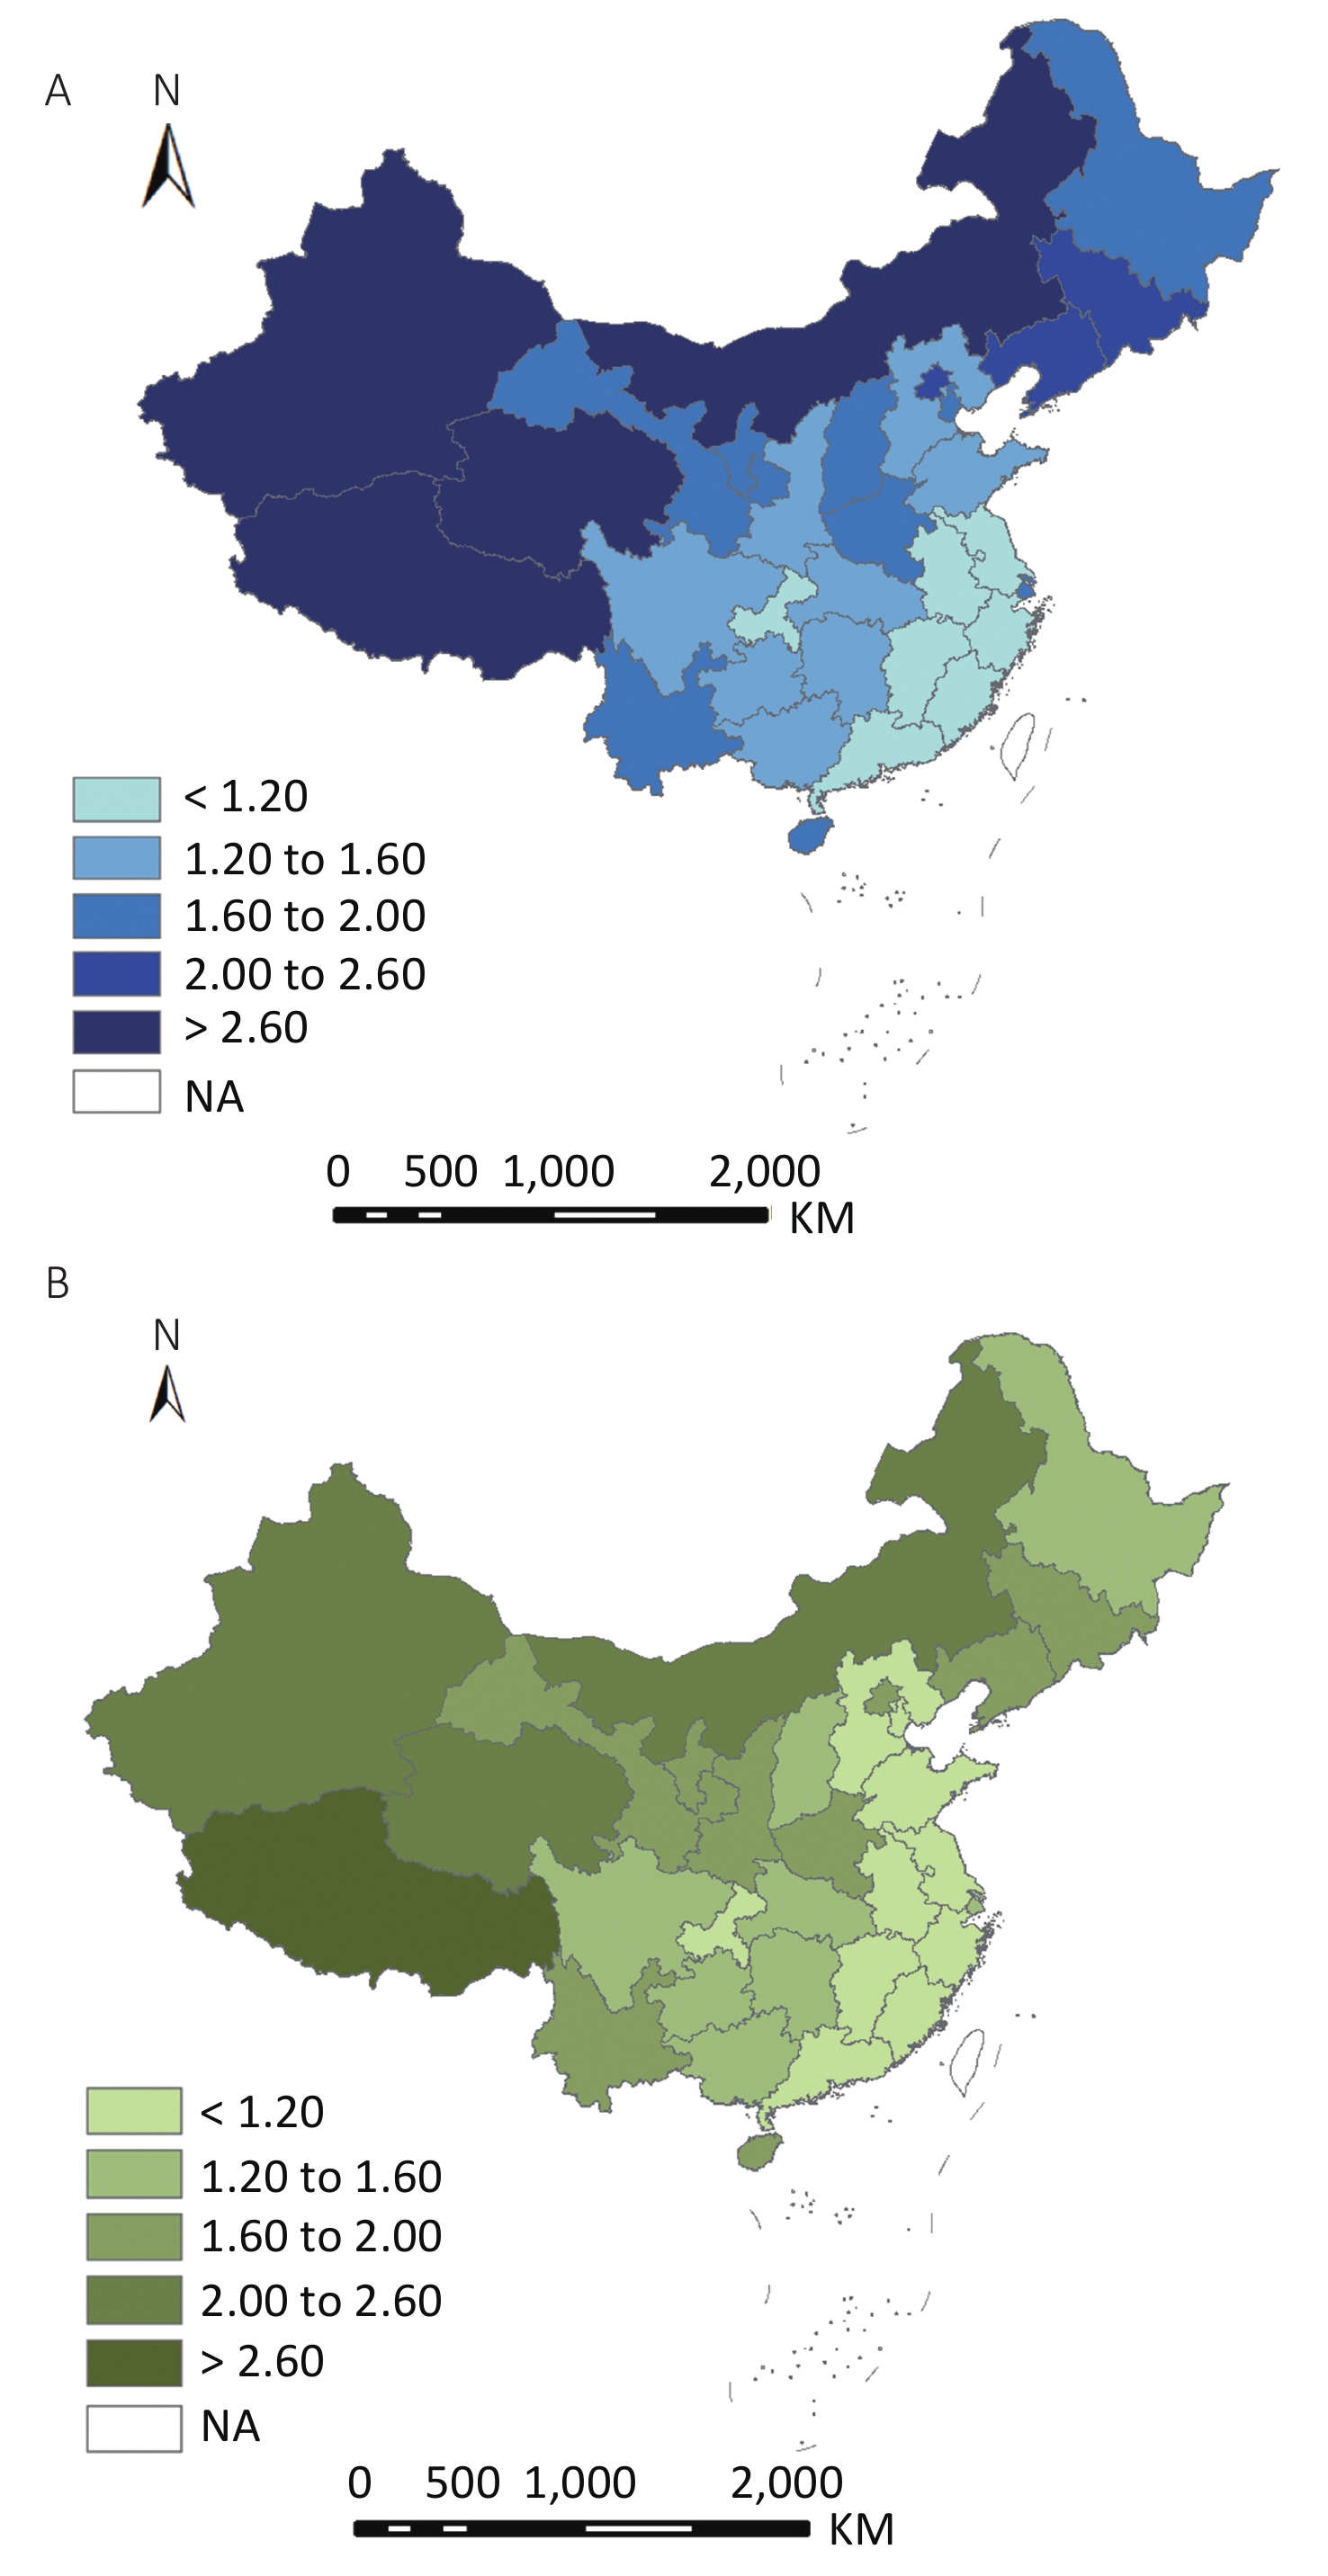
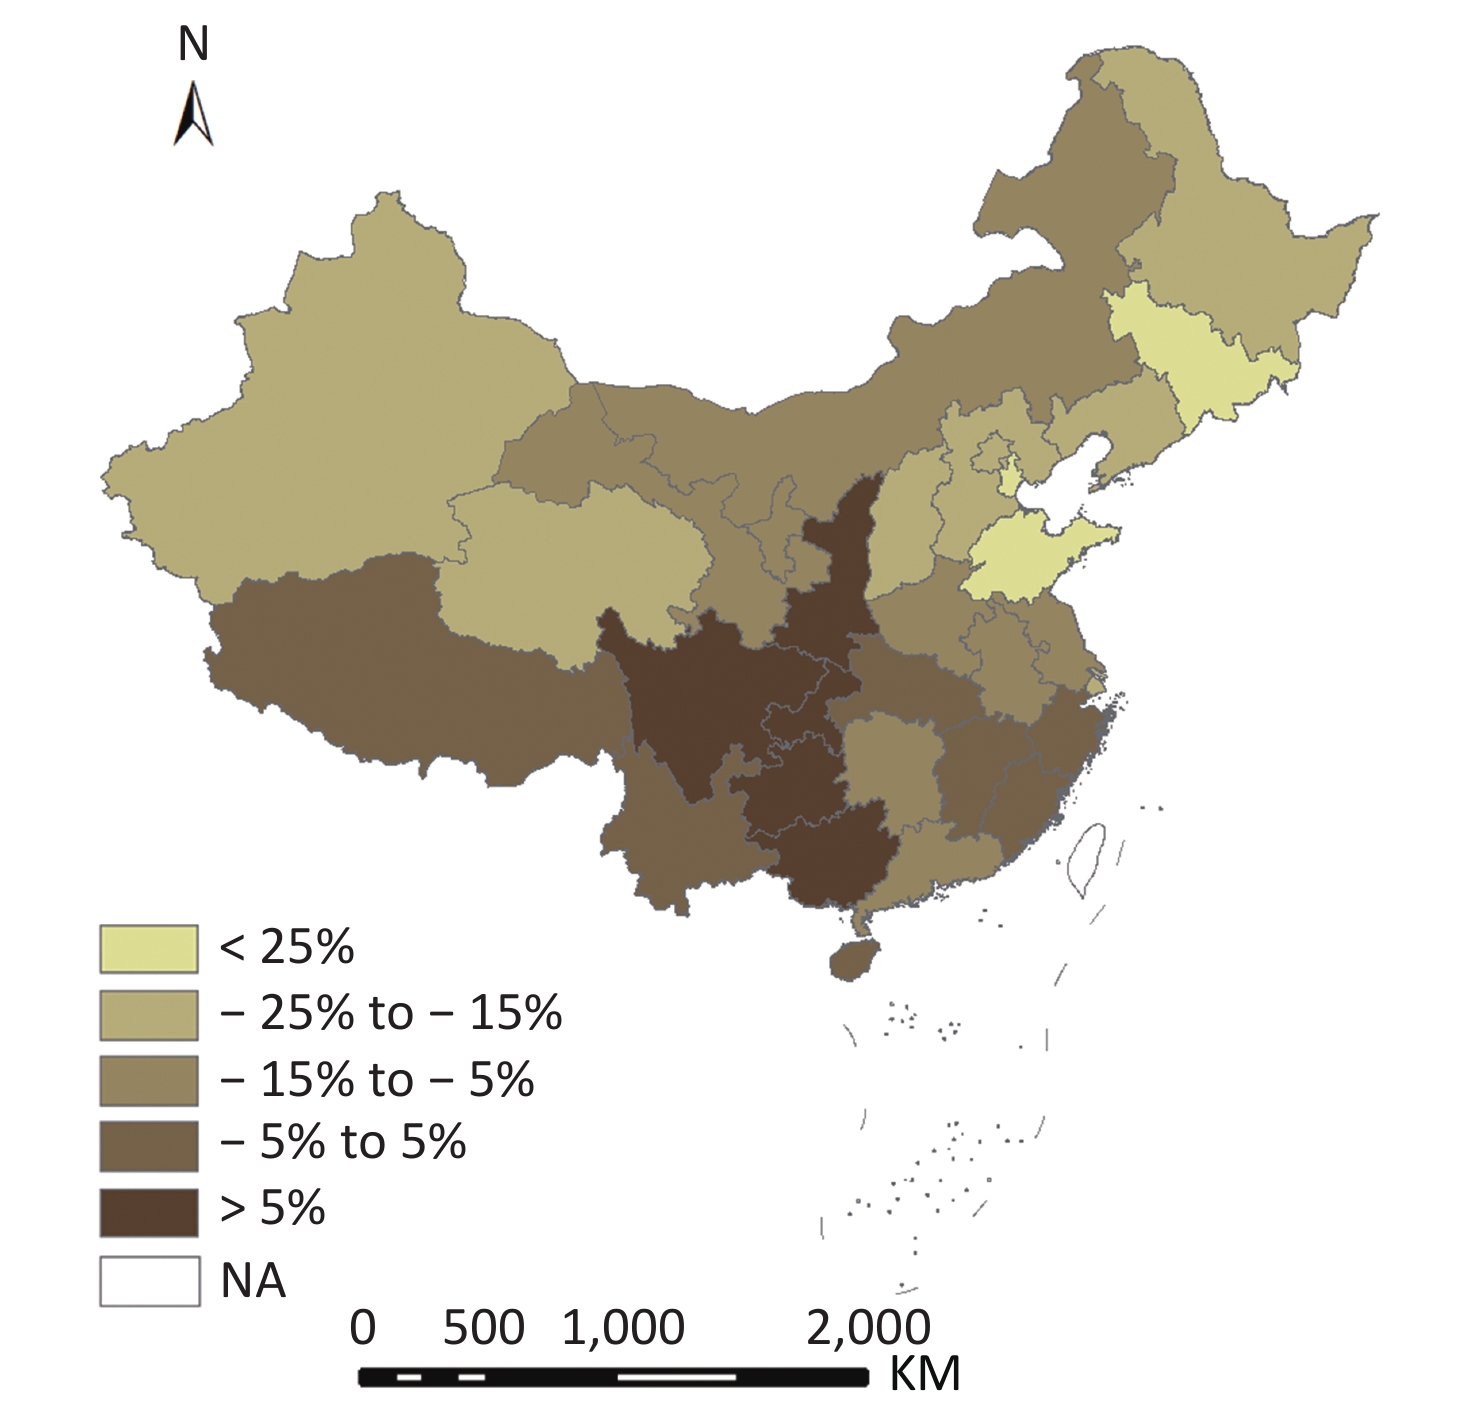
Figure 3 shows that the public health workforce density varied significantly across the 31 provinces. Density decreased from north-west to south-east in 2008 and 2017. In 2008, Tibet, Qinghai, Xinjiang, Inner Mongolia, and Jilin had the highest densities, while Chongqing, Anhui, Zhejiang, Guangdong, and Fujian had the lowest. In 2017, the western provinces of Tibet, Qinghai, Xinjiang, and Inner Mongolia had the top four densities, whereas Jilin had decreased its density from 2.39 to 1.75 per 10,000 population in the ten years. Changes in public health workforce density led to a continuous decrease in 24 provinces ranging between 1.48% and 28.26%; there were five provinces — Guangxi, Guizhou, Sichuan, Chongqing, and Shaanxi — with more than a 12% increase in public health workforce density per 10,000 population from 2008 to 2017 (Figure 4).
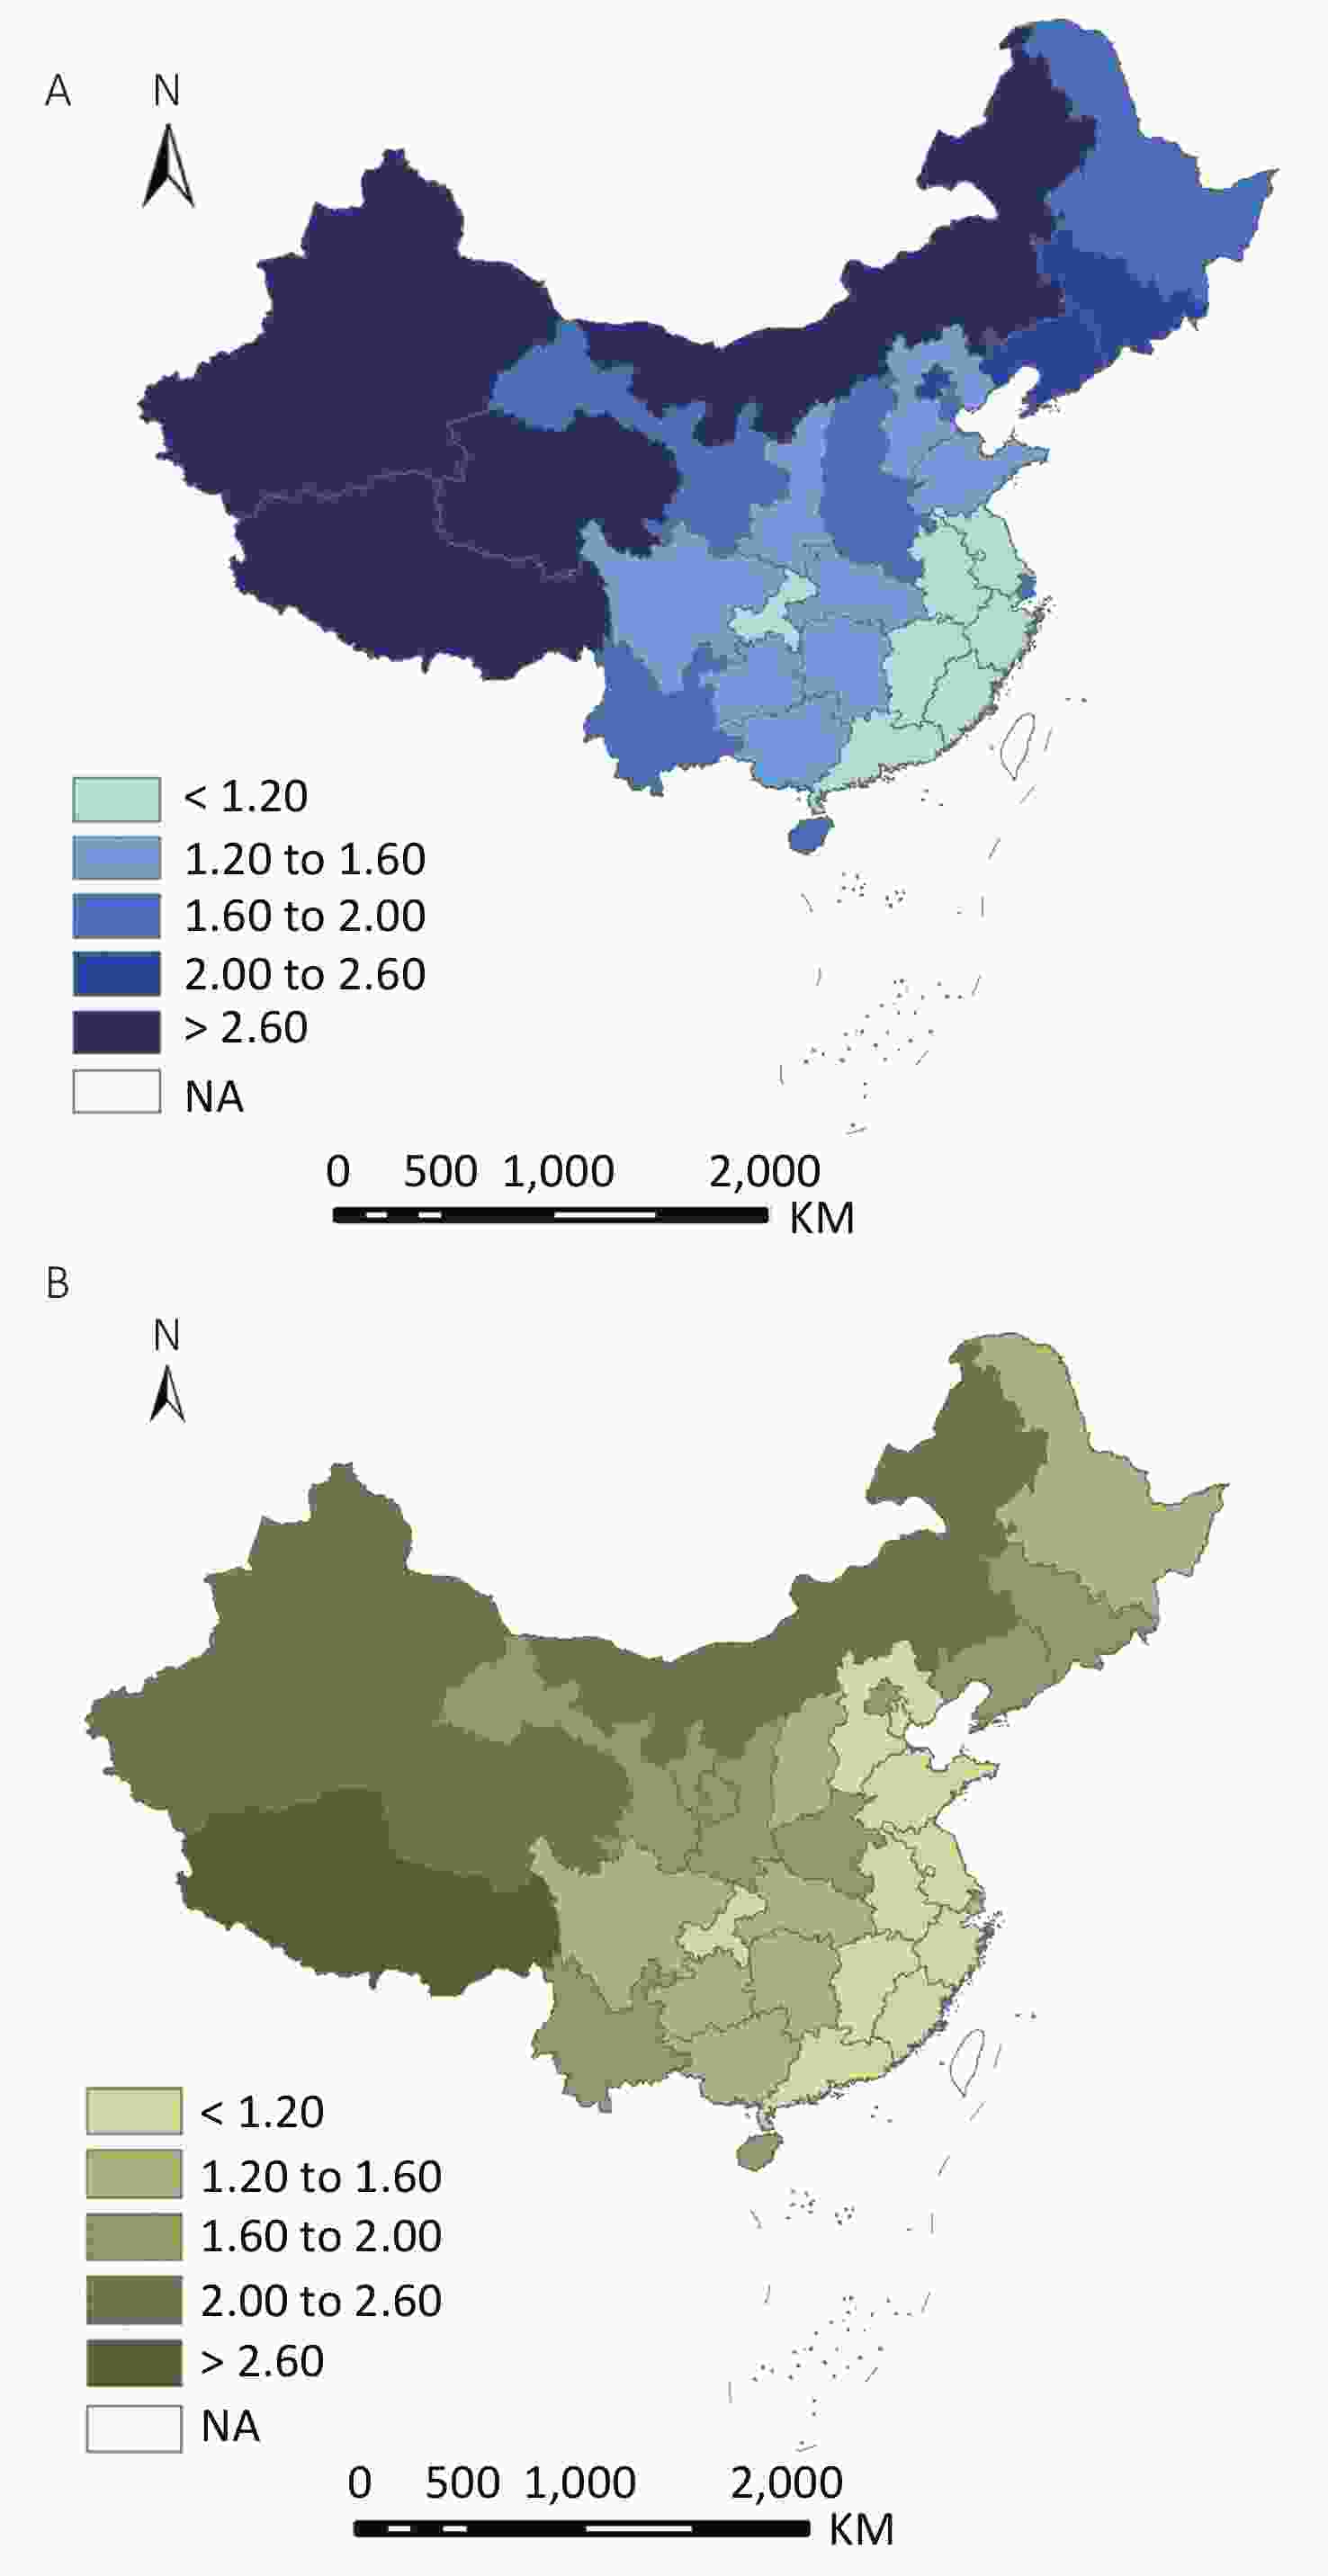
Figure 3. Geographical distribution of public health workforce density in 2008 (A) and 2017 (B).
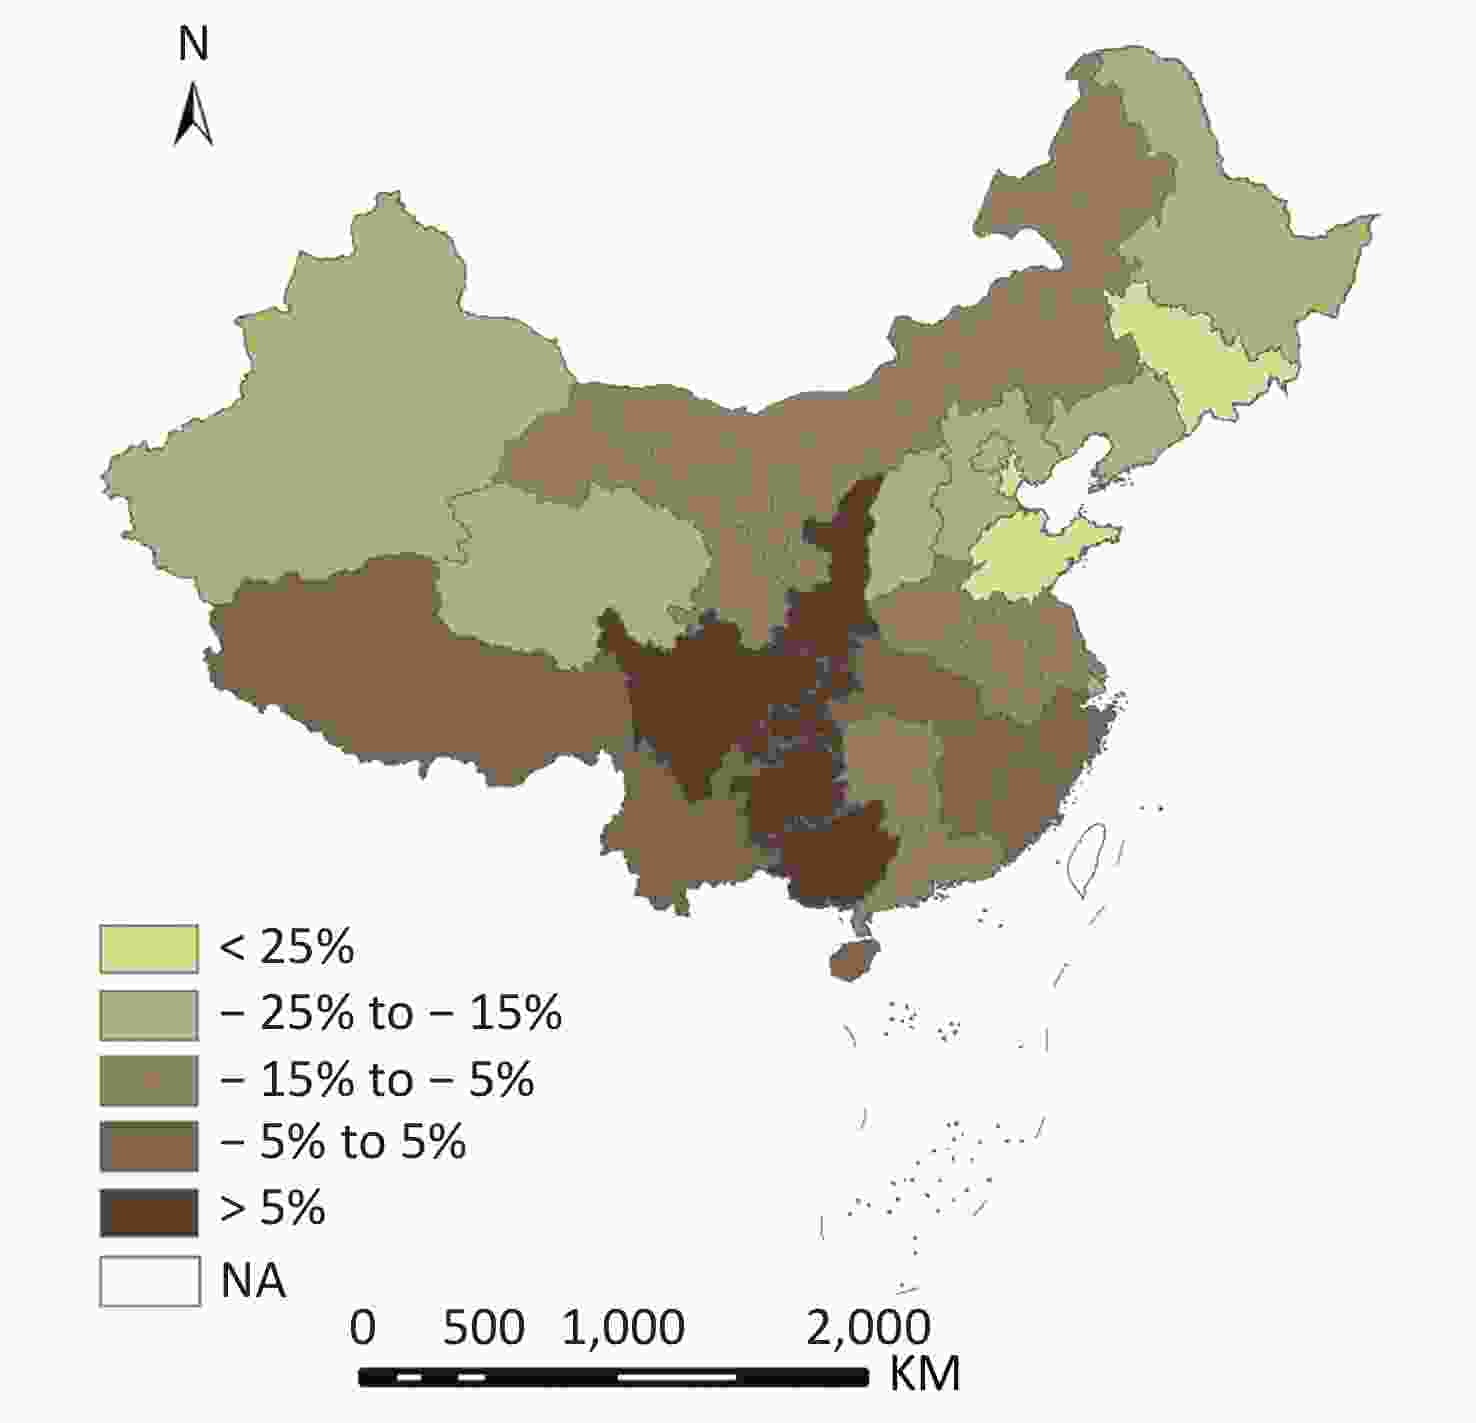
Figure 4. Changes in public health workforce density between 2008 and 2017.
-
The yearly global Moran’s I indices of the public health workforce were 0.460, 0.454, 0.485, 0.470, 0.464, 0.442, 0.422, 0.408, 0.405, and 0.415 over the period 2008–2017, showing a significant spatial autocorrelation during the study period that indicates provincial clustering of public health workforce across provinces.
The local spatial autocorrelation distribution of the public health workforce is shown in Figure 5. From 2008 to 2017, the H–H and L–L cluster provinces experienced little change. The H–H clusters were located in the western provinces, while the L–L clusters included Guangdong and Fujian. Most provinces had similar public health workforce distributions in 2008 and 2017, with the exceptions of Sichuan and Yunnan, which did not have H–H clusters in 2008 but did in 2017. This indicates that Sichuan and Yunnan had a relatively higher level of improvement in workforce density compared to neighboring provinces during the study period.
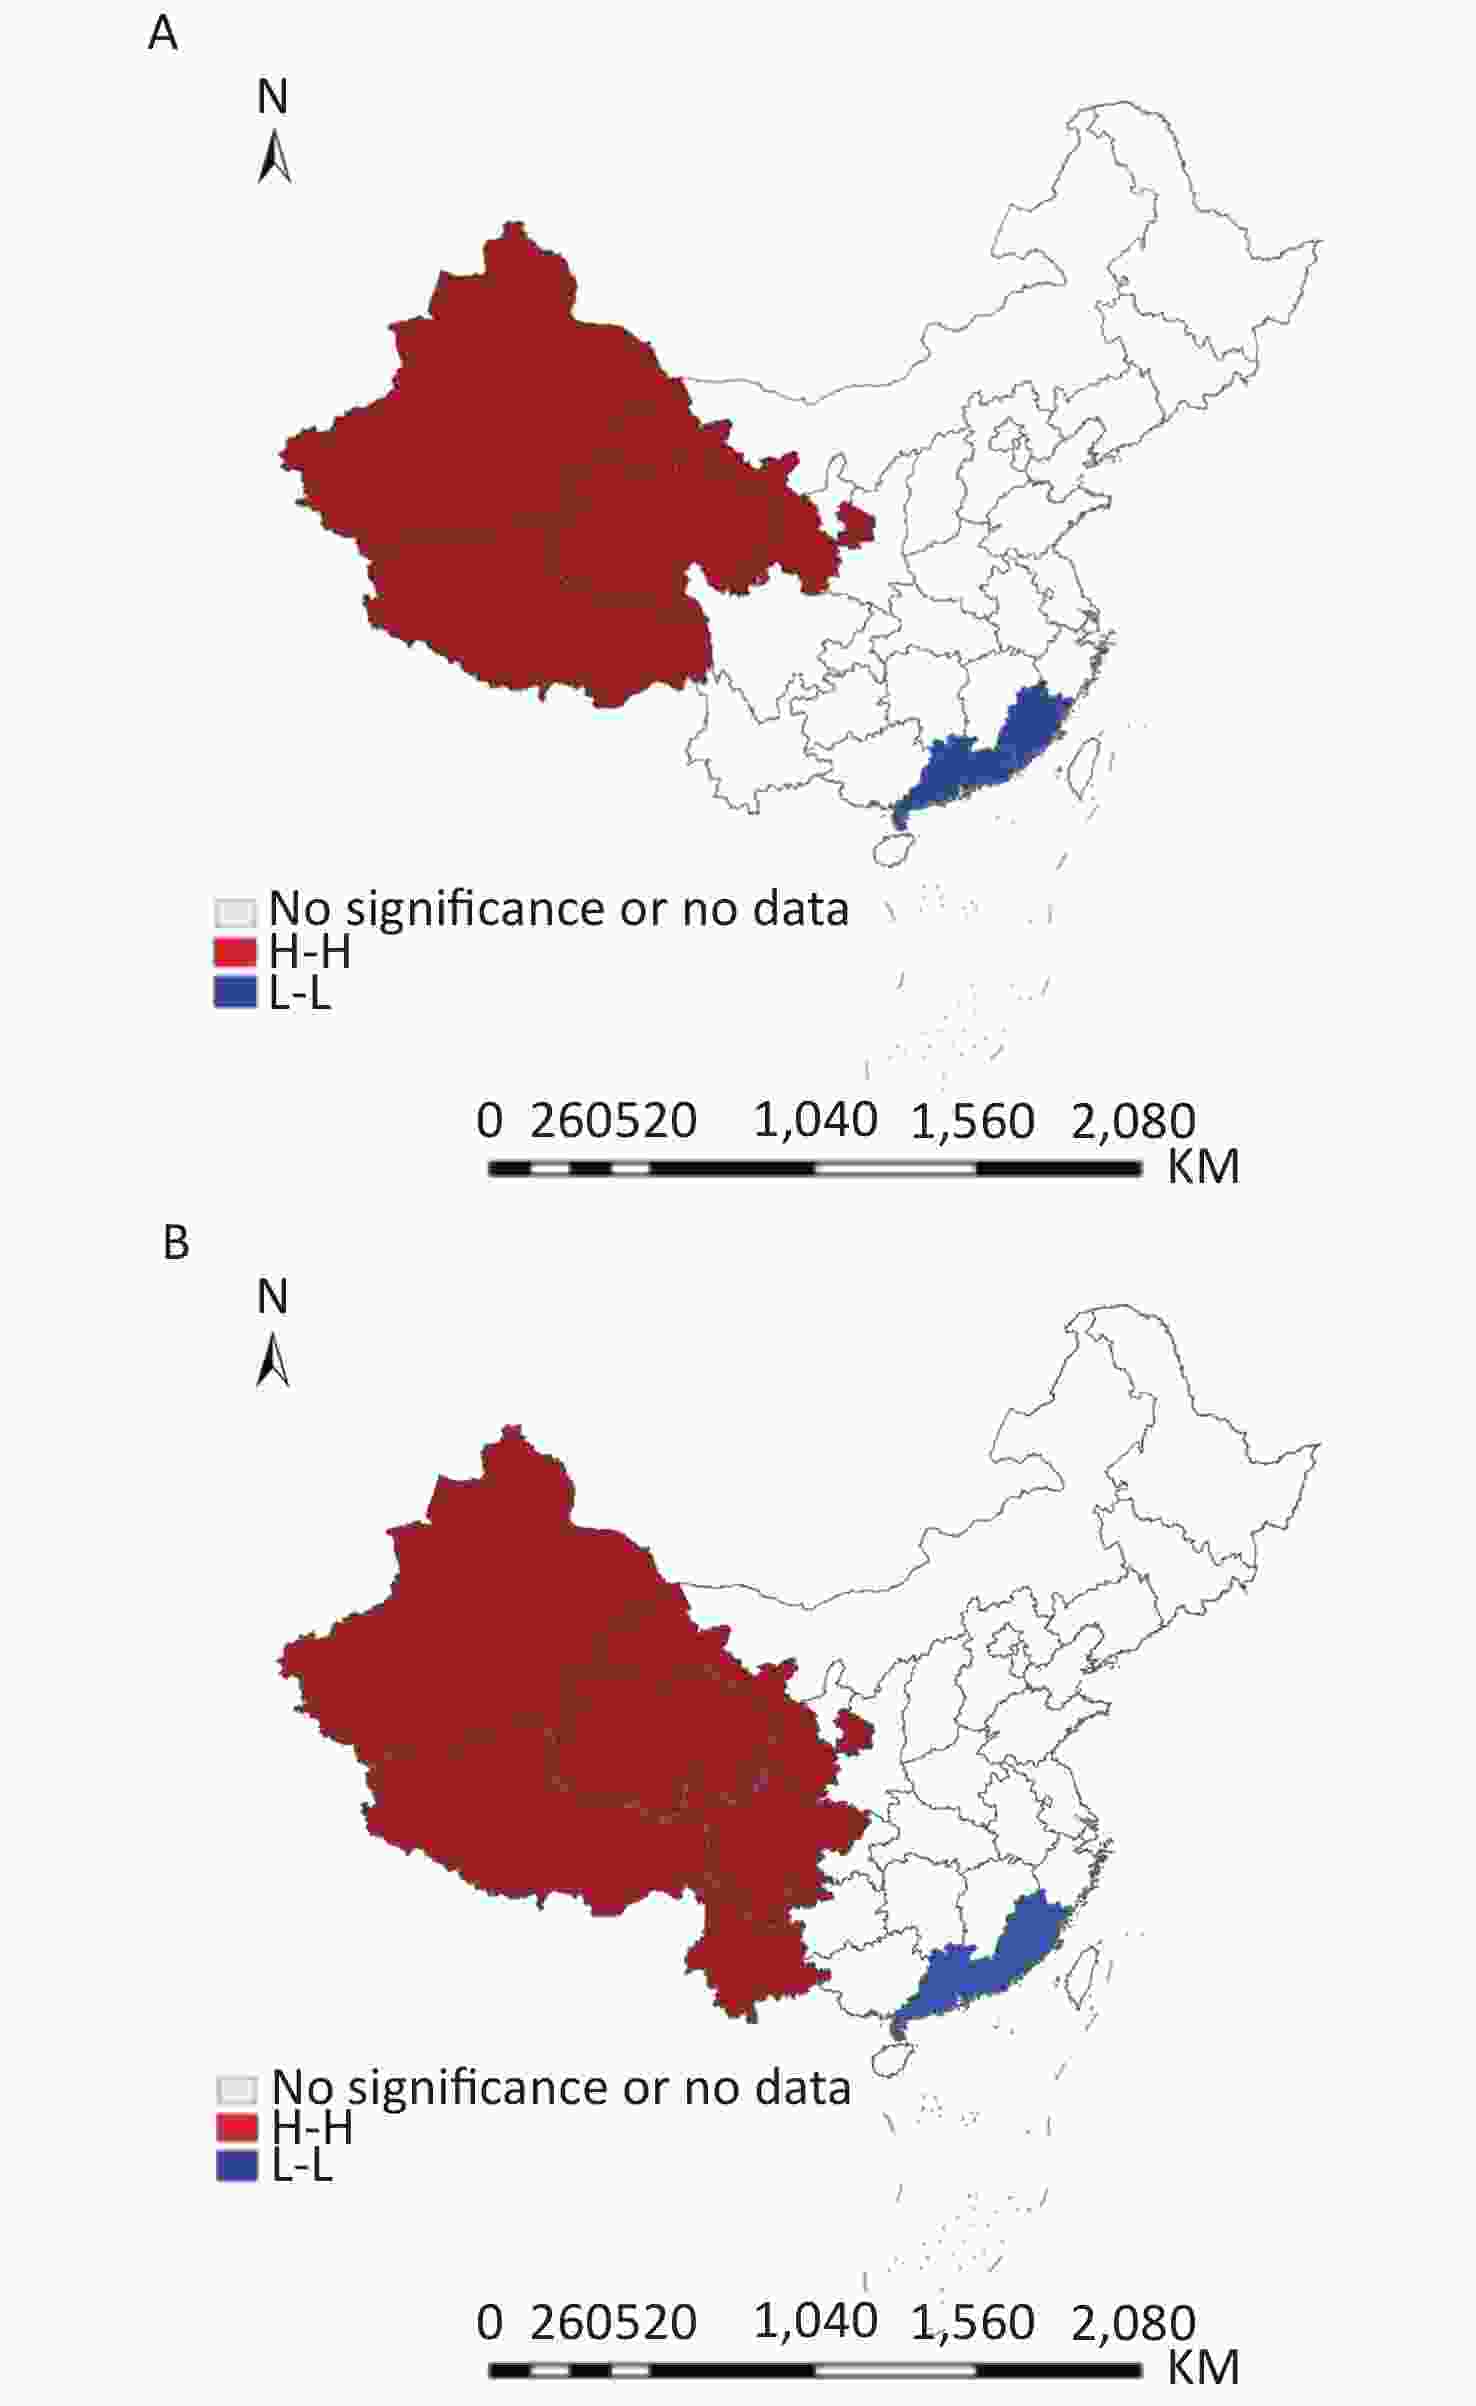
Figure 5. Spatial clusters of public health workforce density between 2008 (A) and 2017 (B).
-
Our study found that the aggregate density of the public health workforce of CDCs continuously decreased from 1.47 to 1.42 per 10,000 population over the past 10 years in China. A gap was seen in the distribution inequality of public health personnel among the three regions with different economic development and health system coverage. Geographic clustering was also evident in the distribution of workforces in CDCs, suggesting that H–H and L–L clusters located in western China and Guangdong-Fujian regions experiencing little change between 2008 and 2017.
There were 190,730 public health workers (including 142,114 health workers) in the CDC system in 2017, comprising 22.1% (190,730/862,208) of the entire public health labor force in specialized disease prevention and treatment institutions, women and child care agencies, health inspection institutions (centers), and CDCs[21]. The CDC system's public health workforce has played an extremely important role substantially reducing rates of infectious diseases since the CDCs were formed. However, several issues arose regarding the sustainability of the CDC system, which may be attributed to the inequality in workforces. First, there was a 28.9% gap in government funding of local CDCs in 2012[14], and the workforce income was affected by cancelling extra administrative charges, such as ‘three charges (including cancelling preventive examine charges, cancelling health examination charges, and entrusted health preventive service costs)’ in 2017[22]. Government had not established a sustainable financing mechanism. Second, the value of CDCs was not well recognized, either by government or the public. During the study period, the central government launched new healthcare reforms in 2009 and achieved substantial positive results in the expansion of health insurance, public hospital reform, and strengthening of primary care[23]. However, the functions of CDCs in the new era were prioritized lower than other priorities (the expansion of health insurance, public hospital reform, and the strengthening of primary care) in China's healthcare reform. Third, disease control and prevention work of CDC staff was not recognized by the public. These factors together accelerated the loss of CDC staff over time. In contrast to this decline in the public health workforce, the density of other health workers steadily increased in China[24]. It’s worth noting that with the launch of the ‘Healthy China 2030 Plan’ in 2016 — which put health into a broader context consistent with the responsibility of CDCs — local CDCs have been included in institutional reforms that realign strategies for protecting the health of the Chinese population across the life cycle[25,26], thus many people see 2019 as ‘the starting year of CDCs ’reform’. To date, these reform efforts have yielded few results, and our study highlights the need to urgently develop and maintain a sound public health workforce conforming to the present situation for CDCs by applying both financial and career-fulfilling incentives.
Target densities have been established for CDCs by the Chinese government since 2014[27]. In principle, 1.75 staff per 10,000 inhabitants is recommended, whereas three per 10,000 inhabitants would be considered for the provinces, autonomous regions or directly controlled cities covering an area of more than 500,000 km2 with a population density lower than 25 people per km2 (e.g., Tibet, Xinjiang, Inner Mongolia, and Qinghai). Our geographical distribution results show that the majority of CDCs in 31 provinces have been understaffed with regard to these national staffing standards, particularly in recent years. The public health workforce shortage in the eastern region was most severe - nearly a quarter lower than that in the western region. High attrition rates and insufficient recruitment led to shortages and distribution inequalities of the public health workforce. Some studies found that CDC staff, especially in the western region, expressed dissatisfaction with their job and were more likely to leave if a better job would become available[14, 28]. It has been observed that many public health graduates have moved into other health sectors such as hospitals or pharmaceutical companies to seek better working conditions. A straightforward comparison of the density with that in other countries is not appropriate, due to the differences in study methods and definitions of public health workers. Although CHSY provides the number of workers in the four broad categories, CHSY does not break down their data by specific occupational categories, thus making comparisons by occupation not possible. Substantial variations exist between countries, ranging from 5.97 per 100,000 population in Serbia in 2014[29] to approximately 19 per 100,000 population in the U.S. in 2013[30], reflecting the various models of public health workforces. Given the methodology used by the U.S. (e.g., the federal public health workforce estimates from the U.S. may under- or over-estimate segments of the workforce) and inclusion criteria from Serbia (e.g., public health workers should only perform health promotion, disease prevention, and hygiene work rather than providing logistics support), it is crucial for data to be understood when analyzing or comparing public health workforce across countries.
Our data show that the Gini coefficients against population size ranged between 0.147 and 0.165, indicating relatively good equality. However, Gini coefficients showed that inequality was higher in the western regions than the eastern and the central regions. The two Theil measures yielded similar results. Su Binbin et al found that when inequality is based on the workforce size per geographical area instead of population, Gini coefficients exceeding 0.55, signify serious inequality[31]. Given that the western region includes sparsely populated areas, this inequality should be addressed by both provincial and local government. As the tasks and responsibilities of CDCs’ workforce have broadened, coastal areas such as Guangdong, Fujian, Zhejiang, and Jiangsu, which are located in the eastern region of China, face greater risk of national and international importation of emerging infectious diseases. Therefore, a strategic plan for recruitment, retention, and reallocation of human resources is urgently needed.
With regard to geographic analysis, LISA mapping showed that there were spatial correlations between provinces. In particular, provincial units displaying high–high cluster features were either reduced in number or became insignificant. This result impies a more complex situation of the public health workforce in China. While more significant inequality existed in the western region, changes in spatial cluster areas reflected changing patterns of the public health workforce distribution. Compared to the other regions, eastern provinces with high economic development such as the Guangdong and Fujian, faced a growing need for a larger public health workforce.
Our results should be interpreted in the context of several limitations. First, although the data provided general changes and geographic distributions of the public health workforce of CDCs they did not detail specific professional qualifications, education, or age, making it difficult to understand the public health staff structure compared with other health structures. More detailed information needs to be provided about public health workers’ occupations. Second, in addition to calculation by population, density rates should be calculated by area. It is important to consider the workforce servicing such a large area in the western region. For example, in a remote village of Xinjiang, a physician may spend two days vaccinating a child due to the distance between clinics and the unvaccinated child’s house, while a physician in the east region may be able to vaccinate more than 50 children in one day.
Our study used inequality indices and spatial statistics to evaluate disparities in the public health workforce of the CDCs system, revealing a continually decreasing trend with inequality throughout China. As the two methods measure from different perspectives, their results should be understood in an integrated view. The classic inequality indices, including Gini coefficient, Theil L, and Theil T, can reflect the demographic distribution of the public health workforce in China; while the spatial autocorrelation analysis can assess the correlation between workforce density and their spatial location, indicating the cumulative effects of health resource allocation. This result illustrates that in the past, the government only considered the absolute number of resources being distributed, but not the mobility of human resources. Overall, our study addresses key issues for government and policymakers regarding allocation of human resources in the CDCs system. There is a need for careful identification of analytic questions that will fulfill public health functions in the new era alongside policy implications for an equitable distribution of the public health workforce focusing on the western region and low–low cluster areas.


Funds:
This research was funded by China CDC’s Public Health and Emergency Response Mechanism Programme [131031001000150001]

 Quick Links
 DownLoad: