

-
Atmospheric fine particulate matter (PM2.5) is particulate matter with a dynamic equivalent diameter of 2.5 µm or less in air particulates and is one of the main air pollutants. The composition of PM2.5 is extremely complex, consisting of polycyclic aromatic hydrocarbons (PAH), heavy metal ions, and other mutagenic and carcinogenic substances, posing a great threat to human health[1-8].
PM2.5 emitted from different sources demonstrates different chemical compositions, leading to different biological responses in human epithelial cells[9-11]. Furthermore, geographical differences in energy use could result in the distinct chemical compositions of PM2.5, which could induce diverse biological responses in human epithelial cells[12-13]. PM2.5 can remain in the air for a prolonged duration owing to its characteristics such as small size, large surface area, strong activity, and easy accumulation of toxic substances; therefore, PM2.5 is considered harmful to human health and has been classified as a human carcinogen by the International Agency for Research on Cancer (IARC)[14-18].
Proteomics is a powerful tool for investigating cellular responses to environmental pollutants, providing effective strategies for toxicological studies[19]. Jeon performed proteomic analysis of human lung epithelial cells treated with PM10, identifying 36 DEPs, including an upregulated tumor metabolism protein[20]. Xiao et al.[21] analyzed the proteome in cells of the macrophage cell line RAW 267.7 exposed to extracts of organic diesel exhaust particle. Therefore, this study aimed to analyze the differences in overall protein expression in human bronchial epithelial (HBE) cells treated with PM2.5 samples from Shenzhen and Taiyuan, using proteomics and bioinformatics to screen the DEPs in Shenzhen and Taiyuan samples-treated cells, explore the functions of the DEPs[22-27], and finally provide a scientific basis for further research regarding the molecular mechanism of PM2.5 mediated carcinogenesis.
-
HBE cells were obtained from Shanghai Cell Bank (Shanghai, China). Fetal bovine serum (FBS) and 0.25% Trypsin-EDTA were purchased from Gibco (San Jose, USA). Dulbecco's modified Eagle medium (DMEM) was purchased from Hyclone (Utah, USA). TMTsixplexTM Isobaric Label was purchased from Thermo Fisher Scientific (Waltham, MA, USA). The Pierce BCA protein quantitative analysis kit was purchased from Thermo Scientific. Tetraethylammonium bromide (TEAB) was purchased from Thermo Corporation, USA. Trypsin /Lys-C Mix, Mass Spectrometry Grade, was purchased from Promega Corporation (USA). Q Exactive mass spectrometer was purchased from Thermo Fisher Scientific (Waltham, MA, USA); ultimate 3000 and APC-3000 were purchased from Thermo Fisher Scientific (Waltham, MA, USA).
-
From 2017 to 2018, PM2.5 samples were collected using medium flow membrane filters (TH-150F, Wuhan Tianhong Company, China) in Taiyuan (Shanxi University campus) and Shenzhen (Longyuan Road, Nanshan district) at sampling sites with no visible pollution sources. The sampling filter was a quartz fiber filter with a sampling flow of 100 L/min. Each site was sampled once every quarter of the year. For 3 d and samples were continuously collected for 24 h every day. The concentration of PM2.5 samples was determined by weighing the sampling filters using an electronic balance and calculated from the total collected air volume.
The quartz fiber membrane adsorbing the PM2.5 particles was cut into small pieces and dissolved in ultra-pure water with sonication for 30 min. PM2.5 solution was dried in the vacuum freeze-dryer for 24 h and then UV-treated for 1 h. Next, the PM2.5 stock solution was prepared by adding sterile water for use in cellular experiments after autoclaving.
-
HBE cells were purchased from the Shanghai cell resource center of the Chinese Academy of Sciences. HBE cells were routinely maintained in DMEM medium at pH 7.4, supplemented with 10% inactivated phosphate-buffered saline (FBS) and 1% penicillin/streptomycin, and grown at 37 °C with 5% CO2. Cells were seeded at a concentration of 5 × 10⁵ in a 6-well plate using 2 mL DMEM. PM2.5 treatment was performed when the cells reached 80% confluence at the bottom of the culture flask. The PM2.5 concentration used in this study was 50 μg/mL, which is the IC50 of PM2.5 determined in our previous study, and the duration of treatment was 24 h. HBE cells were exposed to the following treatments: (1) Blank control, HBE cells were cultured without any treatment. (2) Shenzhen PM2.5 group, cells were treated with PM2.5 from Shenzhen at 50 μg/mL for 24 h. (3) Taiyuan PM2.5 group, cells were treated with PM2.5 from Taiyuan at 50 μg/mL for 24 h.
-
PM2.5-treated cells were washed with PBS 3 times, followed by the addition of EDTA-containing trypsin, and digested at 37 °C under 5% CO2 for 5 min. After the cells were completely digested, 1 mL DMEM with 10% foetal bovine serum (FBS) medium was added and mixed thoroughly to terminate digestion. Cell suspensions were collected in 1.5 mL Eppendorf (EP) tubes and centrifuged at 1,000 rpm for 5 min. Next, the medium was removed from the EP tube, then 500 µL of PBS was added and centrifuged at 1,000 rpm for 5 min and PBS was aspirated (cell pellets at the bottom of the EP tube). Then, 200 µL of 8 mol/L urea was added to each sample and the cells were thoroughly mixed with the lysate by repeated pipetting. Each sample was sonicated 15 times for 4 s. The sonicated samples were lysed on ice for 15 min, centrifuged at 4 °C and 12,000 rpm for 15 min, and the supernatants were collected. The protein was quantified using the BCA protein quantification kit. Briefly, 150 μg of protein was transferred to a 3 kD ultrafiltration tube for each sample. Next, 500 μL of 10 mmol/L DTT was added, followed by centrifugation at 4 °C and 12,000 rpm for 15 min; the filtrate in the collection tube was discarded (the remaining 100 μL in the ultrafiltration tube after centrifugation), and this step repeated twice before incubating in DTT for 1 h at room temperature. Next, 400 μL of 20 mmol/L indole-3-acetic acid (IAA) was added to each ultrafiltration tube and centrifuged at 4 °C, 14,000 rpm, for 15 min; the filtrate in the collection tube was discarded and this step repeated twice, before incubating at room temperature in a darkroom for 1 h. Next, 450 μL of 100 mmol/L TEAB was added to each ultrafiltration tube, followed by centrifugation at 4 °C and 14,000 rpm for 15 min. The filtrate in the collection tube was discarded and this step was repeated three times. The liquid in the ultrafiltration tube was centrifuged and placed in a new collection tube, then centrifuged again at 4 °C and 1,000 rpm for 1 min, and the samples were collected. The samples were transferred to a 1.5 mL EP tube, with trypsin added at a ratio of 100:1, and digested overnight at 37 °C.
-
Thermo ScientificTM Tandem Mass Tag (TMT) was used to label the digested protein samples with TMT reagent. One label was used per tube, vortexed and incubated at room temperature for 1 h. Next, 8 μL of 5% hydroxylamine was added and incubated at room temperature for 15 min to terminate the remaining TMT reagent. The six batches of labeled samples from batch 1 and 2 were mixed in one tube, which was named Tube 1; the six batches of labeled samples from batch 3 and 4 were mixed into another tube, Tube 2, and mixed well. The solution in the EP tube was evaporated to dryness with a PVC 2-18 centrifugal concentrator and stored at −80 °C. Next, 0.1% formic acid (FA) was used to dissolve the evaporated samples, and the fractions were separated with ultimate 3,000 and APC-3000 instruments. Each sample was divided into 15 tubes. The PVC 2-18 centrifugal concentrator was used to evaporate the fractions in the EP tubes. The solution was stored at −80 °C. Each sample was dissolved in 20 μL 0.1% FA and mixed by vortexing. The Q Exactive mass spectrometer (Thermo Corporation, USA) was used for the on-line detection of protein expression.
-
In this study, cluster software Profiler and org.Hs.eg.db were used to run the R software to perform KEGG pathway analysis and GO enrichment analysis on DEPs. Additionally, the weighted correlation network analysis (WGCNA) package was performed using the R language (Ver 3.5.1) and WGCNA was constructed and identified for all proteins. Cytoscape was used to draw a diagram of the protein co-expression network. An effective co-expression network was obtained, the weight parameter β was set to 8, the topological overlap was performed according to the degree of dissimilarity, a phylogenetic tree was constructed, and then the co-expression module was identified using the dynamic hybrid shear method. The expression of each protein in the same module demonstrated a higher correlation. For each protein, the degree of connectivity was measured by the correlation coefficient to screen the module for pivotal proteins, which are the most representative class of proteins in modules and often have important biological functions.
The Perseus software was used to compare the differences among the three groups and analyze the differences demonstrated by the proteins obtained from the search library using the t-test. A P value of < 0.05 was considered significant when screening differentially expressed proteins in HBE cells treated with Shenzhen and Taiyuan samples.
-
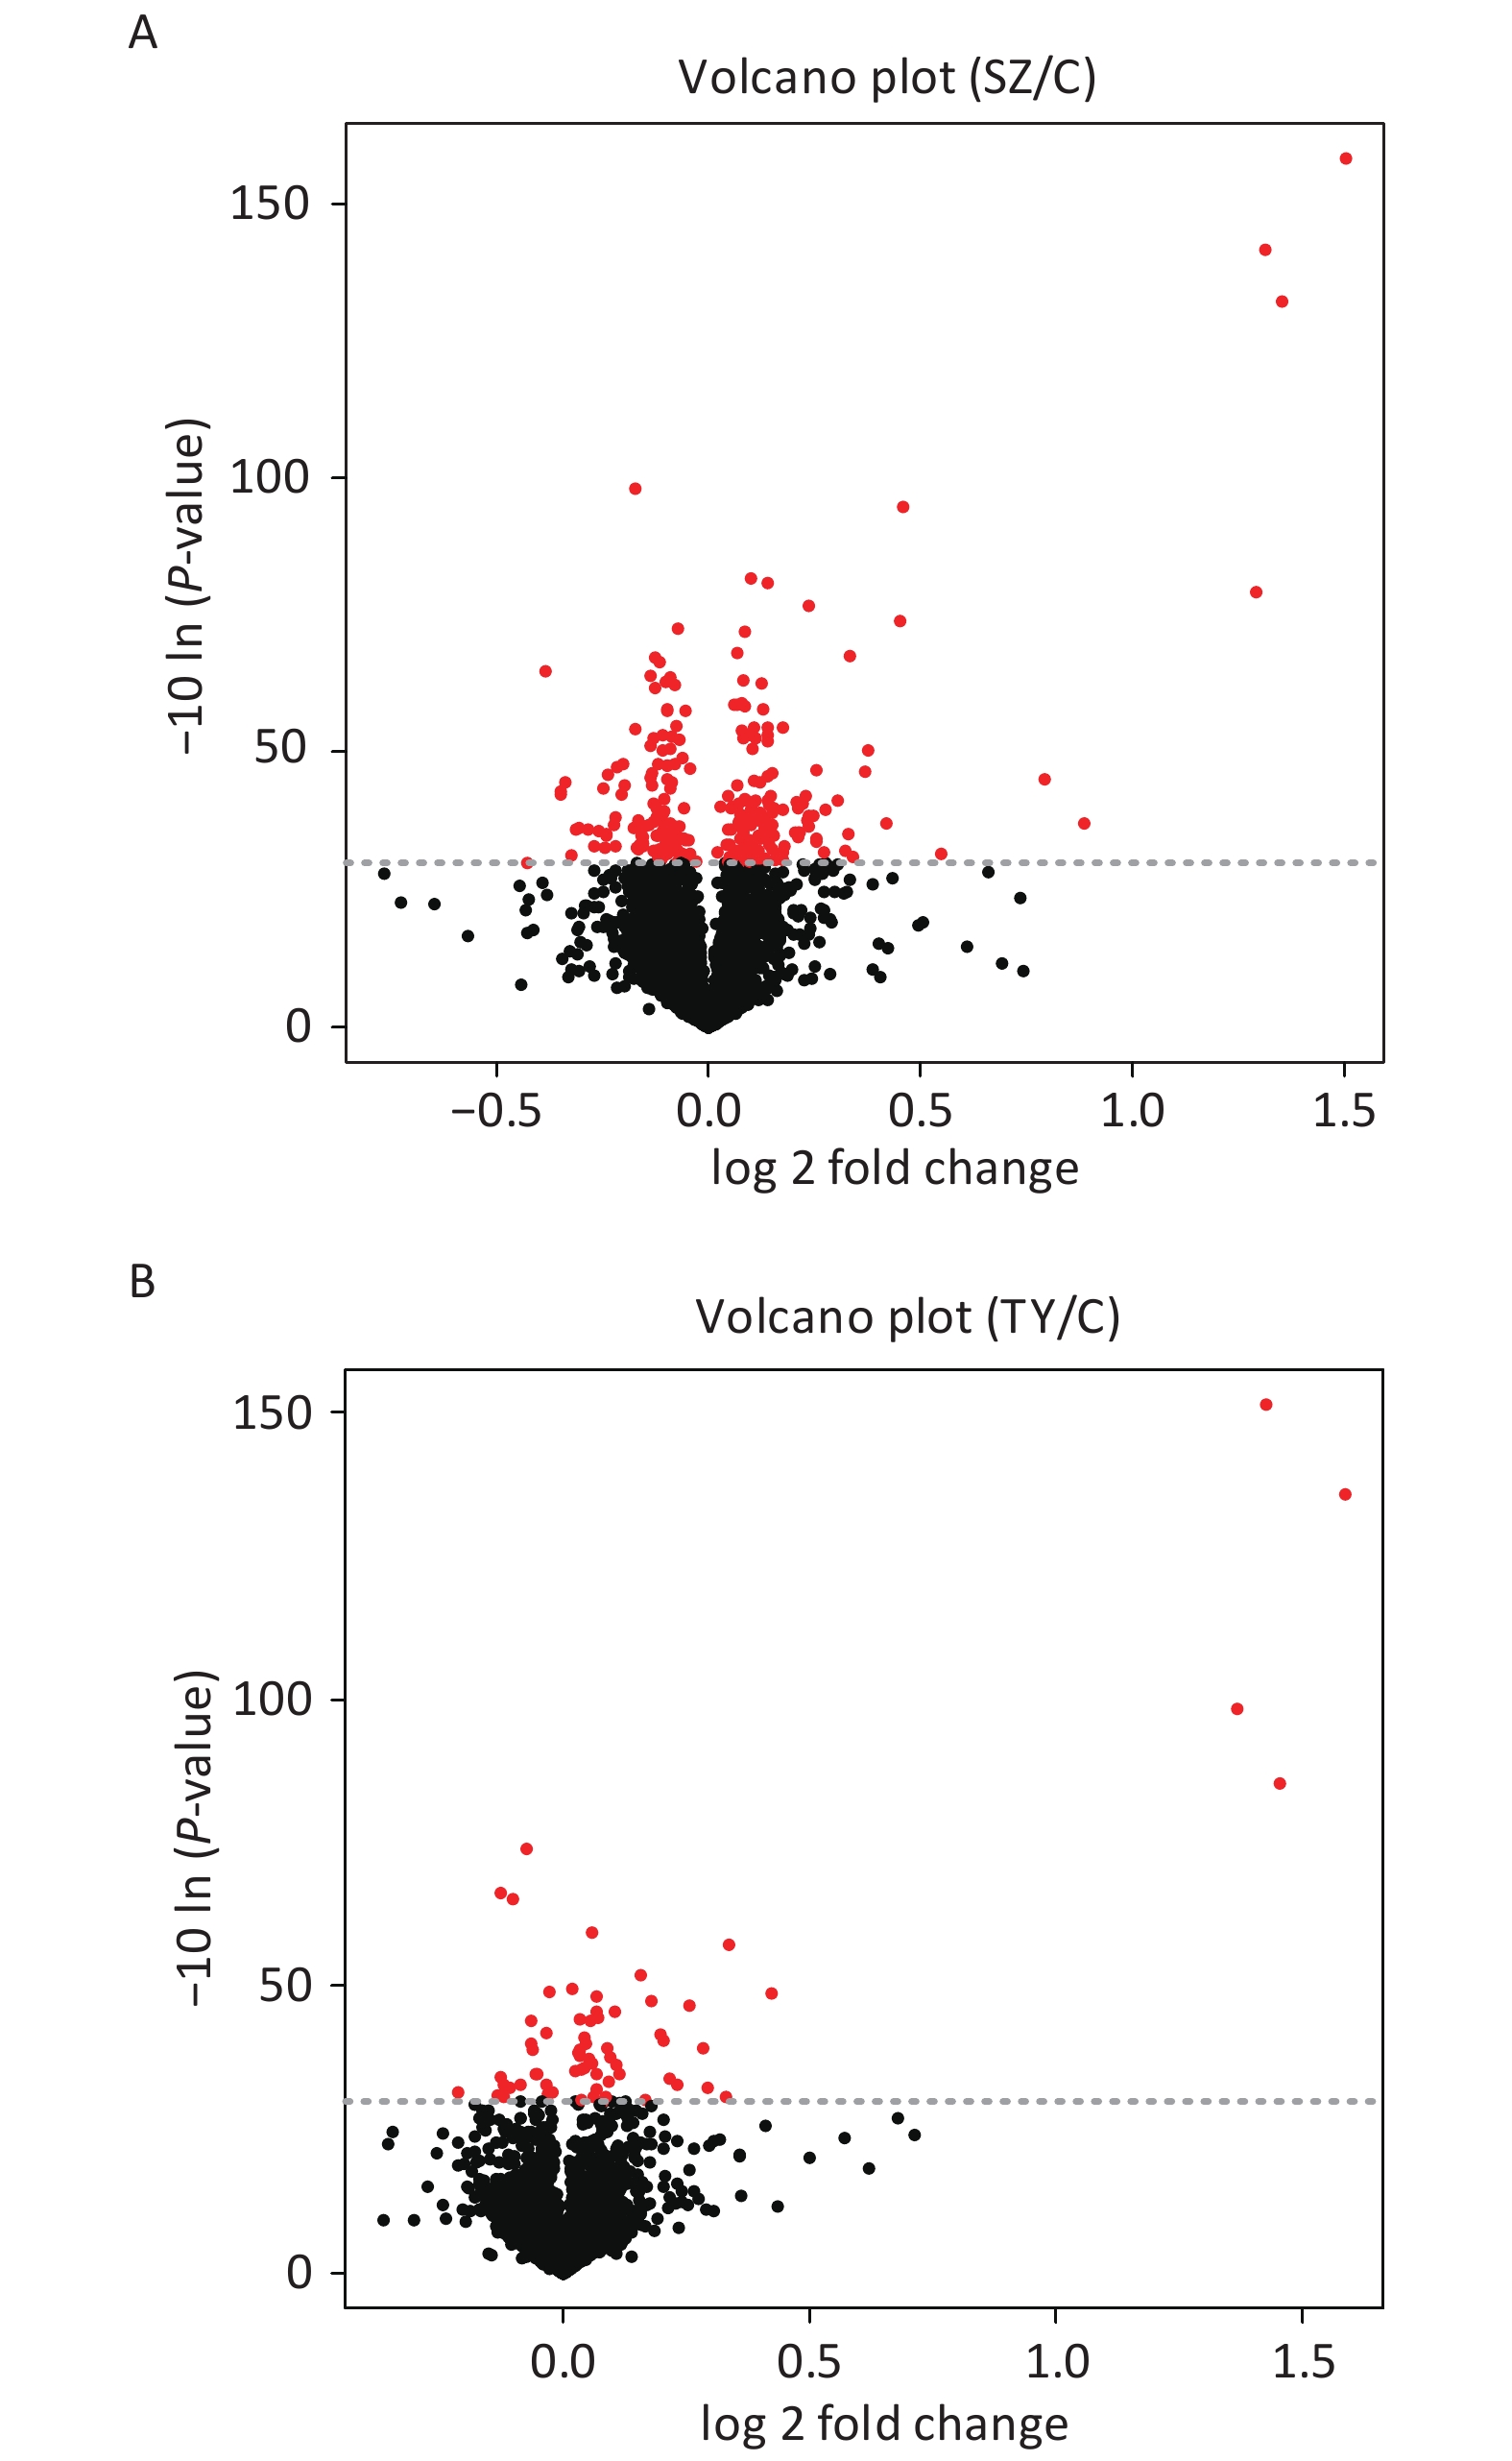
The Perseus and R software were used to screen DEPs in Shenzhen and Taiyuan samples. A total of 67 DEPs were screened in Shenzhen samples, of which 46 proteins were upregulated and 21 proteins were downregulated. Overall, 252 DEPs were screened in Taiyuan samples, of which 134 proteins were upregulated and 118 proteins were downregulated (Figure 1).

Figure 1. Volcano plot of PM2.5-induced differentially expressed proteins. (A) Shenzhen samples; (B) Taiyuan samples.
-
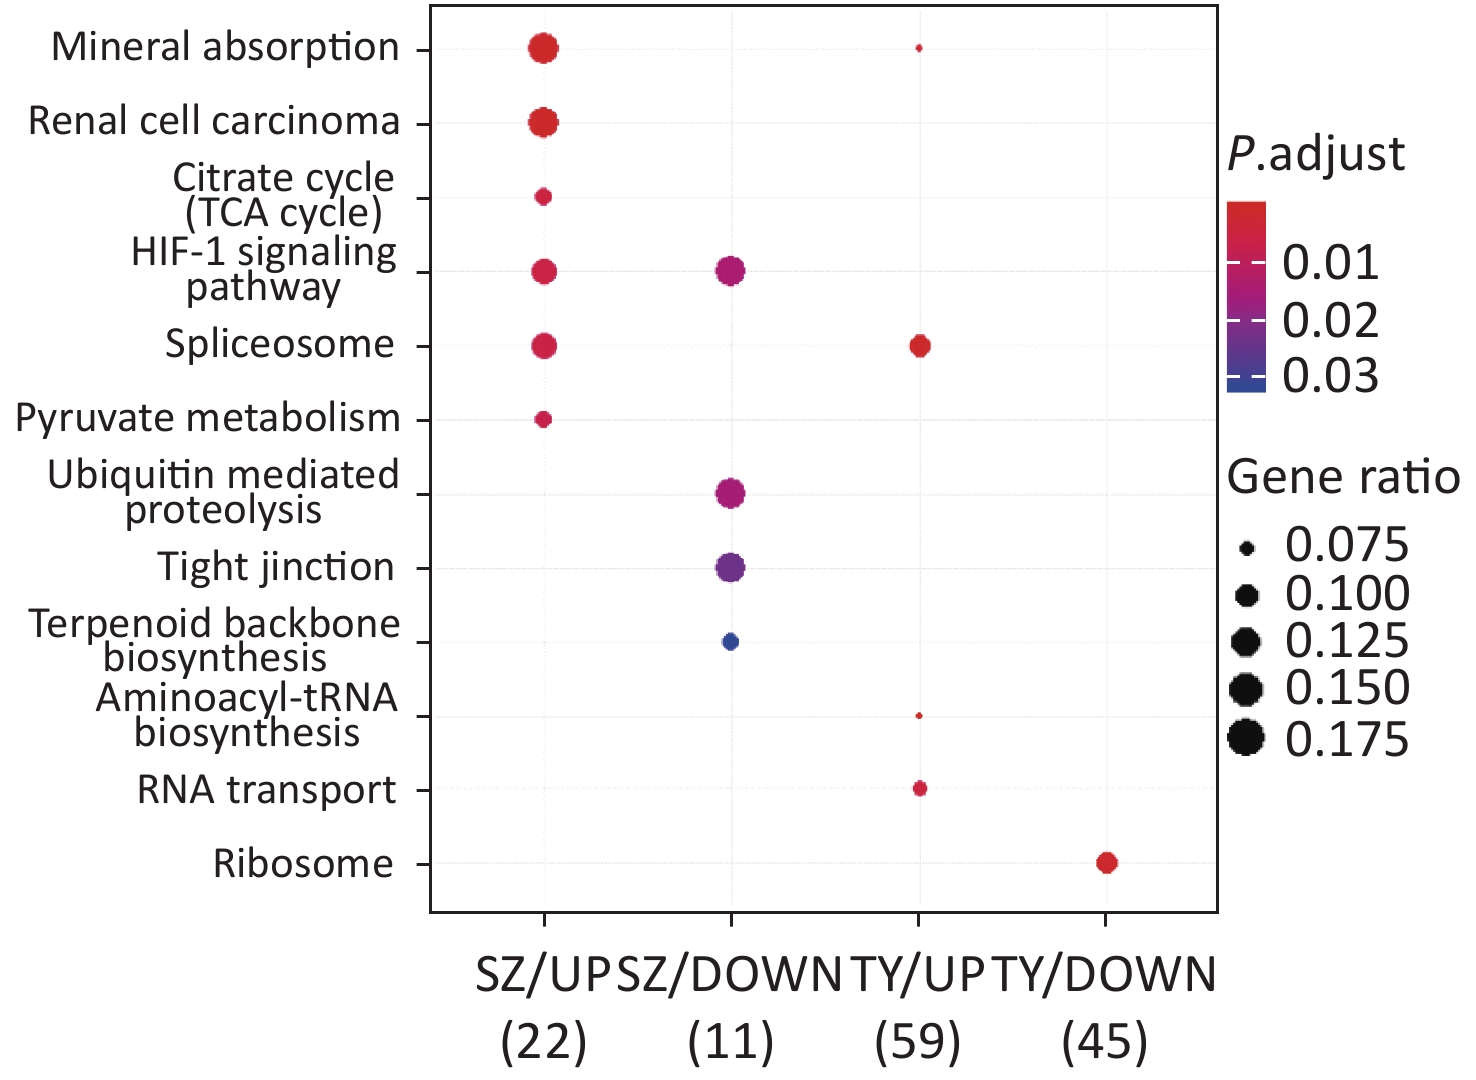
KEGG functional analysis is shown in Figure 2. The upregulated proteins in Shenzhen PM2.5 samples are mainly involved in signal pathways, including mineral absorption, renal cell carcinoma, and hypoxia-inducible factor (HIF)-1 (HIF-1 signaling pathway). The downregulated proteins in Shenzhen PM2.5 samples were mainly involved in signal pathways such as ubiquitin-mediated proteolysis (Hbi-1 signaling) and HIF-1 (HIF-1 signaling pathway). In Taiyuan PM2.5 samples, the upregulated proteins were mainly involved in signal pathways such as spliceosome and RNA transport, whereas the downregulated proteins were mainly involved in cell components such as ribosomes.
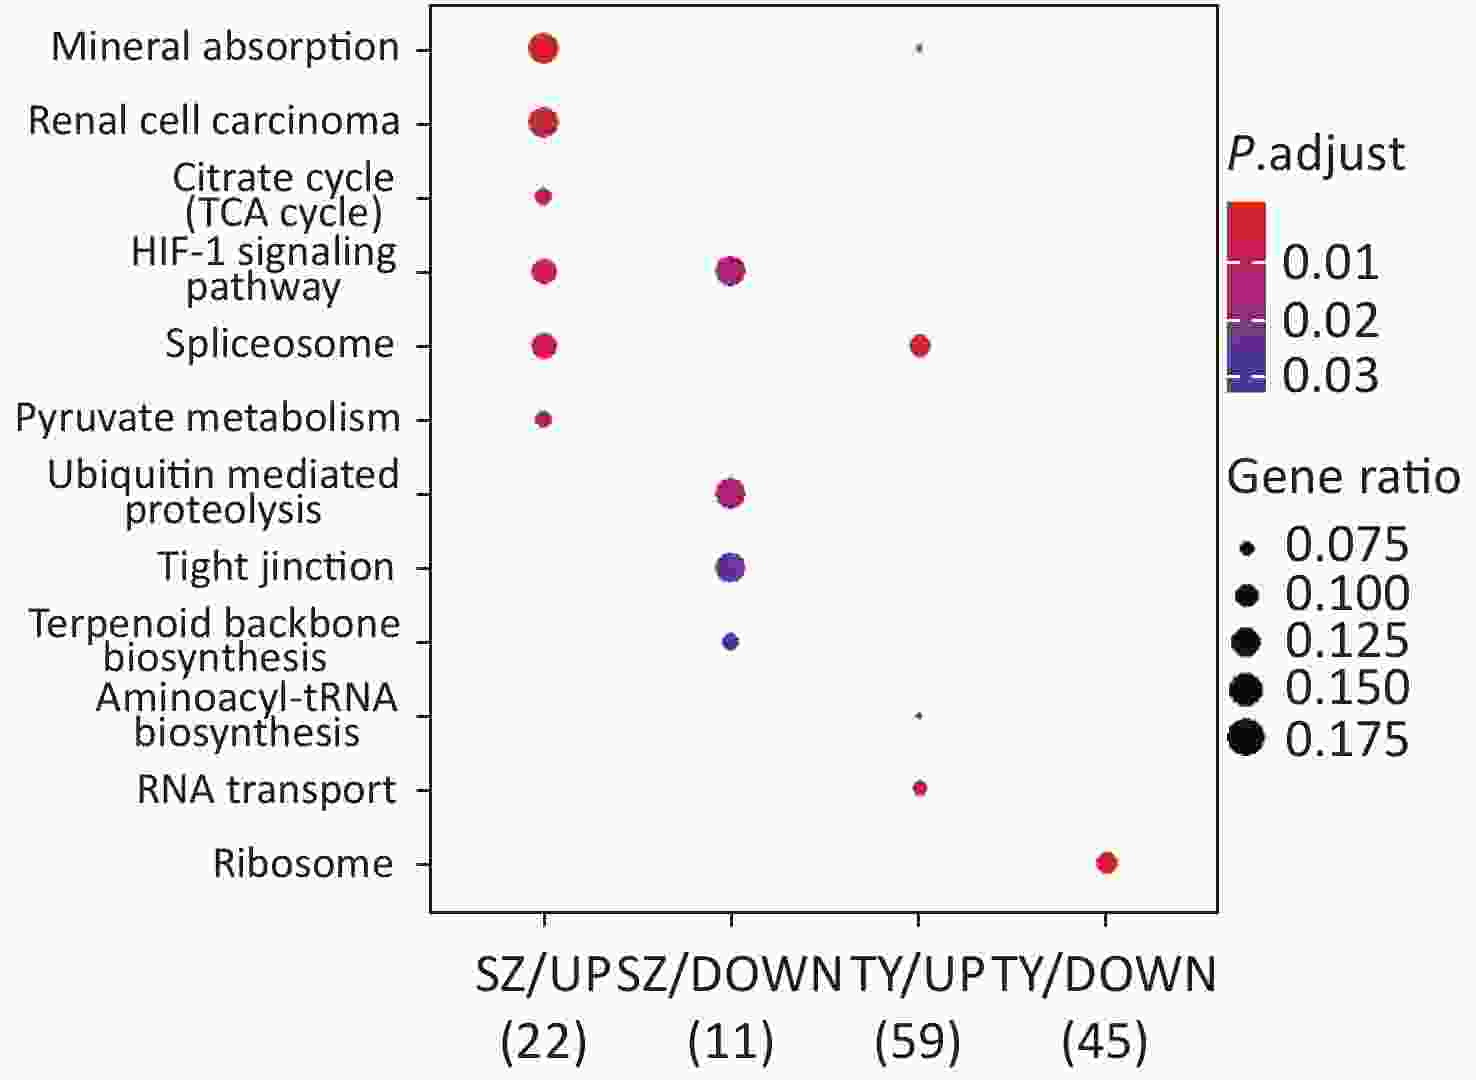
Figure 2. Kyoto encyclopedia of genes and genomes functional analysis of PM2.5-induced differentially expressed proteins.
-
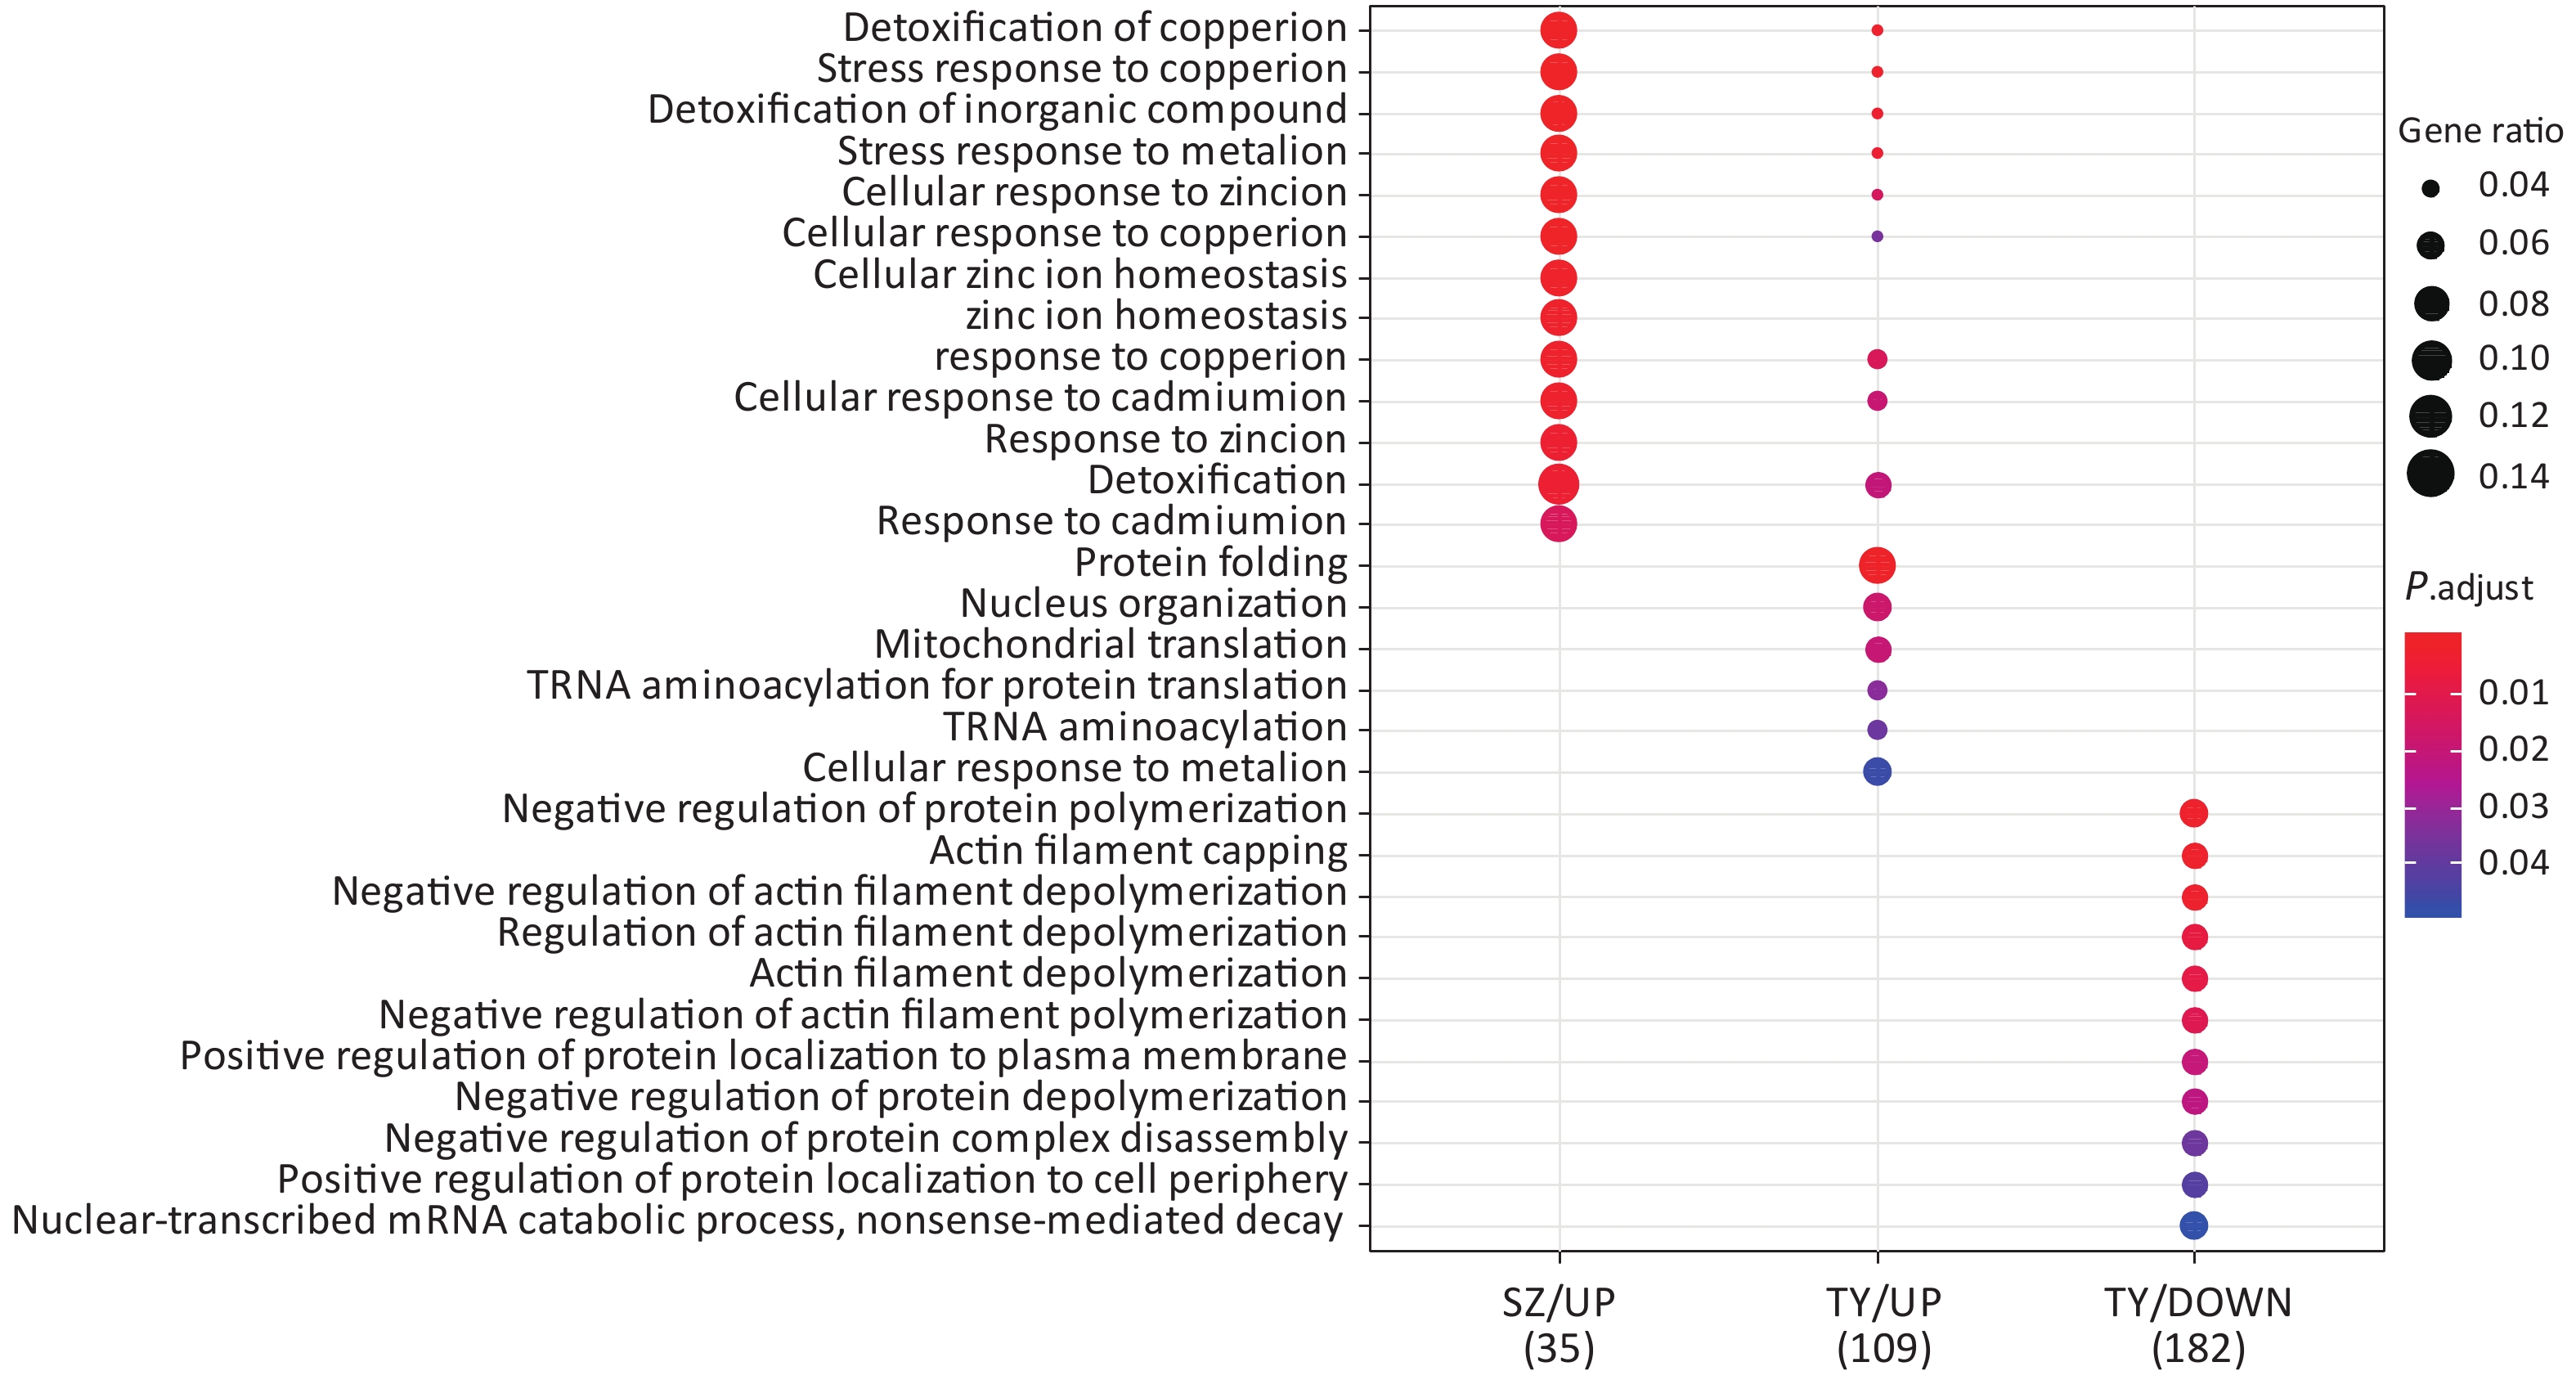
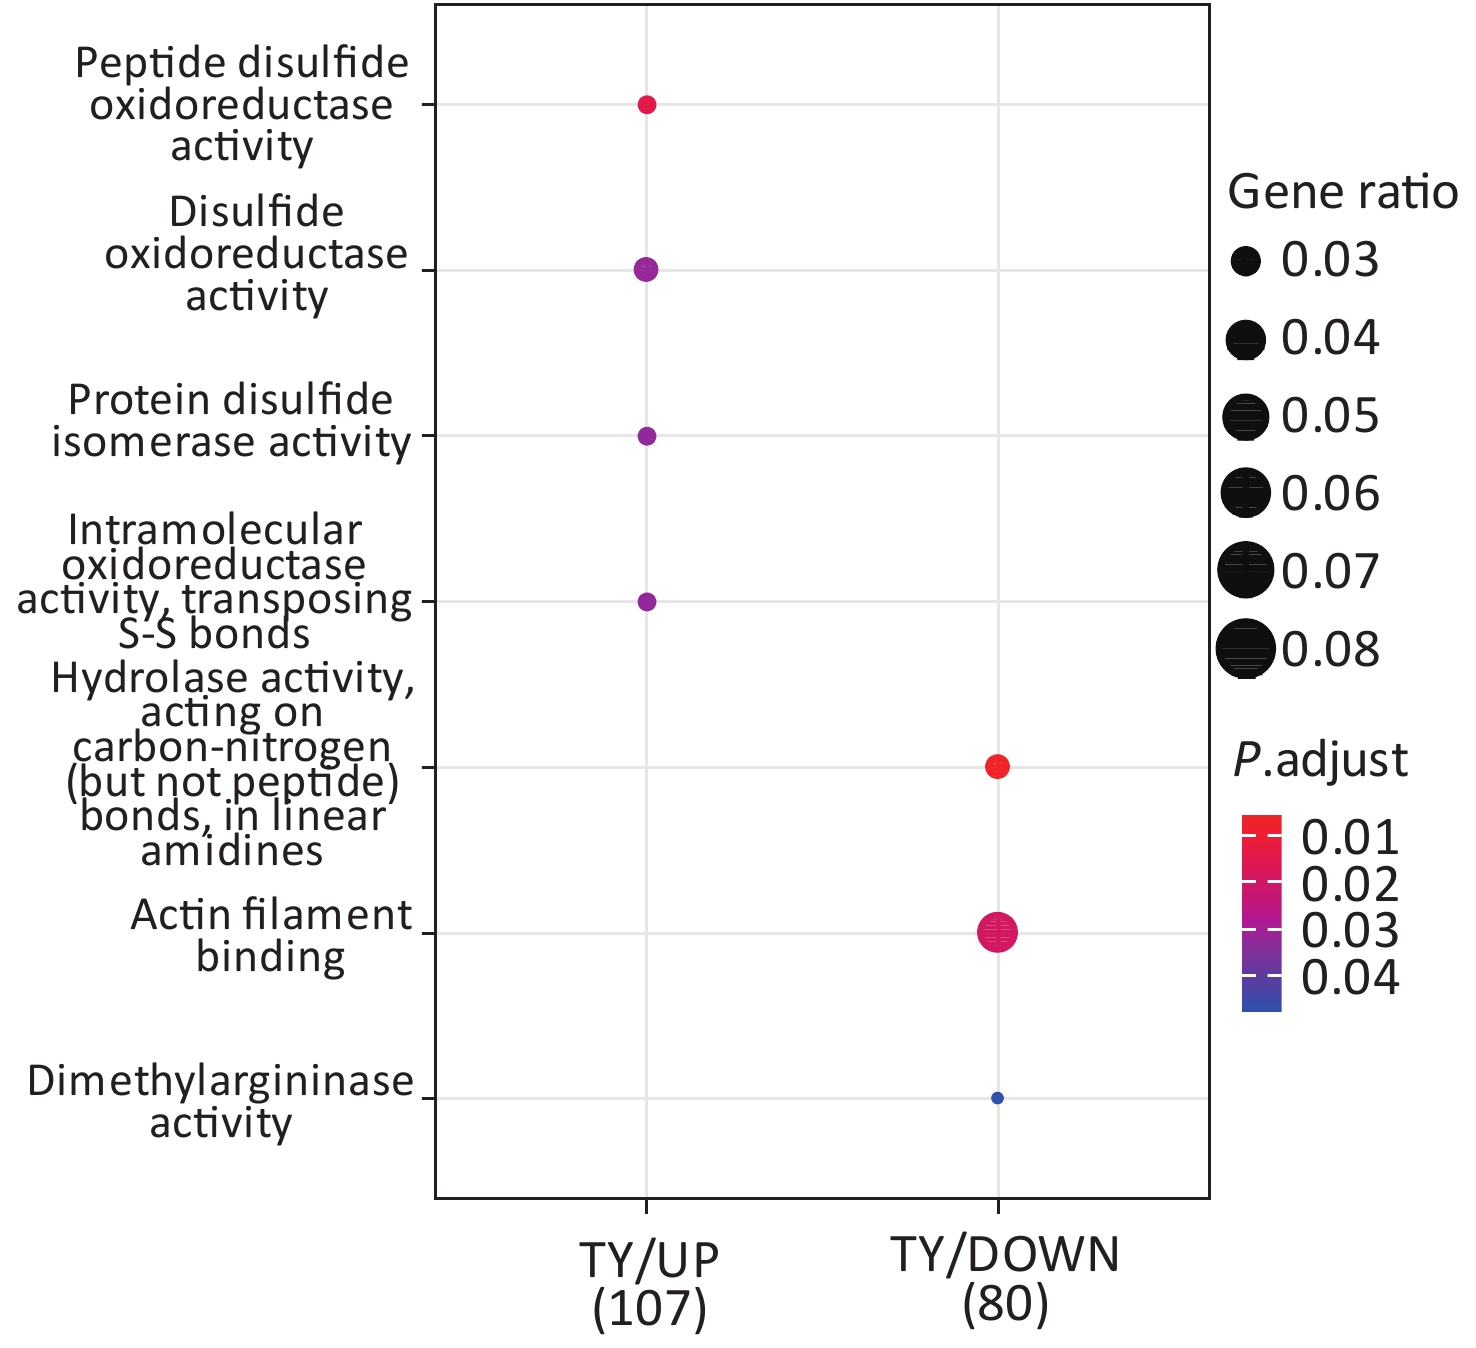
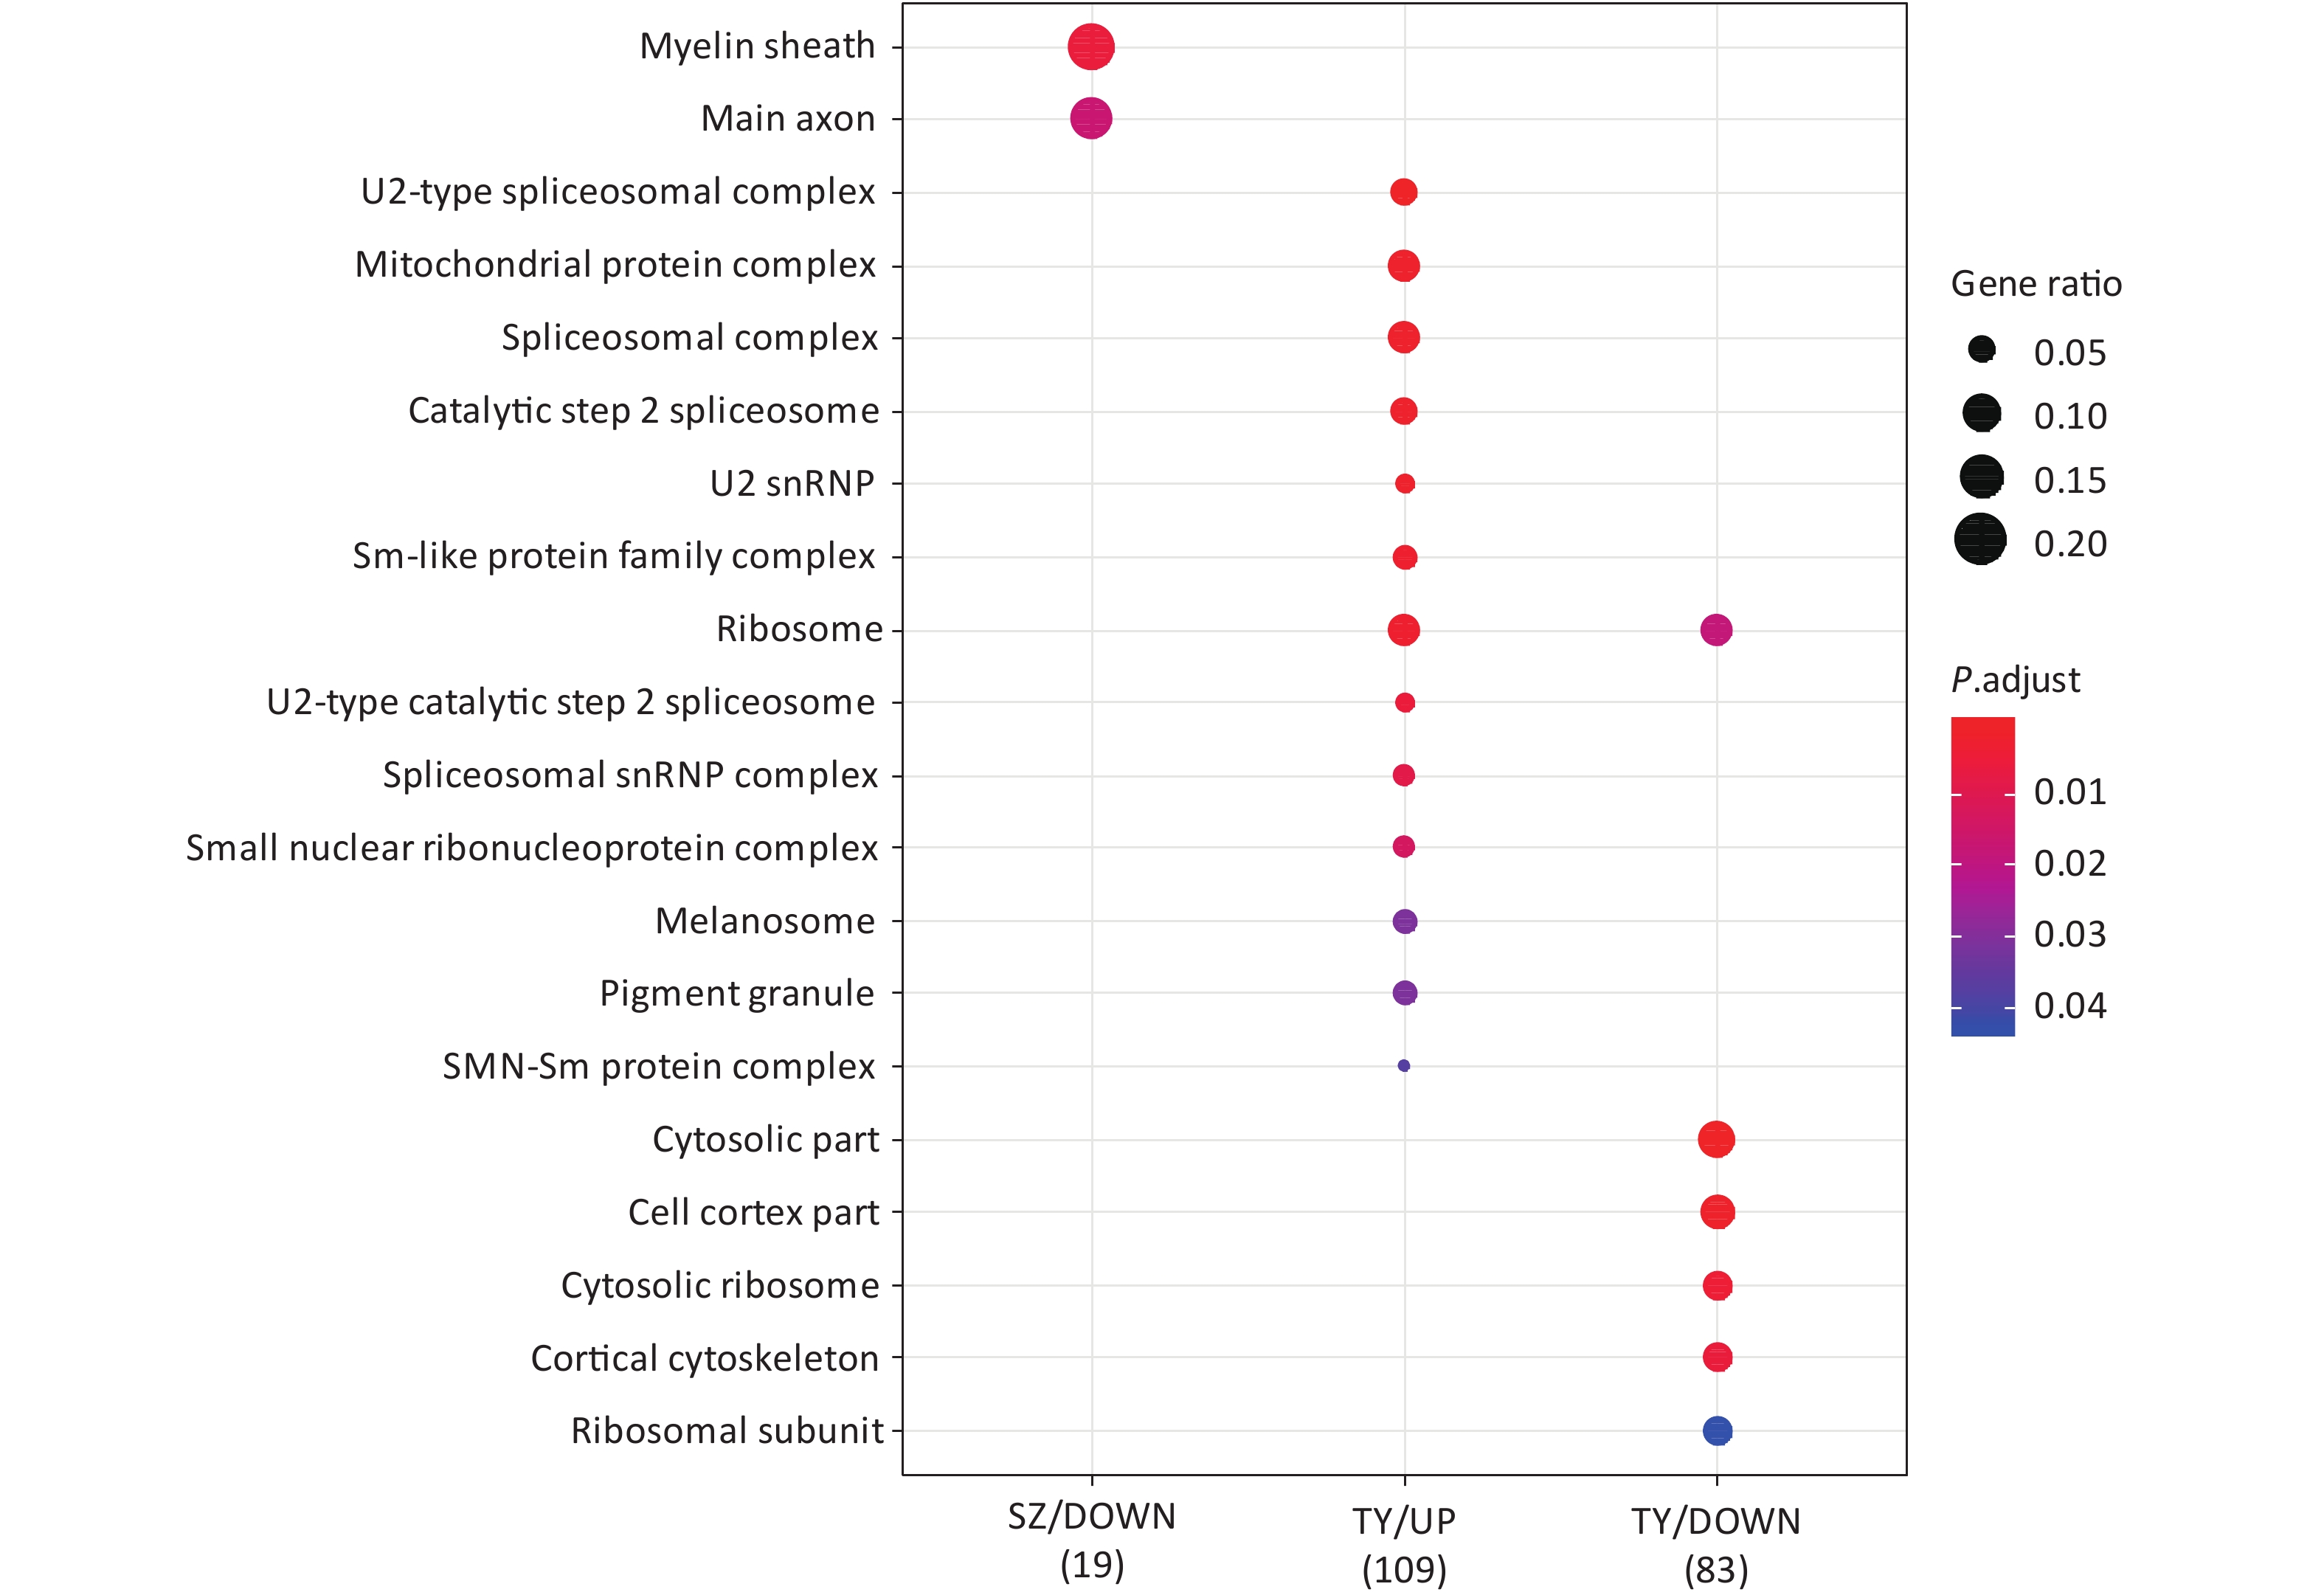
Following the exposure of HBE cells to the Shenzhen and Taiyuan samples, GO enrichment analysis was performed and their differential proteins are shown in Figures 3–5. At the biological process (BP) level, the upregulated proteins in the Shenzhen samples were mainly distributed in detoxification of copper ions, the copper ion stress response to copper ions, cellular response to zinc ions, and other biological processes. In Taiyuan samples, the upregulated proteins were mainly distributed in protein folding and cellular responses to metal ions; the downregulated proteins were mainly distributed in the negative regulation of protein translation and the regulation of protein polymerization, as well as other biological processes. In the Taiyuan samples, at the molecular function (MF) level, the upregulated proteins were mainly distributed in molecules that are functionally associated with peptide disulfide oxidoreductase activity and peptide disulfide oxidoreductase activity; the downregulated proteins were mainly distributed in MF, including hydrolase activity and actin filament binding. At the cellular component (CC) level, downregulated proteins in Shenzhen samples were mainly distributed on cell components such as the myelin sheath and axons. In Taiyuan samples, the upregulated proteins were mainly distributed in cell components such as mitochondrial protein complex, spliceosomal complex, and ribosomes. The downregulated proteins in Taiyuan samples were mainly distributed in the cytosol and cell components, including the cell cortex.
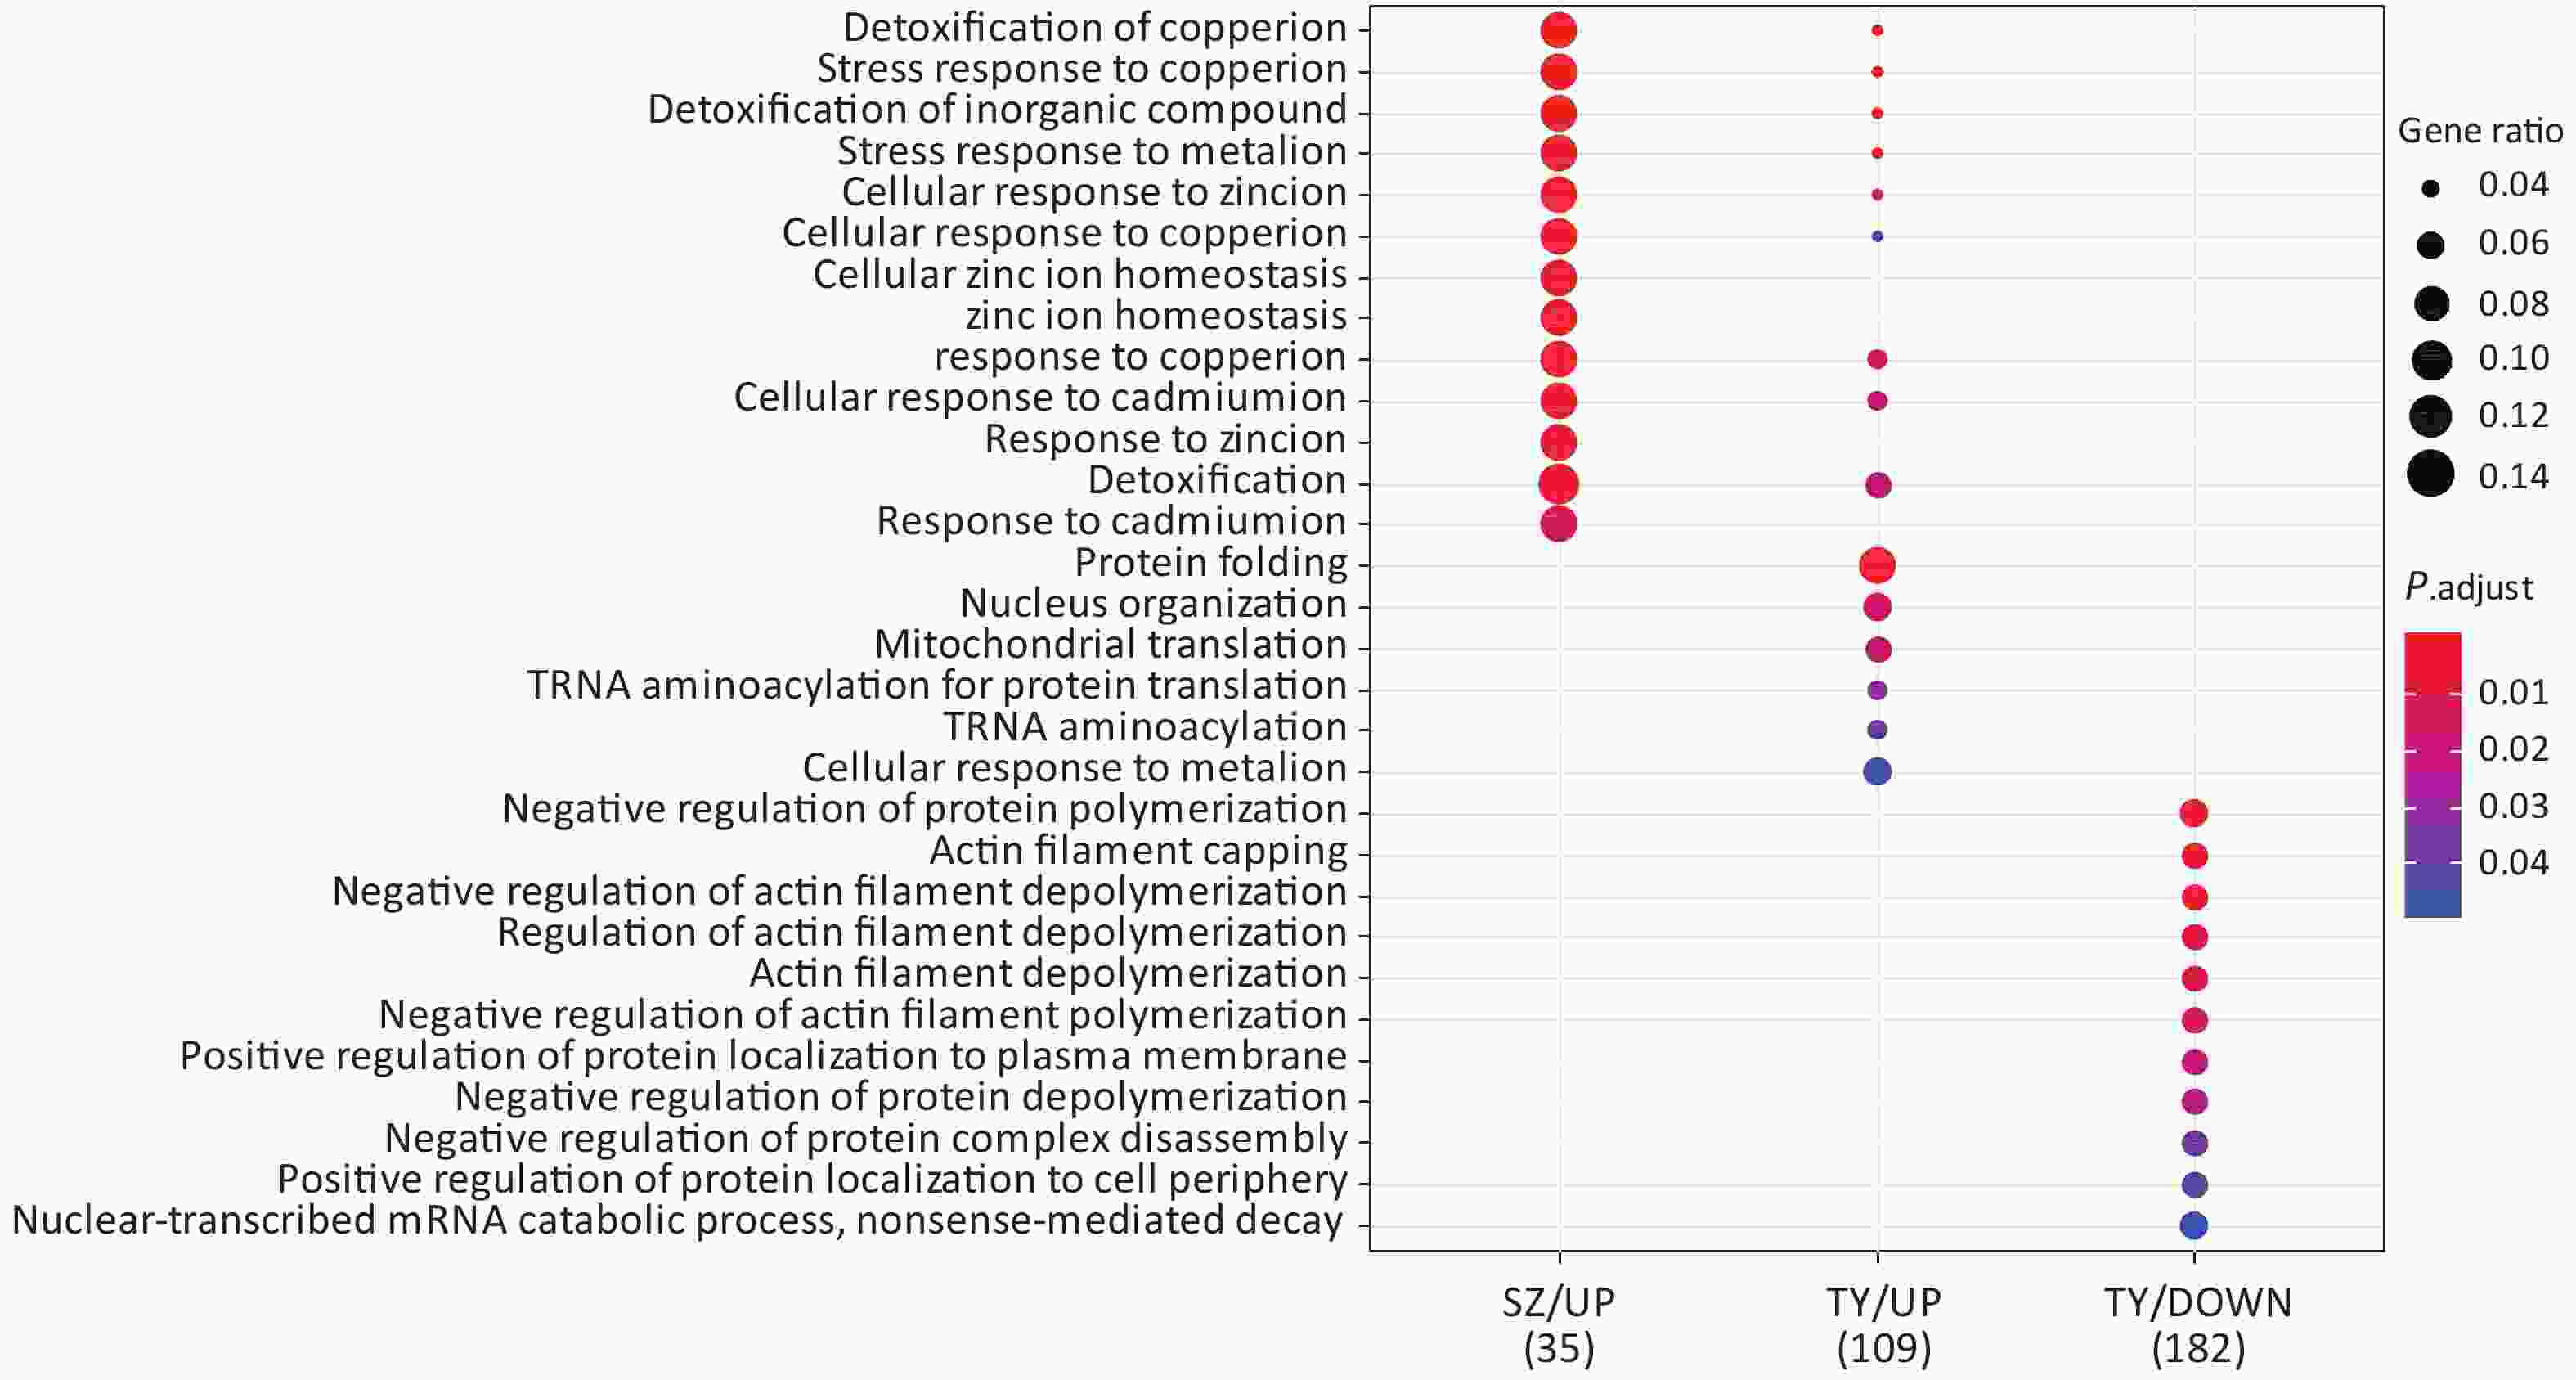
Figure 3. Biological process analysis of GO for differentially expressed proteins.
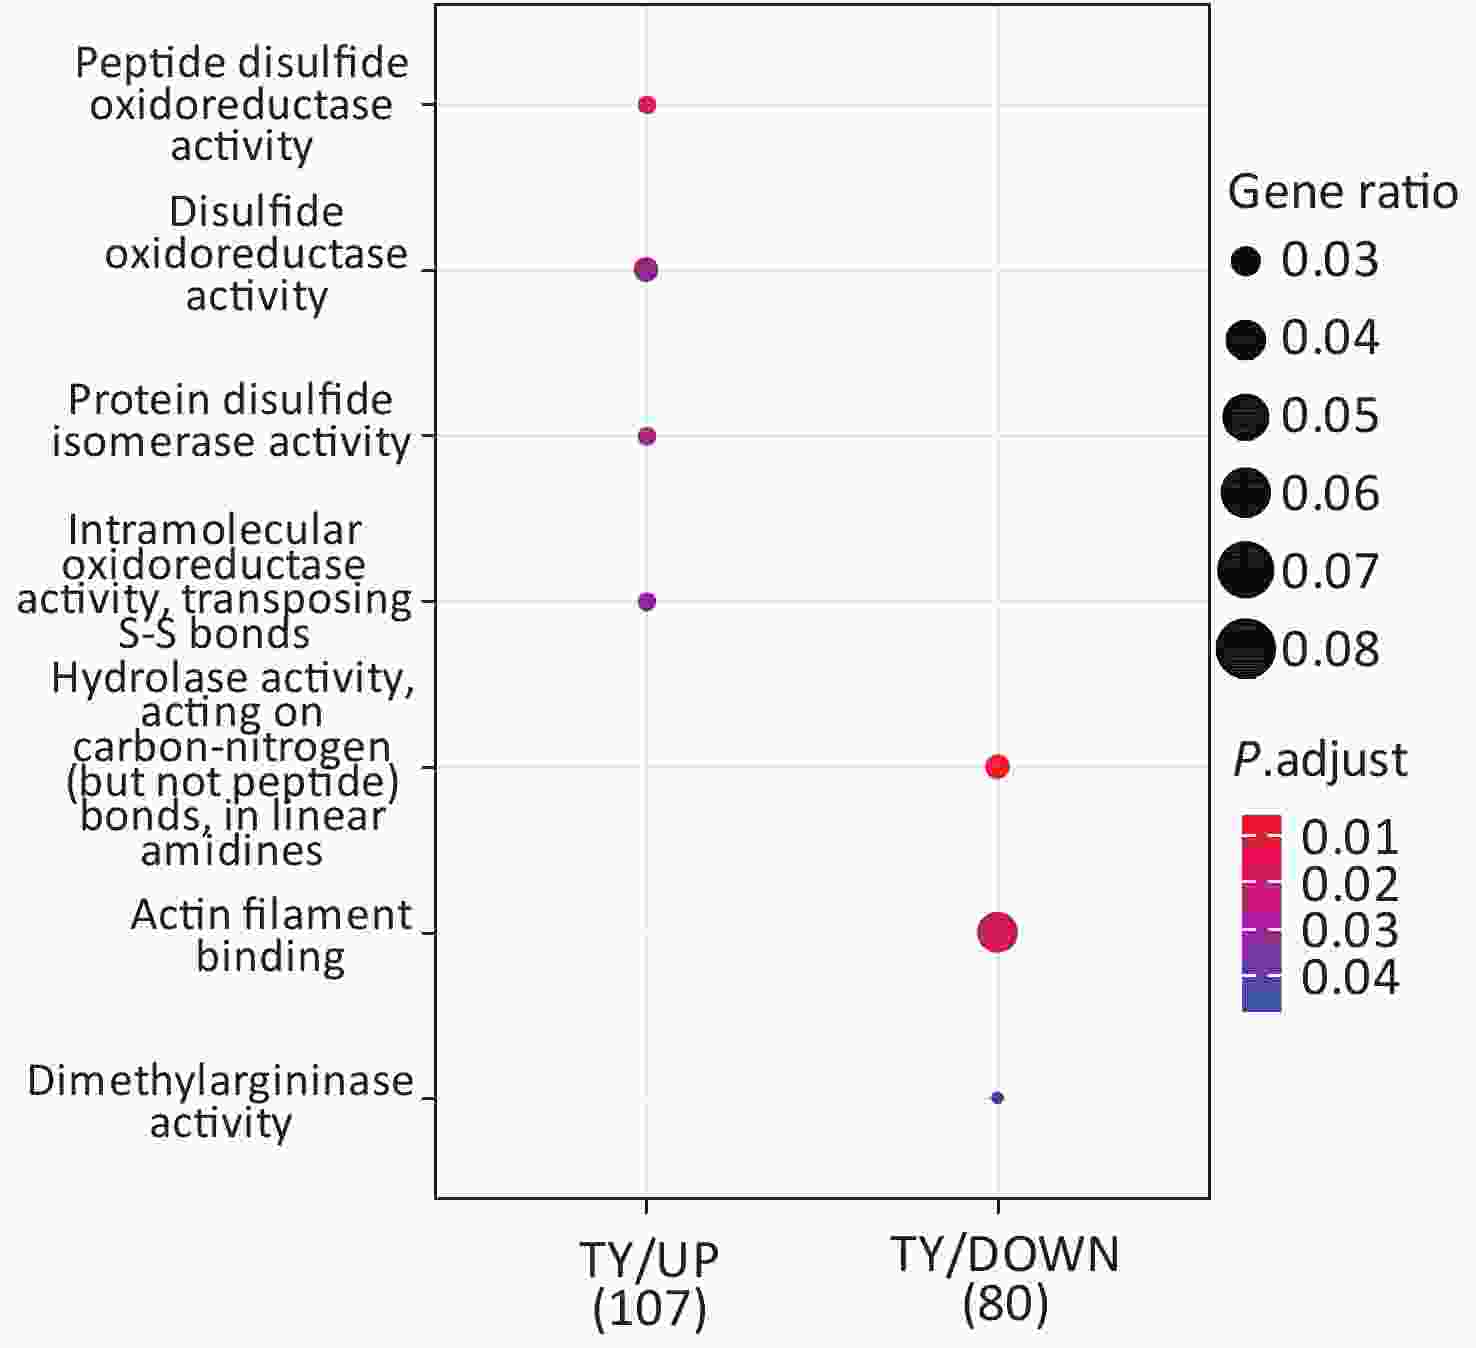
Figure 4. Molecular function analysis of GO for differentially expressed proteins. GO, Gene ontology.
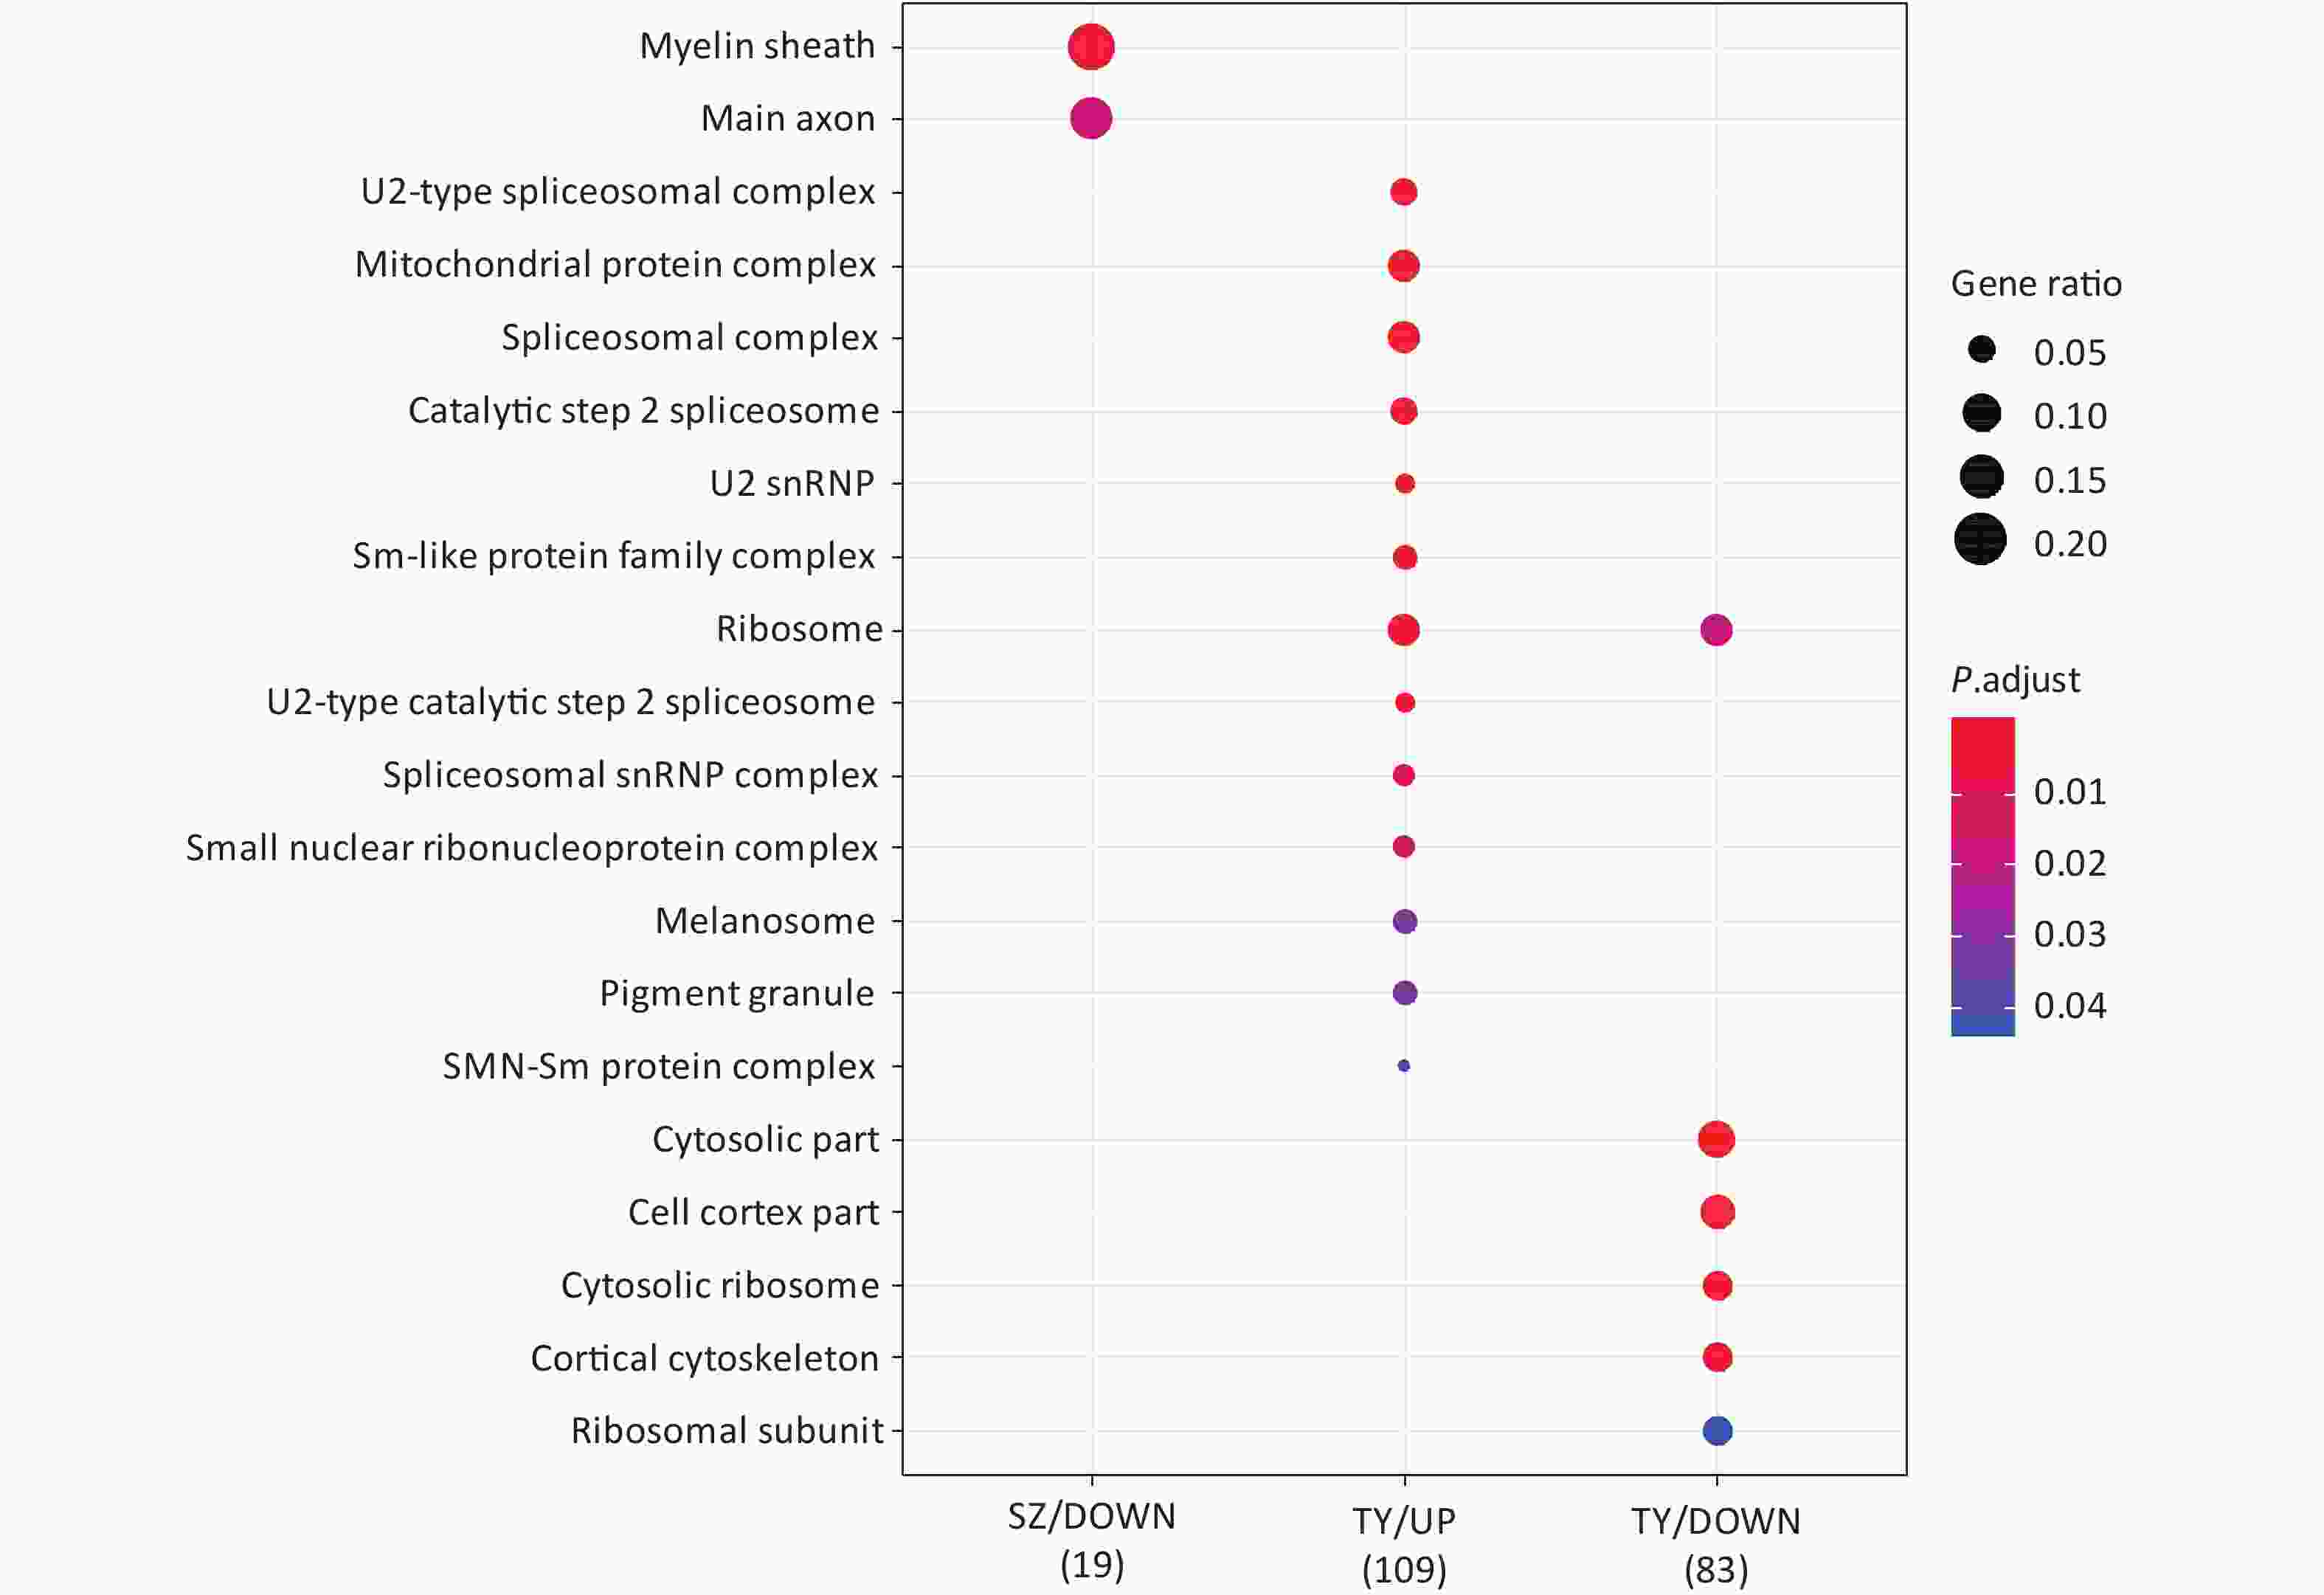
Figure 5. Cellular component analysis of GO for differentially expressed proteins. GO, Gene ontology
GO-BP enrichment analysis provided no information regarding proteins enriched in SZ down; in the GO-MF analysis, no information was obtained regarding proteins enriched in SZ up; and in GO-CC analysis, no information was available regarding proteins enriched in SZ up and TY down.
-
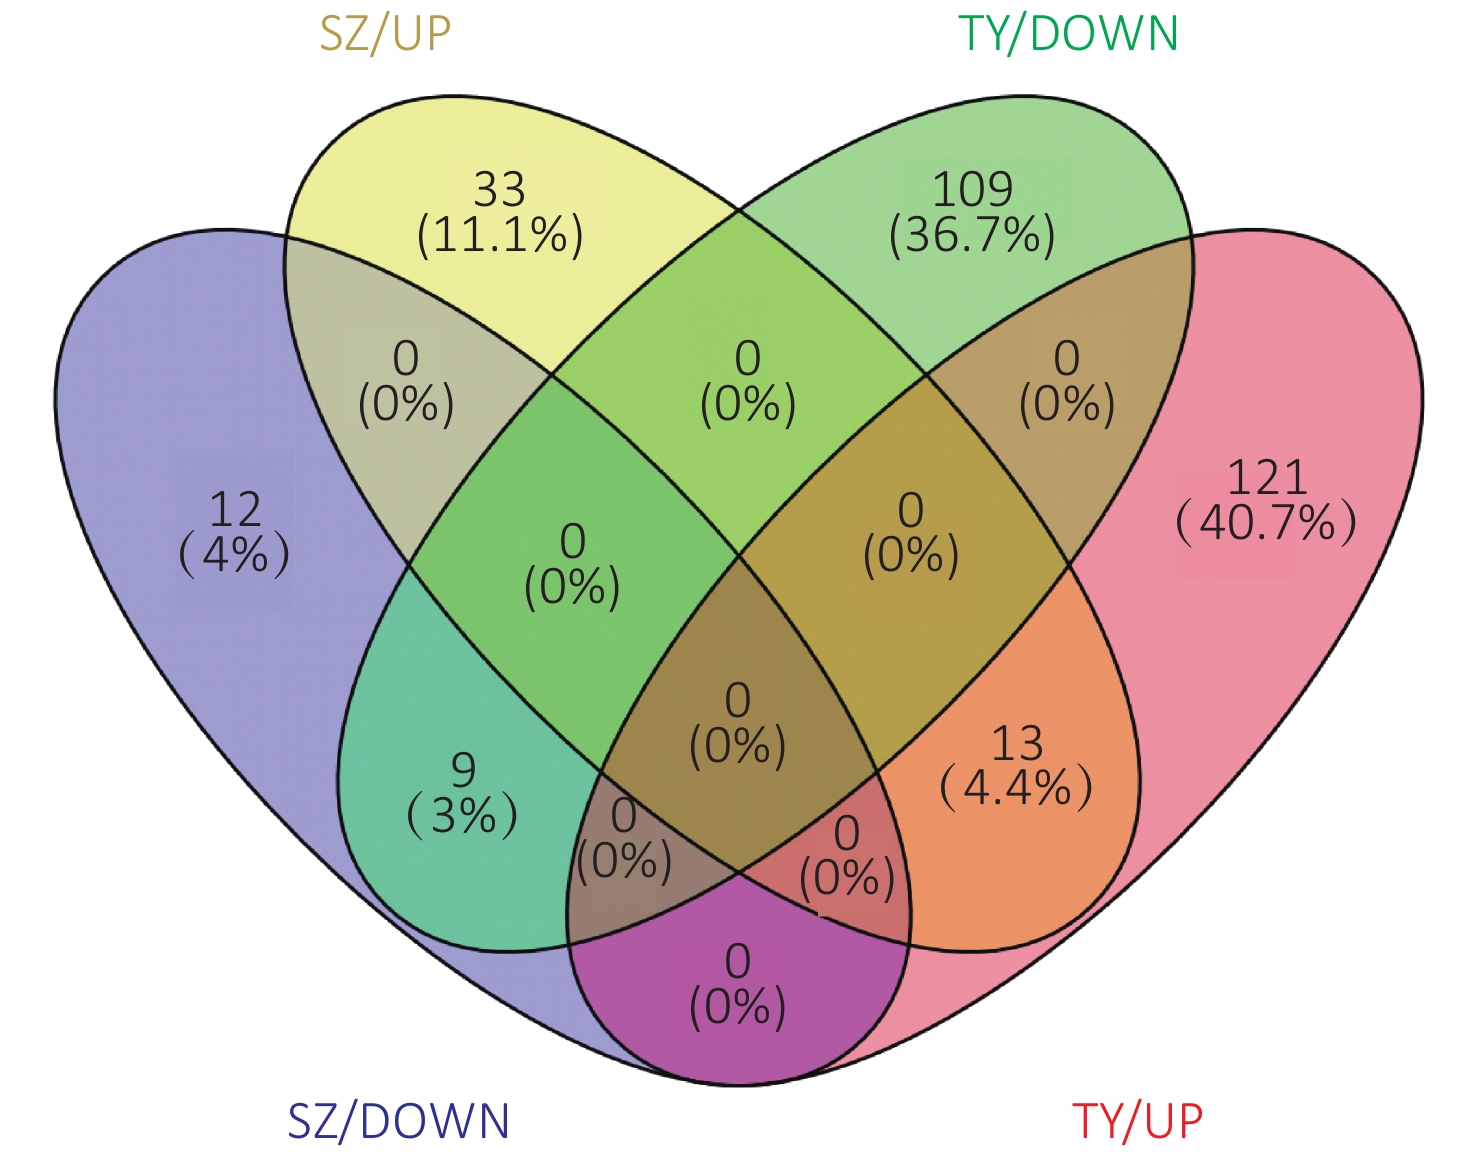
The Venn diagram of the DEPs is shown in Figure 6. Among them, 33 proteins were upregulated only in the Shenzhen samples, 12 proteins were downregulated only in the Shenzhen samples, 109 proteins were upregulated only in the Taiyuan samples, 121 proteins were downregulated only in the Taiyuan samples, 13 proteins were upregulated both in Shenzhen and Taiyuan samples, and 9 proteins were downregulated proteins both in Shenzhen and Taiyuan samples.
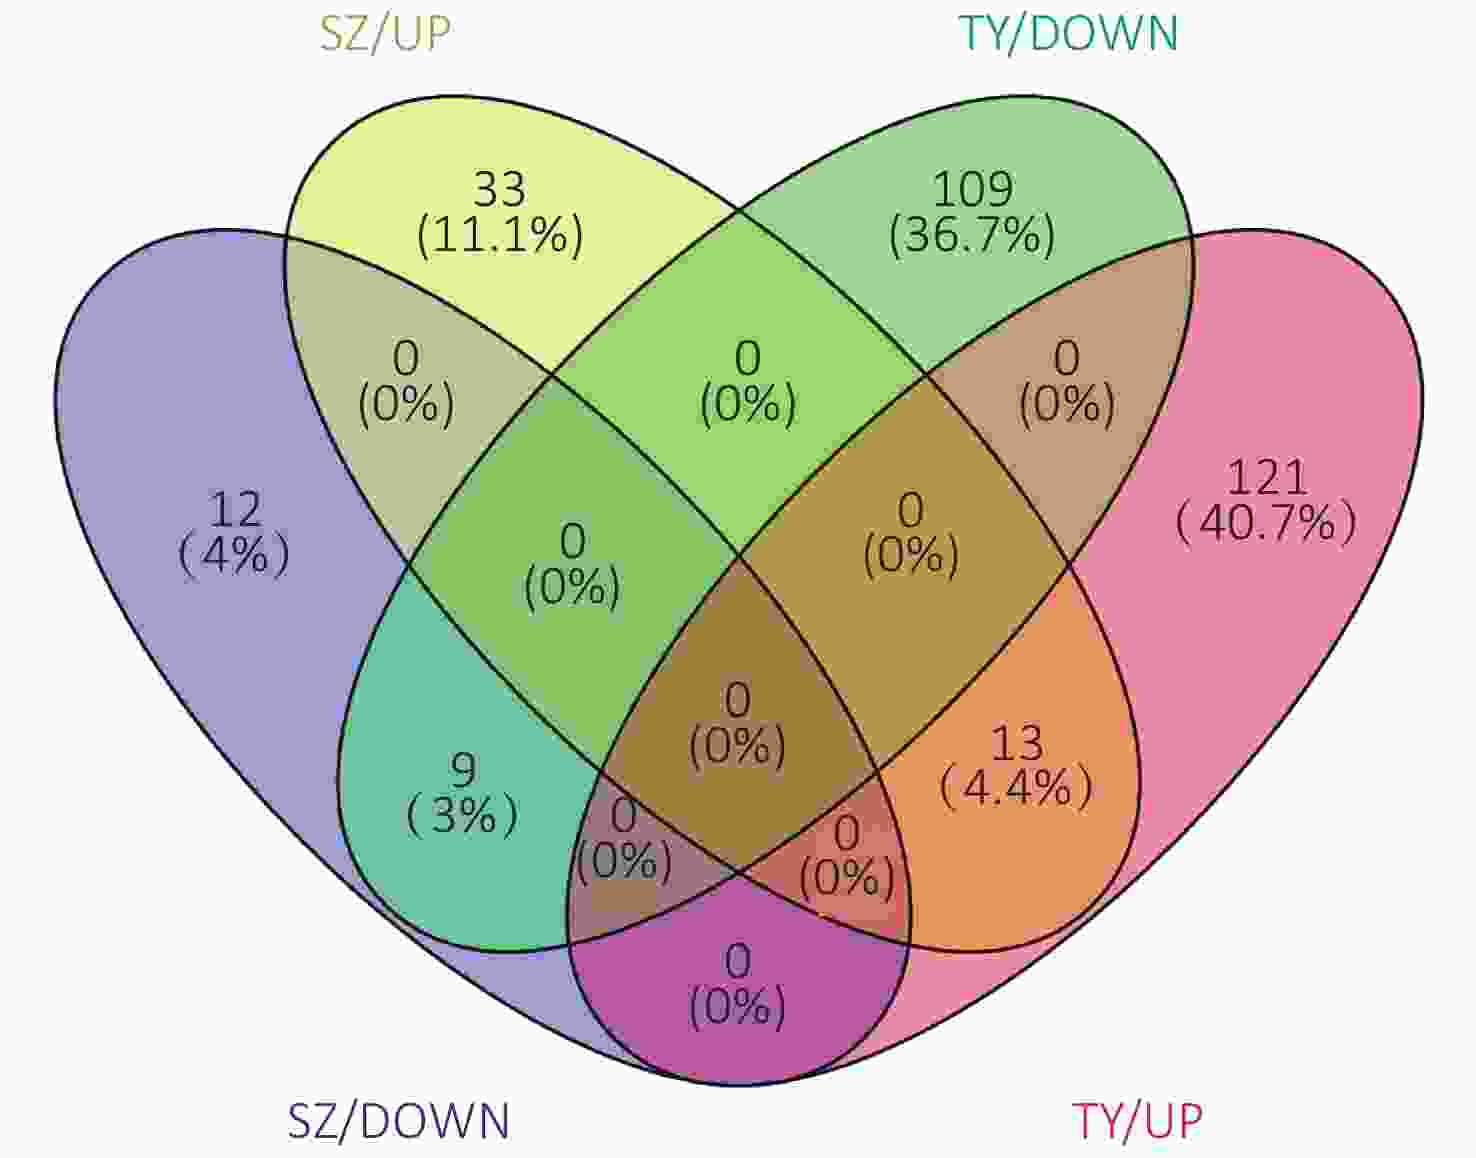
Figure 6. Venn plot of PM2.5-induced differentially expressed proteins.
-
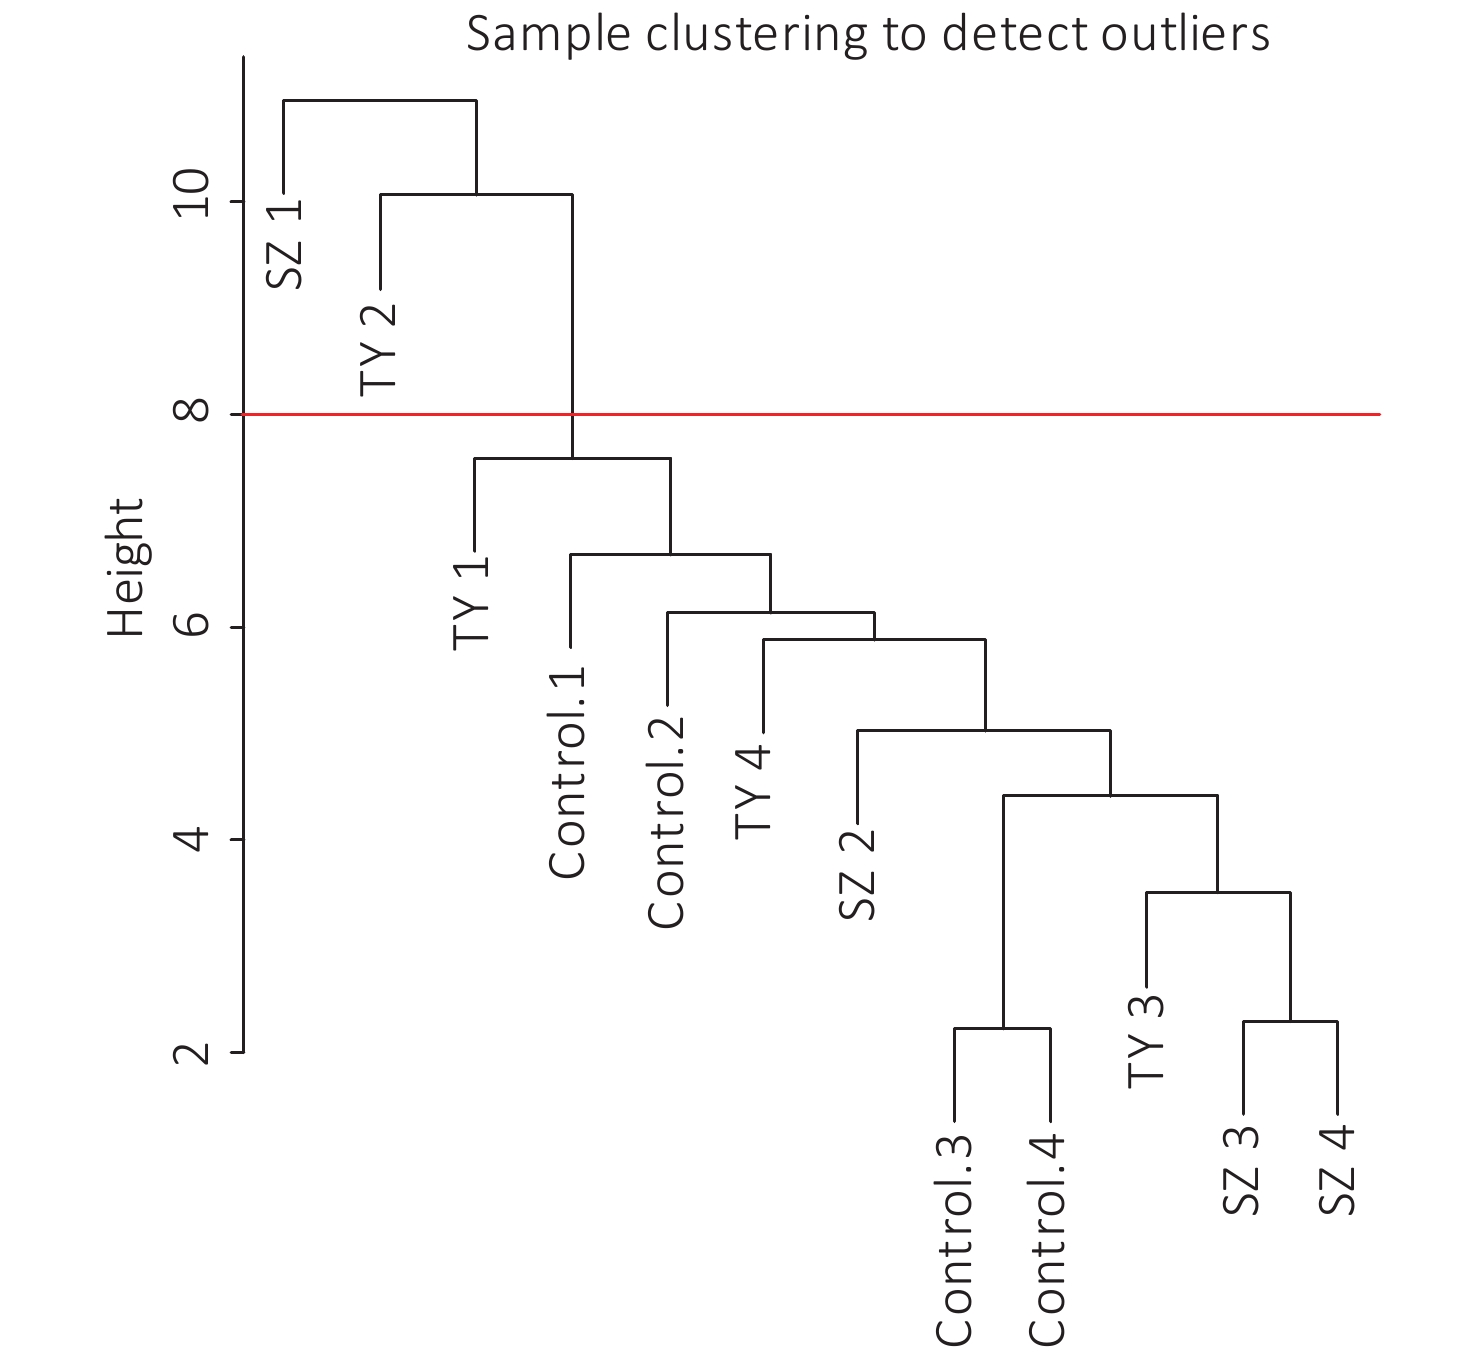
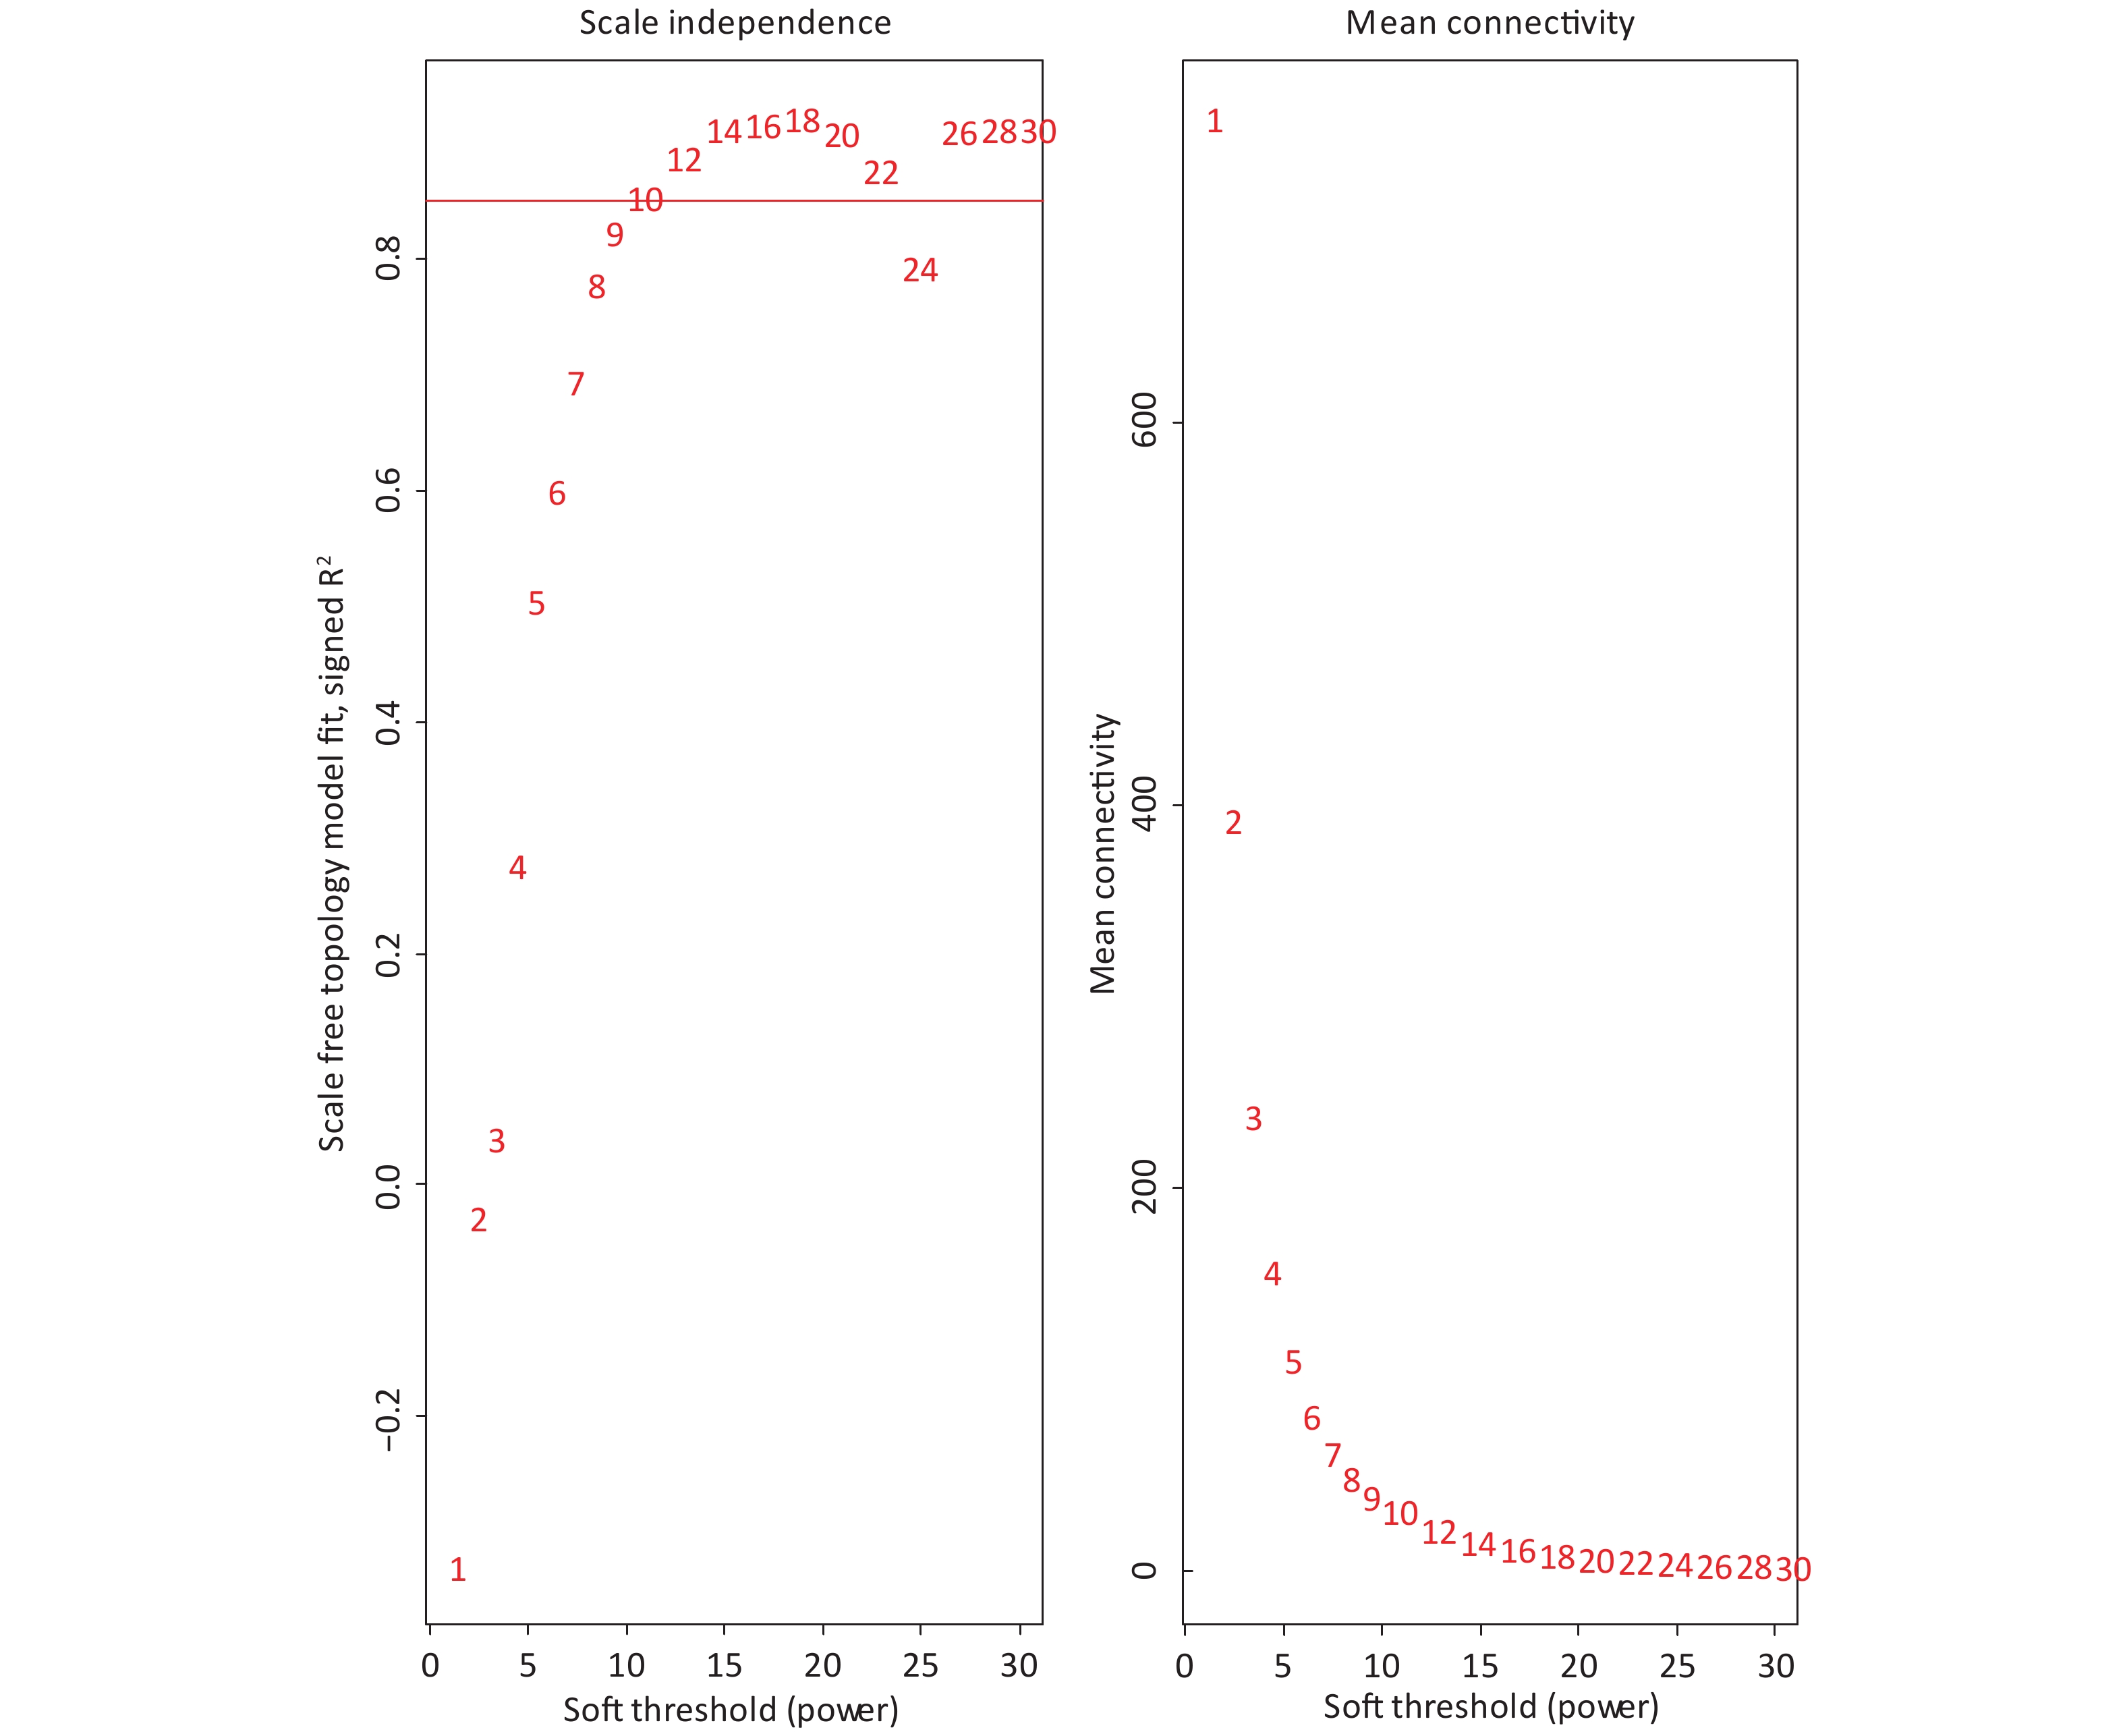
The 4,297 proteins detected in the Shenzhen sample group, the Taiyuan sample group, and the control group were used to construct a WGCNA co-expression network module. The hierarchical clustering of the samples was analyzed using the flashClust function. The clustering results are shown in Figure 7. For the 4,297 proteins, the power value of 10, the lowest power value for the scale with an independence degree of up to 0.85, was selected to construct a hierarchical clustering tree (Figure 8).
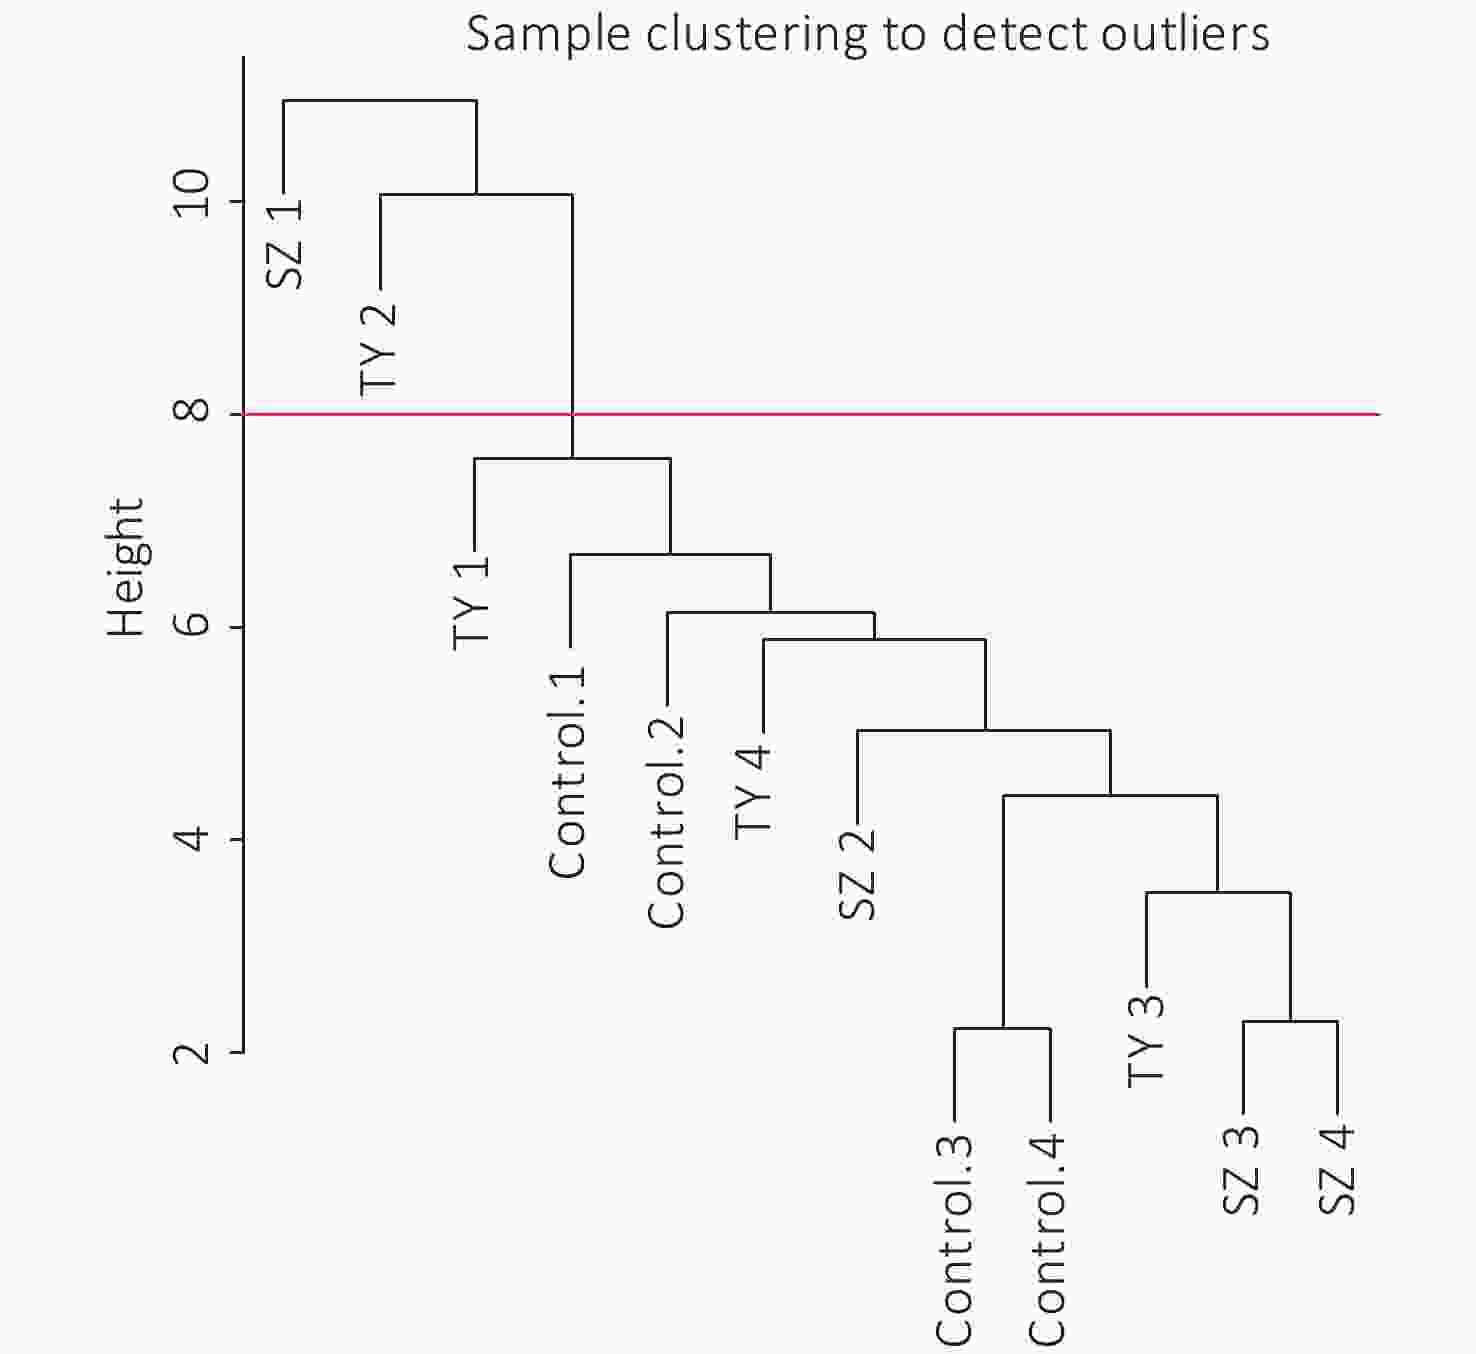
Figure 7. Sample clustering to detect outliers.
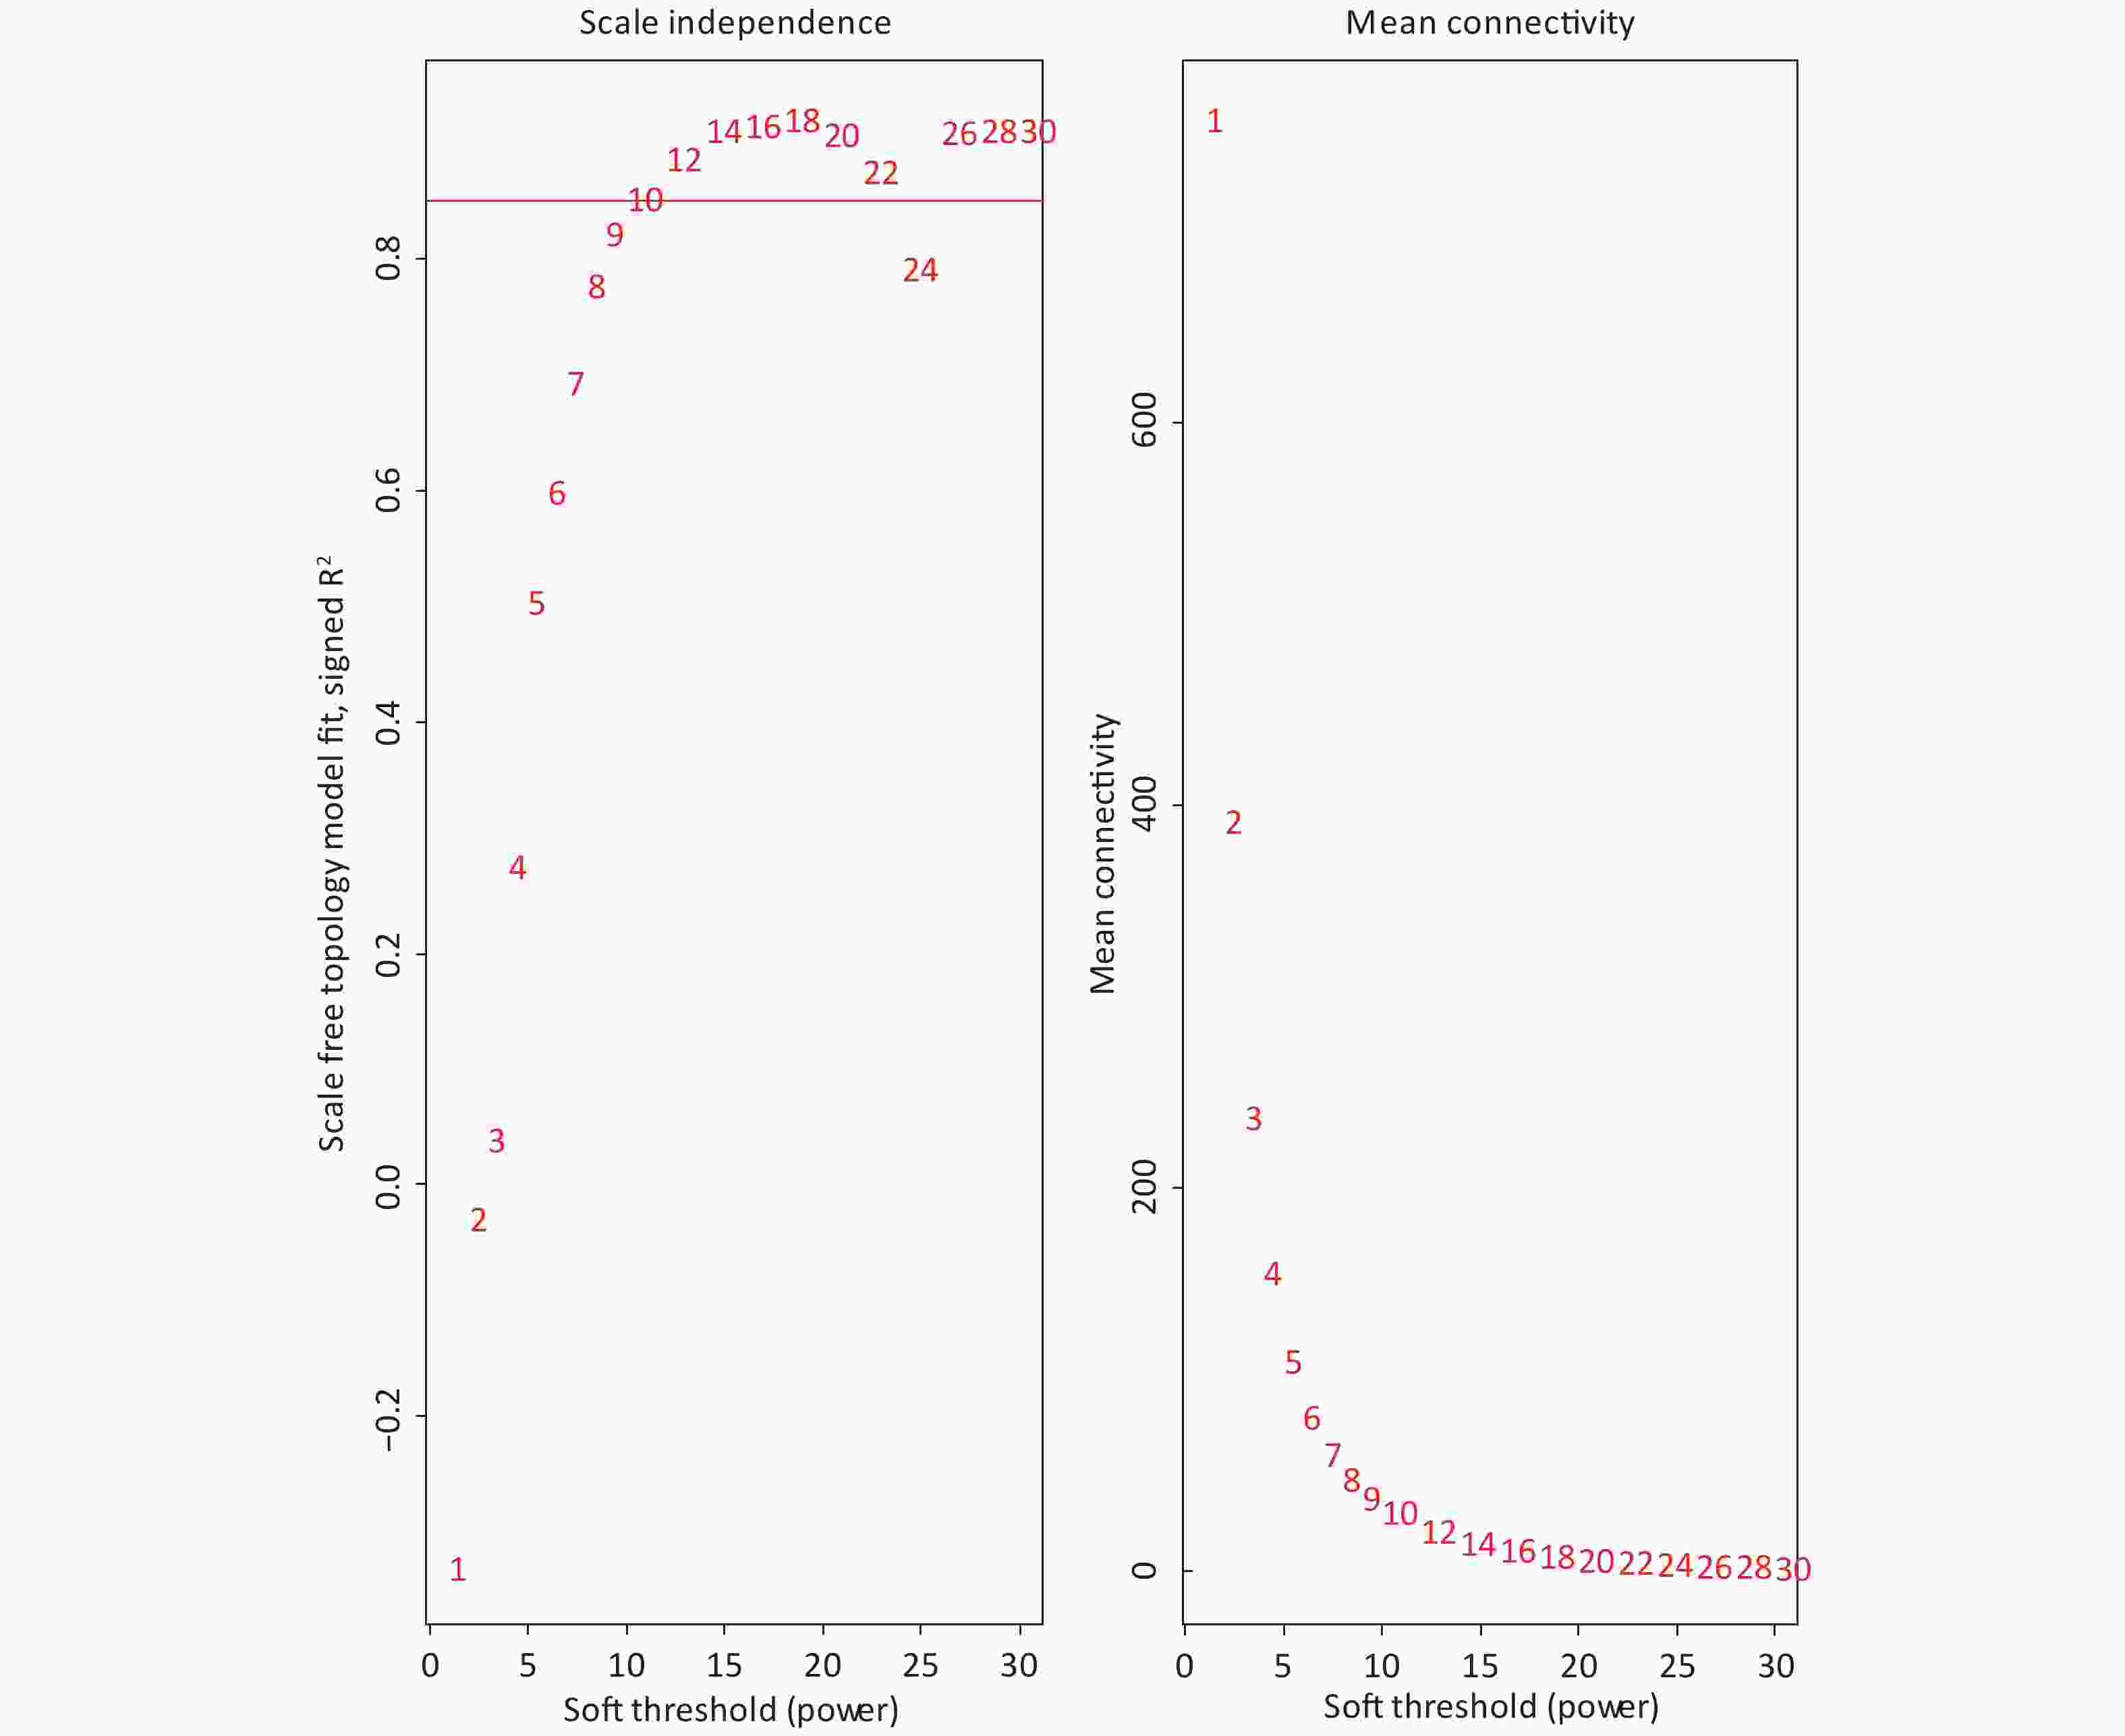
Figure 8. Analysis of network topology for a set of soft thresholding powers.
Based on the principle of a certain gap between each module and a certain number of modules, we screened out the color dynamic hybrid TOM in Figure 7 for subsequent analysis. For the 4,297 detected proteins, correlation network analysis was performed. The results demonstrated 39 modules, of which 7 modules presented P valves < 0.05. By establishing the threshold of the correlation coefficient as 0.8, we obtained 3 modules, with each module represented by one color, and proteins in the same module demonstrating a higher degree of correlation (Figure 8).
-
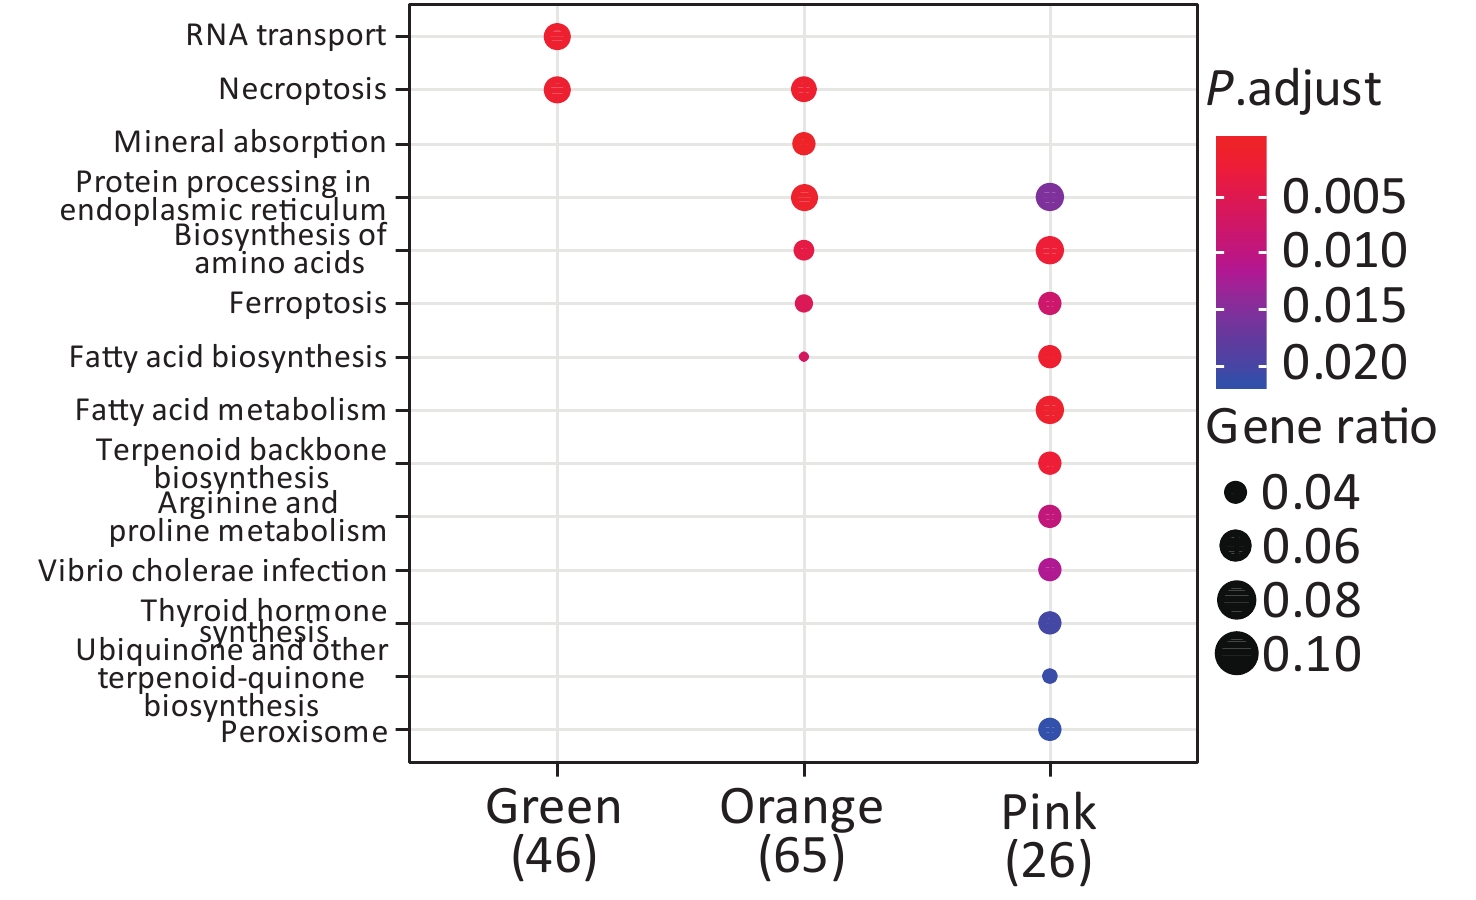
KEGG enrichment analysis was performed for proteins in the eight significant co-expression modules (Figure 9). Among them, the protein in the green module was mainly concentrated in RNA transport and necroptosis pathways; the protein in the orange module was mainly concentrated in pathways such as necroptosis, mineral absorption, and protein processing in the endoplasmic reticulum; the protein in the pink module was mainly concentrated in protein processing in the endoplasmic reticulum, biosynthesis of amino acids, and fatty acid metabolism pathways.

Figure 9. KEGG enrichment analysis of proteins in eight co-expression modules.
-
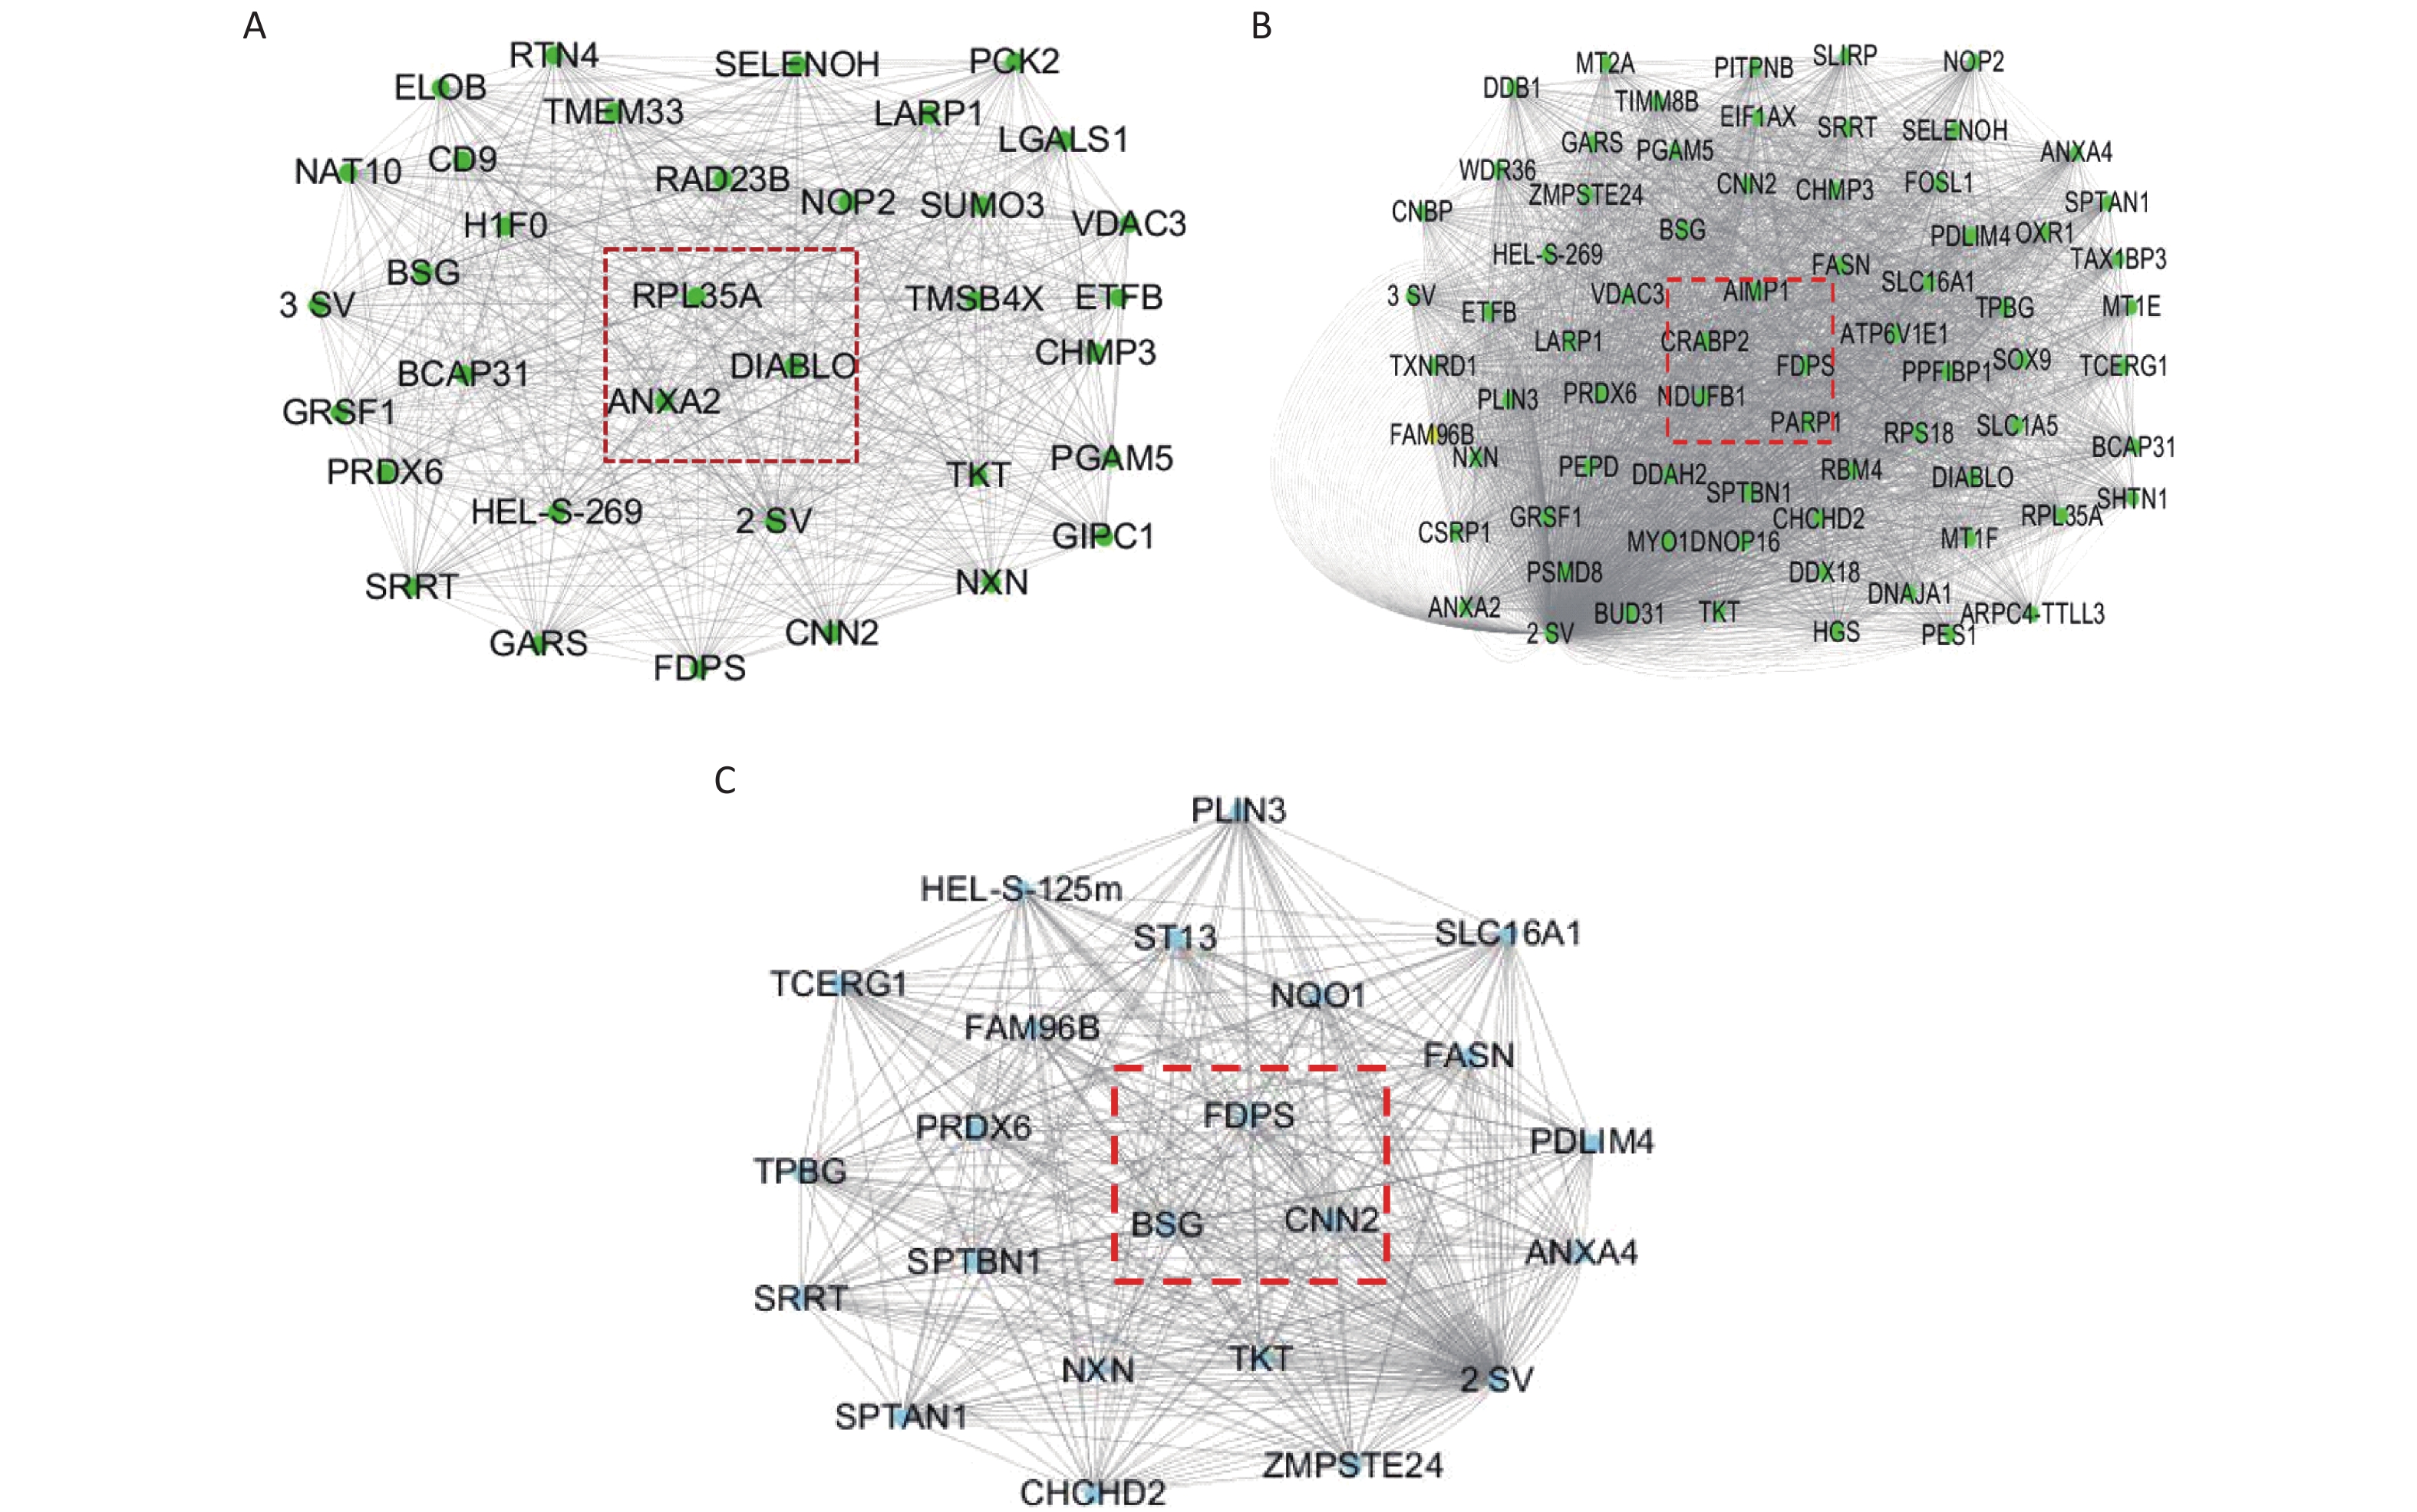
The Cytoscape software was used to build the module, as well as to calculate the connectivity within the module. The intramodular connectivity was calculated for each gene by adding the connection strengths with other module genes and dividing this number by the maximum intramodular connectivity. Genes with high intramodular connectivity are considered as intramodular hub genes. In this study, we obtained nine hub genes, including ANXA2, DIABLO, RPL35A, CRABP2, FDPS, AIMP1, NDUFB1, CNN2, and BSG (Table 1). As shown in Figure 10A, the central genes of the green module are ANXA2, DIABLO, and RPL35A. As shown in Figure 10B, the central genes of the orange module are PARP1, CRABP2, FDPS, AIMP1, and NDUFB1. As shown in Figure 10C, the central genes of the pink module are CNN2, BSG, and FDPS. Combined with the differential proteins obtained from the Perseus software analysis and the hub protein in the module, we screened nine key proteins, including annexin, TNF receptor-associated protein 1 variant, diablo homolog, mitochondrial, 60S ribosomal protein L35a, cellular retinoic acid-binding protein 2, farnesyl pyrophosphate synthase, aminoacyl tRNA synthase complex-interacting multifunctional protein 1, NDUFB1 protein, calponin, and basigin (Table 1).
Protein serial number Protein name Hub genes Molecular weight (kD) A0A024R5Z7 Annexin ANXA2 38.58 Q9NR28 Diablo homolog, mitochondrial DIABLO 27.11 P18077 60S ribosomal protein L35a RPL35A 12.53 P29373 Cellular retinoic acid-binding protein 2 CRABP2 15.68 P14324 Farnesyl pyrophosphate synthase FDPS 48.24 Q12904 Aminoacyl tRNA synthase complex-interacting multifunctional protein 1 AIMP1 34.33 Q3MHU6 NDUFB1 protein NDUFB1 9.97 B4DUT8 Calponin CNN2 35.92 P35613 Basigin BSG 42.174 Note. WGCNA, Weighted correlation network analysis. Table 1. The hub genes and differentially expressed proteins from WGCNA analysis
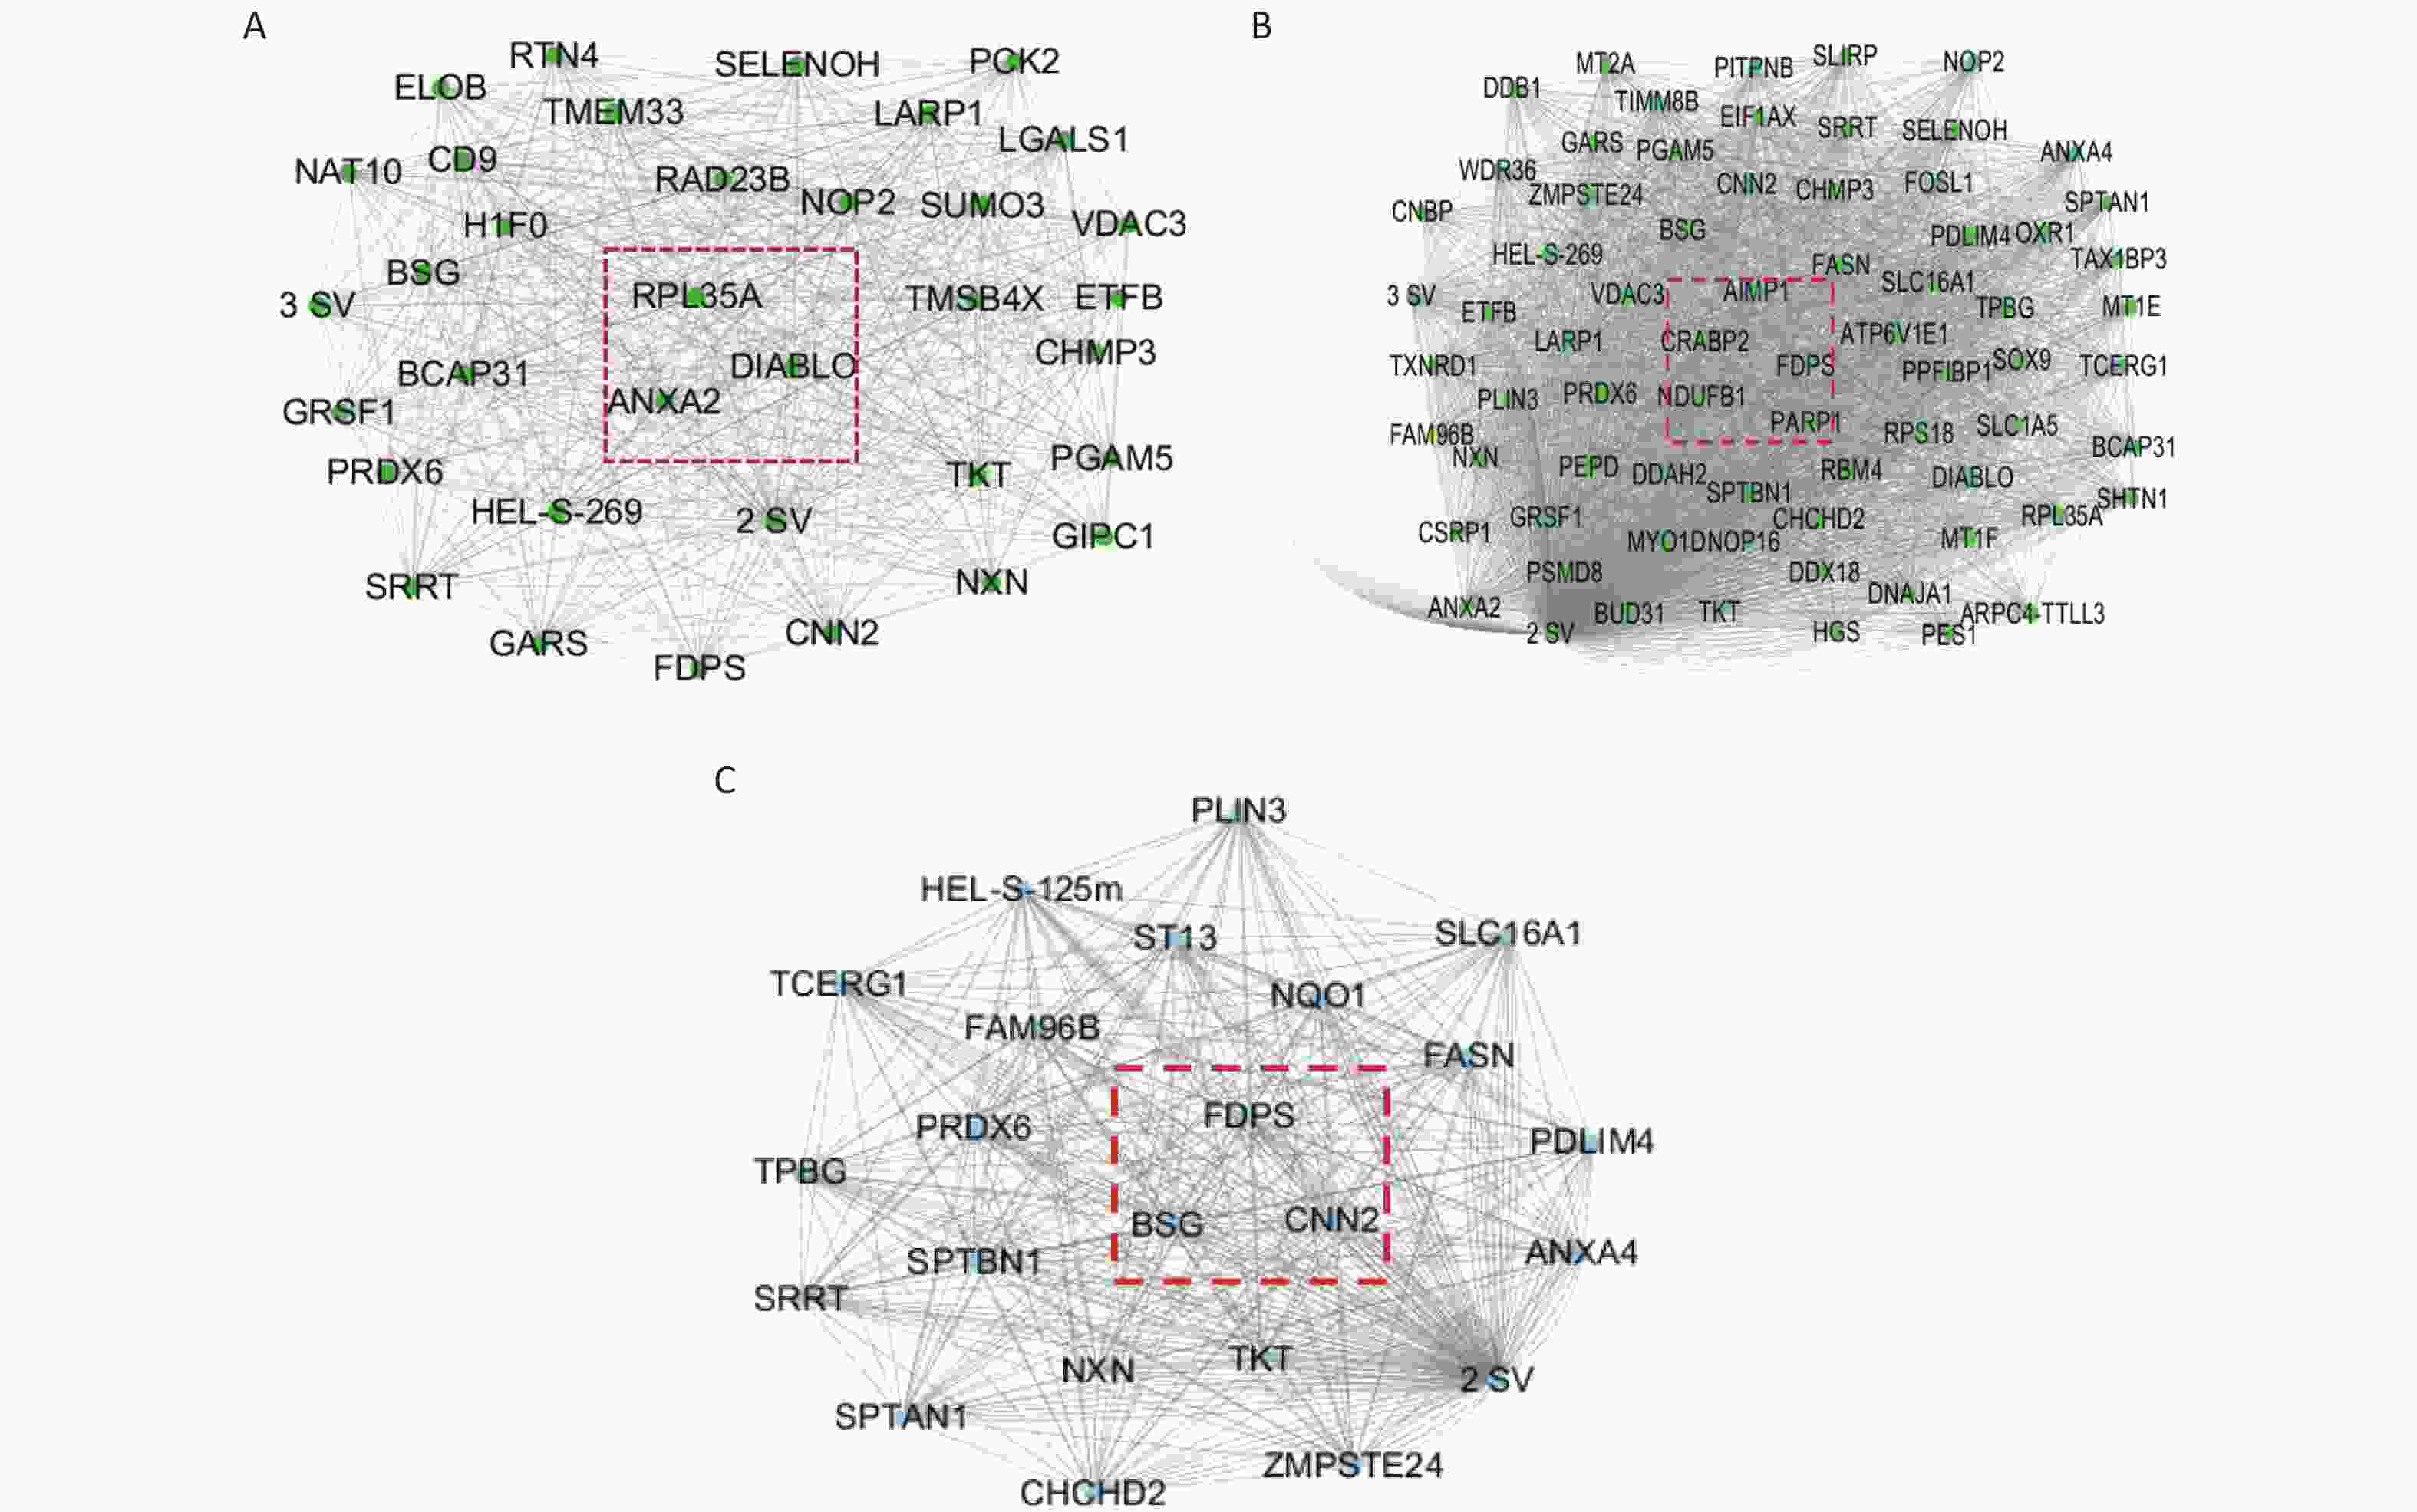
Figure 10. Hub genes and their corresponding proteins in the different modules. (A) Green module; (B) Orange module; (C) Pink module.
-
As gene products, proteins are directly involved in the execution of various functions of the body. Moreover, different stages of carcinogenesis have indicated the expression of different proteins. Proteomics can detect differences in protein expression in various tissues, cells, different stages of cellular development, and between cancer tissues and normal tissues, as well as treated cells and untreated cells; this could be utilized for the early diagnosis of tumors. Determining the molecular basis of prognosis, treatment targets, and carcinogenesis provides a more reliable basis.
On comparing the protein expression levels of the Shenzhen and the Taiyuan sample groups with the control group, a total of 67 differentially expressed proteins were screened out in Shenzhen samples, of which 46 proteins were upregulated and 21 proteins were downregulated. Additionally, 252 differentially expressed proteins were screened out in the Taiyuan samples, of which 134 proteins were upregulated and 118 proteins were downregulated.
Following KEGG analysis, it was noted that the DEPs were mainly enriched in ubiquitin-mediated proteolysis and HIF-1 signal pathways after the HBE cells were exposed to Shenzhen PM2.5 samples. GO analysis demonstrated that the DEPs in the Shenzhen samples were mainly involved in biological processes, including absorption of various metal ions, and CCs such as myelin sheath and axons; the differential proteins in the Taiyuan samples were mainly involved in the BP of protein aggregation and regulation, MF of oxidase activity, and CCs such as mitochondria and ribosomes.
The PM2.5 samples from Shenzhen and Taiyuan demonstrated explicit differences in biological processes following exposure of HBE cells to PM2.5, which are closely related to the differences observed in the PM2.5 components in the two cities.
Previously, we detected the composition of PM2.5 samples in Shenzhen and Taiyuan and observed differences between the two samples. The PM2.5 samples from Shenzhen and Taiyuan present significant differences in the heavy metal and PAHs content; the heavy metal (Pb, Mn, As, Ni) and PAH [acenaphthylene, fluorene, phenanthrene, anthracene, fluoranthene, pyrene, benzo (a) anthracene, benzo (a) pyrene] content in the Taiyuan PM2.5 sample is higher than that present in the Shenzhen PM2.5 sample. As well known, heavy metals and PAHs play an important role in cytotoxicity, resulting in a significant difference between the BP of PM2.5 samples from the two cities, after the treatment of HBE cells with PM2.5.
To explore the function of differential proteins induced by PM2.5 samples from Shenzhen and Taiyuan, the WGCNA package in the R software was used to perform a correlation network analysis of all proteins, presenting three modules, of which the orange module included the largest number of proteins. Regarding the process of PM2.5 carcinogenesis, it may demonstrate more significant biological functions than other modules. Combined with the DEPs obtained from the analysis of Perseus software and the hub proteins in the module, we determined nine key proteins, including annexin, diablo homolog, mitochondrial, 60S ribosomal protein L35a, cellular retinoic acid-binding protein 2, farnesyl pyrophosphate synthase, aminoacyl tRNA synthase complex-interacting multifunctional protein 1, NDUFB1 protein, calponin, and basigin.
Wang et al.[25] has reported that proteins such as annexin A2 (ANXA2) and translationally controlled tumor protein in cisplatin-resistant A549R cells, involved in anti-apoptosis or autophagy promotion, are highly expressed. Paul et al.[26] have shown that the mitochondrial pro-apoptotic protein SMAC/Diablo participates in apoptosis by negatively regulating inhibitors of apoptosis proteins (IAPs) and activating caspases, thus encouraging apoptosis. Gao et al.[27] has reported that the AIMP1 protein is highly expressed in laryngeal squamous carcinoma cells, and inhibition of AIMP1 expression can inhibit the proliferation, migration, and invasion of laryngeal squamous carcinoma cells. Based on previous reports, we speculate that ANXA2, DIABLO, and AIMP1, DEPs obtained from this study, play an important role in the development of tumors and diseases. Hence, the three above-mentioned proteins will be valuable and could provide important scientific evidence for further study.
In summary, this study demonstrated that Shenzhen and Taiyuan PM2.5 samples have differential effects on HBE cells in BP, MF, and CC. Additionally, we observed nine hub genes (ANXA2, DIABLO, RPL35A, CRABP2, FDPS, AIMP1, NDUFB1, CNN2, and BSG) and their corresponding proteins; the three valuable and differentially expressed proteins include ANXA2, DIABLO, and AIMP1. These findings indicate that PM2.5 affects several important physiological and biochemical processes and signaling pathways, and is related to the occurrence and development of many diseases. Our data provided a scientific basis for further research on the molecular mechanism of PM2.5 carcinogenesis.
Characteristics of Atmospheric Fine Particulate Matter (PM2.5) Induced Differentially Expressed Proteins Determined by Proteomics and Bioinformatics Analyses
doi: 10.3967/bes2020.077
Funds:
This project was supported by the basic research programs of Shenzhen Science and Technology Innovation Committee to XU Xin Yun [JCYJ20170413101713324]; Shenzhen Key Medical Discipline Construction Fund [SZXK067]
- Received Date: 2020-02-11
- Accepted Date: 2020-05-01
-
Key words:
- PM2.5 /
- Proteomics /
- Bioinformatics /
- Differentially expressed proteins /
- Weighted correlation network analysis
Abstract:
| Citation: | ZHENG Kai, CAI Ying, WANG Bing Yu, QIN Shuang Jian, LI Bo Ru, HUANG Hai Yan, QIN Xiao Yun, LONG Ding Xin, ZHANG Zhao Hui, XU Xin Yun. Characteristics of Atmospheric Fine Particulate Matter (PM2.5) Induced Differentially Expressed Proteins Determined by Proteomics and Bioinformatics Analyses[J]. Biomedical and Environmental Sciences, 2020, 33(8): 583-592. doi: 10.3967/bes2020.077

|

 Quick Links
 DownLoad: