

-
Long-term cell phone use has increased concerns about the potential biological effects of electromagnetic fields (EMFs). Numerous studies on the harmful effects of EMFs on vital organs have been conducted over the last decade, but their results are inconclusive[1,2,3]. The Global System for Mobile Communications (GSM) operates at different frequency bands, but the 850–900 and 1,850–1,990 MHz frequencies are the most popular standard for cell phones worldwide[4].
As a protective structural and chemical border, the blood-brain barrier keeps the environment in the central nervous system as stable as possible. Under normal physiological conditions, the selective permeability of the blood-brain barrier restricts the passage of many substances into the central nervous system. This property may be due to endothelial cells and their junctional complex in the blood-brain barrier. Accordingly, the function and structure of nerve cells are preserved. The interaction between the potential risk factor and the blood-brain barrier may cause neurological disorders[5]. Environmental exposure to EMFs can be considered a serious threat to the central nervous system due to the change in the permeability of the blood-brain barrier[6,7]. Toxic molecules caused by EMFs may leak into the central nervous system, thereby damaging nerve cells[8]. Kim et al.[9] documented the detrimental effect of EMFs on the structures and functions of the central nervous system. EMFs can be absorbed into the central nervous system, leading to cognitive dysfunction[10].
The endogenous antioxidant enzyme system plays an important role in the maintenance of oxidative balance via the elimination of free radicals in an organism’s body[11]. The disruption of oxidative balance caused by EMFs may result in an overproduction of reactive oxygen species (ROS)[12]. Subsequently, interaction between ROS and vital tissues can trigger chain reactions, such as lipid peroxidation, which may damage lipids, proteins, carbohydrates, and nucleic acids. At the cellular level, increased oxidative stress may lead to destructive body tissue damage. ROS can also induce apoptotic and necrotic cell death directly or indirectly[11]. The central nervous system is susceptible to the excessive production of free radicals. The regional accumulation of oxidative damage to nerve tissues is possibly due to regional differences in antioxidant system activities, as well as variable metabolic rates[13,14]. The spinal cord (SC) as a receptor antenna may contribute to EMF energy leakage into nerve tissue, thus inducing neurotoxicity[15,16]. Excessive ROS production after exposure to EMF can cause oxidative damage to the spinal tissue[17].
Luteolin (3′, 4′, 5, 7-tetrahydroxyflavone, LUT) is an important flavone and natural antioxidant found in several plant species[1]. Natural glycosylated LUT is available in different fruits and vegetables, such as broccoli, pepper, thyme, and celery[18,19]. Epidemiological studies have shown that the high consumption of LUT-containing foods can reduce the risks of chronic diseases[17]. The pharmacological activities of LUT are also derived from its antioxidant, anti-inflammatory, anticancer, neuroprotective, and antineoplastic properties[20].
Our study was conducted to investigate the deleterious effect of 900 MHz EMF exposure on rat cervical SC (CSC) tissues and evaluate whether LUT administration could weaken the harmful effects of EMF.
-
The ethical approval of the present study was granted by Laboratory Animal Ethics Committee of Ondokuz Mayıs University. All rats were purchased from the Experimental Animal Research and Application Center of Medicine Faculty of Ondokuz Mayıs University Samsun, Turkey. Twenty-four adult male Wistar albino rats (200 g body weight and 12 weeks old) were used. The rats were randomly selected and maintained in plastic cages under a 12:12 h day/night cycle at a temperature of (22 ± 2 ) °C and humidity of 50% ± 5%. Animals had ad libitum access to food and water during the 28-d experimental period. All rats were randomly assigned into the following four groups (n = 6 per group):
1. Control group: rats were not exposed to EMF, any substance, and stress during the 28-d experimental period. They were only kept in a plastic cage with ad libitum access to food and water.
2. EMF group: rats were exposed to 900 MHz EMF for 1 h/d for 28 d and treated with no substance.
3. LUT group: rats were treated intraperitoneally (i.p.) with LUT dissolved in dimethyl sulfoxide [20 µg/(kg·d); Sigma-Aldrich, St. Louis, MO, USA] for 28 d[21].
4. EMF + LUT group: Rats were not only exposed to 900 MHz EMF for 1 h/d but also treated i.p. with LUT [20 µg/(kg·d); Sigma-Aldrich, St. Louis, MO, USA] during the experiment period.
At the end of the experiment period, cardiac perfusion was performed on all rats under anesthesia by injecting a 5:1 ratio of ketamine/xylazine (ketamine: 0.5 mL, xylazine: 0.1 mL; Sigma Chemical Comp, St. Louis, MO, USA). A 80 mg/kg dose of ketamine is safe as an anesthetic drug but a poor skeletal muscle relaxant; therefore, 10 mg/kg xylazine was administered to induce skeletal muscle relaxation[22]. Then, the CSC tissues were immediately removed and cut into two unequal parts. We used the CSC samples at the C6–C7 level for immunohistochemical, stereological, and histopathological investigation. The rest of the samples at the C1–C5 level was stored at −80 °C for biochemical analysis.
-
EMF exposure procedure was performed in accordance with Yahyazadeh and Altunkaynak[23]. We used a device that generates a 900 MHz continuous electromagnetic wave, with a peak specific absorption rate (SAR) of 2 W/kg and an average power density of (1 ± 0.4) mW/cm2[20,24]. This generator was manufactured by the Electromagnetic Compatibility Laboratory of Suleyman Demirel University. The localized SAR values were calculated in accordance with the procedure reported by Sirav and Seyhan[6]. Power density was also measured using an EMF meter (Holaday Industry Inc., Adapazarı, Turkey). During EMF exposure, the monopole antenna of the exposure system was perpendicularly located in the center of the round plastic cage. The long axis of the antenna was perpendicular to the long axis of the rats to ensure an equal electric field distribution[24]. Rats were freely placed in the small chambers of the cages; these chambers were separated using thick plastic sheets. Moreover, the rats’ heads were positioned in the direction of the antenna, with a distance of 1 cm from the antenna[2]. A 1 cm-diameter air hole was created on the lid of the plastic cage to reduce stress. Lastly, the rats were exposed to 900 MHz EMF for 1 h/d for 28 d at an environmental temperature of (22 ± 2) °C.
-
Dissected CSC samples were fixed in 10% formalin solution, followed by tissue processing, which includes dehydration, clearing, and embedding. Through the use of a rotary microtome, consecutive sections were cut at a thickness of 7 μm and in an interval of 1/140. These sections were selected on the basis of a systematic random sampling technique. The CSC paraffin sections were then mounted on glass slides and stained with cresyl violet for stereological and histological examination[24]. All sections were photographed using an HD digital camera (Leica Microsystems Ltd., CH 9435, Heerbrugg, Switzerland) and a Leica DM2500 LED microscope (Leica Microsystems CMS GmbH, Wetzlar, Germany). We scored motor neuron degeneration and motor neurons with sparse Nissl substance as follows: 0, none; 1, mild; 2, moderate; 3, severe in the CSC samples.
-
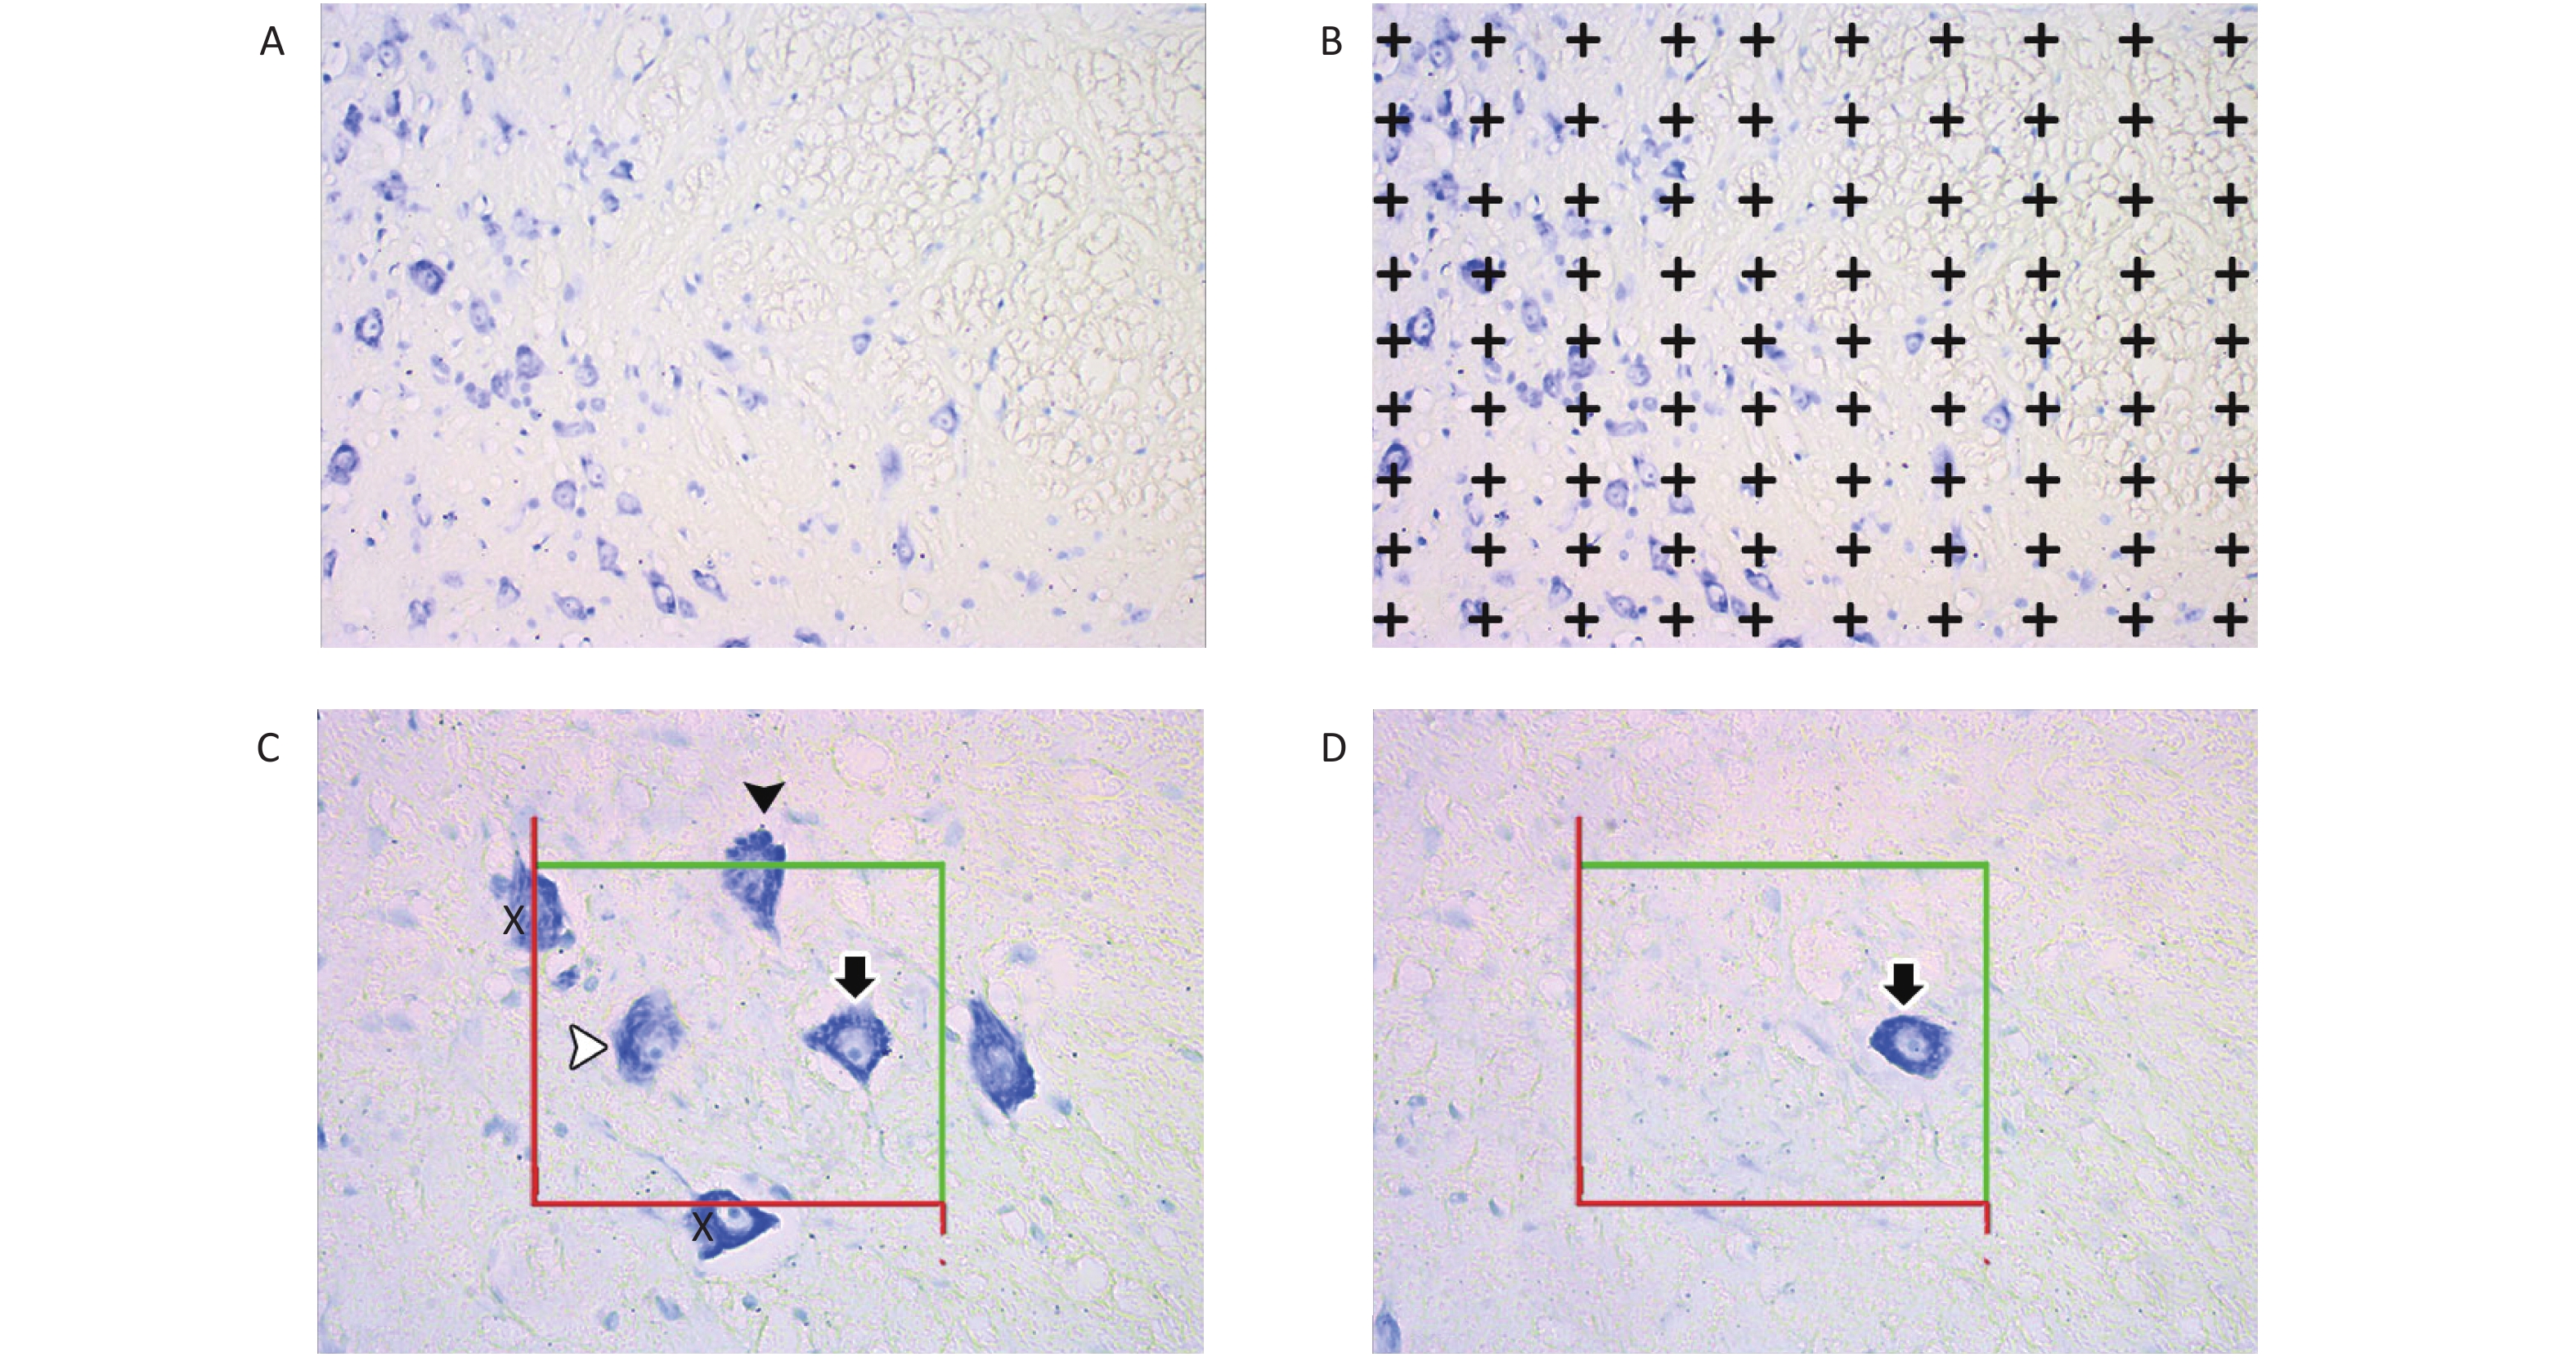
The unbiased physical dissection and Cavalieri methods were used to estimate the number of motor neurons and the mean volume of CSC tissues (Figure 1).
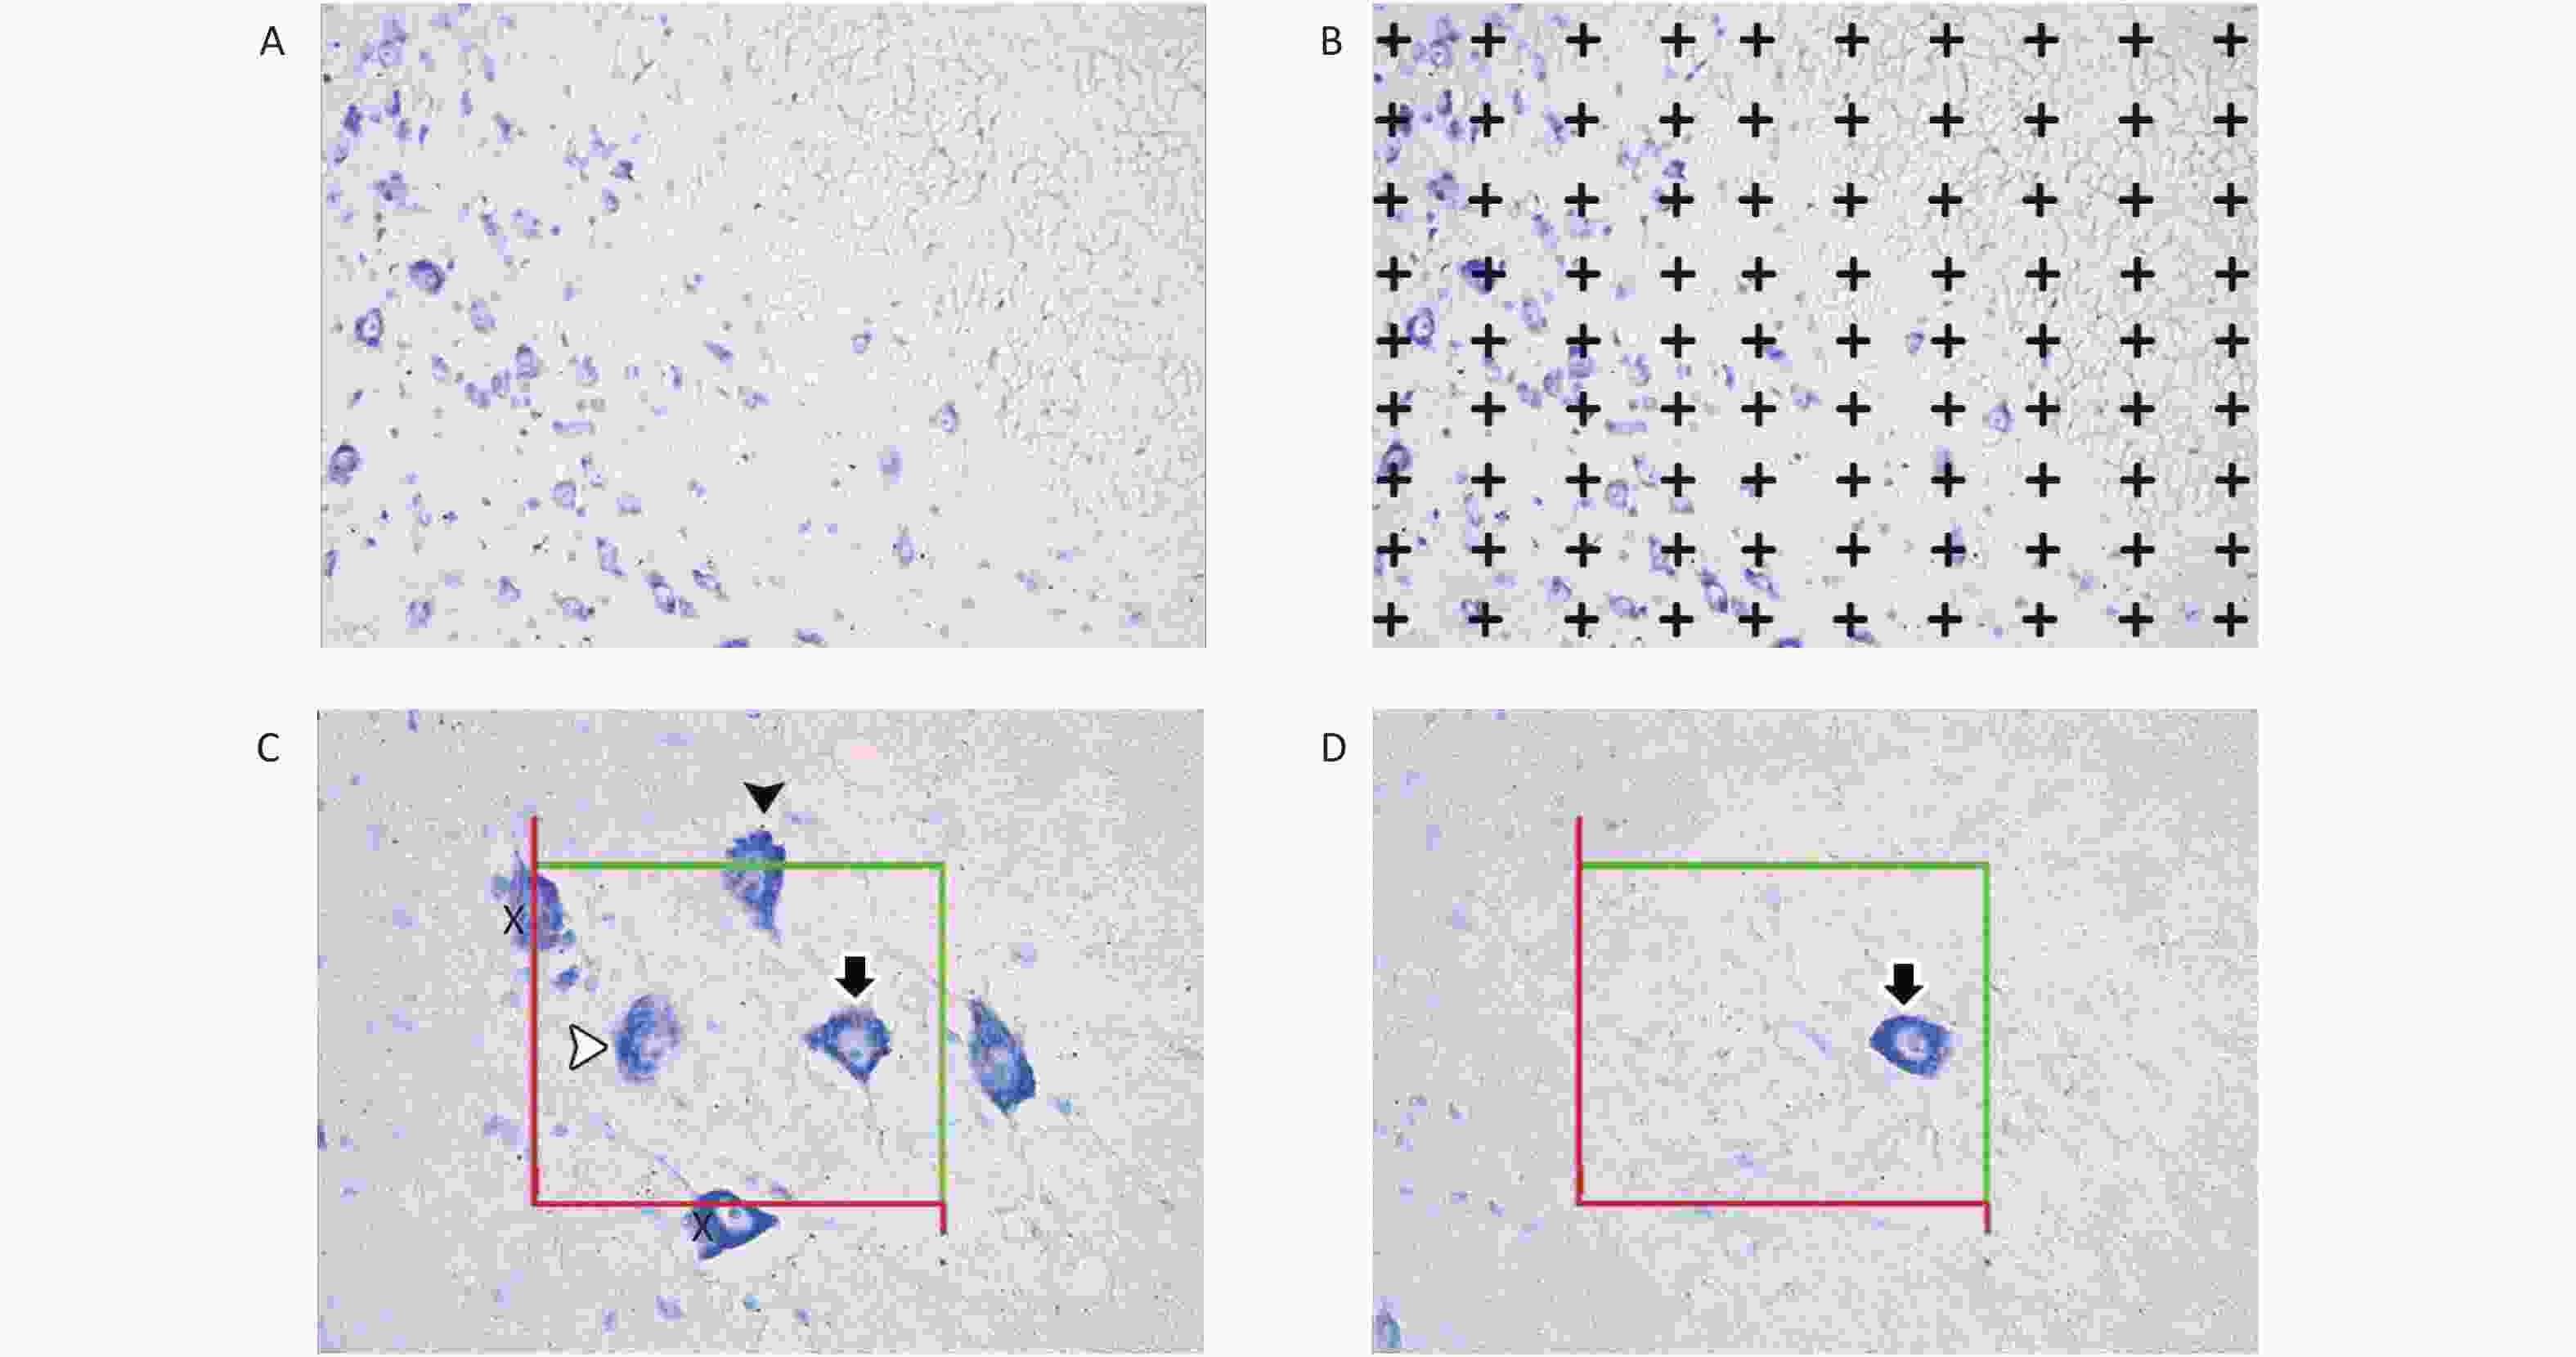
Figure 1. Images of spinal cords for the stereological procedures of the Cavalieri principle (A and B) and the physical dissector (C and D). Image (C), reference section; image (D), look-up section; X, motor neurons hitting the exclusion lines; white arrowhead, motor neuron inside the counting frames in the reference sections; black arrowhead, motor neuron hitting the inclusion line in the reference section; white arrowhead, motor neuron located within the counting frame in the reference section; black arrow, motor neuron located within the counting frames in the reference and look-up sections. Motor neurons (white and black arrowhead) located within the reference section but not in the look-up section were considered for counting.
-
Volume estimation was performed using the unbiased Cavalieri and point-counting methods[23,25]. First, 7 μm transverse serial sections were photographed, and then a grid of the testing points was randomly superimposed on micrographs. Second, the point density of the point-counting grid was validated through a pilot study. The number of points hitting the regions of interest was counted in accordance with the Cavalieri principle. Lastly, the area of each section was calculated using the following formula[26,27]:
$$ {\text{A} }{\text{r}}{\text{e}}{\text{a}}\left({\text{A}}\right)={\text{a}}\left({\text{p}}\right)\times \;\sum {\text{P}} $$ (1) where a (p) is the point interval area, and ΣP is the number of points hitting the regions of each section. The mean volume of the region of interest was estimated using the following formula:
$$ {\text{V}}{\text{o}}{\text{l}}{\text{u}}{\text{m}}{\text{e}}\left({\text{V}}\right)={\text{t}} \times \sum {\text{A}} $$ (2) where t is the total thickness of each section and interval, and ΣA is the area of the region of interest.
-
The number of motor neurons was estimated using the physical dissection method[25,28]. Fifteen to twenty dissection pairs sampled from each CSC tissue were used for the investigation. These consecutive paired sections were photographed, and then the images were transferred to a private computer. An unbiased counting frame was randomly placed on the same counting field of a pair. On the basis of the principles of physical dissection, the motor neurons that appeared in the reference section but not in the look-up section were accepted for counting. The numerical density of motor neurons was estimated as follows[29]:
$$ {\text{N}}_{\text{v}}=\frac{\sum{\text{Q}}-}{\sum {\text{V}}\;{\text{d}}{\text{i}}{\text{s}}{\text{s}}{\text{e}}{\text{c}}{\text{t}}{\text{o}}{\text{r}}} $$ (3) where ΣQ is the number of motor neurons counted in each animal, and ΣV dissector is the total volume of the dissected frames in the reference sections. Lastly, the total number of motor neurons was calculated using the following formula:
$$ {\text{T}}{\text{N }}\left({\text{t}}{\text{o}}{\text{t}}{\text{a}}{\text{l}}\;{\text{m}}{\text{o}}{\text{t}}{\text{o}}{\text{r}}\;{\text{n}}{\text{e}}{\text{u}}{\text{r}}{\text{o}}{\text{n}}\;{\text{c}}{\text{e}}{\text{l}}{\text{l}}{\text{s}}\right)={{\text{N}}}_{{\text{V}}}\times {{\text{V}}}_{{\text{r}}{\text{e}}{\text{f}}} $$ (4) where Vref is the mean volume of the CSC, and Nv is the numerical density of the motor neurons.
The values of the coefficients of error and variation respectively showed that the number of motor neurons counted in each animal and each group was sufficient[30].
-
CSC samples were taken from the freezer and then homogenized in phosphate buffer (pH 7.4) to maintain a constant pH at 12,000 ×g for 2 min on ice (IKA, Germany). Homogenized tissues were centrifuged at 3,000 ×g for 20 min at 4 °C for preparing supernatants. Superoxide dismutase (SOD) enzyme activity was determined in accordance with the method reported by Sun et al.[31]. On the basis of this method, the generation rate of superoxide radicals was measured as a result of reaction between xanthine and xanthine oxidase. Lastly, samples were analyzed using a UV–vis spectrophotometer (Shimadzu UV-MINI 1240; Shimadzu; Istanbul, Turkey) at 560 nm. Protein assays were also performed in accordance with Lowry et al.[32]. Superoxide dismutase activity was expressed as units per milligram protein.
-
The high-mobility group box 1 protein (HMGB1) is known as a mediator of the neurovascular unit, which may participate in causing damage to the central nervous system[33]. An anti-HMGB1 antibody kit (ab79823, Abcam, Cambridge, UK) was used to detect HMGB1 molecules in astrocytes. An immunohistochemical study was conducted on paraffin-embedded sections mounted on poly-lysine slides. Briefly, sections were treated with 3% H2O2 to block the endogenous peroxidases for 15 min and incubated at 37 °C. Then, the sections were immersed in ficin solution (Invitrogen) to block endogenous peroxidase activity for 15 min. SuperBlock blocking buffer (ScyTek Laboratories, SitoGen Biomedikal Ltd., İstanbul, Turkey) was applied to eliminate nonspecific immunoreactivity for 7 min. Sections were treated with anti-HMGB1 antibody diluted 1:350 at a temperature of 37 °C and humidity of 70% ± 5% for 2 h for primary antibody binding. Subsequently, sections were washed in phosphate-buffered saline thrice for 5 min, followed by biotinylated secondary antibody for 30 min. Streptavidin peroxidase was used for visualization of antibody binding. These sections were incubated with 3-amino-9-ethyl carbazyl chromogen until red coloration was observed. Subsequently, all sections were counterstained with Mayer’s hematoxylin and analyzed using a light microscope (Leica, LDM 4000, Wetzlar, Germany). Lastly, immunoreactivity was evaluated by calculating the histologic score (HScore) value of each CSC using the following formula:
$$ {\text{H}}{\text{S}}{\text{c}}{\text{o}}{\text{r}}{\text{e}}=\sum {\text{P}}{\text{i}}\;({\text{i}}+1) $$ where Pi is percentage of the cells, and i is intensity scores.
-
Statistical analysis was performed using IBM version 25.0 SPSS software (SPSS Inc., Chicago, IL, USA). One-way ANOVA and the Tukey post hoc test were conducted for multiple comparisons. The results were expressed as mean ± SD. P values less than 0.05 were considered statistically significant.
-
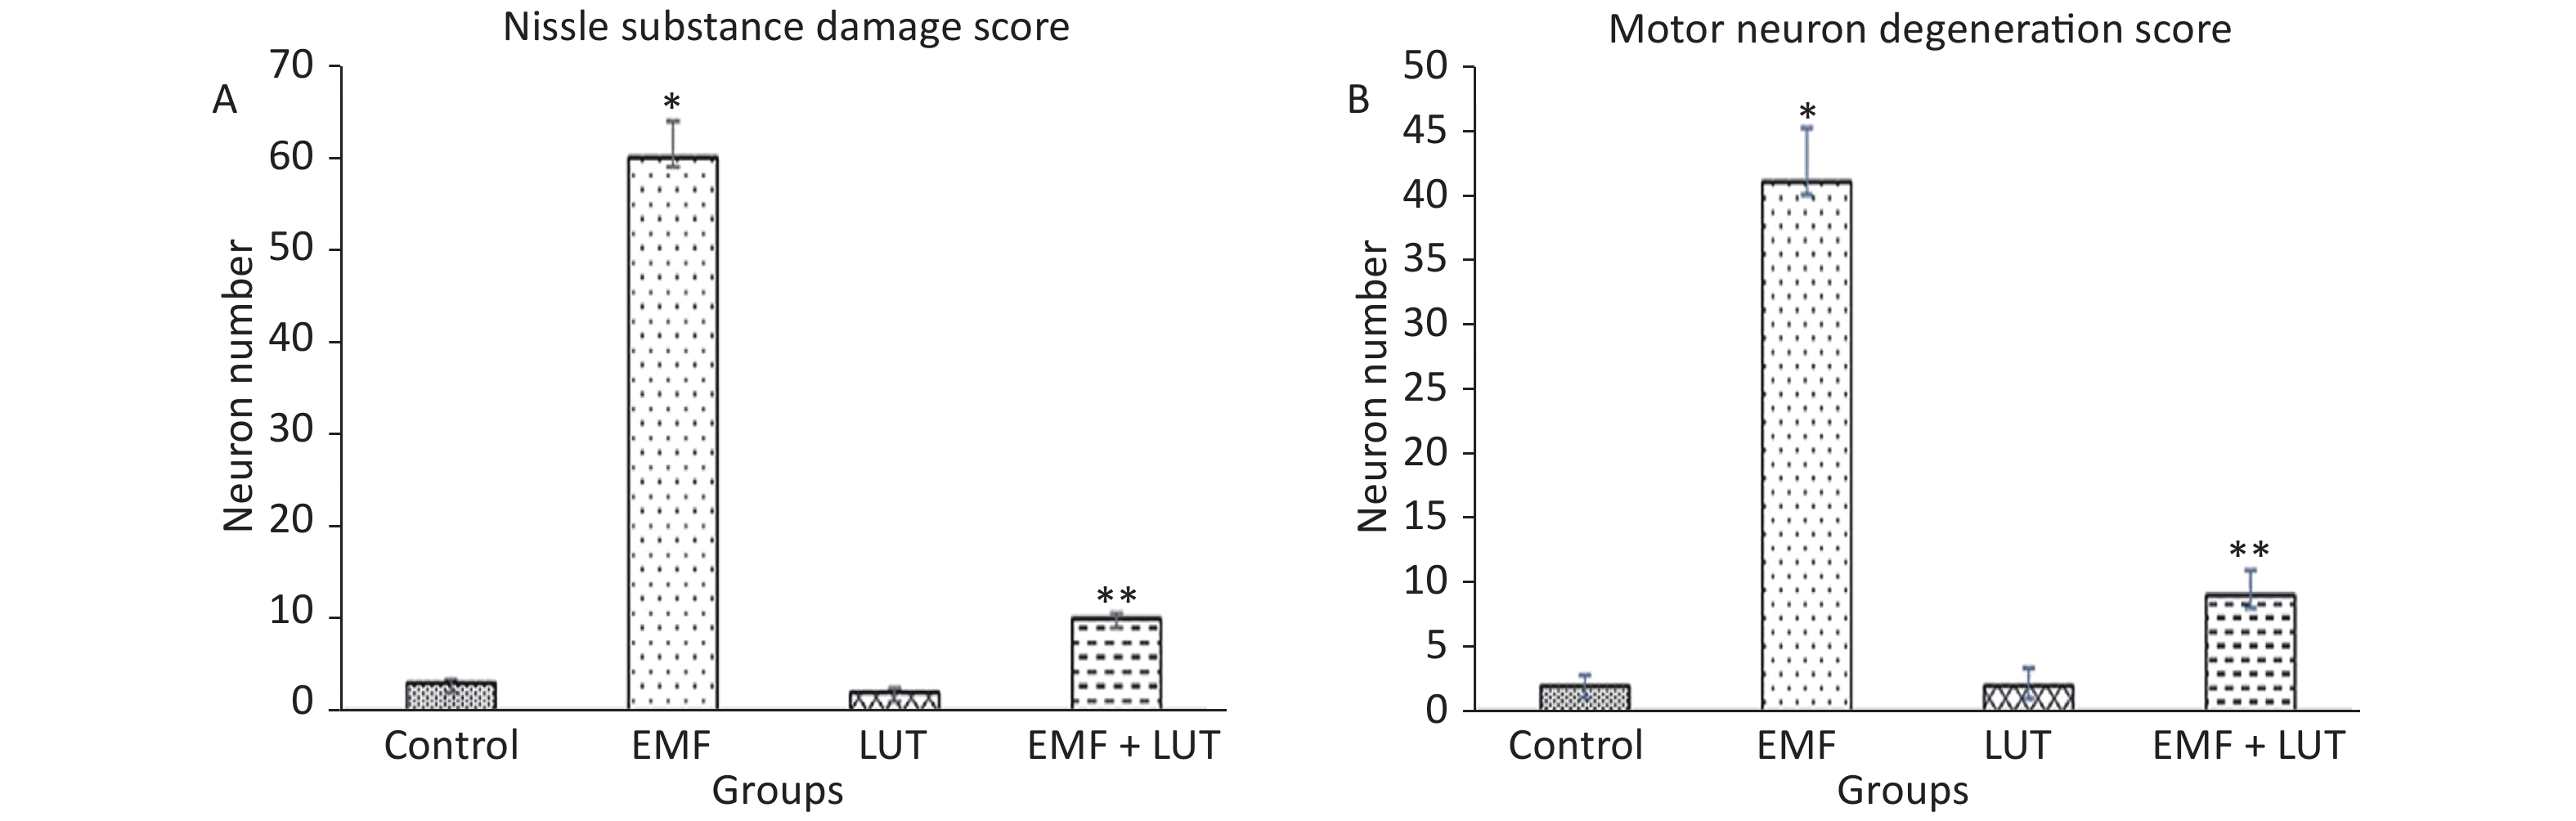
Motor neurons with sparse Nissl substance were scored in this study (Figure 2A). The number of motor neurons with sparse Nissl substance in the EMF group significantly increased in comparison with that in the control group (P < 0.001). We observed no significant differences between the EMF + LUT or LUT group and the control group. A significant decrease in the number of neurons with sparse Nissl substance was observed in the EMF + LUT group compared with the EMF group (P < 0.001).
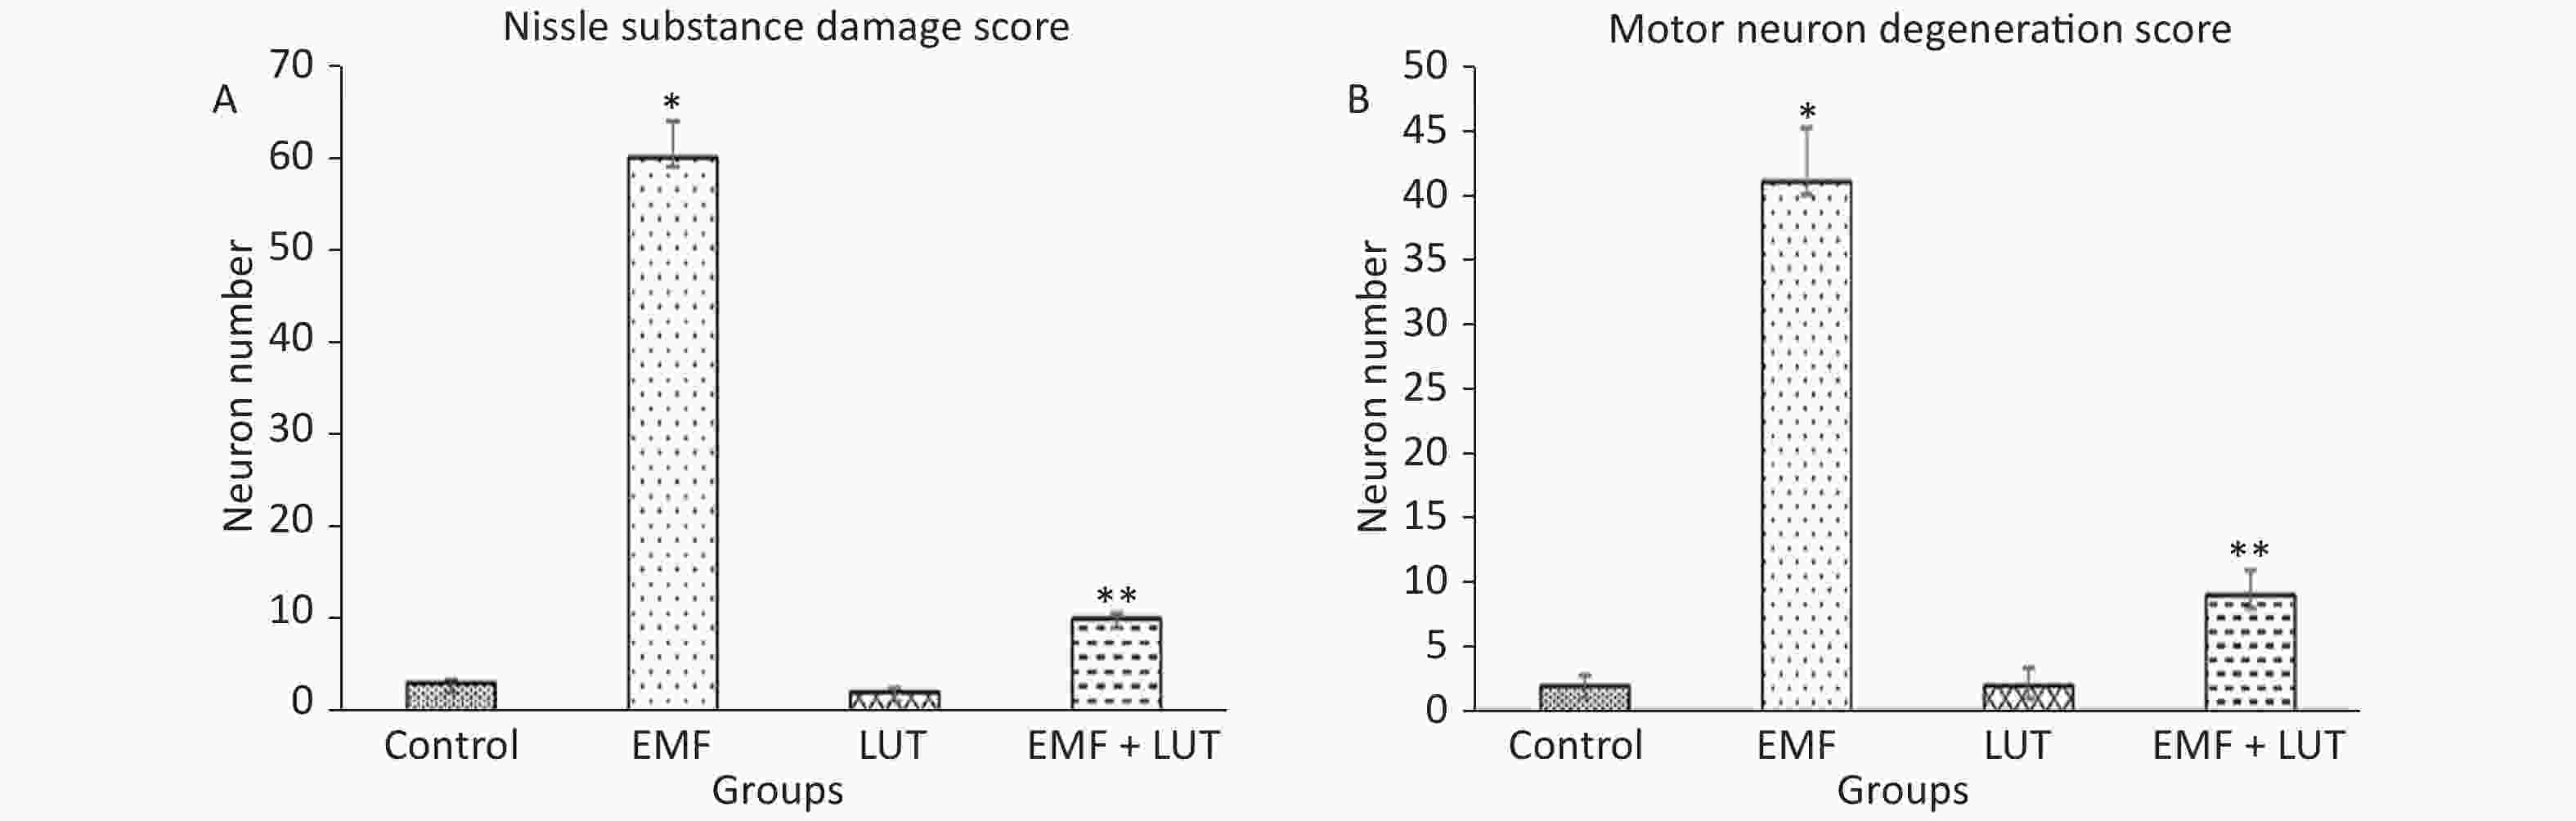
Figure 2. Nissl substance (A) and motor neuron (B) damage scores in the spinal cords of the control, EMF, LUT, and EMF + LUT groups. *Significantly different from the control group; **Significantly different from the EMF group.
Motor neuron degeneration scores are summarized in Figure 3B. The number of degenerated motor neurons in the EMF group significantly increased in comparison with that in the control group (P < 0.001). By contrast, no significant differences were found between the EMF + LUT or LUT group and the control group. We also found a significant decrease in the number of degenerated neurons in the EMF + LUT (P < 0.01) and LUT groups (P < 0.001) compared with the EMF group.
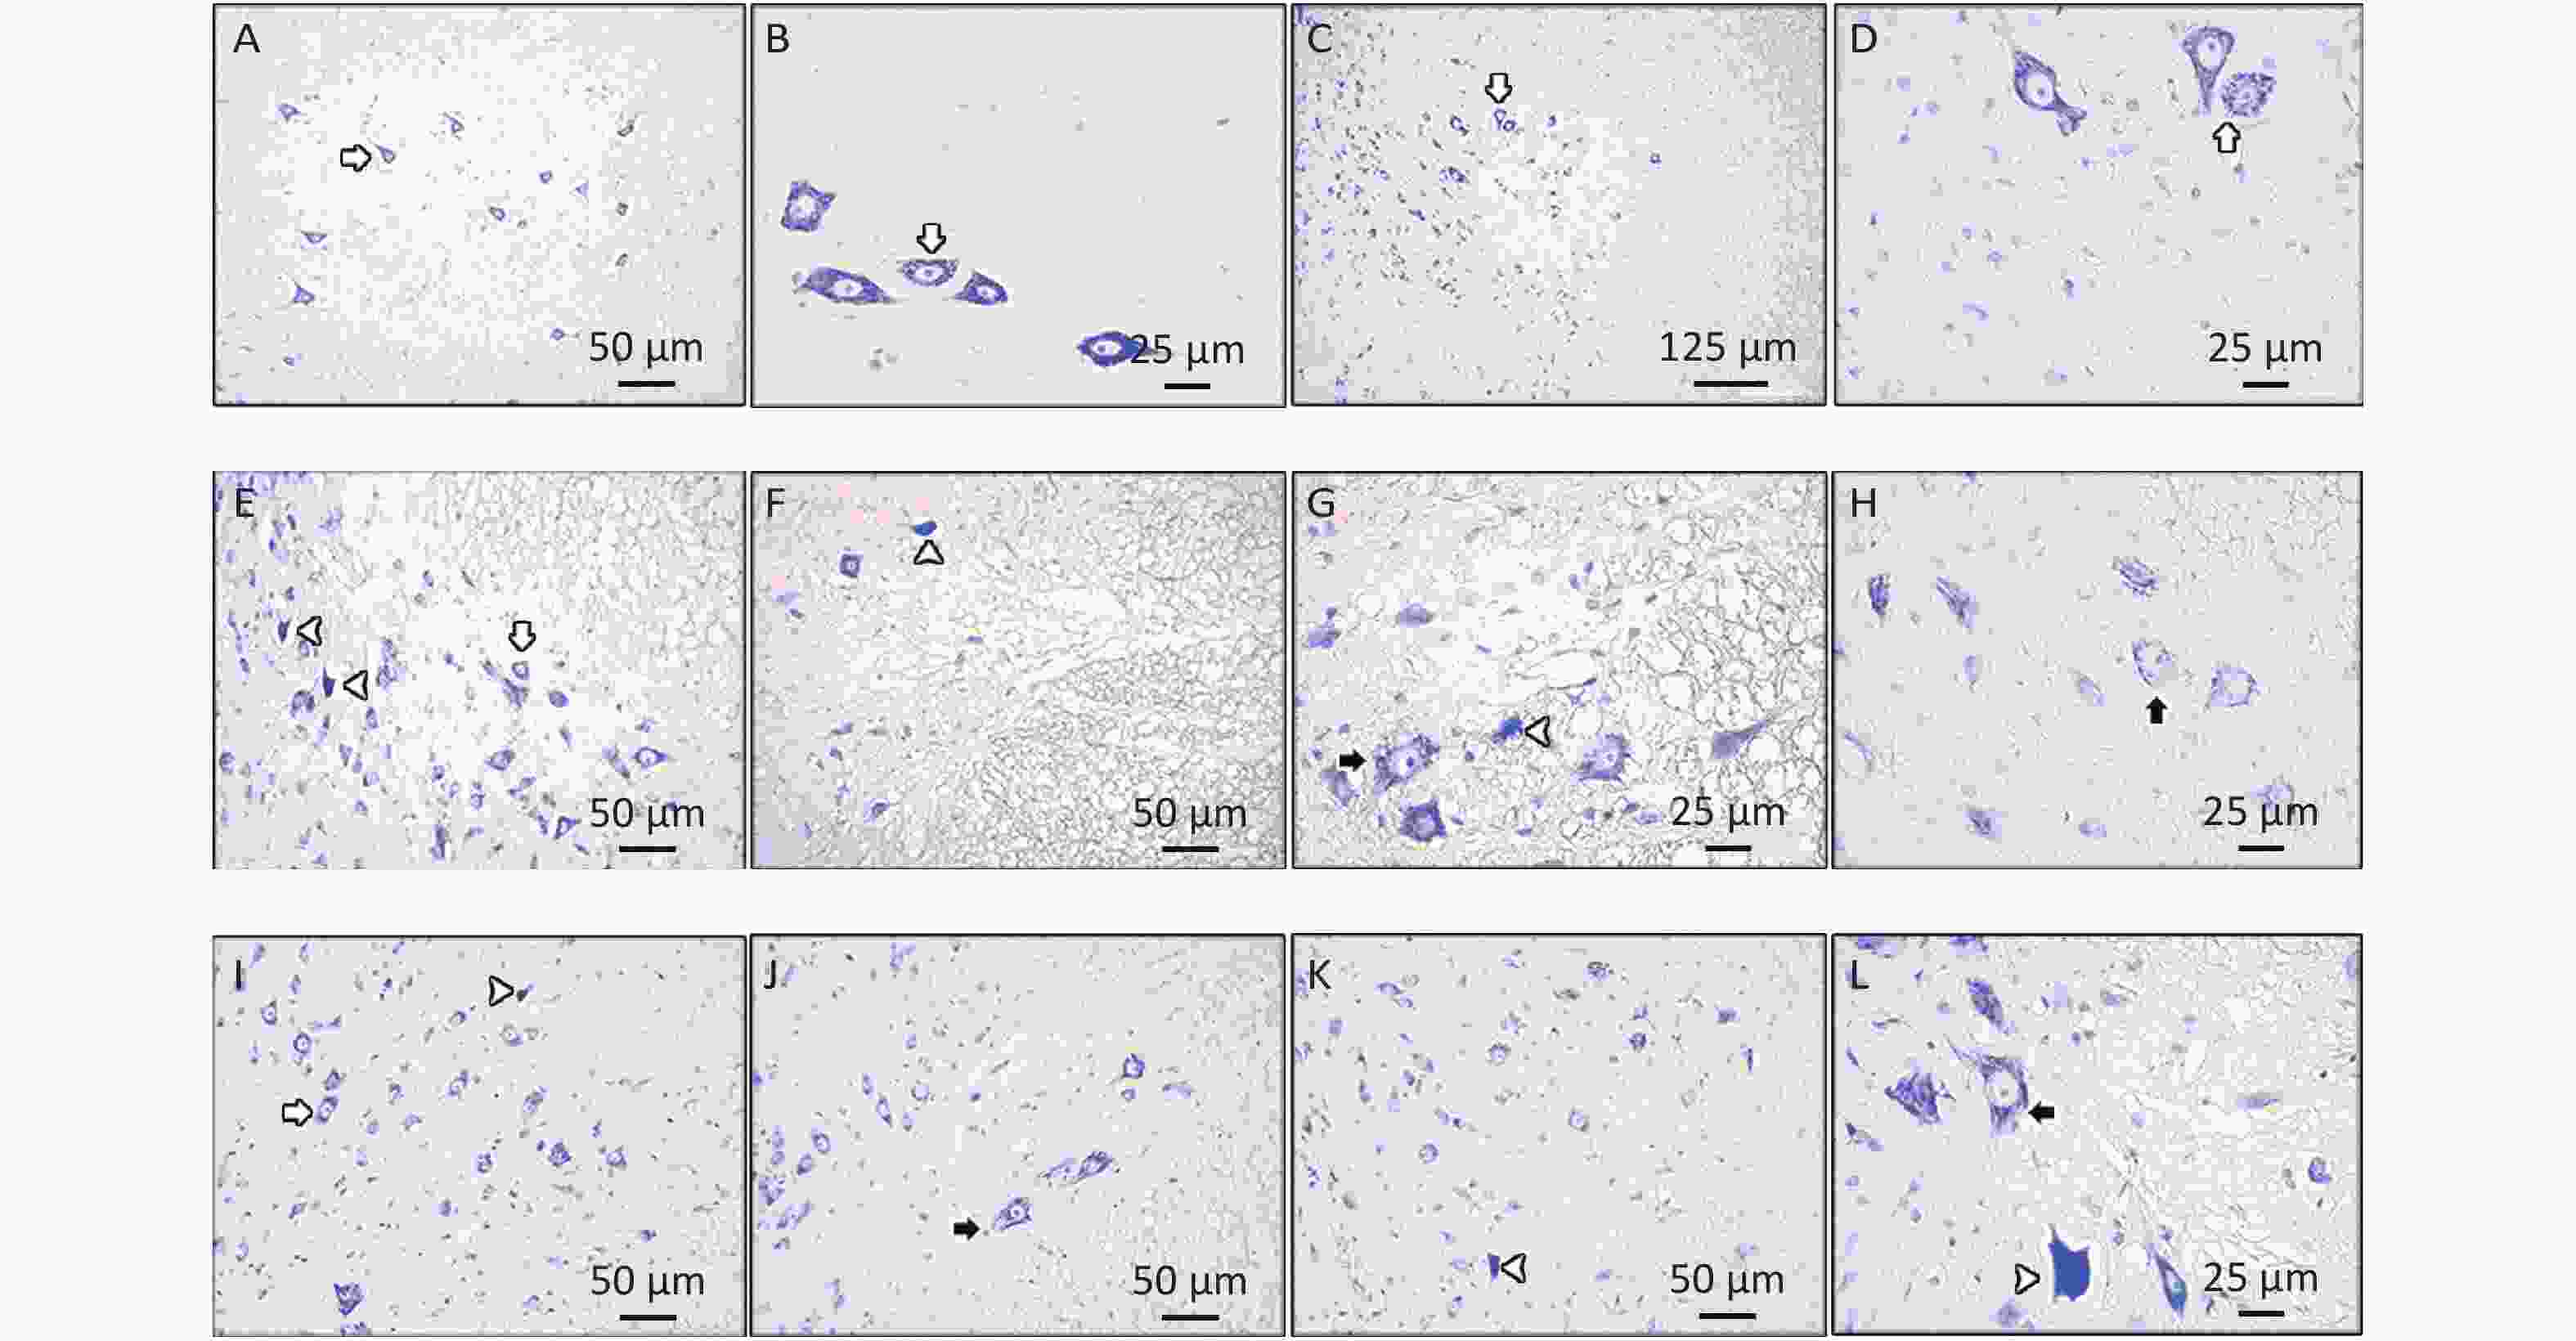
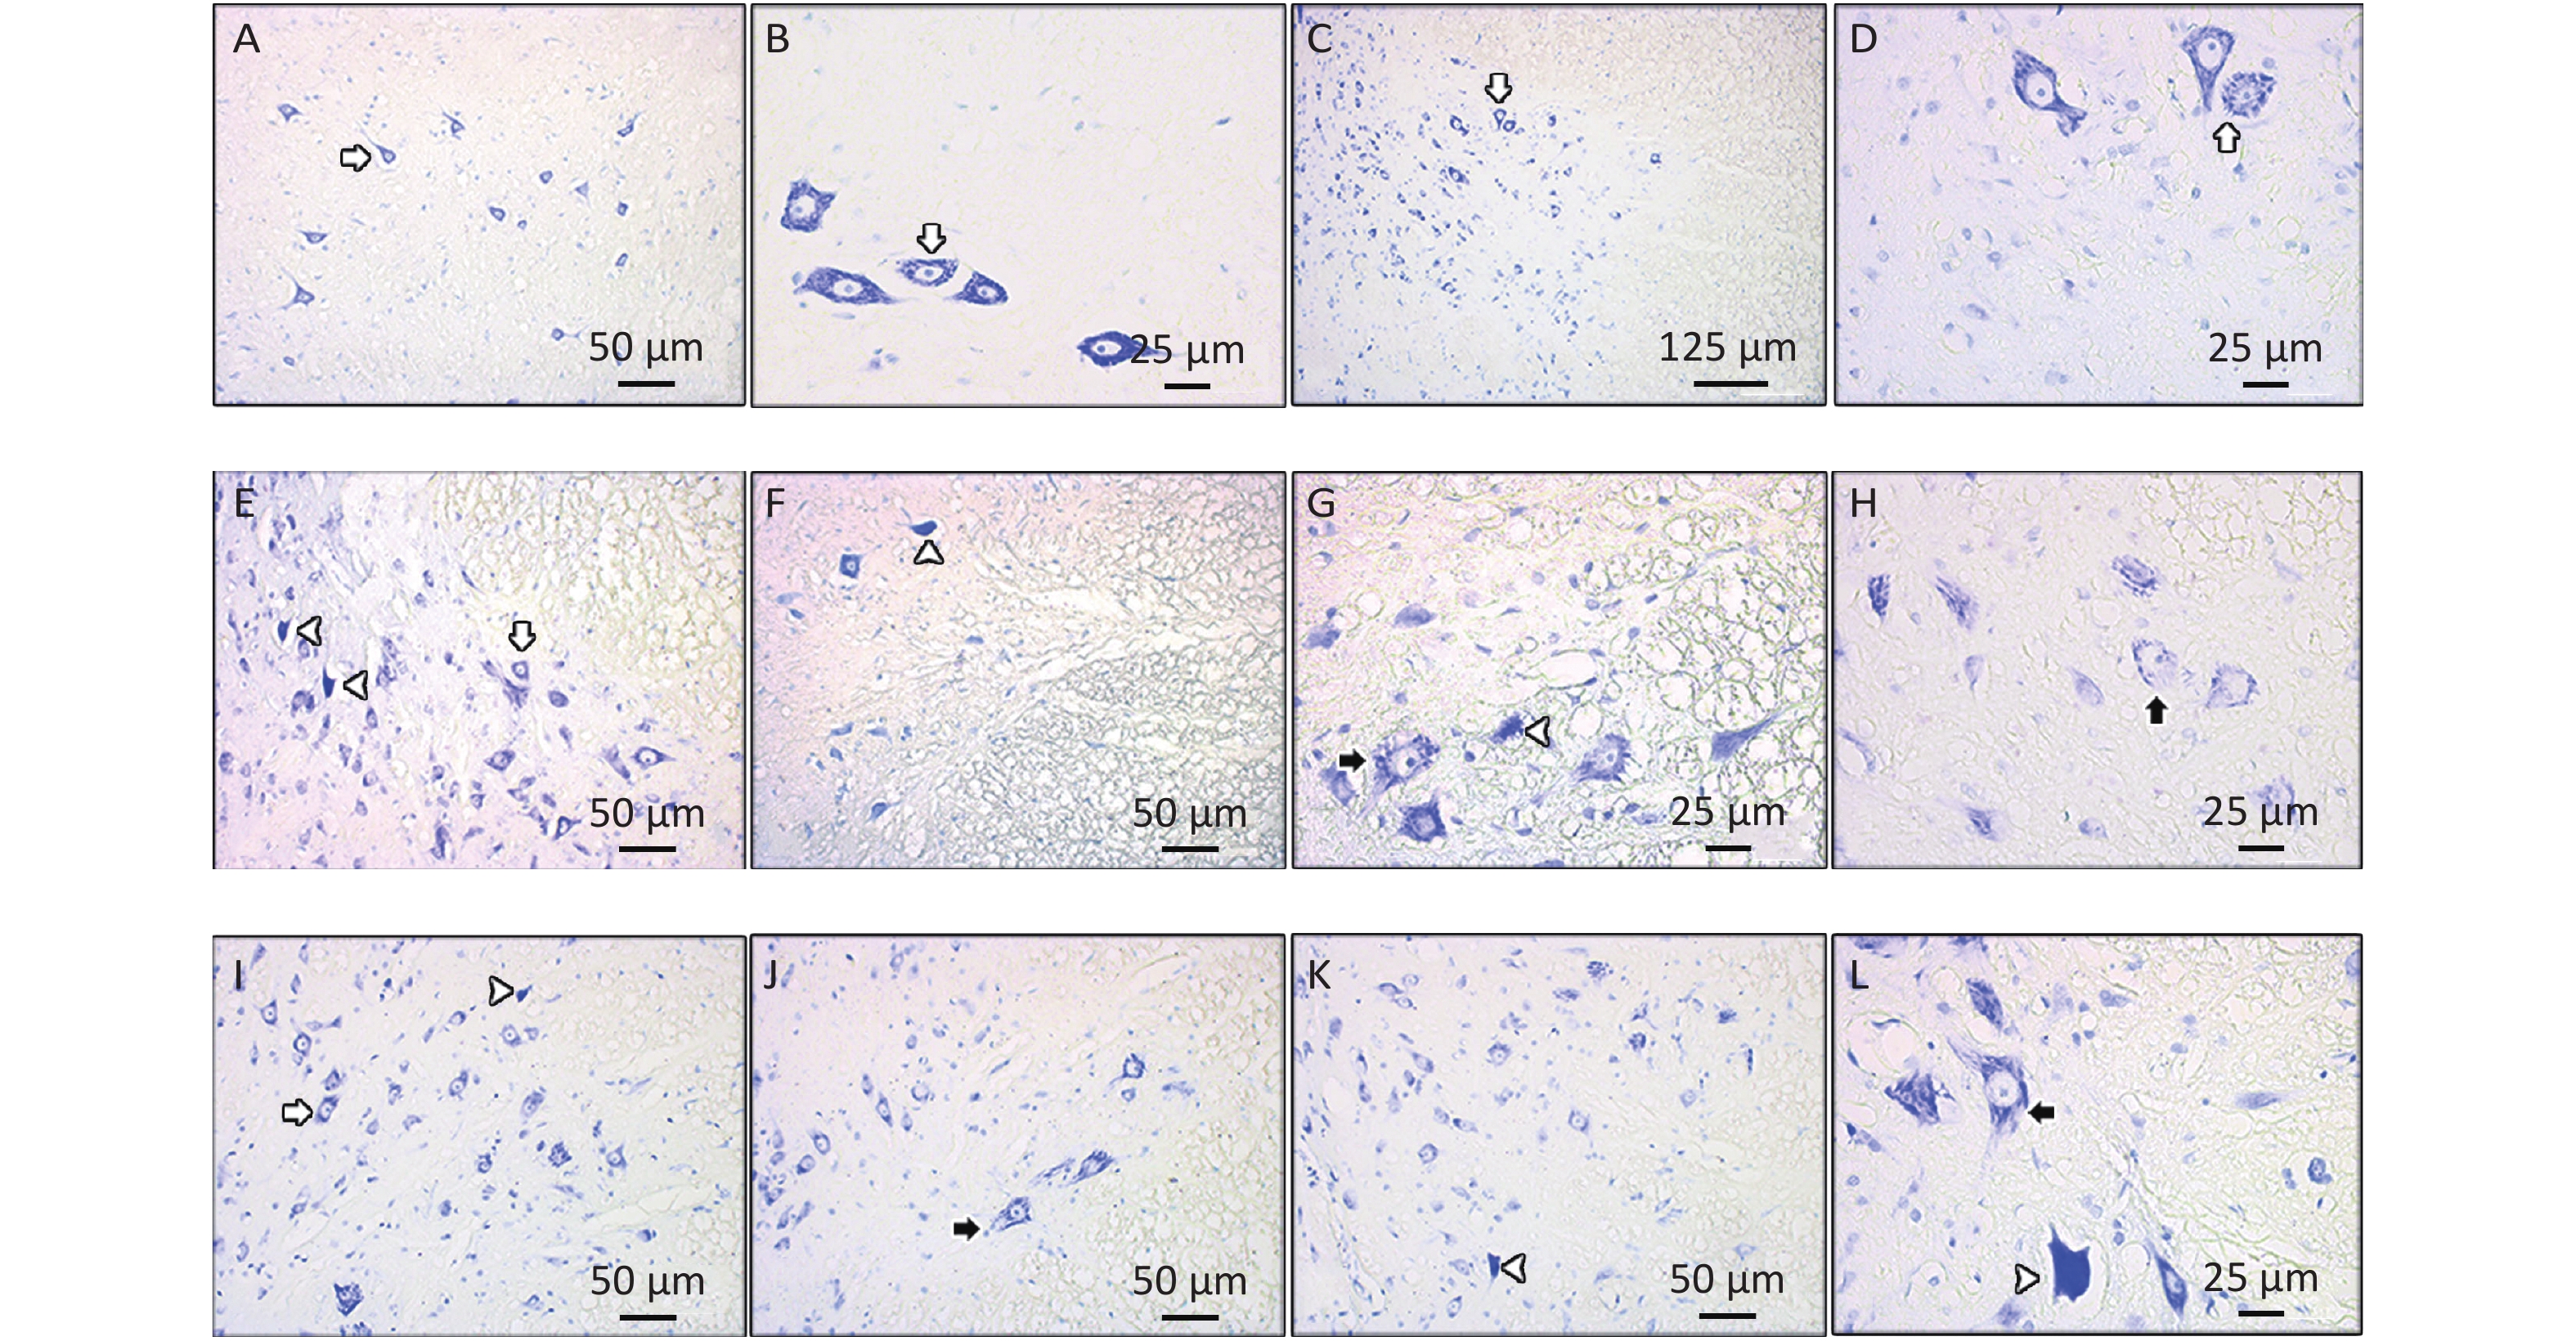
Figure 3. Light microscopic images of spinal cords in the control (A and B), EMF (E–H), LUT (C and D), and EMF + LUT (I–L) groups. White arrow, healthy motor neurons; white arrowhead, degenerated motor neurons; black arrow, motor neurons containing sparse Nissl substances.
-
Motor neurons with Nissl substance appeared normal in the control group (Figures 3A, B). By contrast, a considerable change was observed in the CSC tissues of the EMF group in which we also observed degenerated motor neurons and motor neurons with sparse Nissl substance (Figures 3E–H). In the LUT group, healthy motor neurons were detected (Figure 3C, D). Some motor neurons in the EMF + LUT group degenerated and had sparse Nissl substances; nevertheless, these morphological damages were fewer than that in the EMF group (Figures 3I–L).
-
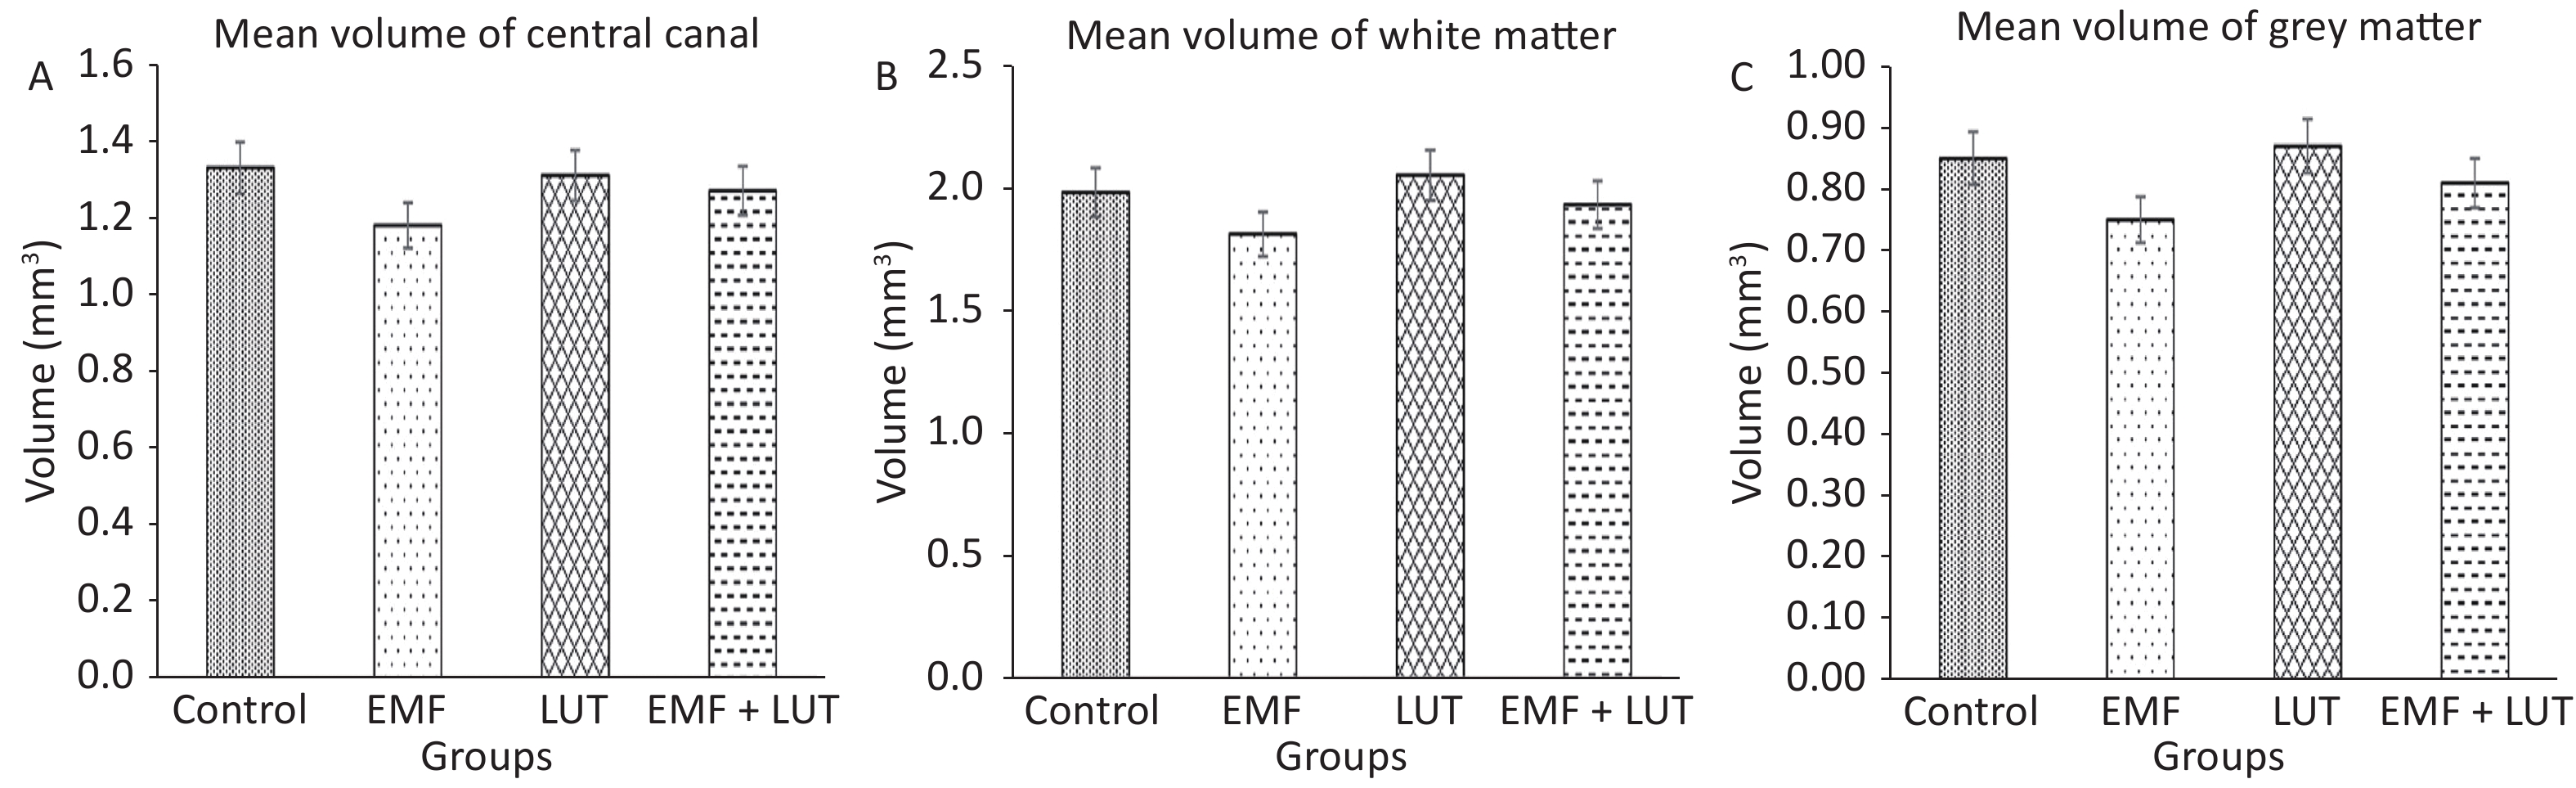
Figure 4 shows the volumetric results of all groups. We found no significant difference in the mean volumes of the central canal and the white and gray matter in the EMF group compared with the control group.
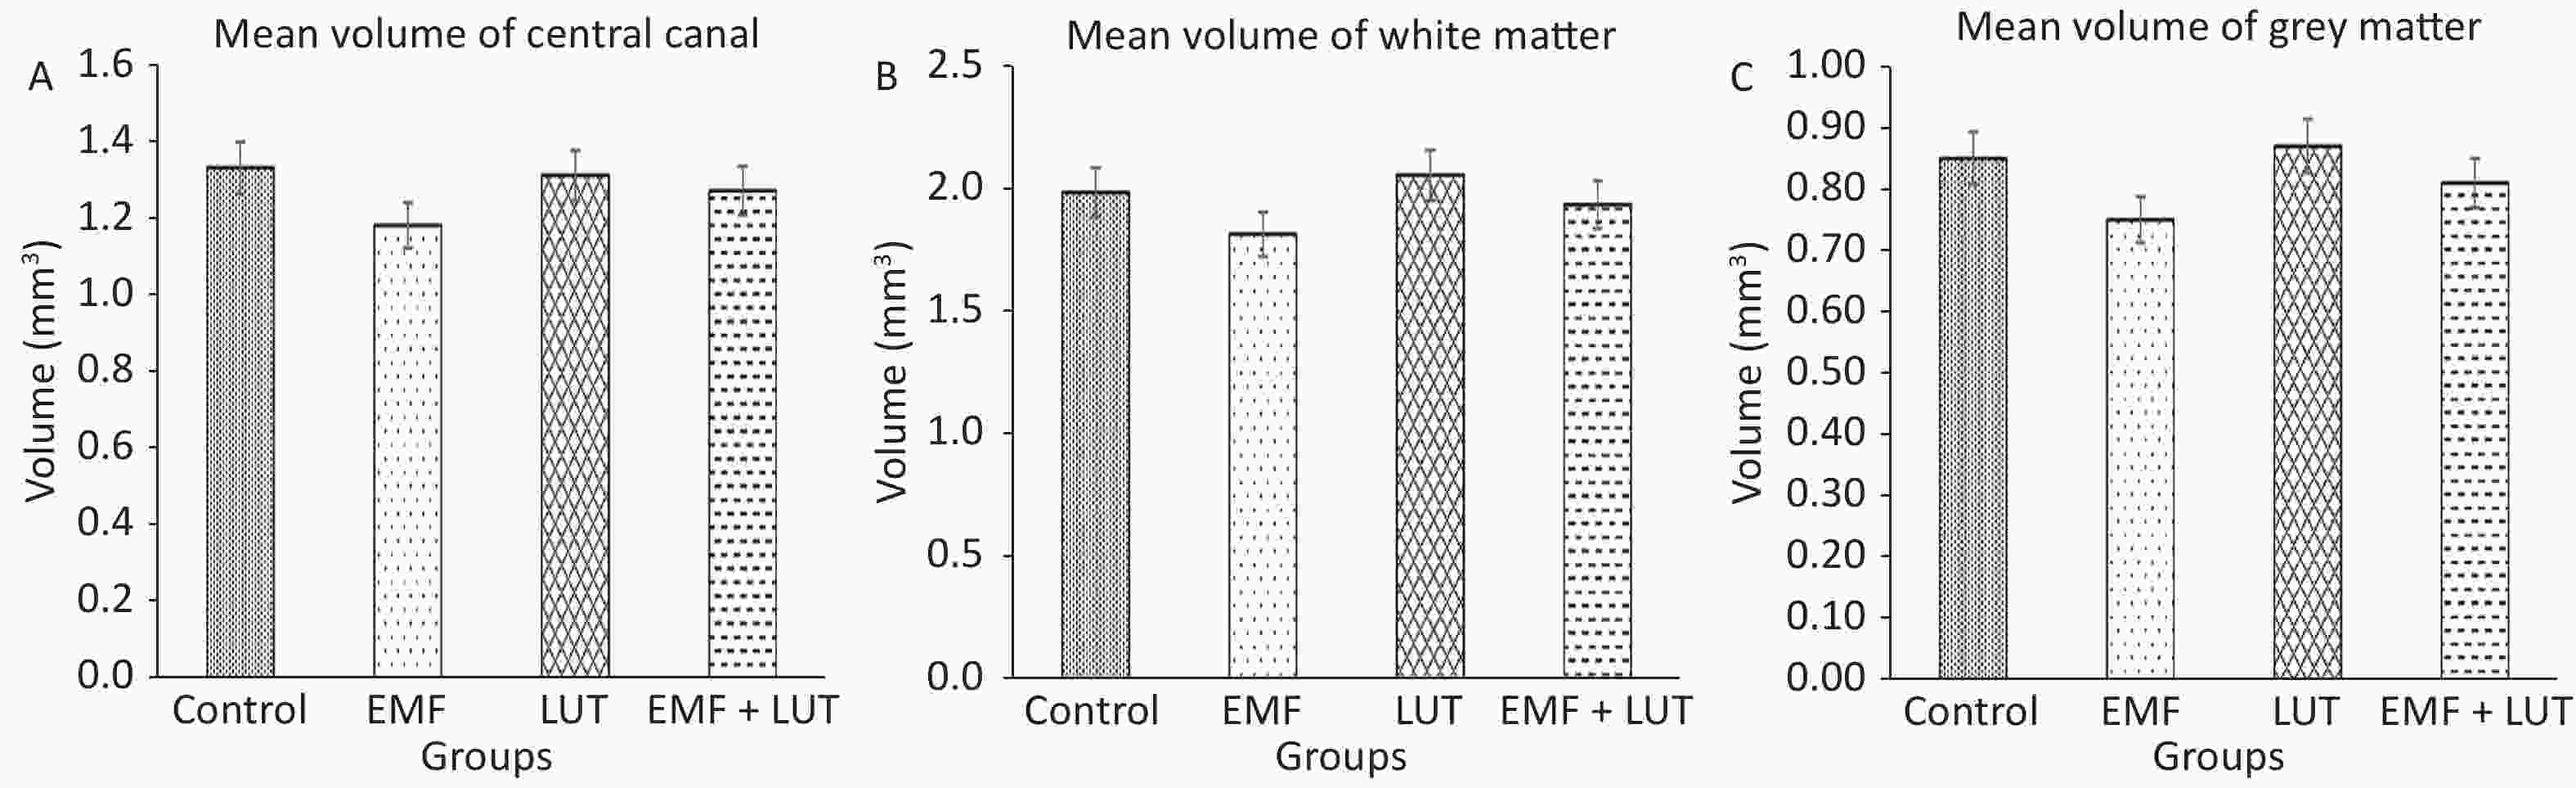
Figure 4. Mean volumes of central canal (A), white matter (B) and gray matter (C) in the spinal cords of the control, EMF, LUT, and EMF + LUT groups.
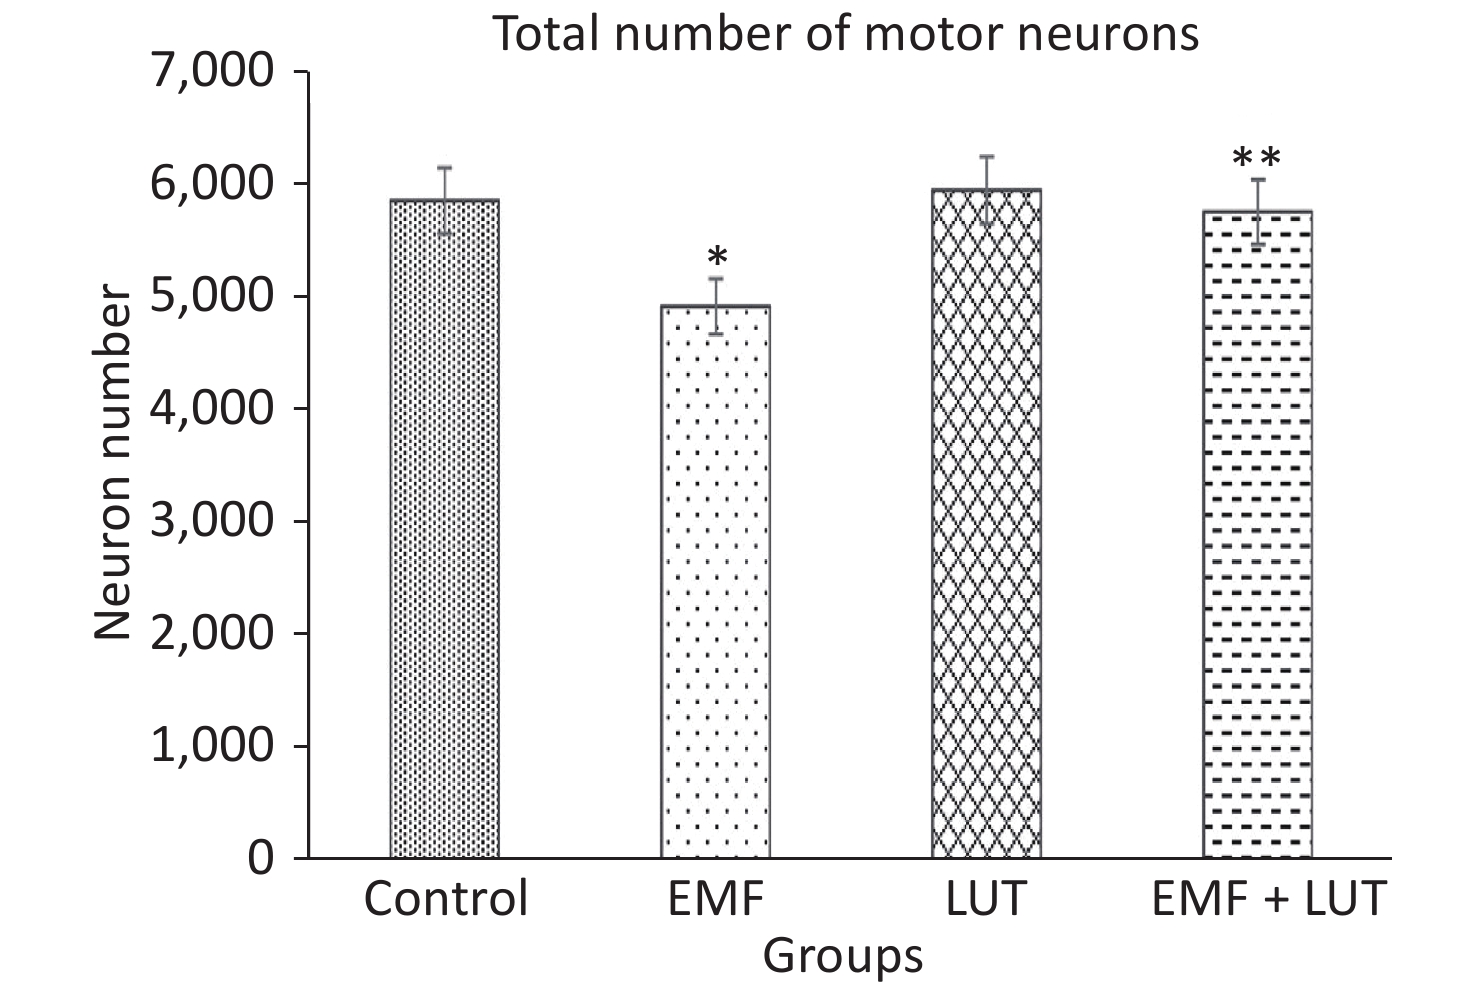
Figure 5 shows the total number of motor neurons in all groups. The total number of motor neurons in the EMF group significantly decreased in comparison with that in the control group (P < 0.05). We found no significant differences between the LUT or EMF + LUT group and the control group. By contrast, a significant increase in the total number of motor neurons was found in the EMF + LUT (P < 0.05) and LUT (P < 0.01) groups compared with the EMF group.

Figure 5. Total number of motor neurons in the cervical spinal cords of the control, EMF, LUT, and EMF+LUT groups. *Significantly different from the control group; **Significantly different from the EMF group.
-
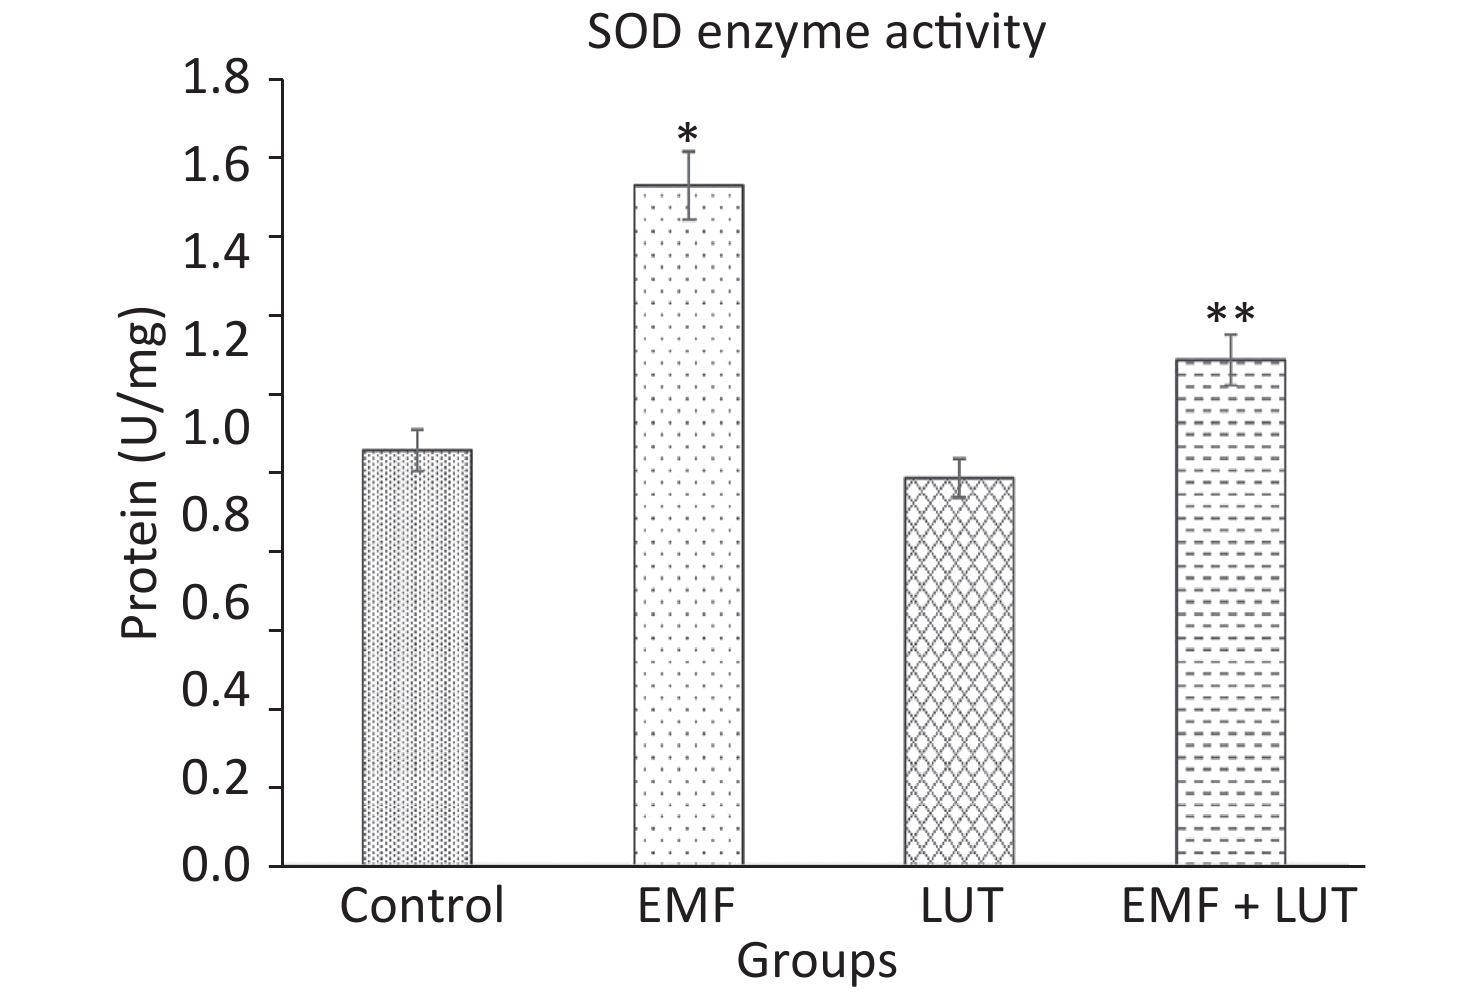
Figure 6 shows the biochemical results of all groups. We found a significant increase in SOD level in the EMF group compared with the control group (P < 0.001). By contrast, no significant differences were found between the LUT or EMF + LUT groups and the control group. SOD level significantly decreased in the EMF + LUT (P < 0.001) and LUT (P < 0.001) groups compared with the EMF group.
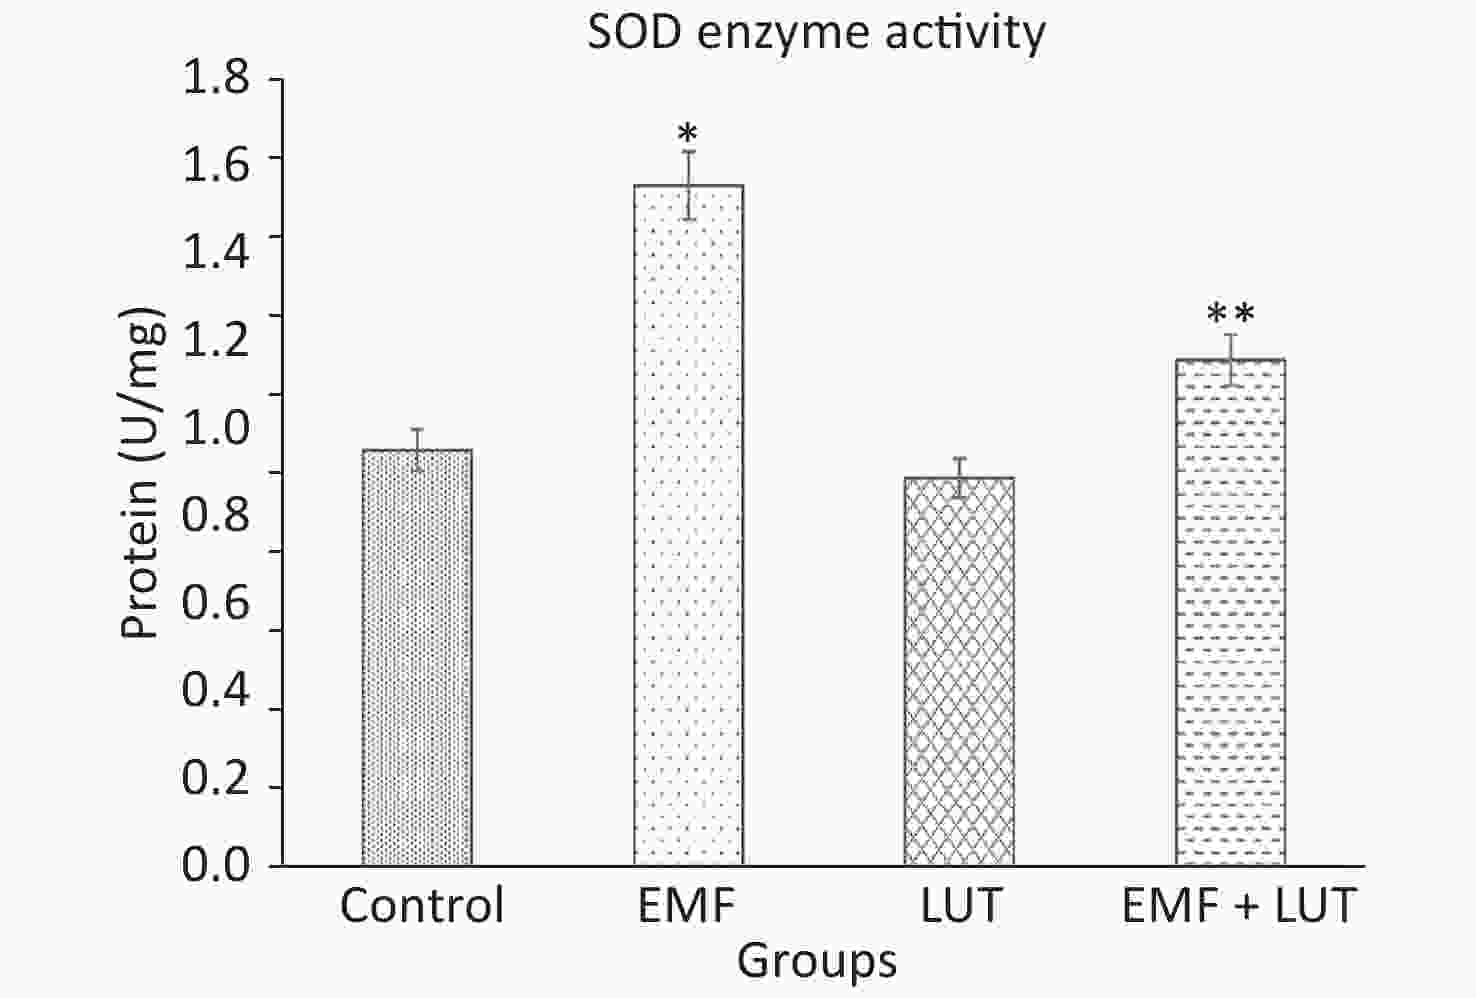
Figure 6. SOD activity in the spinal cords of the control, EMF, LUT, and EMF + LUT groups. *Significantly different from the control group; **Significantly different from the EMF group.
-
Figure 7 shows the HScore values of immunoreactivity in astrocytes. We found that the HScore value significantly increased in the EMF group compared with the control group (P < 0.001). By contrast, no significant differences were found between the LUT or EMF + LUT groups and the control group. Furthermore, the HScore value in the EMF + LUT group (P < 0.001) and the LUT group (P < 0.001) significantly decreased in comparison with that in the EMF group.
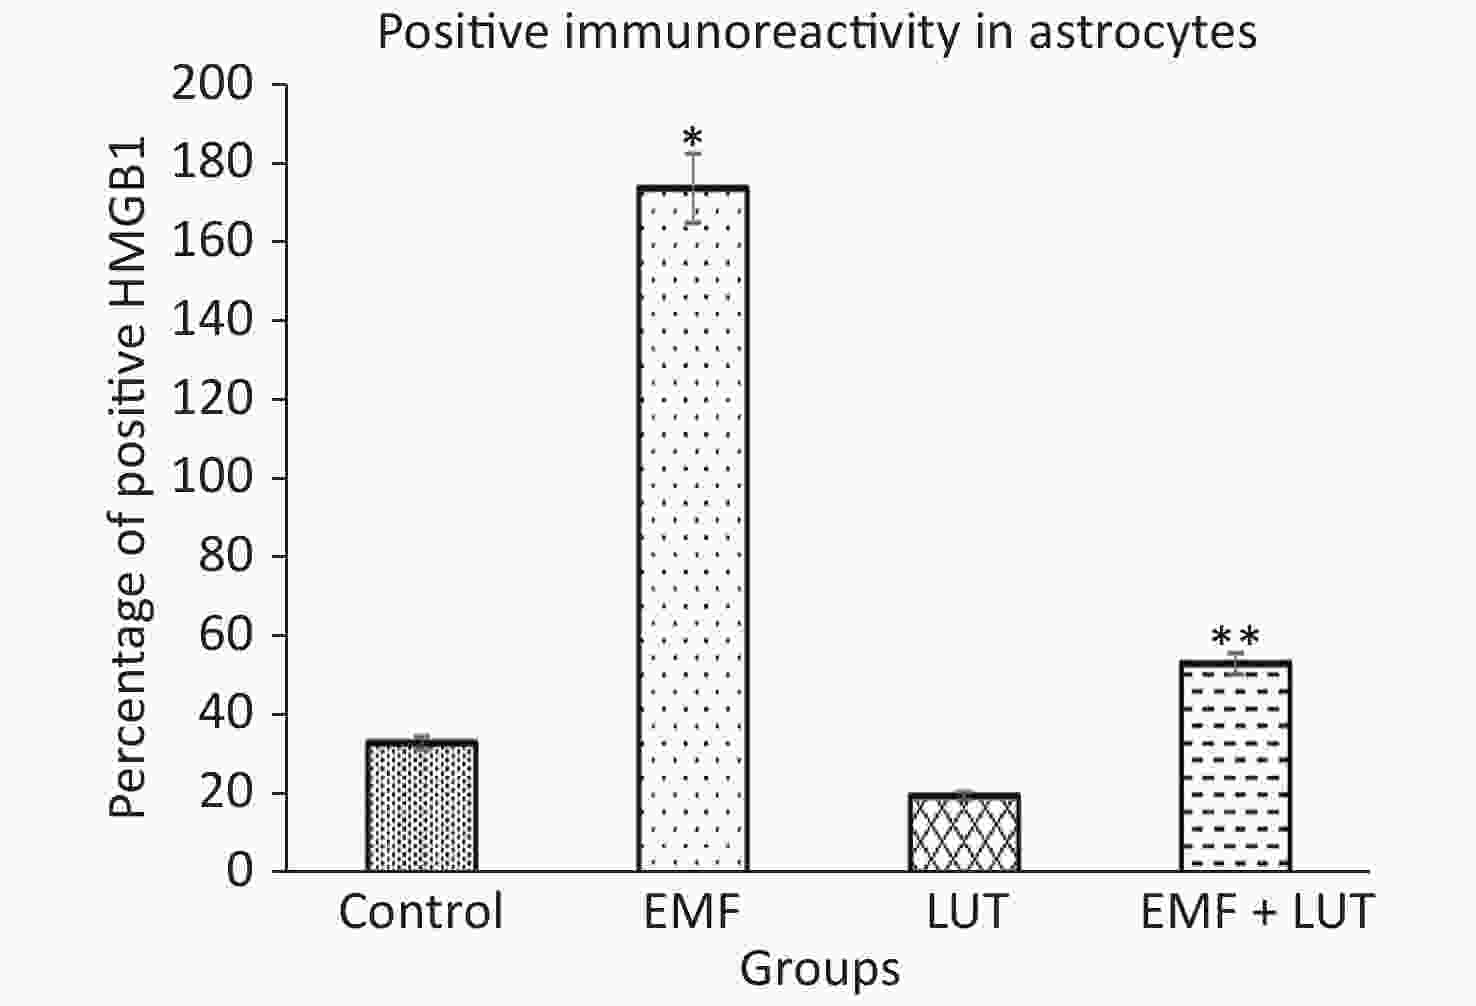
Figure 7. HScore values of HMGB1-positive astrocytes in the spinal cords of the control, EMF, LUT, and EMF + LUT groups. *Significantly different from the control group; **Significantly different from the EMF group.
-
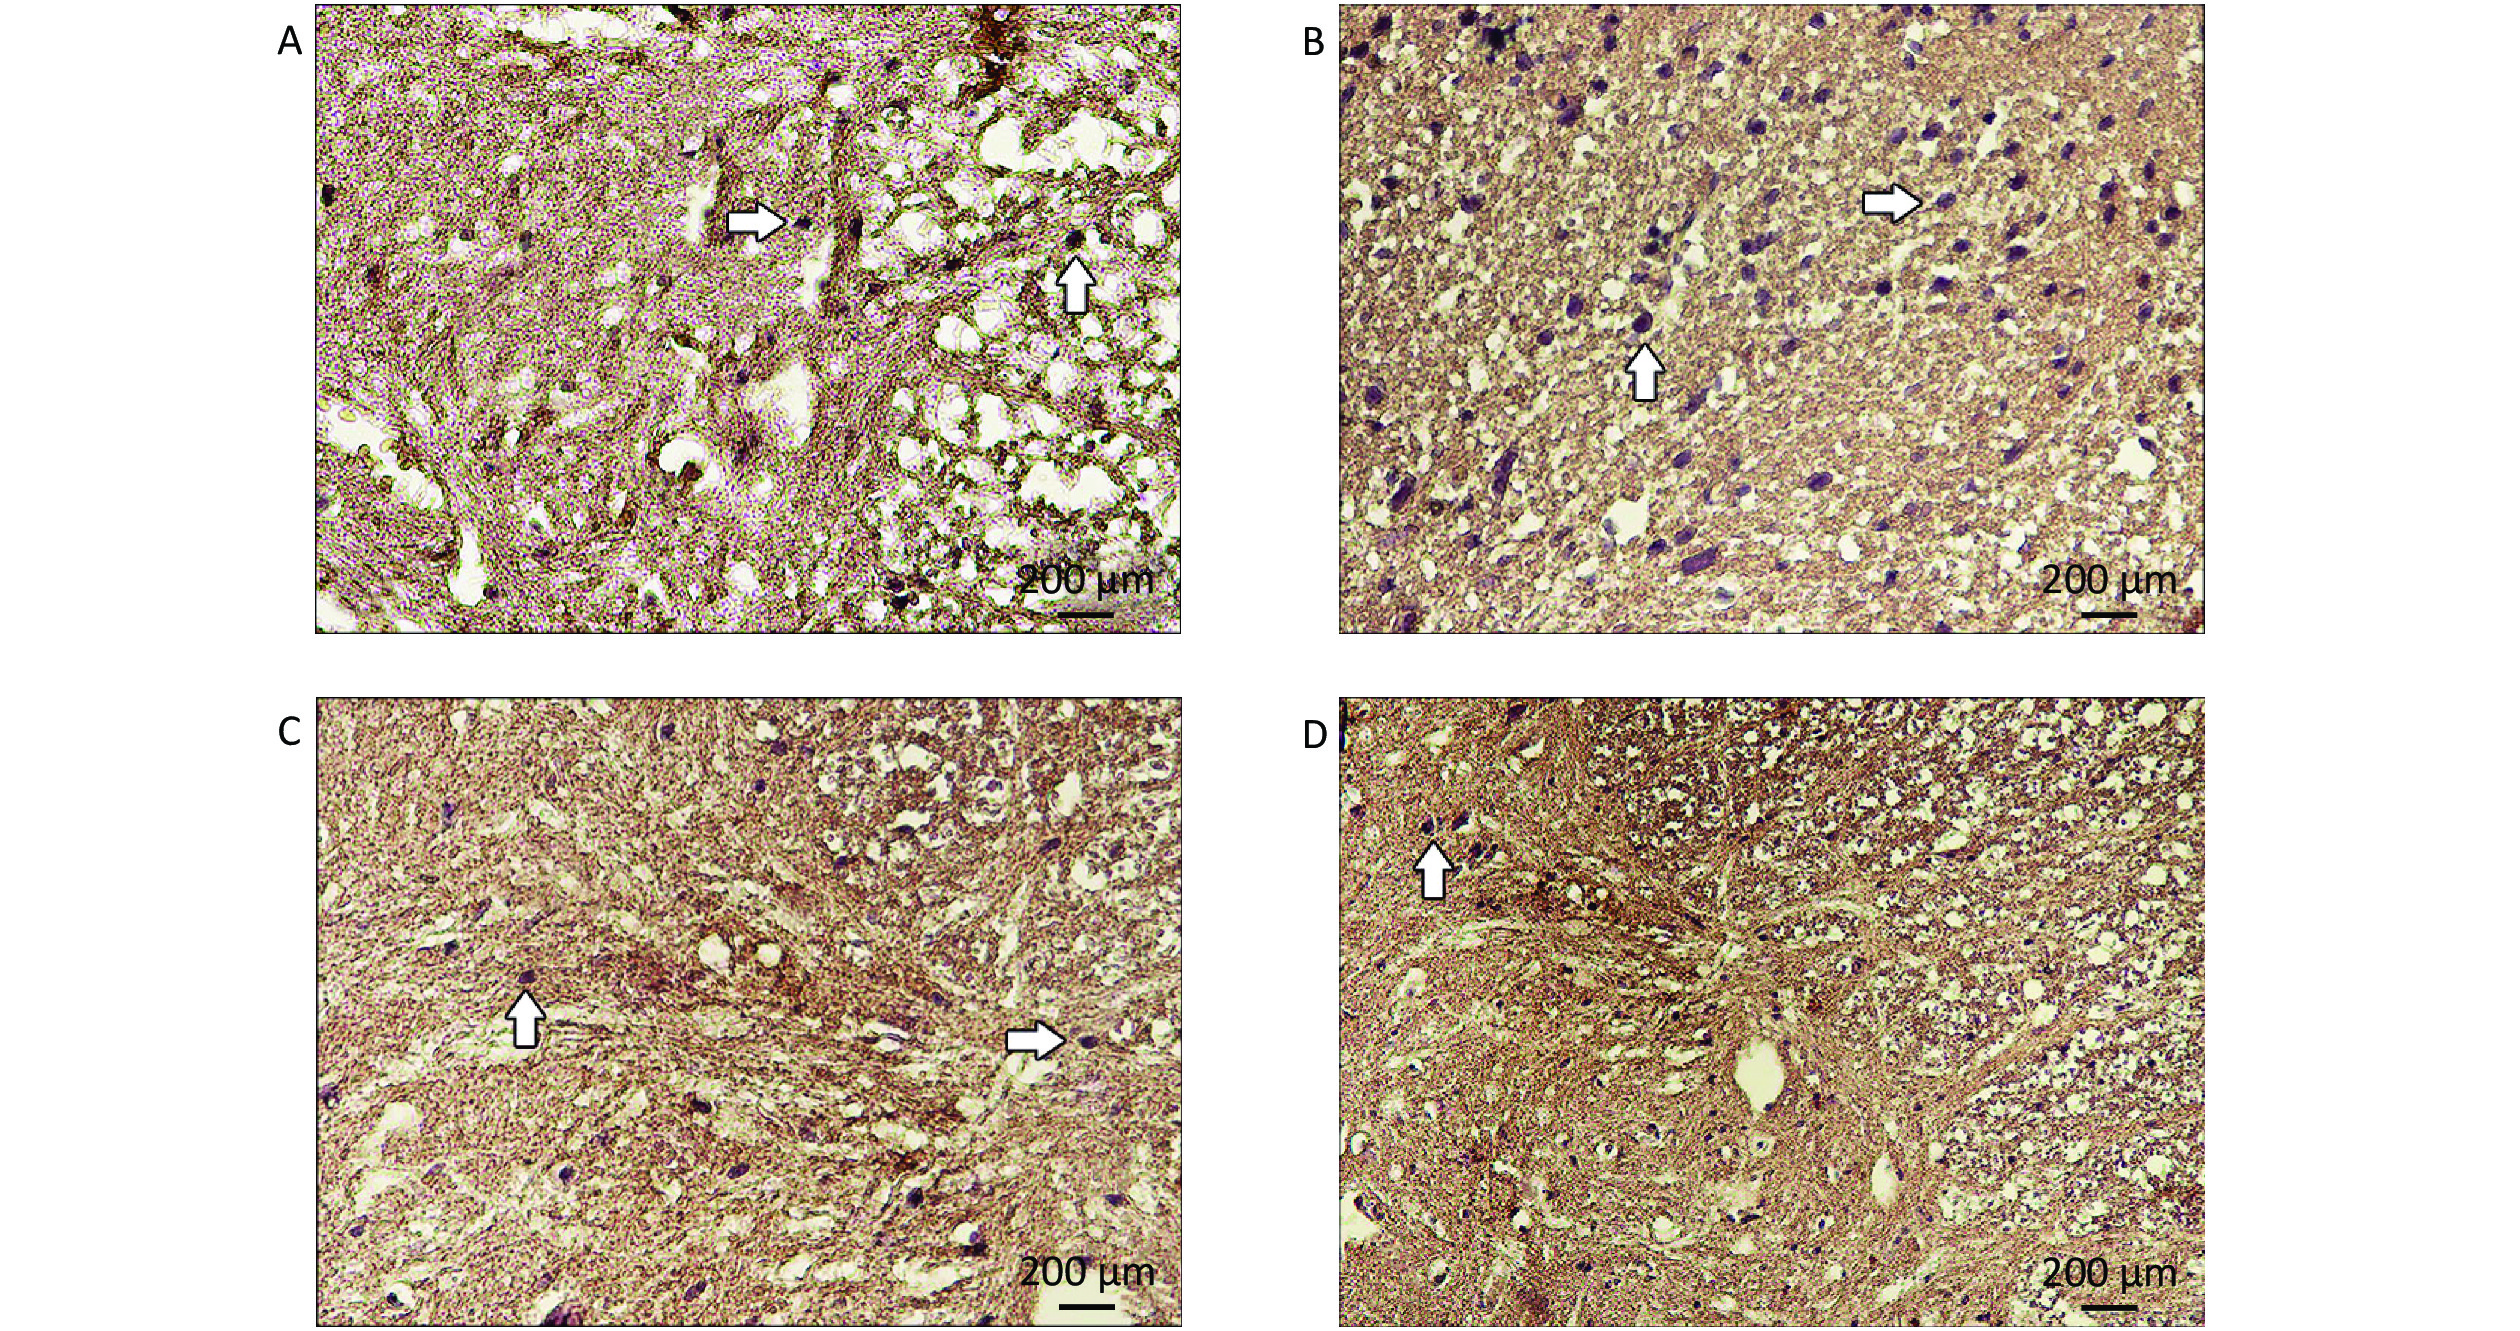
HMGB1-positive astrocytes appeared dark brown in the CSC tissues of all groups (Figure 8). The immunostaining of astrocytes was slight in the control and LUT groups, whereas strong immunostaining was detected in the EMF group. In the EMF + LUT group, we found positive immunostaining of astrocytes although fewer than that in the EMF group.
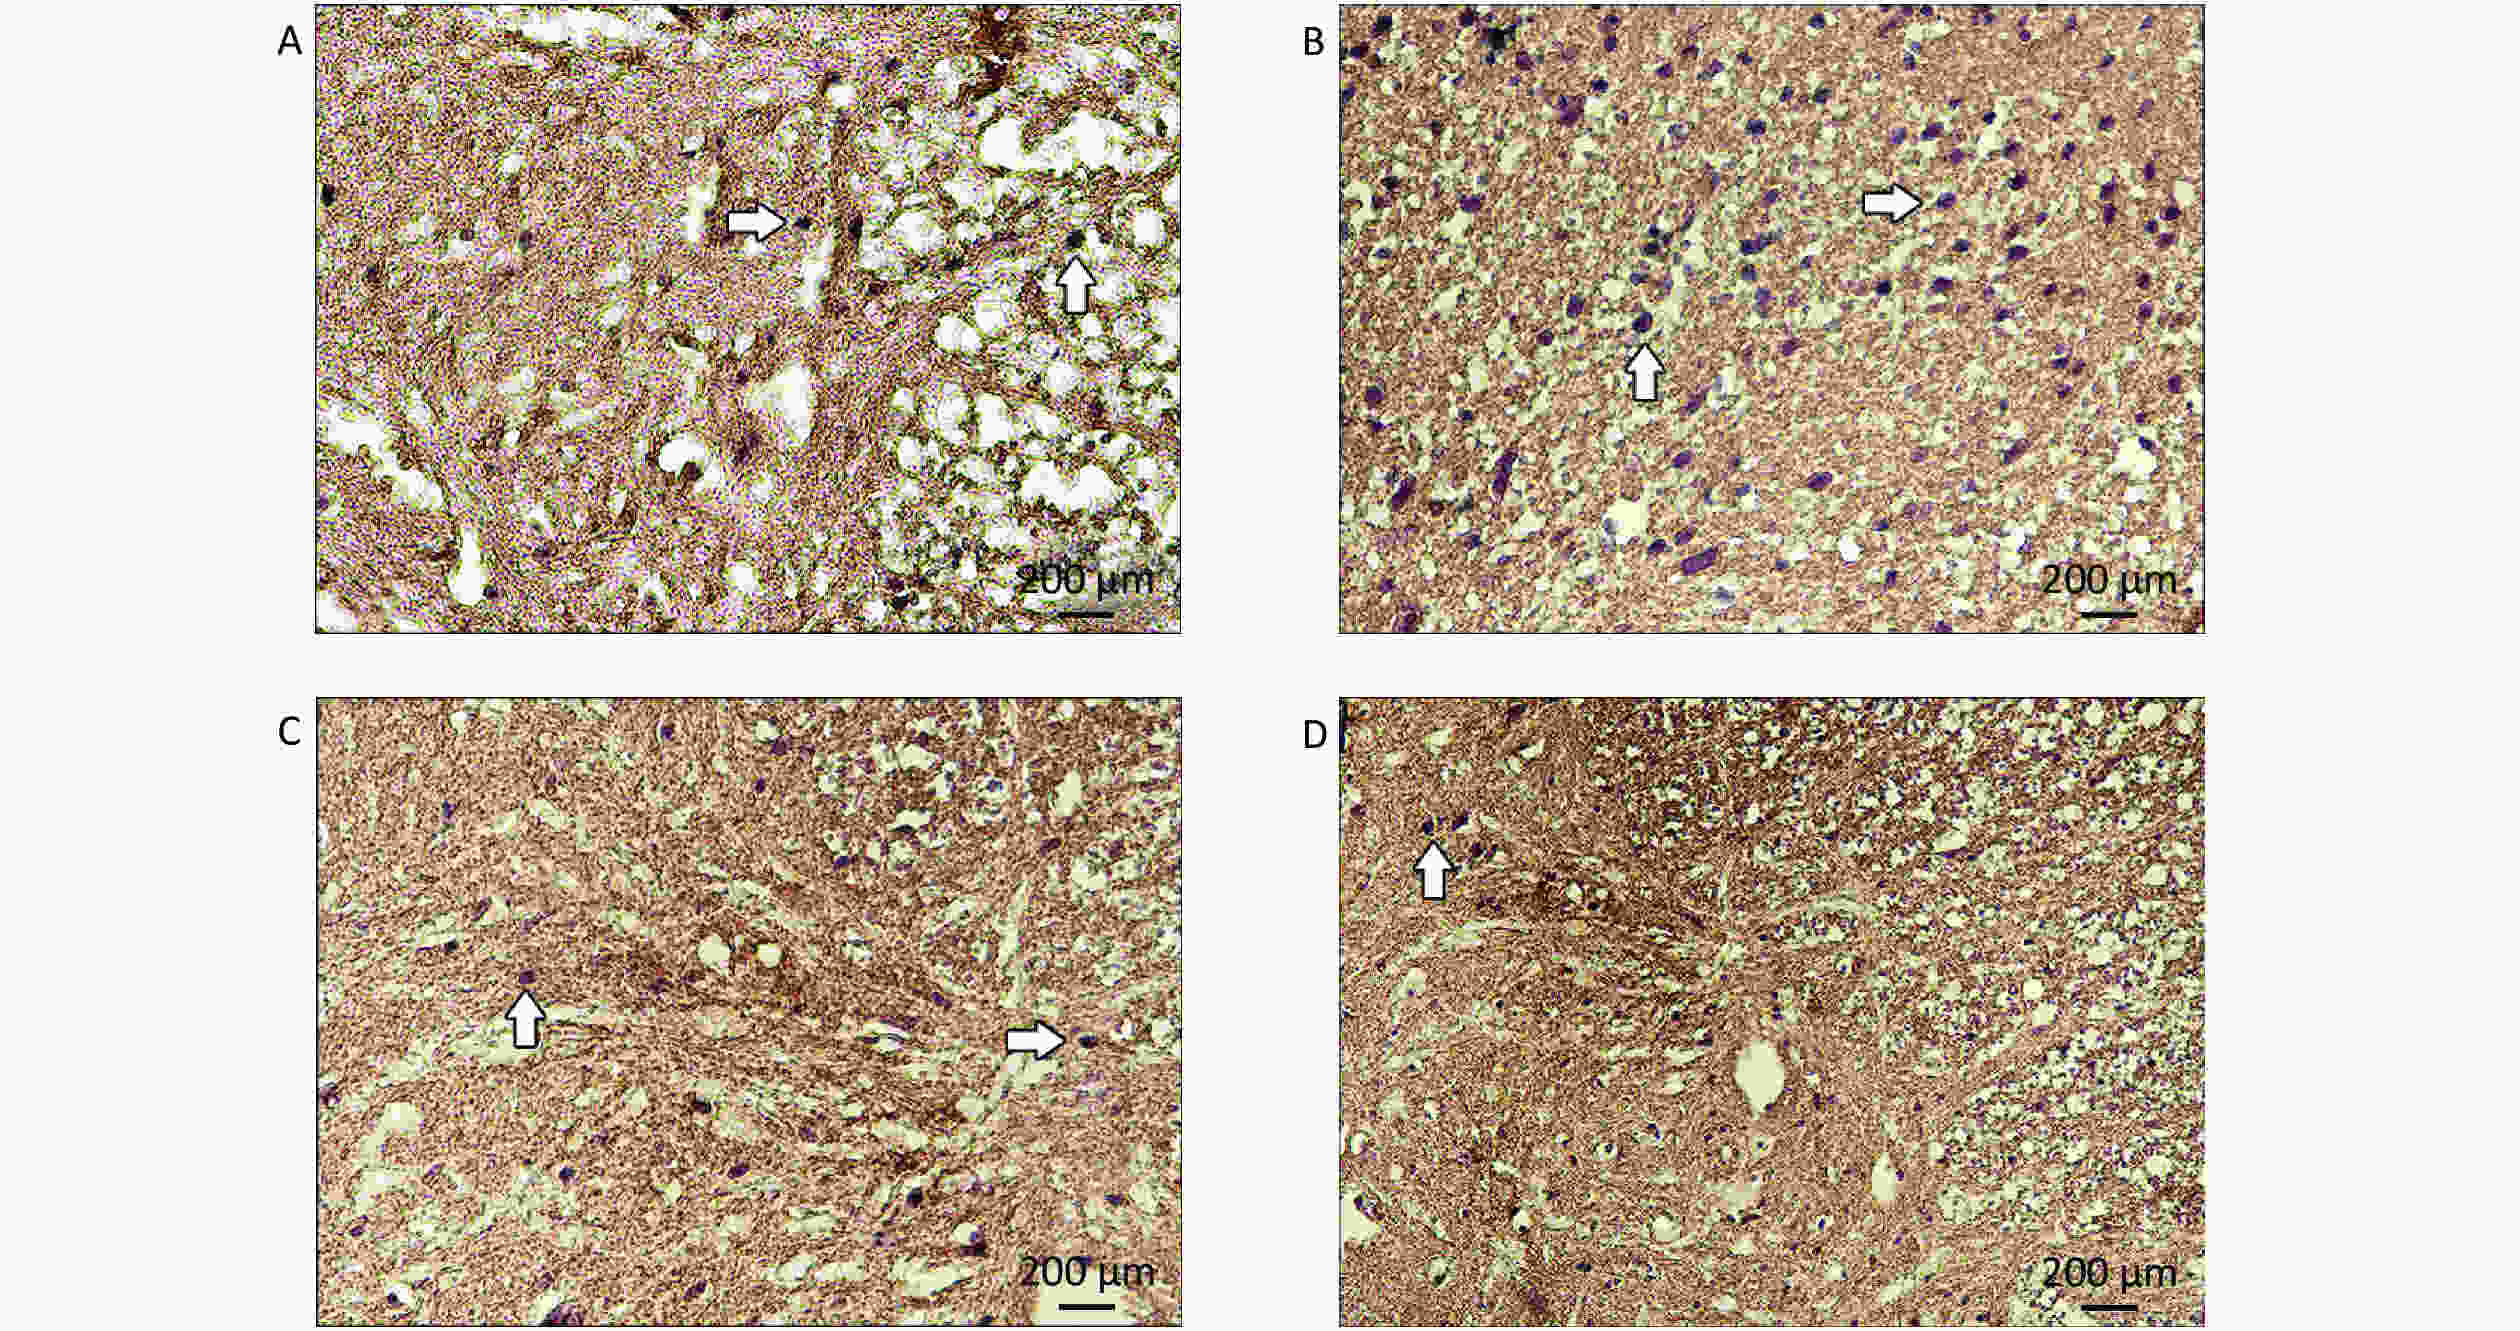
Figure 8. Immunohistochemistry images of spinal cords in the control (A), EMF (B), LUT (C), and EMF + LUT (D) groups. Arrow, positive immunoreactivity in astrocytes.
-
The short- and long-term effects of EMF and the intensity of these effects may vary depending on individual characteristics. Numerous studies have shown the harmful effects of cell phones on biosystems[34]. The occurrence of such complications is possibly due to the unfamiliarity of users with specific instructions and the health effect of EMFs. Altun et al.[35] reported that EMFs cause significant change in the number of neurons and serum enzyme activity in the cerebellum. Alkis et al.[36] documented a significant increase in lipid peroxidation in rat brain exposed to EMF radiation, resulting in oxidative damage to DNA.
The present study estimated the total number of motor neurons and the volume of gray and white matter and central canal via stereology. To the best of our knowledge, this study is the first to survey the neuroprotective effect of LUT against CSC tissue damage following exposure to EMF.
Our stereological findings showed that the total number of motor neurons in the EMF group significantly decreased in comparison with that in the control group. This result may be due to the adverse effect of EMFs on motor neurons. Early reports have revealed a relationship between exposure to EMF and damage to the organism’s body, tissues, cells, and vital macromolecules, such as DNA, proteins, and enzymes[1,2,11]. Kerimoğlu et al.[17] reported that the apoptotic index of neurons significantly increased in the lumbar region of rat CSC tissues exposed to 900 MHz EMF. Exposure to EMF can cause damage to DNAs and plasma membranes and affects the permeability of the blood-brain barrier in the central nervous system. Excessive ROS formation caused by EMF is considered a major agent in neurotoxicity[11]. Oxidative stress can decrease the efficiency of the DNA repair mechanism and the accuracy of replication, leading to destructive damage to the base structure of DNAs[37]. This phenomenon possibly occurs due to the interaction between free radicals and DNA structures and the subsequent production of DNA protein ‘cross-links’ and sugar modifications[38,39]. Xu et al.[40] reported that the neurotoxic effect of EMF is attributed to oxidative damage to mitochondrial DNA and neuronal DNA fragmentation. They also noted a significant increase in mitochondrial RNA transcript levels. Another major cause of complications in the central nervous system is disruption in the function and structure of the blood-brain barrier. Tang et al.[41] investigated the relationship between exposure to EMF and damage to the permeability of the blood–brain barrier. Accordingly, their findings showed an increase in the leakage of dangerous substances and degeneration of neuronal cell organelles. Moreover, the possibility that EMF can change the permeability of axoplasm to small molecules should be considered to be another major factor[42]. If cytokines bind to the plasma membrane receptor, then the potential of plasma membranes changes in response to these stimuli. Therefore, apoptosis occurs due to a decrease in the intracellular Ca2+ level[43].
We also found that the number of motor neurons in the EMF + LUT group significantly increased in comparison with the EMF group; this result may be due to the neuroprotective effect of LUT. The anti-inflammatory and antioxidative activities of LUT were derived by downregulating nod-like receptor pyrin domain-containing 3 protein (NLRP3) levels and upregulating nuclear factor erythroid 2-related factor (Nrf2) levels[44]. Paterniti et al.[45] also reported that LUT administration significantly eliminates free radicals from CSC tissues.
Our biochemical findings revealed that the SOD level in the EMF group is significantly higher than that of the control group. This result is possibly due to the oxidative stress caused by EMF in the SC tissues. İkinci et al.[46] reported an increase in SOD activity in rat CSC following exposure to a 900 MHz EMF. In addition, decreased SOD levels in the EMF + LUT group indicated the ameliorative effect of LUT against EMF-induced oxidative damage in comparison with the EMF group.
Our immunohistochemical findings are the first to exhibit HMGB1 expression in CSC astrocytes exposed to EMF. We observed that the number of HMGB1-positive astrocytes in the EMF group is significantly higher than that in the control group; this result suggests the harmful effect of EMF radiation. HMGB1 has been reported to be released passively by damaged cells[47]. A comparison between the EMF + LUT and EMF groups showed that LUT exerts a protective effect on astrocytes.
Our histopathological findings exhibited degenerated motor neurons in the EMF group compared with the control group; this result is consistent with previous reports. Kerimoğlu et al.[17] reported that EMF exposure causes neuron shrinkage and degeneration in the lumbar region of SC tissues. We also found that LUT protects the histologic architecture of CSC tissues against deterioration caused by EMF.
The present study had budget limitations; thus, other parameters, such as programmed cell death (apoptosis) and electron microscopic examinations in the SC tissues, could not be investigated. Another limitation is the absence of a sham group. We recommend that studies on these parameters should be conducted.
-
Our results showed that exposure to 900 MHz EMF led to morphometrical, biochemical, and morphological damages to rat CSC tissues; motor neurons were particularly more affected. LUT administration might significantly improve SOD enzyme activity, leading to oxidative damages to motor neurons in CSC tissues.
-
The authors would like to thank Dr. Rogayyeh Yahyazadeh and Fariba Javadzadeh for their help in this work.
-
The authors declare that they have no conflicts of interest.
Effect of Luteolin on Biochemical, Immunohistochemical, and Morphometrical Changes in Rat Spinal Cord following Exposure to a 900 MHz Electromagnetic Field
doi: 10.3967/bes2020.078
- Received Date: 2019-09-30
- Accepted Date: 2020-04-01
-
Key words:
- Electromagnetic field /
- Luteolin /
- Motor neuron /
- Oxidative stress /
- Rat /
- Spinal cord
Abstract:
| Citation: | Ahmad Yahyazadeh, Berrin Zuhal Altunkaynak. Effect of Luteolin on Biochemical, Immunohistochemical, and Morphometrical Changes in Rat Spinal Cord following Exposure to a 900 MHz Electromagnetic Field[J]. Biomedical and Environmental Sciences, 2020, 33(8): 593-602. doi: 10.3967/bes2020.078

|


 Quick Links
 DownLoad: