


-
Hypertension is a common chronic disease and, at the same time, a preventable cause of mortality for cardiovascular, cerebrovascular, and coronary heart diseases, which account for a large percentage of the global burden[1-3]. Worldwide, in 2017, the prevalence of hypertension was 25.69% for male and 24.69% for female. From 2006 to 2016, the number of deaths attributed to metabolic risk factors, including high blood pressure, changed from 14.8 million to 17.5 million, with a 17.9% increase. Similar changes were observed for DALYs. High blood pressure was the second leading risk factor for men and the leading risk factor for women in 2016[3]. In China, high systolic blood pressure ranks as the top 1 risk factor for both number of deaths and percentage of DALYs in 2017[4].
So far, the relationship between blood pressure and all-cause mortality remains controversial. The Copenhagen City Heart Study showed that total mortality was increased only in the higher quintiles of SBP. Another study from China reported that lower (< 100 mmHg) or higher (> 120 mmHg) SBP was associated with an increased all-cause mortality risk but may differ by sex[5]. A population-based cohort study, which only included women, also indicated the positive correlation between SBP and all-cause mortality[6]. However, a pooled prospective cohort analysis showed an association between stage 1 hypertension (SBP/DBP 130–139/80–89 mmHg) and increased cardiovascular mortality but not all-cause mortality[7].
The blood pressure of adults aged 18–59 in Shanxi had increased substantially, with an SBP/DBP increase from 122.7 mmHg/72.7 mmHg in 2002 to 132.8 mmHg/78.8 mmHg in 2015, respectively[8]. There is a tremendous need to study the association between blood pressure and all-cause mortality among Chinese adults, considering that hypertension in different countries has different risk factors, including genetic factors, life behavior factors, etc. Therefore, in this study, we investigate the potential risk of blood pressure on all-cause mortality, using data from the Shanxi cohort study, a large population-based study over 13 years.
-
This cohort study, which was launched in 2002, was a subset of China Nutrition and Health Survey. It had six survey points in Shanxi province (Tianzhen County of Datong City, Qifu District and Wuzhai County of Qizhou City, Heshun County of Jinzhong City, Linyi County of Yuncheng city, and Yangcheng County of Jincheng City). In 2002, the total number of subjects (age > 18) with complete information was 6,986. A follow-up survey was conducted between December 2015 and March 2016.
-
A retrospective investigation was performed to collect the related information on the cause of death, including the valid identity number, the date of death, the place of death, the diagnosis of the major diseases of death, the highest diagnostic unit and basis for premortem diseases, records of death investigations, underlying causes of death, etc., which is coded according to the International Classification of Diseases (ICD-10).
Numerous measures have been taken in ensuring the quality of the investigation. Before the follow-up, the monitoring experts of Chinese CDC and Shanxi CDC conducted two unified trainings and assessments of investigators. During the investigation process, designated personnel were responsible for checking and double checking of the questionnaire. After the investigation was completed, each death record was reviewed by the Chinese CDC experts, followed by judgment and confirmation of the final cause of death. The unapproved death records were returned to the local area, and the investigators re-entered into the home or made a call for information verification and supplementary collection.
-
Hypertension is defined as systolic pressure ≥ 140 mmHg and/or diastolic pressure ≥ 90 mmHg and/or taking antihypertensive drugs in the past 2 weeks. Baseline covariates, including age, education, occupation, marital status, alcohol, drinking, physical activity, and body mass index, were selected to avoid potential confounding in the association between both hypertension and total mortality. Smoking was dichotomized into current smokers and nonsmokers. Drinking was divided into four categories: no drinking, drinking 1–2 times a week, drinking 3–4 times a week, and drinking ≥ 5 times a week. Exercise was dichotomized into exercise and no exercise. Education was grouped into three categories: ≤ 9 years of schooling (junior high school or lower); 10–12 years of schooling (high school); and ≥ 13 years of schooling (junior college or higher). Occupation was categorized as manual occupation, nonmanual occupation, and others. Marital status was dichotomized into (1) unmarried, including single, widowed, or separated, and (2) married.
-
Continuous variables were expressed as mean ± SD. The means and frequencies between two groups were compared using t-test and χ2-test. A two-tailed P-value < 0.05 was considered statistically significant. All participants were classified into five groups on the basis of different levels of SBP/DBP (mmHg) (for SBP, < 120 mmHg, 120–139 mmHg, 140–159 mmHg, 160–179 mmHg, and > 180 mmHg; for DBP, < 80 mmHg, 80–89 mmHg, 90–99 mmHg, 100–109 mmHg, and > 100 mmHg), with < 120 mmHg SBP and < 80 mmHg DBP as the reference group. Cox proportional hazards model was used to estimate the relation between levels of SBP and DBP and all-cause mortality. Unadjusted and adjusted hazard ratios (HRs) and their 95% confidence intervals (CI) were calculated. SAS software package (version 9.4, SAS Institute Inc., Carey, NC, USA) was used for all analyses.
-
A total of 5,346 participants, including 2,567 male and 2,779 female, were recruited and followed up until March 2016. The follow-up rate was 76.52%. The mean ages of the follow-up and the lost for males and for females at baseline were 45.9 ± 14.0 years and 44.2 ± 14.8 years and 44.0 ± 13.5 years and 38.0 ± 14.4 years, respectively. The mean SBP/DBP levels of the follow-up participants were 124.9 ± 16.4 mmHg and 79.1 ± 10.3 mmHg for males and 123.3 ± 19.6 mmHg and 77.2 ± 10.5 mmHg for females at baseline. The mean SBP/DBP levels of the lost participants were 125.0 ± 16.2 mmHg and 78.4 ± 9.2 mmHg for males and 121.6 ± 18.6 mmHg and 76.5 ± 10.0 mmHg for females. As regards the blood pressure, no significant difference was noted between the follow-up and the lost (P > 0.05), except the SBP level of females (P < 0.05). Table 1 lists the other basic characteristics of those followed up and the lost. The difference in age, marital status, and alcohol intake was significant for males between those followed up and the lost. The difference in age, height, mean SBP, marital status, year of education, and occupation was significant for females between those followed up and the lost. Moreover, Supplementary Table S1 (available in www.besjournal.com) shows the demographic characteristics of the study populations stratified by baseline SBP.
Item Male Female Follow-up The lost P value Follow-up The lost P value All 2,567 618 2,779 1,022 Height (cm) 167.3 ± 6.1 167.8 ± 6.9 0.1184 156.3 ± 5.9 157.4 ± 5.6 < 0.0001 Weight (kg) 65.8 ± 9.9 66.6 ± 10.0 0.0752 58.5 ± 9.3 58.8 ± 8.8 0.4087 BMI (kg/m2) 23.5 ± 3.1 23.6 ± 3.2 0.2363 24.0 ± 3.5 23.7 ± 3.3 0.0642 SBP (mmHg) 124.9 ± 16.4 125.0 ± 16.2 0.8993 123.3 ± 19.6 121.6 ± 18.6 0.0168 DBP (mmHg) 79.1 ± 10.3 78.4 ± 9.2 0.0812 77.2 ± 10.5 76.5 ± 10.0 0.0767 Age 18− 336 (13.1) 105 (17.0) 0.0163 424 (15.3) 363 (35.5) < 0.0001 30− 611 (23.8) 164 (26.5) 736 (26.5) 266 (26.0) 40− 626 (24.4) 142 (23.0) 690 (24.8) 167 (16.3) 50− 510 (19.9) 94 (15.2) 526 (18.9) 123 (12.1) 60− 320 (12.4) 70 (11.3) 300 (10.8) 67 (6.6) > 70 164 (6.4) 43 (7.0) 103 (3.7) 36 (3.5) Marital status Married 2,326 (90.7) 513 (83.1) < 0.0001 2,535 (91.2) 858 (83.9) < 0.0001 Unmarried 238 (9.3) 104 (16.9) 244 (8.8) 164 (16.1) Year of Education < 9 1,884 (73.7) 440 (71.3) 0.2805 2,290 (82.6) 713 (69.8) < 0.0001 10− 512 (20.0) 128 (20.8) 383 (13.8) 222 (21.7) 12− 161 (6.3) 49 (7.9) 100 (3.6) 87 (8.5) Occupation Non-manual 552 (21.5) 127 (20.7) 0.1785 274 (9.9) 201 (19.7) < 0.0001 Manual 1,613 (62.9) 373 (60.6) 862 (31.0) 244 (23.9) Others 401 (15.6) 115 (18.7) 1,641 (59.1) 576 (56.4) Smoke Current smoker 1,586 (61.8) 357 (57.8) 0.066 22 (0.8) 13 (1.3) 0.1692 Never smoke 981 (38.2) 261 (42.2) 2,757 (99.2) 1,009 (98.7) Alcohol (times/week) 0 1,622 (65.1) 342 (59.0) 0.0109 2,678 (98.7) 962 (99.1) 0.6633 1− 547 (21.9) 154 (26.5) 20 (0.7) 5 (0.5) 3− 166 (6.7) 52 (9.0) 1 (0.1) 1 (0.1) ≥ 5 158 (6.3) 32 (5.5) 13 (0.5) 3 (0.3) Regular PA Yes 306 (11.9) 67 (10.8) 0.4539 295 (10.6) 93 (9.1) 0.1712 No 2,261 (88.1) 551 (89.2) 2,484 (89.4) 929 (90.9) Note. BMI, body mass index; PA, physical activity. Table 1. Baseline characteristics between the follow-up and the lost population
Total SBP level (mmHg) < 120 120− 140− 160− > 180 P value Number of participants 5,346 2,202 2,221 630 228 65 Age (yrs) 44.9 ± 13.8 39.0 ± 11.9 46.6 ± 13.3 53.8 ± 12.0 57.5 ± 12.0 57.7 ± 11.2 < 0.0001 Height (cm) 161.6 ± 8.1 161.2 ± 7.8 162.6 ± 8.1 160.7 ± 8.8 159.0 ± 8.0 157.2 ± 8.6 < 0.0001 Weight (kg) 62.0 ± 10.2 59.7 ± 9.3 63.5 ± 10.2 64.5 ± 11.3 64.0 ± 10.8 61.8 ± 12.1 < 0.0001 BMI (kg/m2) 23.7 ± 3.3 22.9 ± 3.1 24.0 ± 3.2 24.9 ± 3.9 25.2 ± 3.5 24.9 ± 3.8 < 0.0001 SBP (mmHg) 124.1 ± 18.2 108.7 ± 7.3 126.8 ± 5.8 146.1 ± 6.1 165.7 ± 6.0 190.7 ± 12.5 < 0.0001 DBP (mmHg) 78.1 ± 10.4 71.0 ± 6.8 80.3 ± 7.0 87.7 ± 9.6 92.9 ± 11.5 101.8 ± 14.1 < 0.0001 Marital status < 0.0001 Married 4,861 (91.0) 2,006 (41.3) 2,027 (41.7) 570 (11.7) 203 (4.2) 55 (1.1) Unmarried 482 (9.0) 195 (40.5) 192 (39.8) 60 (12.4) 25 (5.2) 10 (2.1) Year of Education < 0.0001 < 9 4,174 (78.3) 1,631 (39.1) 1,765 (42.3) 520 (12.5) 202 (4.8) 56 (1.3) 10− 895 (16.8) 414 (46.3) 360 (40.2) 91 (10.2) 22 (2.5) 8 (0.9) 12− 261 (4.9) 151 (57.9) 88 (33.7) 17 (6.5) 4 (1.5) 1 (0.4) Occupation < 0.0001 Non-manual 826 (15.5) 401 (48.5) 322 (39.0) 80 (9.7) 19 (2.3) 4 (0.5) Manual 2,475 (46.3) 1,086 (43.9) 1,084 (43.8) 224 (9.1) 65 (2.6) 16 (0.6) Others 2,042 (38.2) 715 (35.0) 813 (39.8) 326 (16.0) 144 (7.1) 44 (2.2) Smoke < 0.0001 Current smoker 1,608 (30.1) 604 (37.6) 770 (47.9) 177 (11.0) 45 (2.8) 12 (0.7) Never smoker 3,738 (69.9) 1,598 (42.8) 1451 (38.8) 453 (12.1) 183 (4.9) 53 (1.4) Alcohol (times/week) < 0.0001 0 4,300 (82.6) 1,796 (41.8) 1,708 (39.7) 532 (12.4) 205 (4.8) 59 (1.4) 1− 567 (10.9) 219 (38.6) 278 (49.0) 55 (9.7) 12 (2.1) 3 (0.5) 3− 167 (3.2) 57 (34.1) 88 (52.7) 16 (9.6) 5 (3.0) 1 (0.6) ≥ 5 171 (3.3) 63 (36.8) 91 (53.2) 11 (6.4) 5 (2.9) 1 (0.6) Regular PA < 0.0001 Yes 601 (11.2) 182 (30.3) 232 (38.6) 119 (19.8) 56 (9.3) 12 (2.0) No 4,745 (88.8) 2,020 (42.6) 1,989 (41.9) 511 (10.8) 172 (3.6) 53 (1.1) Note. BMI, body mass index; PA, physical activity. Table S1. Demographic characteristics of the study populations stratified by baseline SBP
Participants were followed up for 66948.6 person-years. A total of 614 (364 male and 250 female) all-cause death events occurred during the follow-up, among whom were 229 cases < 60 years of age and 385 > 60 years. The crude all-cause mortality rates (95% CI) were 1149.79 (1037.54–1274.19) per 100,000 person-years for males and 708.40 (625.81–801.89) for females. And the crude all-cause mortality rates (95% CI) were 397.62 (349.31–452.60) for persons < 60 years of age and 4115.21 (3724.00–4547.51) for those ≥ 60 years. Table 2 shows the number of deaths and cumulative mortality rates reported for all-cause mortality by gender and age. Significant differences of all-cause mortality were observed between male and female (χ2 = 35.779, P < 0.001) and < 60-year-old and > 60-year-old participants (χ2 = 1223.965, P < 0.001).
Item Death PY Crude mortality rate (95% CI) (/100,000 PY) χ2 P Sex Male 364 31658.0 1149.8 (1037.5–1274.2) 35.779 < 0.001 Female 250 35290.8 708.4 (625.8–801.9) Age < 60 229 57593.2 397.6 (349.3–452.6) 1223.965 < 0.001 ≥ 60 385 9355.4 4115.2 (3724.0–4547.5) Total 614 66948.6 917.1 (847.4–992.6) Note. PY, person-years; CI, confidence interval. Table 2. The number and cumulative mortality rate by sex and age
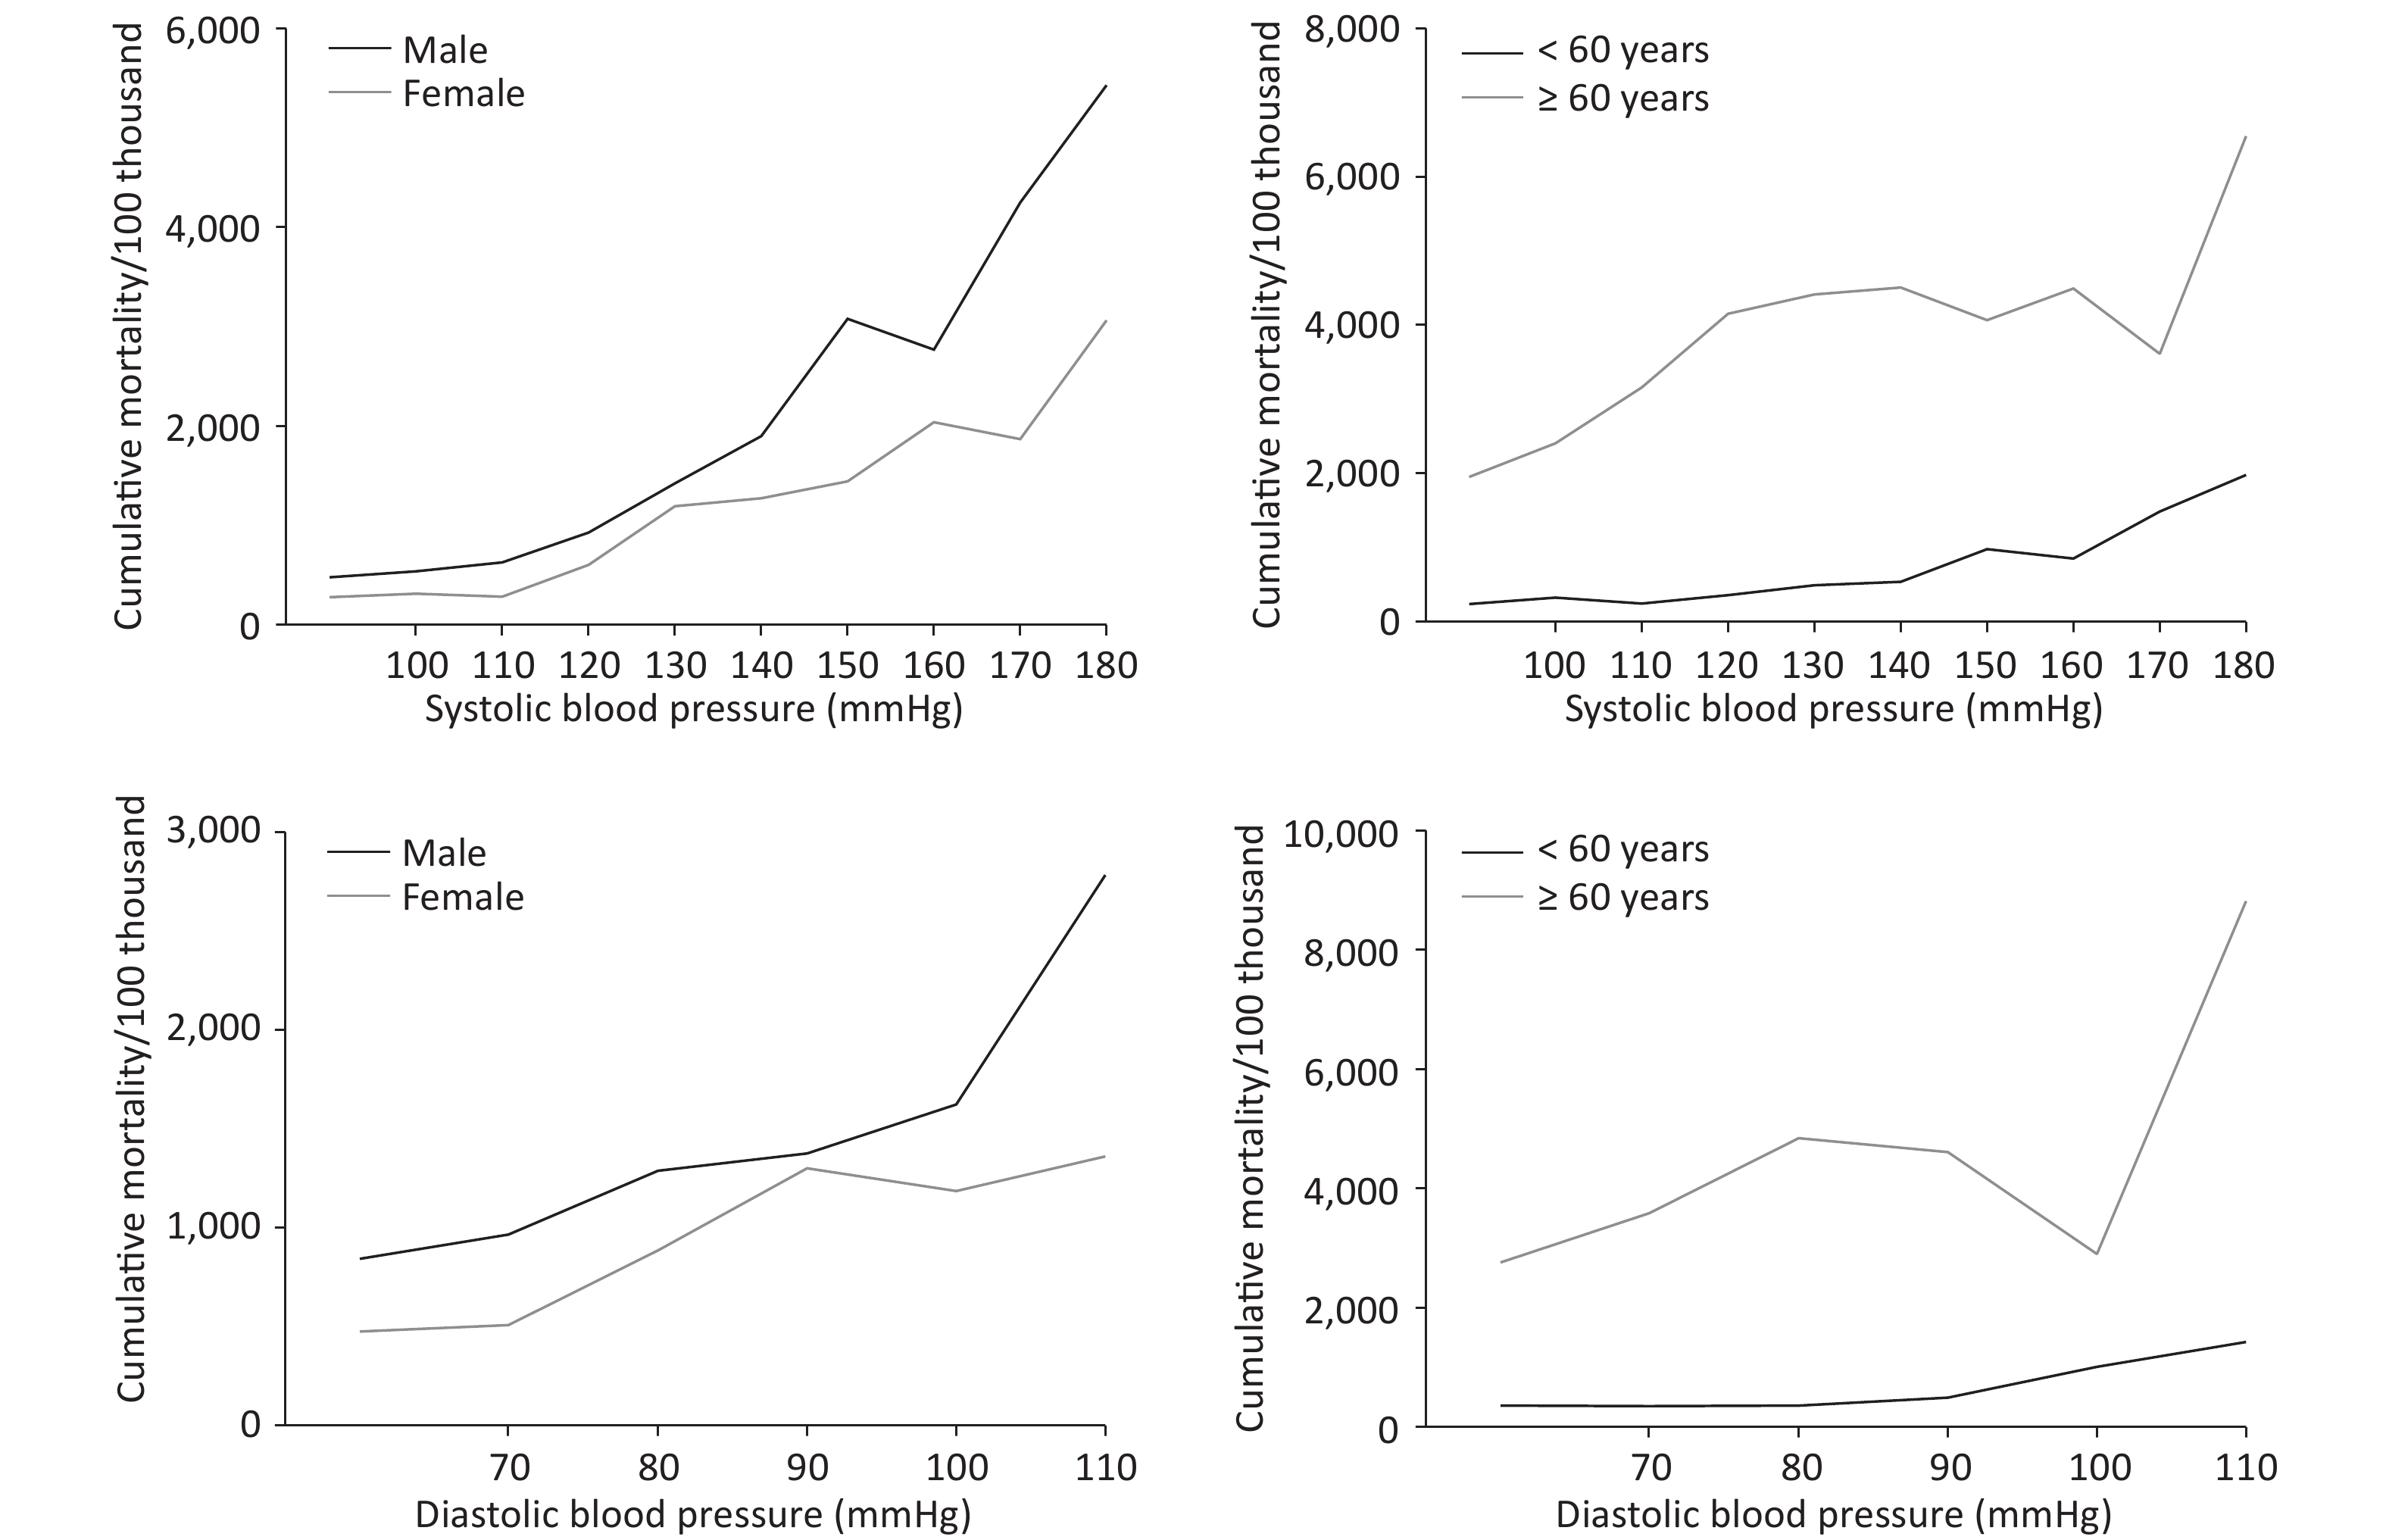
Figure 1 and Supplementary Table S2 (available in www.besjournal.com) shows the cumulative all-cause mortality rates at different SBP/DBP levels. The gender analysis showed that participants with SBP < 120 mmHg/DBP < 80 mmHg had the lowest cumulative mortality rate, with 596.1/100,000 and 935.2/100,000 for male and 297.3/100,000 and 499.0/100,000 for female, respectively. The cumulative mortality rate rose with the increasing SBP or DBP pressure (χ2trend = 270.537, P < 0.001 for SBP; χ2trend = 57.240, P < 0.001 for DBP). After being stratified by age and gender, the trends that cumulative all-cause mortality rose with blood pressure still existed. However, the cumulative all-cause mortality rate of > 60-year-old participants had an obvious decline at 100–119 mmHg in the DBP group. With the same blood pressure, the cumulative all-cause mortality rate for > 60-year-old participants was higher than those < 60-year-old. As regards gender, no significant difference was recorded between male and female with SBP ≥ 160 mmHg and DBP ≥ 90 mmHg.
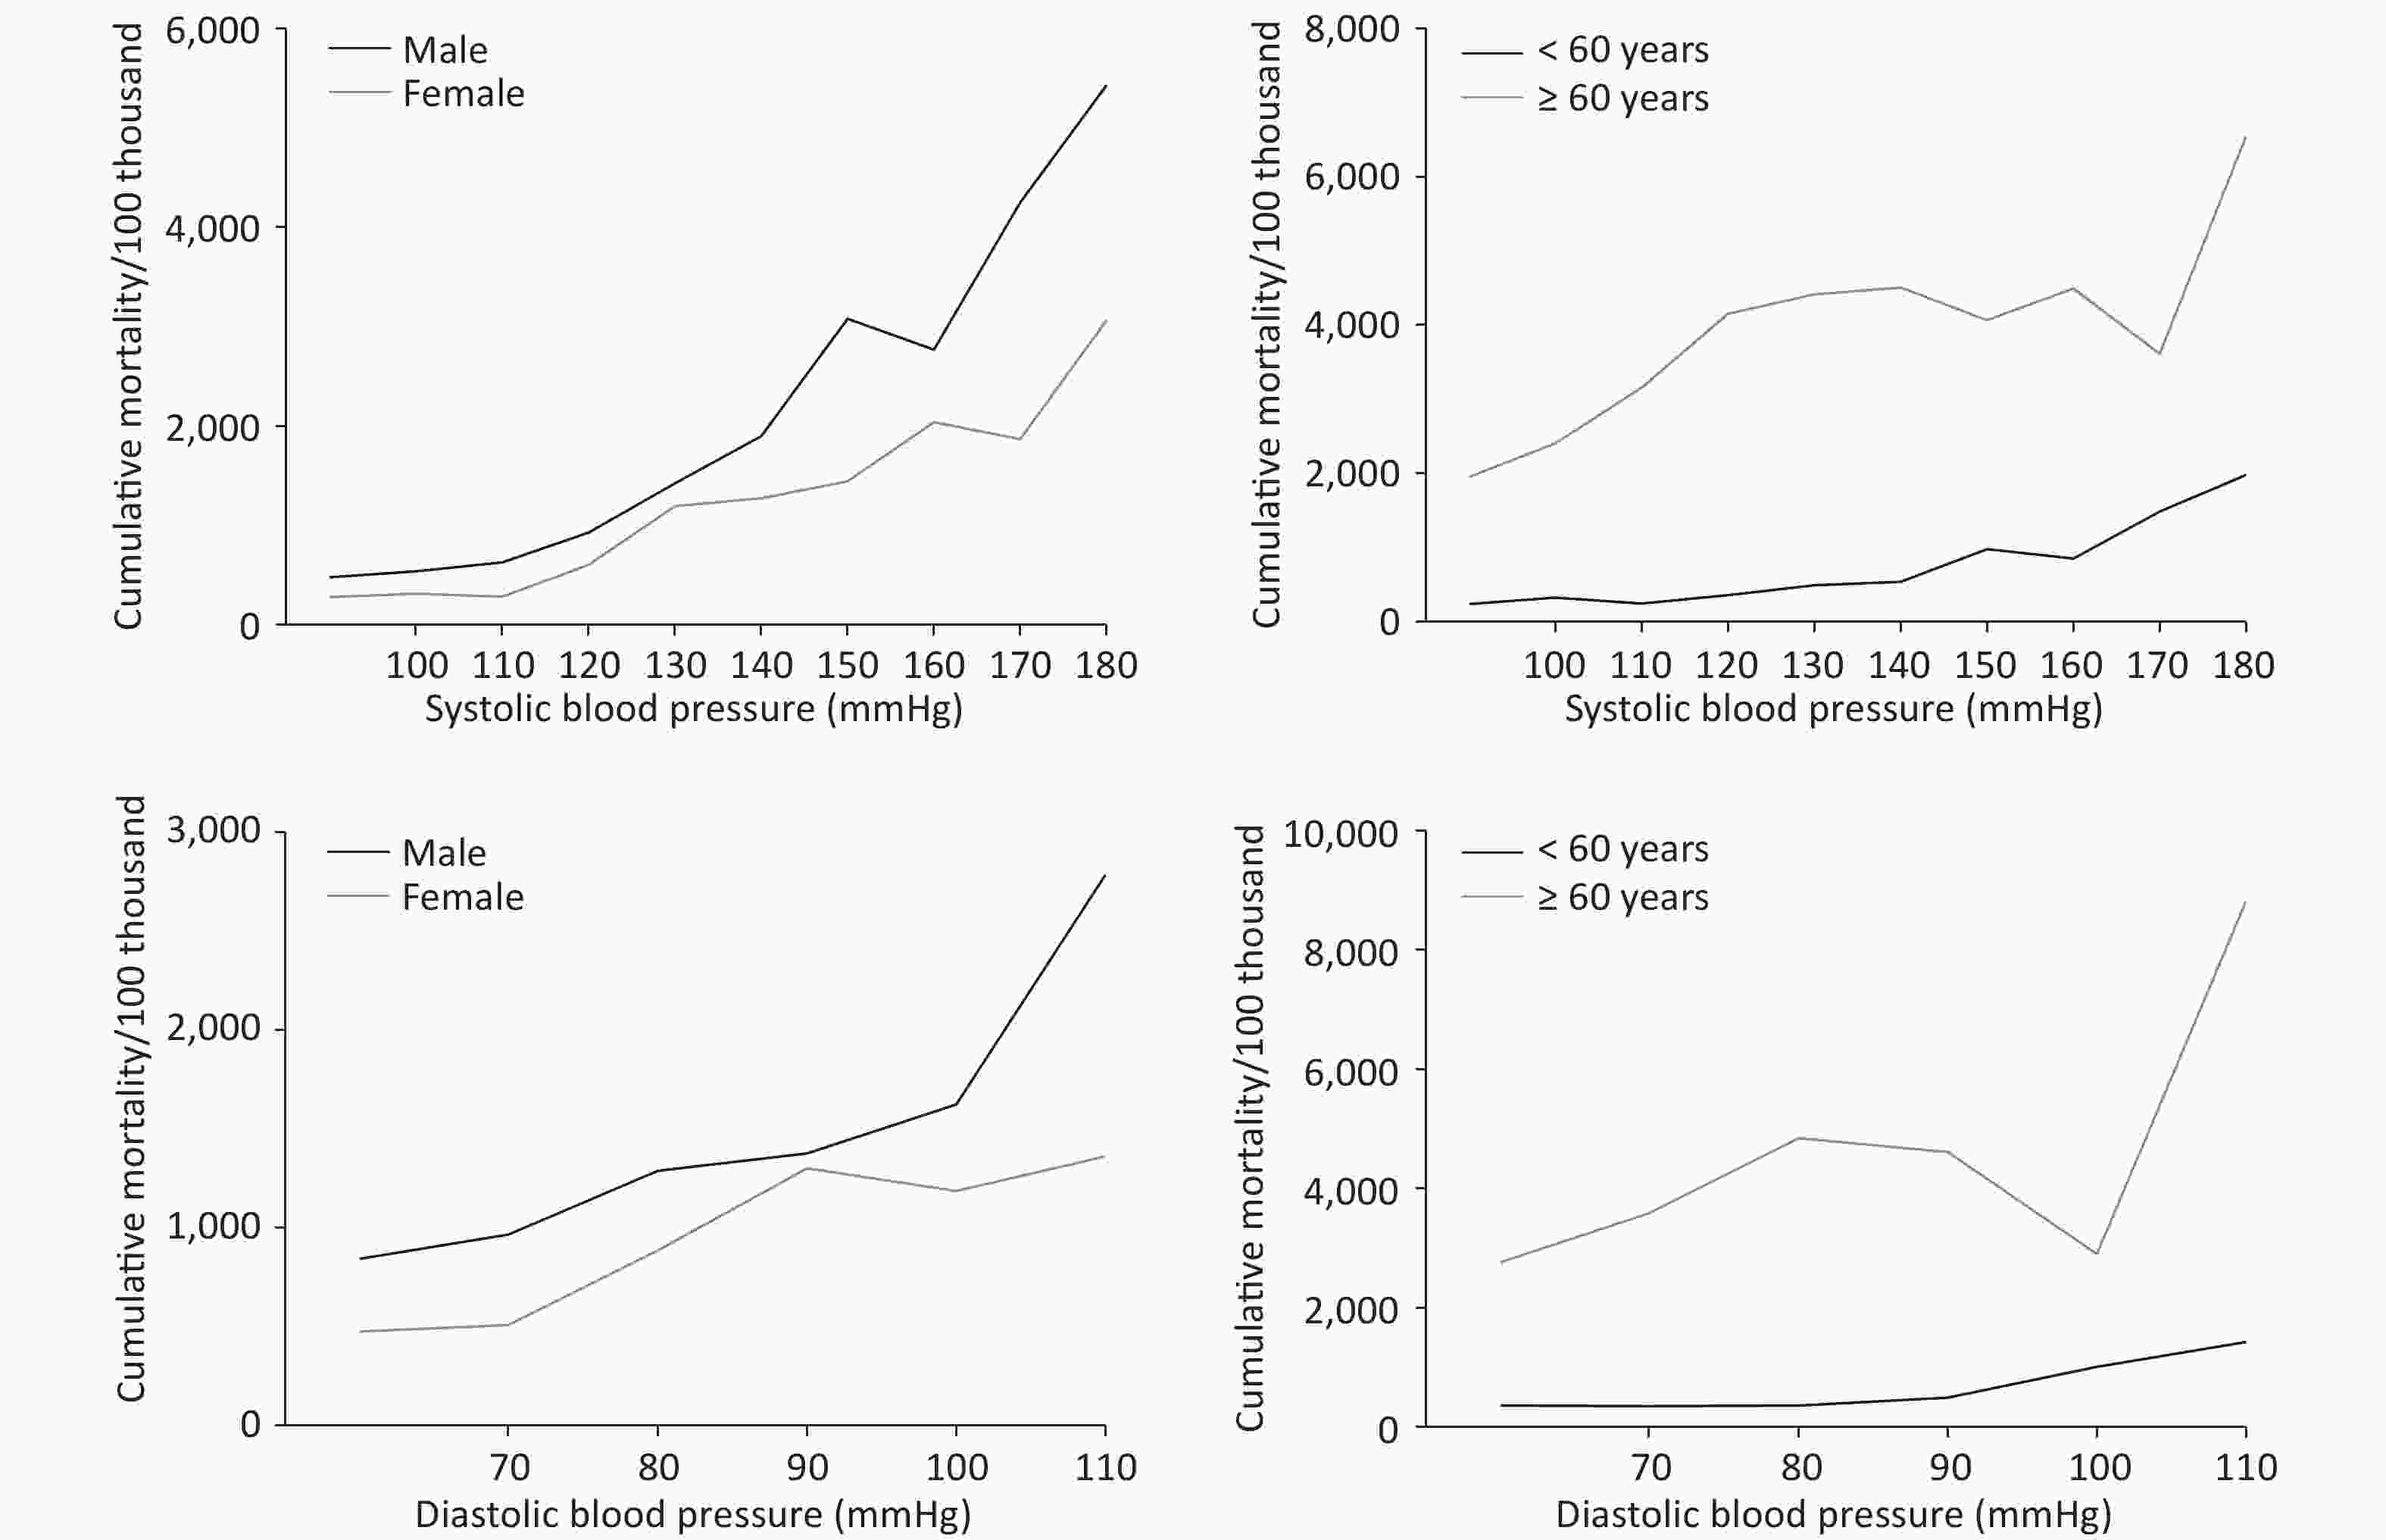
Figure 1. Cumulative mortality of population at different SBP/SDP level by age and sex.
SBP < 120 mmHg 120– mmHg 140– mmHg 160– mmHg 180– mmHg χ2 P value Sex Male 596.1
(470.8–754.7)1112.1
(956.4–1293.0)2247.8
(1810.3–4450.9)3147.5
(2225.8–4450.9)5431.1
(3084.5–9563.4)129.177 < 0.001 Female 297.3
(225.3–392.2)810.6
(667.0–985.2)1344.9
(1027.5–1760.5)1980.9
(1400.8–2801.2)3066.5
(1816.1–5177.7)135.924 < 0.001 χ2 14.671 6.433 8.840 3.570 2.262 P < 0.001 0.011 0.03 0.059 0.133 Age < 60 275.8
(219.6–346.3)406.8
(333.0–496.9)679.0
(489.8–941.4)1030.5
(621.2–1709.3)1986.6
(993.5–3972.4)50.494 < 0.001 ≥ 60 2884.7
(2153.8–3863.5)4288.7
(3696.5–4975.7)4328.6
(3554.6–5271.0)4165.1
(3147.9–5510.9)6550.4
(4126.9–10396.8)5.542 0.019 χ2 240.427 539.667 121.818 26.975 9.218 P < 0.001 < 0.001 < 0.001 < 0.001 0.002 Total 419.1
(350.2–501.6)976.3
(866.5–1099.9)1778.9
(1502.8–2105.9)2431.5
(1903.1–3106.6)3837.6
(2612.9–5636.4)270.537 < 0.001 DBP < 80 mmHg 80– mmHg 90– mmHg 100– mmHg 110– mmHg χ2 P value Sex Male 935.2
(795.2–1099.9)1289.7
(1096.5–1516.8)1375.9
(1033.7–1831.2)1622.7
(994.1–2648.7)2783.6
(1448.4–5349.9)16.746 < 0.001 Female 499.0
(411.8–604.8)887.4
(720.1–1093.7)1300.7
(961.3–1760.1)1186.2
(673.7–2888.8)1362.2
(511.2–3629.5)35.266 < 0.001 χ2 24.930 7.846 0.071 0.690 1.517 P < 0.001 0.005 0.790 0.406 0.218 Age < 60 354.5
(295.3–425.6)360.9
(282.5–461.1)492.5
(335.3–723.4)1009.5
(618.5–1647.9)1427.9
(714.1–2855.2)19.367 < 0.001 ≥ 60 3363.1
(2841.1–3981.1)4849.3
(4172.4–5635.9)4610.9
(3602.0–5902.5)2907.5
(1651.2–5119.7)8819.1
(3670.7–21188.4)4.265 0.039 χ2 474.722 541.033 139.365 80525 13.526 P < 0.001 < 0.001 < 0.001 0.004 < 0.001 Total 685.8
(605.9–776.3)1101.8
(969.3–1252.5)1339.3
(1088.1–1646.6)1404.7
(967.8–2030.1)2107.1
(1223.5–3628.9)57.240 < 0.001 Note. CI, confidence interval. Table S2. The cumulative mortality rates of participants at different SBP/DBP level by sex and age
Finally, a Cox proportional hazards model was used to compute HRs and their 95% CIs for total death events, using < 120 mmHg/< 80 mmHg group as a reference, respectively. In the unadjusted Cox proportional hazards analysis, groups with > 120 mmHg SBP and > 80 mmHg DBP were all significantly associated with a greater HR for all-cause mortality compared with the corresponding reference group. The total unadjusted HR (95% CI) was 1.756 (1.644–1.875). After adjusted for the confounding factors, a significant association remains between all-cause mortality and high SBP (≥ 160 mmHg) and high DBP (≥ 100 mmHg), with aHR ranging from 1.405- to 2.179-fold for SBP and 1.550- to 2.854-fold for DBP (P < 0.05 for both). Table 3 shows the unadjusted and adjusted HRs for the association of mortality and SBP/DBP by gender and age. Persons with > 180 mmHg SBP had a significantly higher mortality risk, with HR (95% CI) of 2.506 (1.320–4.758) for males and 1.953 (1.017–3.751) for females. The HRs (95% CI) for persons with > 180 mmHg SBP was 3.714 (1.760–7.836) for those < 60 years of age and 1.947 (1.086–3.491) for those ≥ 60 years. Compared with the DBP reference group, the males in the ≥ 100 mmHg group had a significantly higher mortality with HRs (95% CI) of 2.715 (1.377–5.351). However, none of the DBP groups among females had a significantly increased risk for death with HRs.
Item Total Male
adjusted HR*
(95% CI)Female
adjusted HR*
(95% CI)< 60
adjusted HR*
(95% CI)≥ 60
adjusted HR*
(95% CI)Unadjusted HR Adjusted HR*
(95% CI)SBP 120− 2.302 (1.855–2.858) 1.165 (0.929–1.461) 1.101 (0.819–1.479) 1.120 (0.782–1.602) 1.004 (0.729–1.382) 1.396 (0.997–1.955) 140− 4.247 (3.318–5.436) 1.299 (0.992–1.701) 1.257 (0.879–1.797) 1.248 (0.822–1.895) 1.186 (0.763–1.843) 1.491 (1.028–2.162) 160− 5.790 (4.266–7.858) 1.405 (1.012–1.951) 1.284 (0.811–2.034) 1.338 (0.829–2.160) 1.954 (1.094–3.492) 1.397 (0.913–2.137) 180− 9.374 (6.132–14.33) 2.179 (1.385–3.427) 2.506 (1.320–4.758) 1.953 (1.017–3.751) 3.714 (1.760–7.836) 1.947 (1.086–3.491) Total 1.756 (1.644–1.875) 1.162 (1.067–1.266) 1.193 (1.057–1.346) 1.115 (0.984–1.263) 1.265 (1.092–1.466) 1.117 (1.005–1.240) DBP 80− 1.609 (1.345–1.926) 1.196 (0.996–1.437) 1.096 (0.864–1.390) 1.277 (0.951–1.713) 0.768 (0.559–1.057) 1.556 (1.233–1.965) 90− 1.984 (1.557–2.528) 1.262 (0.980–1.624) 1.120 (0.791–1.586) 1.334 (0.918–1.939) 0.843 (0.537–1.324) 1.620 (1.186–2.214) 100− 2.075 (1.404–3.067) 1.550 (1.036–2.320) 1.467 (0.865–2.489) 1.698 (0.903–3.193) 2.080 (1.214–3.564) 1.151 (0.616–2.148) 110− 3.145 (1.800–5.493) 2.854 (1.630–4.999) 2.715 (1.377–5.351) 2.391 (0.874–6.541) 2.470 (1.194–5.110) 3.526 (1.428–8.705) Total 1.340 (1.250–1.436) 1.164 (1.078–1.257) 1.128 (1.017–1.251) 1.184 (1.052–1.334) 1.116 (0.983–1.267) 1.210 (1.096–1.335) Note. HR, hazard ratio; CI, confidence interval. *Adjusted for education, occupation, marital, smoking, alcohol, physical activity and BMI. Table 3. Hazards ratio for all-cause mortality according to SBP/DBP levels
-
In this population-based prospective study, we found that participants with < 120 mmHg baseline SBP or < 80 mmHg DBP had the lowest cumulative mortality outcome in the northern town area. A significant trend was observed that the cumulative mortality rate rose with the increasing SBP or DBP pressure. After adjusting confounding factors, participants with SBP ≥ 160 mmHg or DBP ≥ 100 mmHg had significant HRs for all-cause mortality. In our study, we found no association between prehypertension and the elevated risk of all-cause mortality.
In our Cox proportional hazards models analysis, SBP < 120 mmHg and DBP < 80 mmHg subgroups were set as the reference group. These thresholds were chosen because the MORGAM study found the relation of DBP to mortality risk to be J-shaped, with the lowest mortality risk at a DBP of about 82 mmHg for all-cause mortality. For the SBP, the relation was J-shaped for all-cause mortality, with the lowest mortality at a SBP of about 120 mmHg[9]. Therefore, we made a slight adjustment to the DBP threshold. In addition, the threshold values set in this study are consistent with the JNC7 guidelines[10], where they are defined as the upper limits for optimal SBP and DBP.
According to JNC-7, a blood pressure of 120–139 mmHg/80–89 mmHg, which was defined as prehypertension, included elevated BP and stage I hypertension. Several studies had explored the association between prehypertension and mortality, with conclusions similar to ours. A pooled prospective cohort study of 154,407 Chinese adults showed that stage 1 hypertension was associated with an elevated risk of CVD mortality but not with all-cause mortality[7]. Another meta-analysis of 20 cohort studies also had the same results[11]. A previous analysis in the SWHS reported no association between stage I hypertension and all-cause mortality. However, that study included only women[6]. A study from Singapore, including 5,830 adults, found no significant associations between prehypertension and all-cause and CVD mortality[12].
The current findings on the relationship between blood pressure and all-cause mortality risk were inconsistent. A U-curve relationship between SBP and mortality was observed based on a long-term population-based study of heart failure patients[13]. In the Asian population, a J-shaped association between lower SBP and all-cause mortality was found in old and middle-aged Korean men[14]. Two studies from China also had the same results. However, one of the cohort studies only included female participants, while the other observed the J-shaped relationship only in men[5]. In our study, the significant relationship between SBP/DBP and all-cause mortality was observed in all adults, male and female, and > 60-year-old adults. However, we could not obtain a clear evidence on whether it is J-shaped or U-shaped using the current data. However, the result was consistent with another study from China[15].
Although studies have demonstrated the importance of treating isolated systolic hypertension even with low DBP[16], the SBP/DBP level had a different predictive value for stratified gender or age. The results showed an association between the increase of SBP or DBP and approximately 16% risk of all-cause mortality. For SBP, the aHRs were higher in males and < 60-year-old subgroups than in females and ≥ 60-year-old subgroups, respectively, which mean that treating high SBP may yield a better result in males and < 60-year-old subgroups. But for DBP, a reverse association was noted. It is worthy to note that a significant association exists between all-cause mortality risk and most DBP levels among > 60-year-old participants. At the same time, no obvious association was found for females at each DBP level. The result was inconsistent with studies from Europe and Australia[17-19], which proposed the prognostic value of DBP in < 50-year-old individuals. Whether the differences could be attributed to ethnicity remains to be determined. Furthermore, the prevention and control of blood pressure for male and > 60-year-old participants with higher DBP level in rural areas was a matter of cardinal significance. In 2013, 22.78% of the total deaths were caused by high blood pressure in China, and the burden of disease caused by high blood pressure in rural areas was higher than that in cities[20]. In addition, the SBP and DBP levels for rural residents of Shanxi province increased by 6.7% and 9.5% for men and 9.3 and 7.8 for women, respectively[8]. Therefore, we should explore the appropriate technologies suitable for rural residents’ high blood pressure and associated risk factors and strengthen its prevention and control.
The strength of this study is the use of the population-based cohort with a long follow-up period (almost up to 14 years), which may help in estimating the association between high SBP and mortality correctly. Moreover, education, occupation, marital status, alcohol, smoking, exercise, and BMI were taken into consideration in our Cox analyses to avoid the corresponding bias. Our study also has some limitations. First, the study included the relatively small sample size and death events, which reduce the statistical power. Second, to avoid the misclassification of the cause of death and, more importantly, to avoid instability of the results due to the small sample size, we used only all-cause mortality instead of cardiovascular death and others. Finally, blood pressure is an ever-changing variable in individuals during follow-up. Therefore, some studies included blood pressure variability to assess the death risk[21-23]. However, many previous studies, including the famous Framingham Study, were all based on a baseline measurement.
In conclusion, the all-cause mortality rates rose with the increasing SBP or DBP pressure. Adults with a higher blood pressure level (SBP > 160 mmHg and DBP > 100 mmHg) had a high mortality risk. The distribution of HR for DBP and mortality varied with different genders and ages. Our findings will be a helpful guide for clinical practice in treating high blood pressure.
-
The authors are grateful for all those who participated in the baseline investigation and follow-up study.
-
The authors have no commercial or other associations that might pose a conflict of interest.
Funds:
This work was supported by National Key R&D Program of China [2016YFC0901001]; National Key Technology R&D Program in China [No. 2008BAI56B04]
&These authors contributed equally to this work.
 Quick Links
 DownLoad: