


-
Uric acid is the final oxidation product of purine metabolism. Overproduction or decreased excretion of serum uric acid (SUA) can lead to hyperuricemia, which is strongly associated with several cardiometabolic diseases[1]. Notably, recent studies have revealed that hyperuricemia is related to an increased risk of diabetes[2-4]. However, only a few studies have evaluated the impact of glucose tolerance or serum glucose levels on the prevalence of hyperuricemia[5].
Several epidemiological studies investigating the relationship between glycemic indices and SUA levels have been conducted but reported inconsistent results. For example, a U-shaped relationship was found between fasting plasma glucose (FPG) and SUA levels in individuals with normal glucose tolerance (NGT)[6], but a linearly negative relationship was observed between these variables in diabetic patients[7]. A recent study showed that the association dynamically changed according to the levels of glucose tolerance[8], which was confirmed by several other studies[9,10]. The controversial conclusions might be attributable to the heterogeneity in ethnicities and glycemic status of the participants. To date, few studies have evaluated the relationship between glycemic indices and SUA levels across the full spectrum of glucose tolerance in the general population. However, the exact association of glycemic indices with SUA levels and the risk of hyperuricemia needs to be elucidated further. Considering the challenge posed by the increasing prevalence of hyperuricemia and diabetes, a comprehensive description of the association between glycemic indices and hyperuricemia may be important for the improvement of public health. Therefore, this cross-sectional study, which included a large sample of participants with a full spectrum of glycemic status, aimed to investigate the association between glycemic indices and hyperuricemia prevalence as well as SUA levels.
-
The present study was a cross-sectional analysis of the first follow-up survey for The China Cardiometabolic Disease and Cancer Cohort Study (4C study) during in 2014–2015. The design and methodology of the 4C study have been previously described in detail elsewhere[11, 12]. Among 105,922 adults who underwent SUA and glycemic tests, 7,945 who used hypoglycemic or hypouricemic drugs were excluded. As the use of diuretics might affect the metabolism of uric acid[13], 282 individuals undergoing diuretic treatment were excluded. Furthermore, 4,393 individuals with end-stage kidney disease were excluded. Finally, 93,302 individuals (30,941 men and 62,361 women) were included in the current analysis.
The study protocol was approved by the Institutional Review Board of Ruijin Hospital, Shanghai Jiao Tong University School of Medicine, and written informed consent was obtained from each participant before data collection.
-
Data collection was conducted at local community hospitals or community medical centers in the participants’ residential areas. Face-to-face interviews using a standard questionnaire were conducted to obtain data on demographic characteristics, personal and family medical history, and lifestyle factors. Blood pressure, height, body weight, and waist circumference were measured using standard methods. Body mass index (BMI) was calculated as weight in kilograms divided by height in meters squared. Blood specimens were drawn by venipuncture after at least 8 h of overnight fasting and 2 h after ingesting a 75 g oral glucose load for the oral glucose tolerance test (OGTT). The samples were obtained at 0 and 2 h during the test and analyzed at local laboratories using the glucose oxidase or hexokinase method within 2 h after sample collection. Finger capillary whole blood samples were collected using the Hemoglobin Capillary Collection System (Bio-Rad Laboratories), stored at 2 °C to 8 °C, and shipped to the central laboratory of Shanghai Institute of Endocrine and Metabolic Diseases for testing. Glycated hemoglobin A1c (HbA1c) was measured using high-performance liquid chromatography with the VARIANT II Hemoglobin Testing System (Bio-Rad Laboratories) within 4 weeks after sampling. The capillary HbA1c values and venous values from whole blood samples collected using ethylenediaminetetraacetic acid dipotassium tubes were highly consistent[14]. SUA, total cholesterol, low-density lipoprotein cholesterol (LDL-C), high-density lipoprotein cholesterol (HDL-C), triglycerides (TG), fasting plasma insulin (FINS), and serum creatinine (Scr) were measured at the central laboratory using an autoanalyzer (ARCHITECT ci16200 analyzer; Abbott Laboratories).
The estimated glomerular filtration rate (eGFR) was calculated using the Chronic Kidney Disease Epidemiology Collaboration study equation:
eGFR = 141 × min (SCr/k, 1)α × max (SCr/k, 1)−1.209 × 0.993Age (men) (1)
eGFR = 141 × min (SCr/k, 1)α × max (SCr/k, 1)−1.209 × 0.993Age × 1.018 (women)[15] (2)
-
Glycemic status was defined as follows: NGT, prediabetes, and diabetes, according to the recommendations of the 2020 American Diabetes Association guidelines. Specifically, diabetes was defined as an HbA1c ≥ 6.5%, FPG ≥ 7.0 mmol/L, or a 2h-PG ≥ 11.1 mmol/L on OGTT; or a previous definite diagnosis of diabetes; or current use of hypoglycemic drugs. Prediabetes was defined as an FPG of 5.6–6.9 mmol/L, or a 2h-PG of 7.8–11.0 mmol/L, or an HbA1c of 5.7%–6.4%. NGT was defined as an HbA1c < 5.7%, FPG < 5.6 mmol/L, and a 2h-PG < 7.8 mmol/L, without previous diagnosis of diabetes[16]. Additionally, hyperuricemia was defined as SUA levels > 7 mg/dL (417 mmol/L) in men and > 6 mg (357 mmol/L) in women[17]. Hypouricemia and hypoglycemia and diuretics’ use were defined as the use of these medications within the last 3 months. BMI was classified according to the Chinese criteria[18]. End-stage kidney disease was defined as an eGFR < 15 mL/min/1.73 m2[19].
-
The participants’ baseline characteristics were presented according to their glycemic status. The data are expressed as means (standard deviation) or medians (25th percentile and 75th percentile) and proportions. One-way analysis of variance or the Kruskal–Wallis rank-sum test was used for continuous variables and the chi-square test for categorical variables to compare the baseline characteristics of patients with different glycemic status.
We explored the nonlinear relationships between glycemic indices and SUA levels with generalized additive models (GAM) using the R package mgcv (R software program, version 3.0.0). Based on the cut-off values indicated in the splines, the participants were stratified into two groups. Within each group, multivariable linear regression analyses were conducted to quantify the relationships of glycemic indices and SUA levels after controlling for potential covariates. Model 2 was adjusted for age, while model 3 was further adjusted for major biochemical indicators and demographic factors (BMI, LDL-C, systolic blood pressure, eGFR, residence, education level, current drinking status, current smoking status, and physical activity level). Previous studies suggested that insulin might play an important role in the regulation of uric acid[20]. Therefore, the FINS was further included for adjustment.
All P-values were two tailed, and a P-value of 0.05 was considered significant. Data management and all statistical analyses were performed using SAS version 9.4 (SAS Institute, Cary, NC, USA), separately for men and women.
-
The sex-based characteristics according to the glycemic status are summarized in Table 1. Compared with NGT participants, prediabetic and diabetic participants were older, more obese, and more likely to have higher blood pressure and lower eGFR. All glycemic and lipid indices (FPG, 2h-PG, HbA1c, FINS, TG, and LDL-C) increased as glucose tolerance worsened (all P < 0.001). The SUA levels were significantly higher in men than in women in all groups. Moreover, NGT individuals had the lowest SUA levels, regardless of the sex. In comparison, prediabetic men and diabetic women had the highest SUA levels and prevalence of hyperuricemia.
Characteristics Men Women NGT Prediabetes Diabetes NGT Prediabetes Diabetes Number of cases (n/N) 11,243/30,941 12,374/30,941 7,324/30,941 27,025/62,361 23,387/62,361 11,949/62,361 Age (years) 59.5 ± 9.0 61.1 ± 8.9 62.3 ± 8.8 57.2 ± 8.1 59.7 ± 8.4 62.2 ± 8.2 < 50 16.8% 12.2% 9.0% 20.0% 12.9% 7.1% 50–60 35.2% 32.5% 30.5% 44.9% 39.6% 34.3% 60–70 35.1% 38.7% 40.6% 27.9% 35.3% 40.9% > 70 12.9% 16.6% 19.8% 7.3% 12.2% 17.6% BMI (kg/m2) 24.1 ± 3.2 24.8 ± 3.3 25.5 ± 3.4 23.8 ± 3.4 24.8 ± 3.6 25.6 ± 3.8 Underweight 3.7% 3.1% 3.1% 4.1% 2.9% 2.9% Normal weight 47.2% 37.8% 29.9% 52.1% 40.5% 32.0% Overweight 38.2% 43.9% 46.7% 34.1% 40.1% 42.1% Obese 10.9% 15.2% 20.3% 9.7% 16.5% 23.0% WC (cm) 85.2 ± 9.6 87.6 ± 9.3 90.0 ± 9.3 81.2 ± 9.2 84.6 ± 9.5 87.3 ± 9.8 SBP (mmHg) 130.6 ± 18.0 136.0 ± 18.1 138.4 ± 18.9 125.7 ± 18.1 132.5 ± 18.6 137.1 ± 19.5 DBP (mmHg) 79.1 ± 11.2 81.5 ± 11.2 81.4 ± 11.4 75.6 ± 0.6 78.3 ± 10.8 77.9 ± 11.0 Scr (mg/dL) 81.6 ± 14.5 82.3 ± 15.3 83.8 ± 17.3 66.5 ± 9.2 67.3 ± 9.9 68.9 ± 13.5 TG (mg/dL) 1.5 ± 1.1 1.8 ± 1.4 2.0 ± 1.8 1.5 ± 0.9 1.8 ± 1.2 2.1 ± 1.5 LDL-C (mg/dL) 2.9 ± 0.8 3.0 ± 0.8 3.0 ± 0.8 3.1 ± 0.8 3.2 ± 0.9 3.2 ± 0.9 FPG (mg/dL) 5.1 ± 0.3 5.8 ± 0.5 7.5 ± 2.4 5.1 ± 0.3 5.7 ± 0.5 7.4 ± 2.4 2h-PG (mg/dL) 5.8 ± 1.2 7.7 ± 1.8 13.1 ± 4.8 6.0 ± 1.0 8.0 ± 1.6 13.1 ± 4.6 HbA1c (%)* 5.4 (0.4) 5.5 (0.5) 6.3 (1.4) 5.4 (0.5) 5.6 (0.5) 6.4 (1.2) FINS (pmol/L)* 5.1 (3.8) 6.0 (4.3) 6.7 (5.4) 6.0 (3.7) 7.4 (4.7) 8.4 (6.1) SUA (μmol/L) 378.8 ± 88.8 392.1 ± 91.9 379.0 ± 95.5 295.8 ± 73.4 314.4 ± 79.1 327.1 ± 88.5 Hyperuricemia (%) 30.4% 36.5% 31.8% 18.2% 26.4% 33.1% Current smoker (%) 59.3% 56.3% 55.2% 1.8% 1.8% 2.1% Current drinker (%) 38.4% 44.3% 42.2% 3.2% 3.5% 2.7% Physically active (%) 10.7% 11.4% 6.5% 6.9% 8.1% 4.9% Urban residence 56.0% 49.1% 56.8% 62.4% 54.7% 60.4% eGFR (mL/min/1.73 m2) 90.6 ± 12.7 89.0 ± 13.2 87.2 ± 14.2 90.6 ± 11.5 88.1 ± 12.1 85.0 ± 13.8 Note. Values are expressed as mean ± SD or n (%), unless otherwise indicated.
* Values are expressed as median (range).
Abbreviations: NGT, normal glucose tolerance; FPG, fasting plasma glucose; 2h-PG, 2-hour postload glucose; HbA1c, glycated hemoglobin; FINS, fasting insulin; BMI, body mass index; WC, waist circumference; SBP, systolic blood pressure; DBP, diastolic blood pressure; Scr, serum creatinine; TG, triglyceride; LDL-C, low-density lipoprotein cholesterol; SUA, serum uric acid; eGFR, estimated glomerular filtration rate.Table 1. Baseline characteristics according to glycemic status by sex
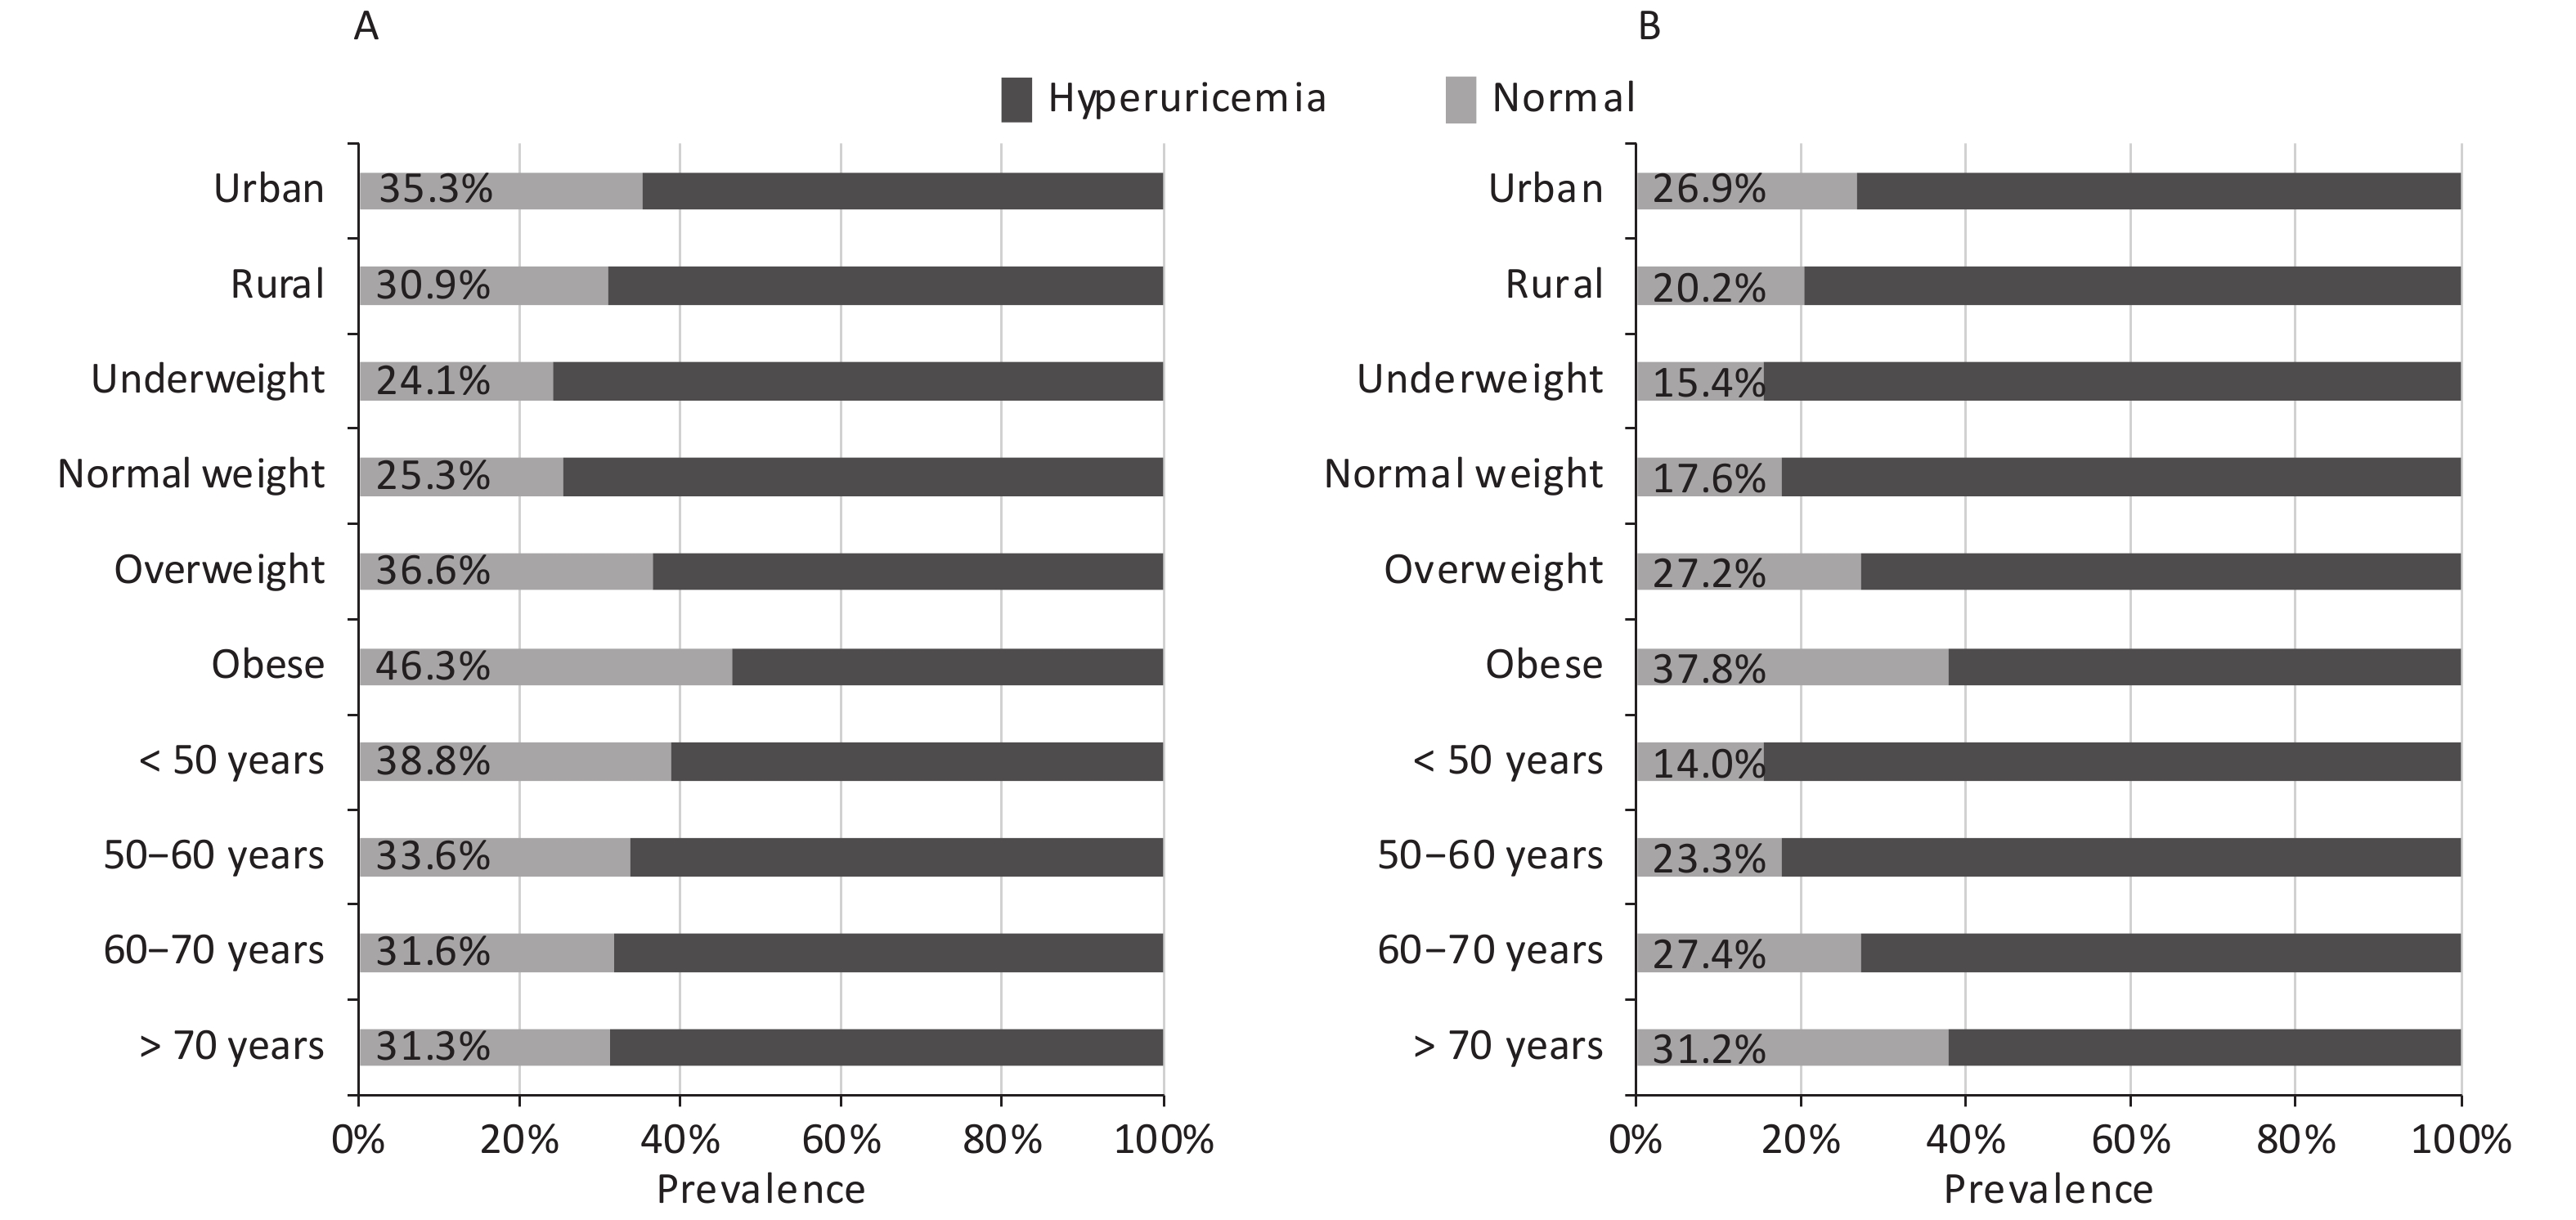
In the current study, the total prevalence of hyperuricemia were 31.2% for men and 24.1% for women; the prevalence according to demographic factors is presented in Figure 1. The prevalence increased with increase in BMI in both sexes; moreover, it was higher in individuals living in urban areas than in those living in rural areas. Nevertheless, a positive association was observed between age and prevalence of hyperuricemia in women, but a negative association was observed in men.
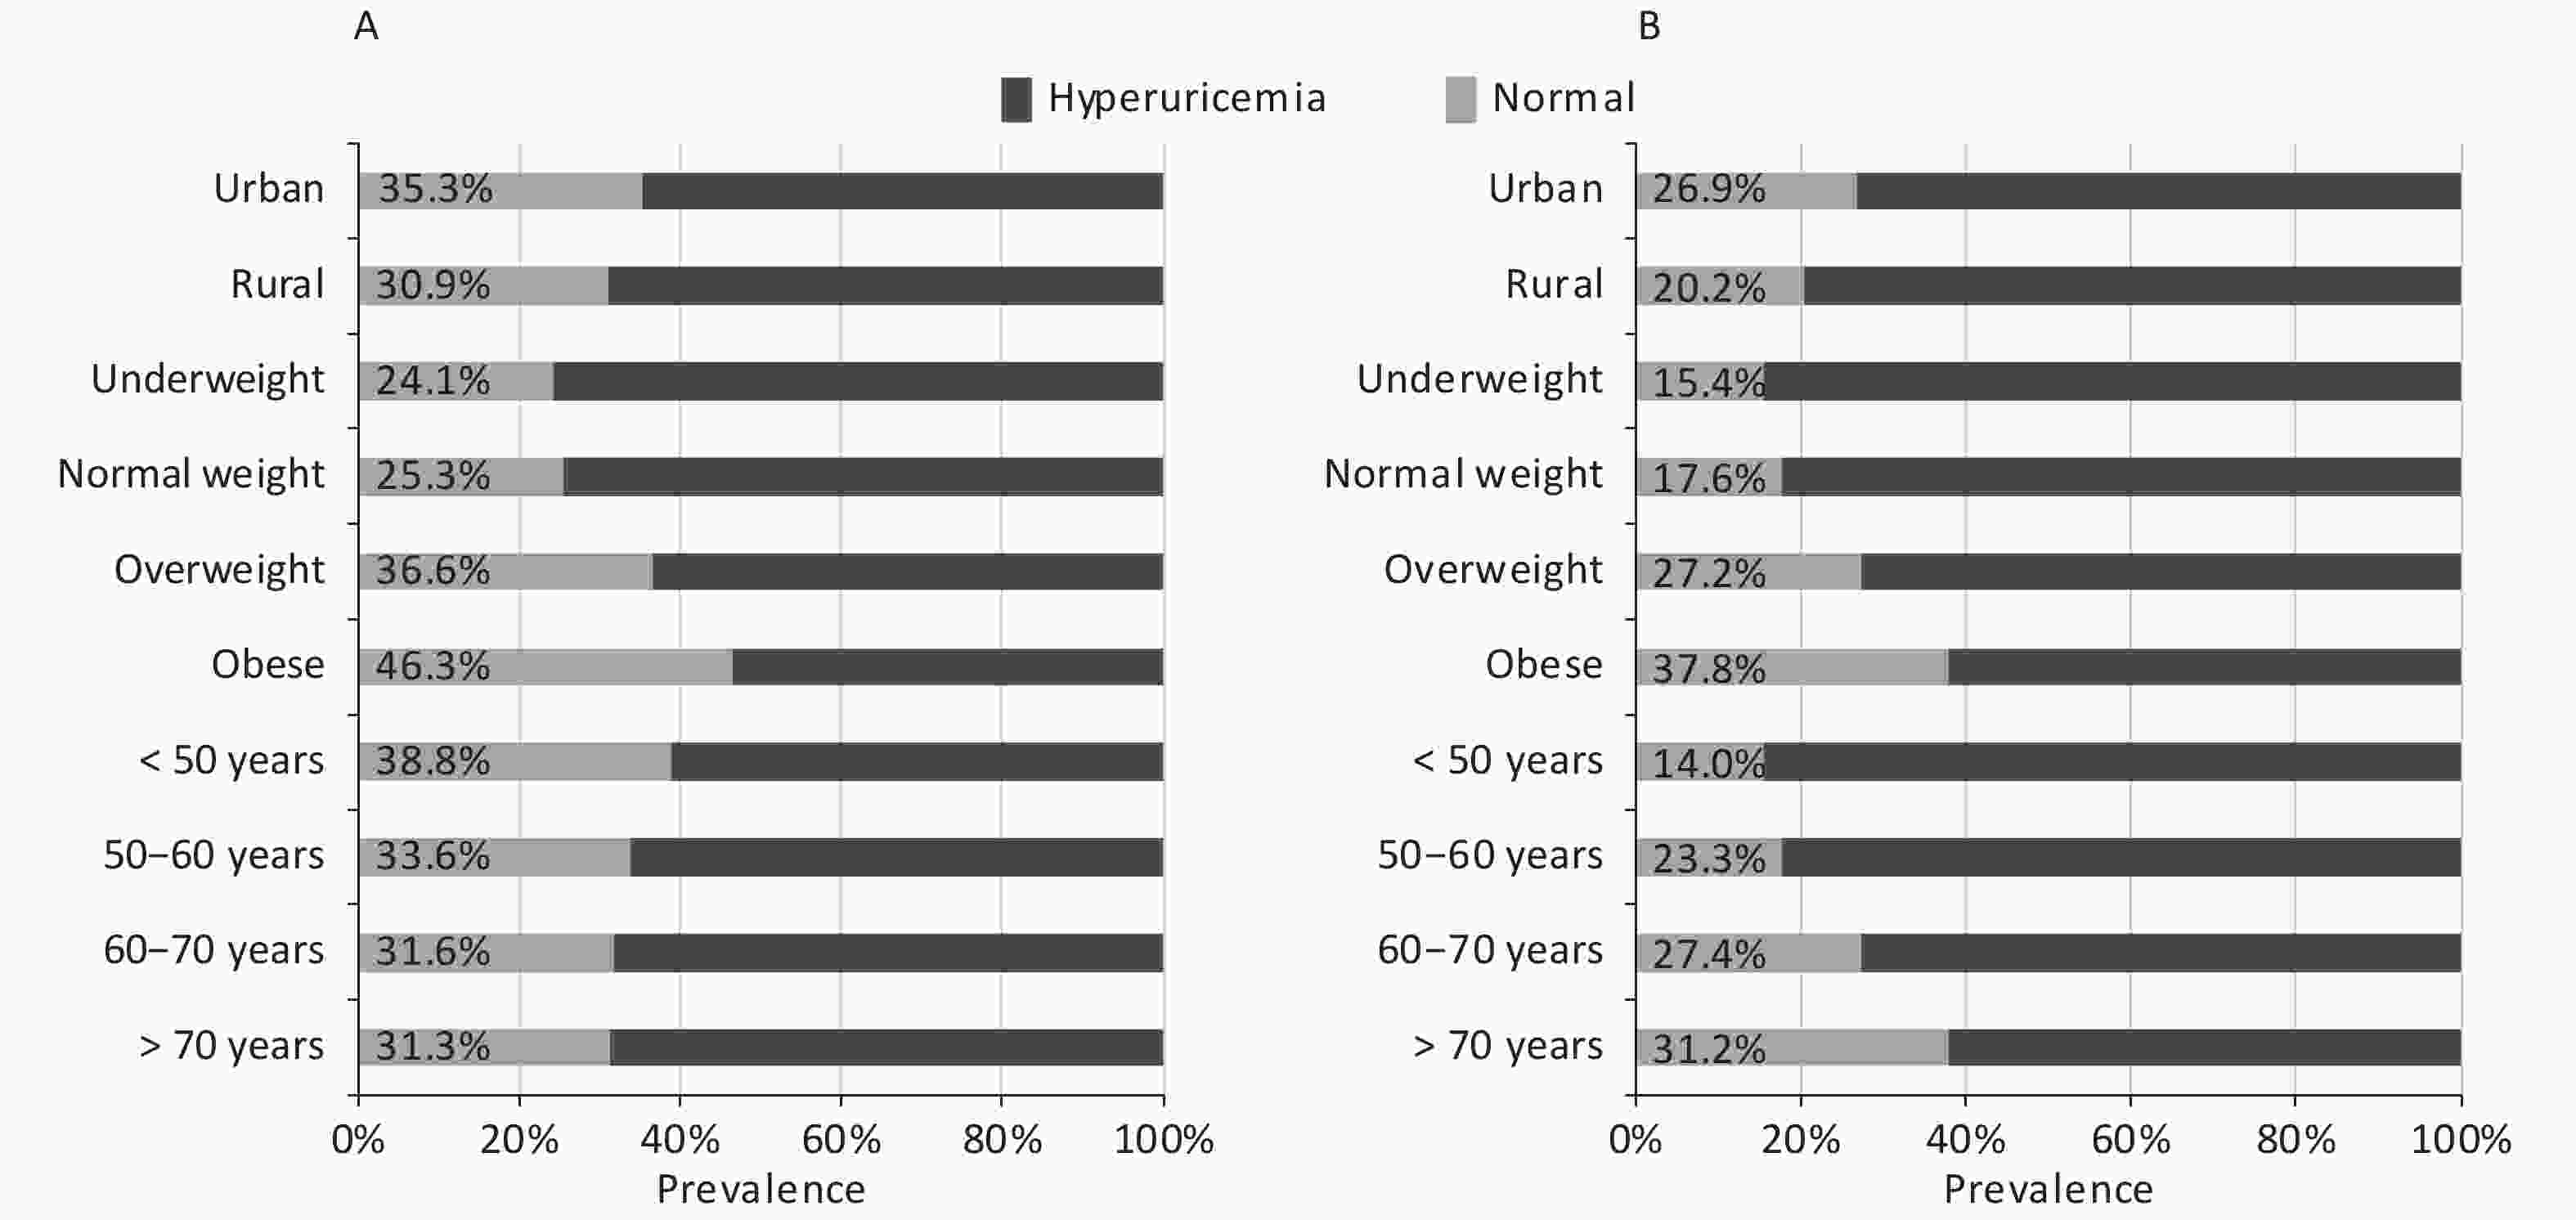
Figure 1. Prevalence of hyperuricemia according to demographic factors by sex
As mentioned earlier, the prevalence of hyperuricemia differed between men and women according to their glucose tolerance status. Therefore, the prevalence of hyperuricemia was calculated further according to glucose values (Figure 2). The prevalence initially increased with the increase in glucose levels and decreased after reaching the peak. Men with FPG levels of 6–7 mmol/L and 2h-PG of 10–12 mmol/L and women with FPG levels of 8–9 mmol/L and 2h-PG of 14–16 mmol/L had the highest prevalence of hyperuricemia. The prevalence of hyperuricemia was also the highest in men and women with an HbA1c of 6%–7%.
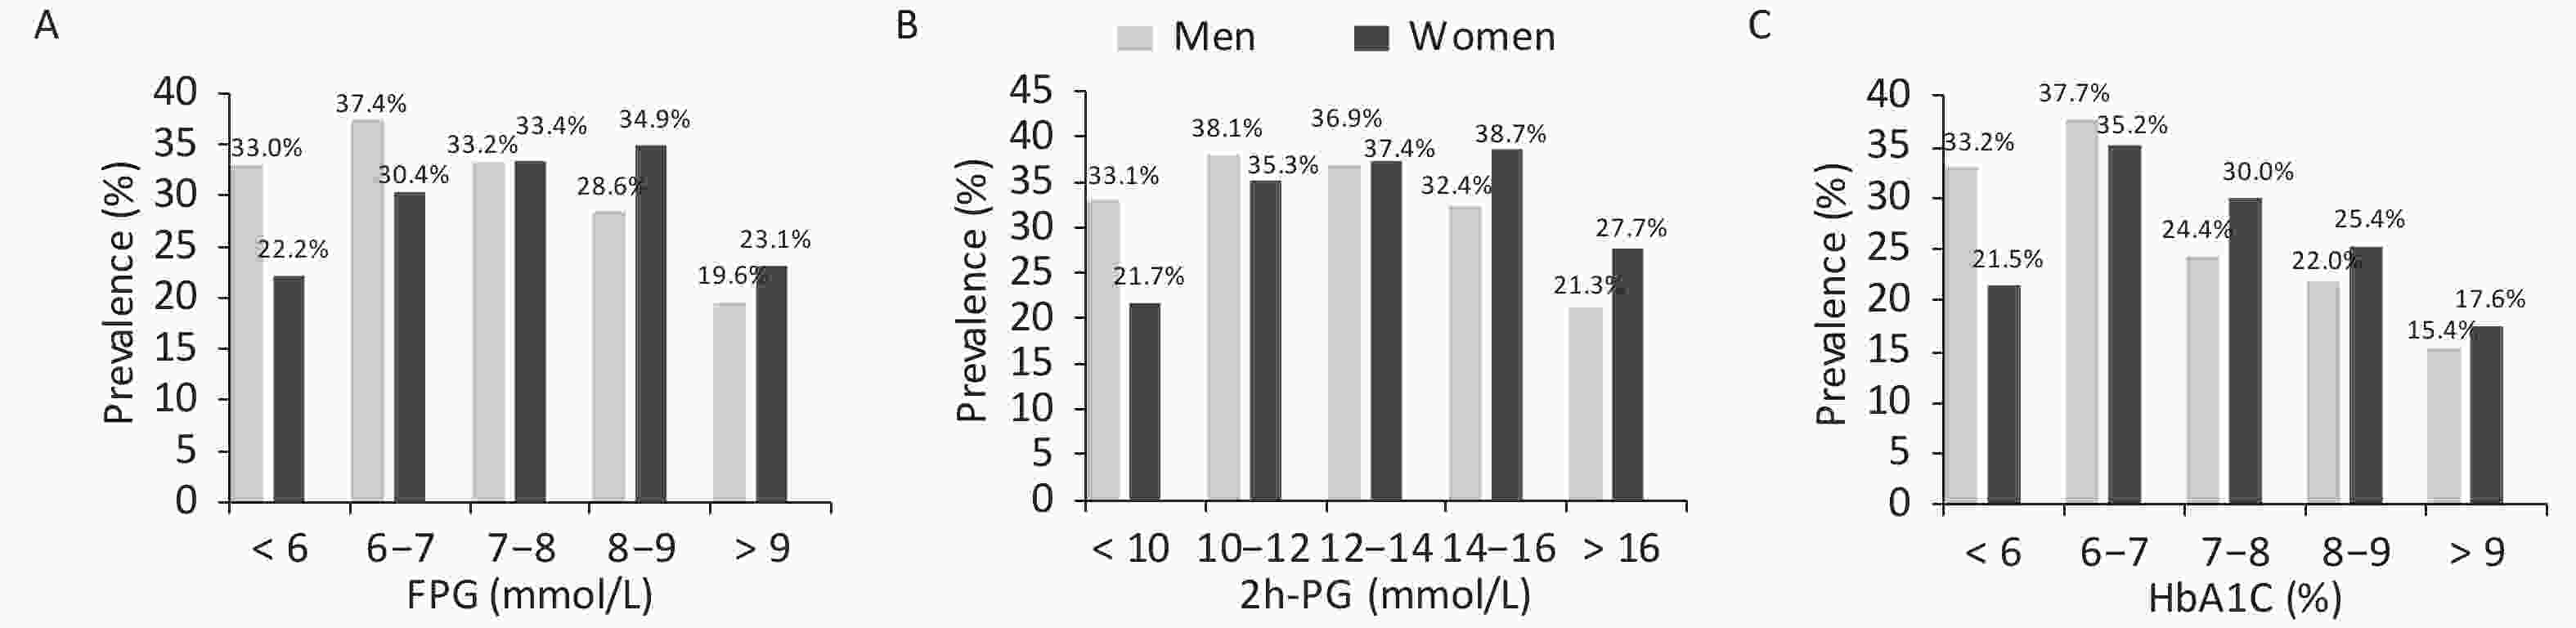
Figure 2. Prevalence of hyperuricemia in men and women according to glycemic indices by sex
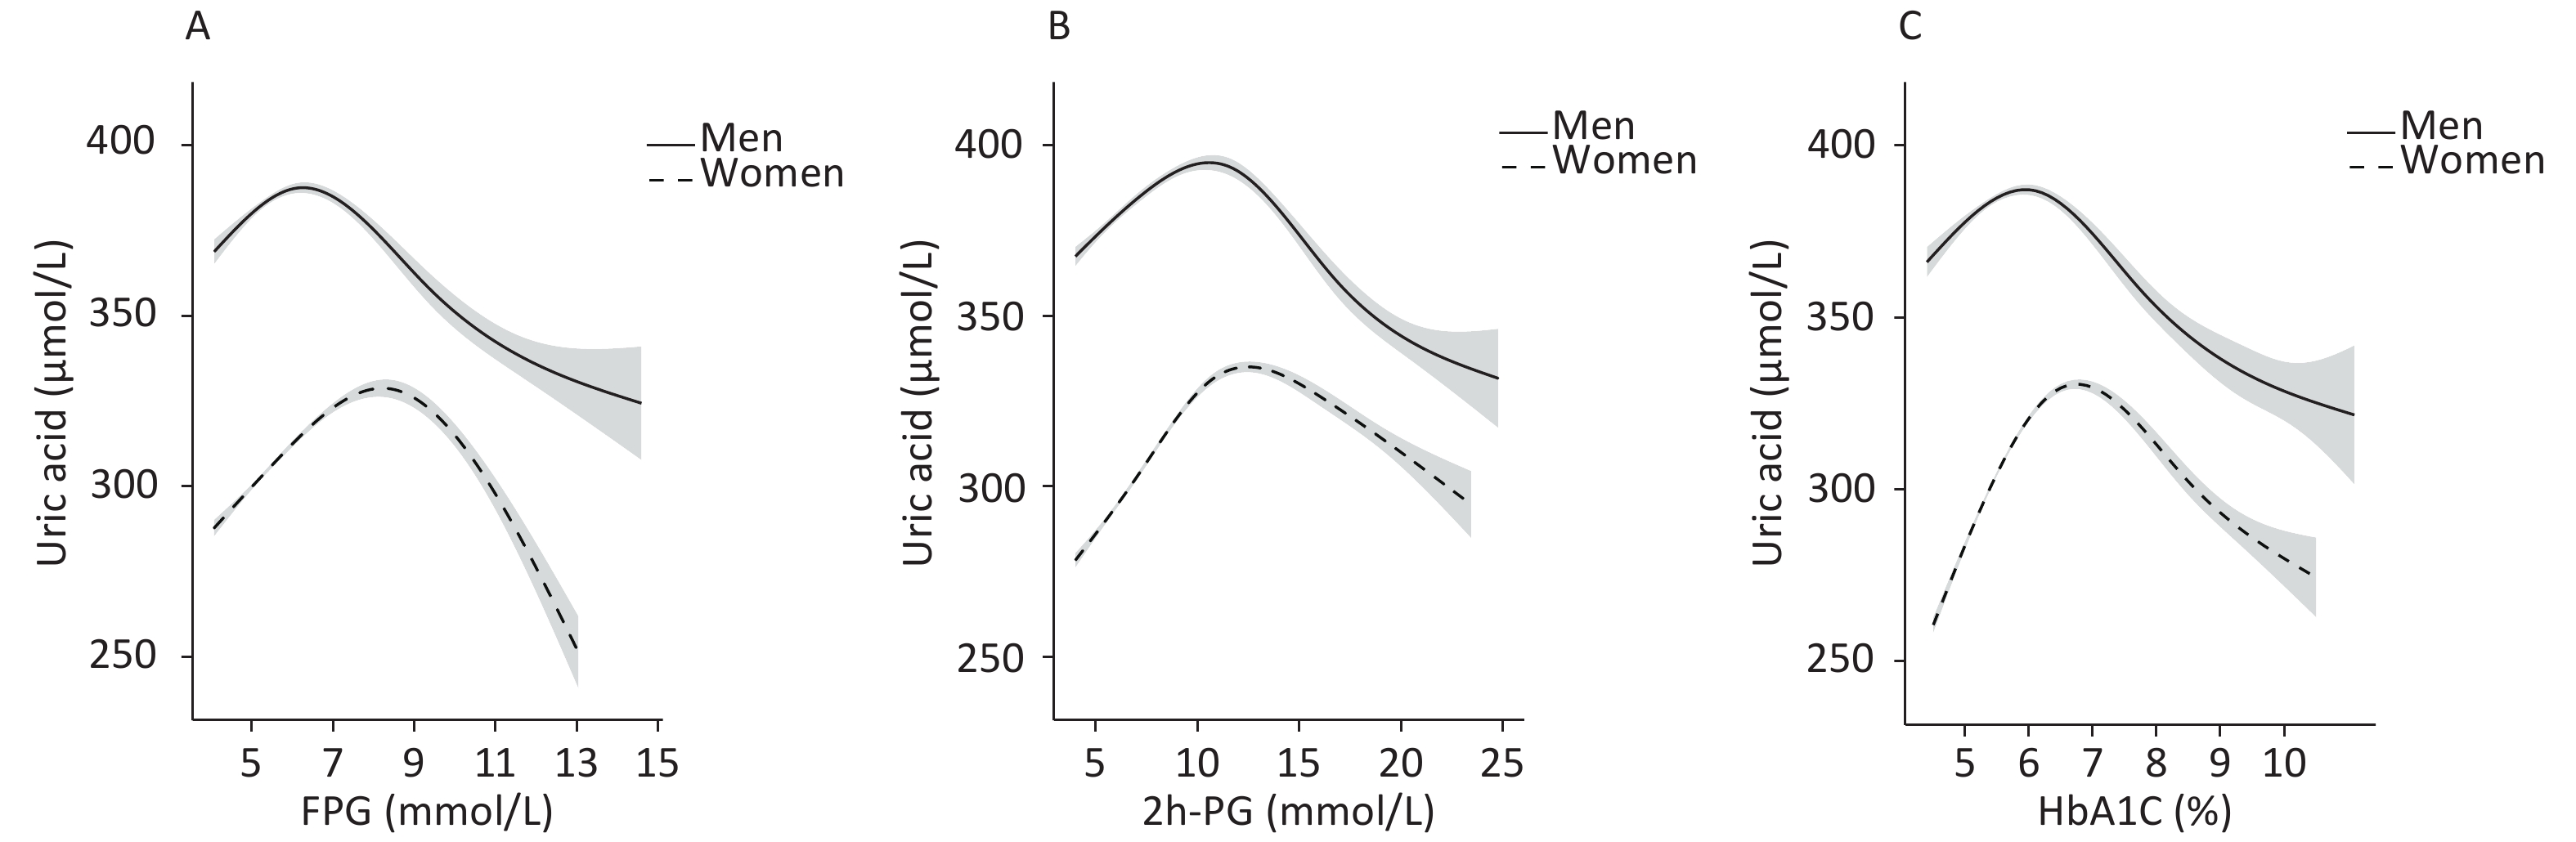
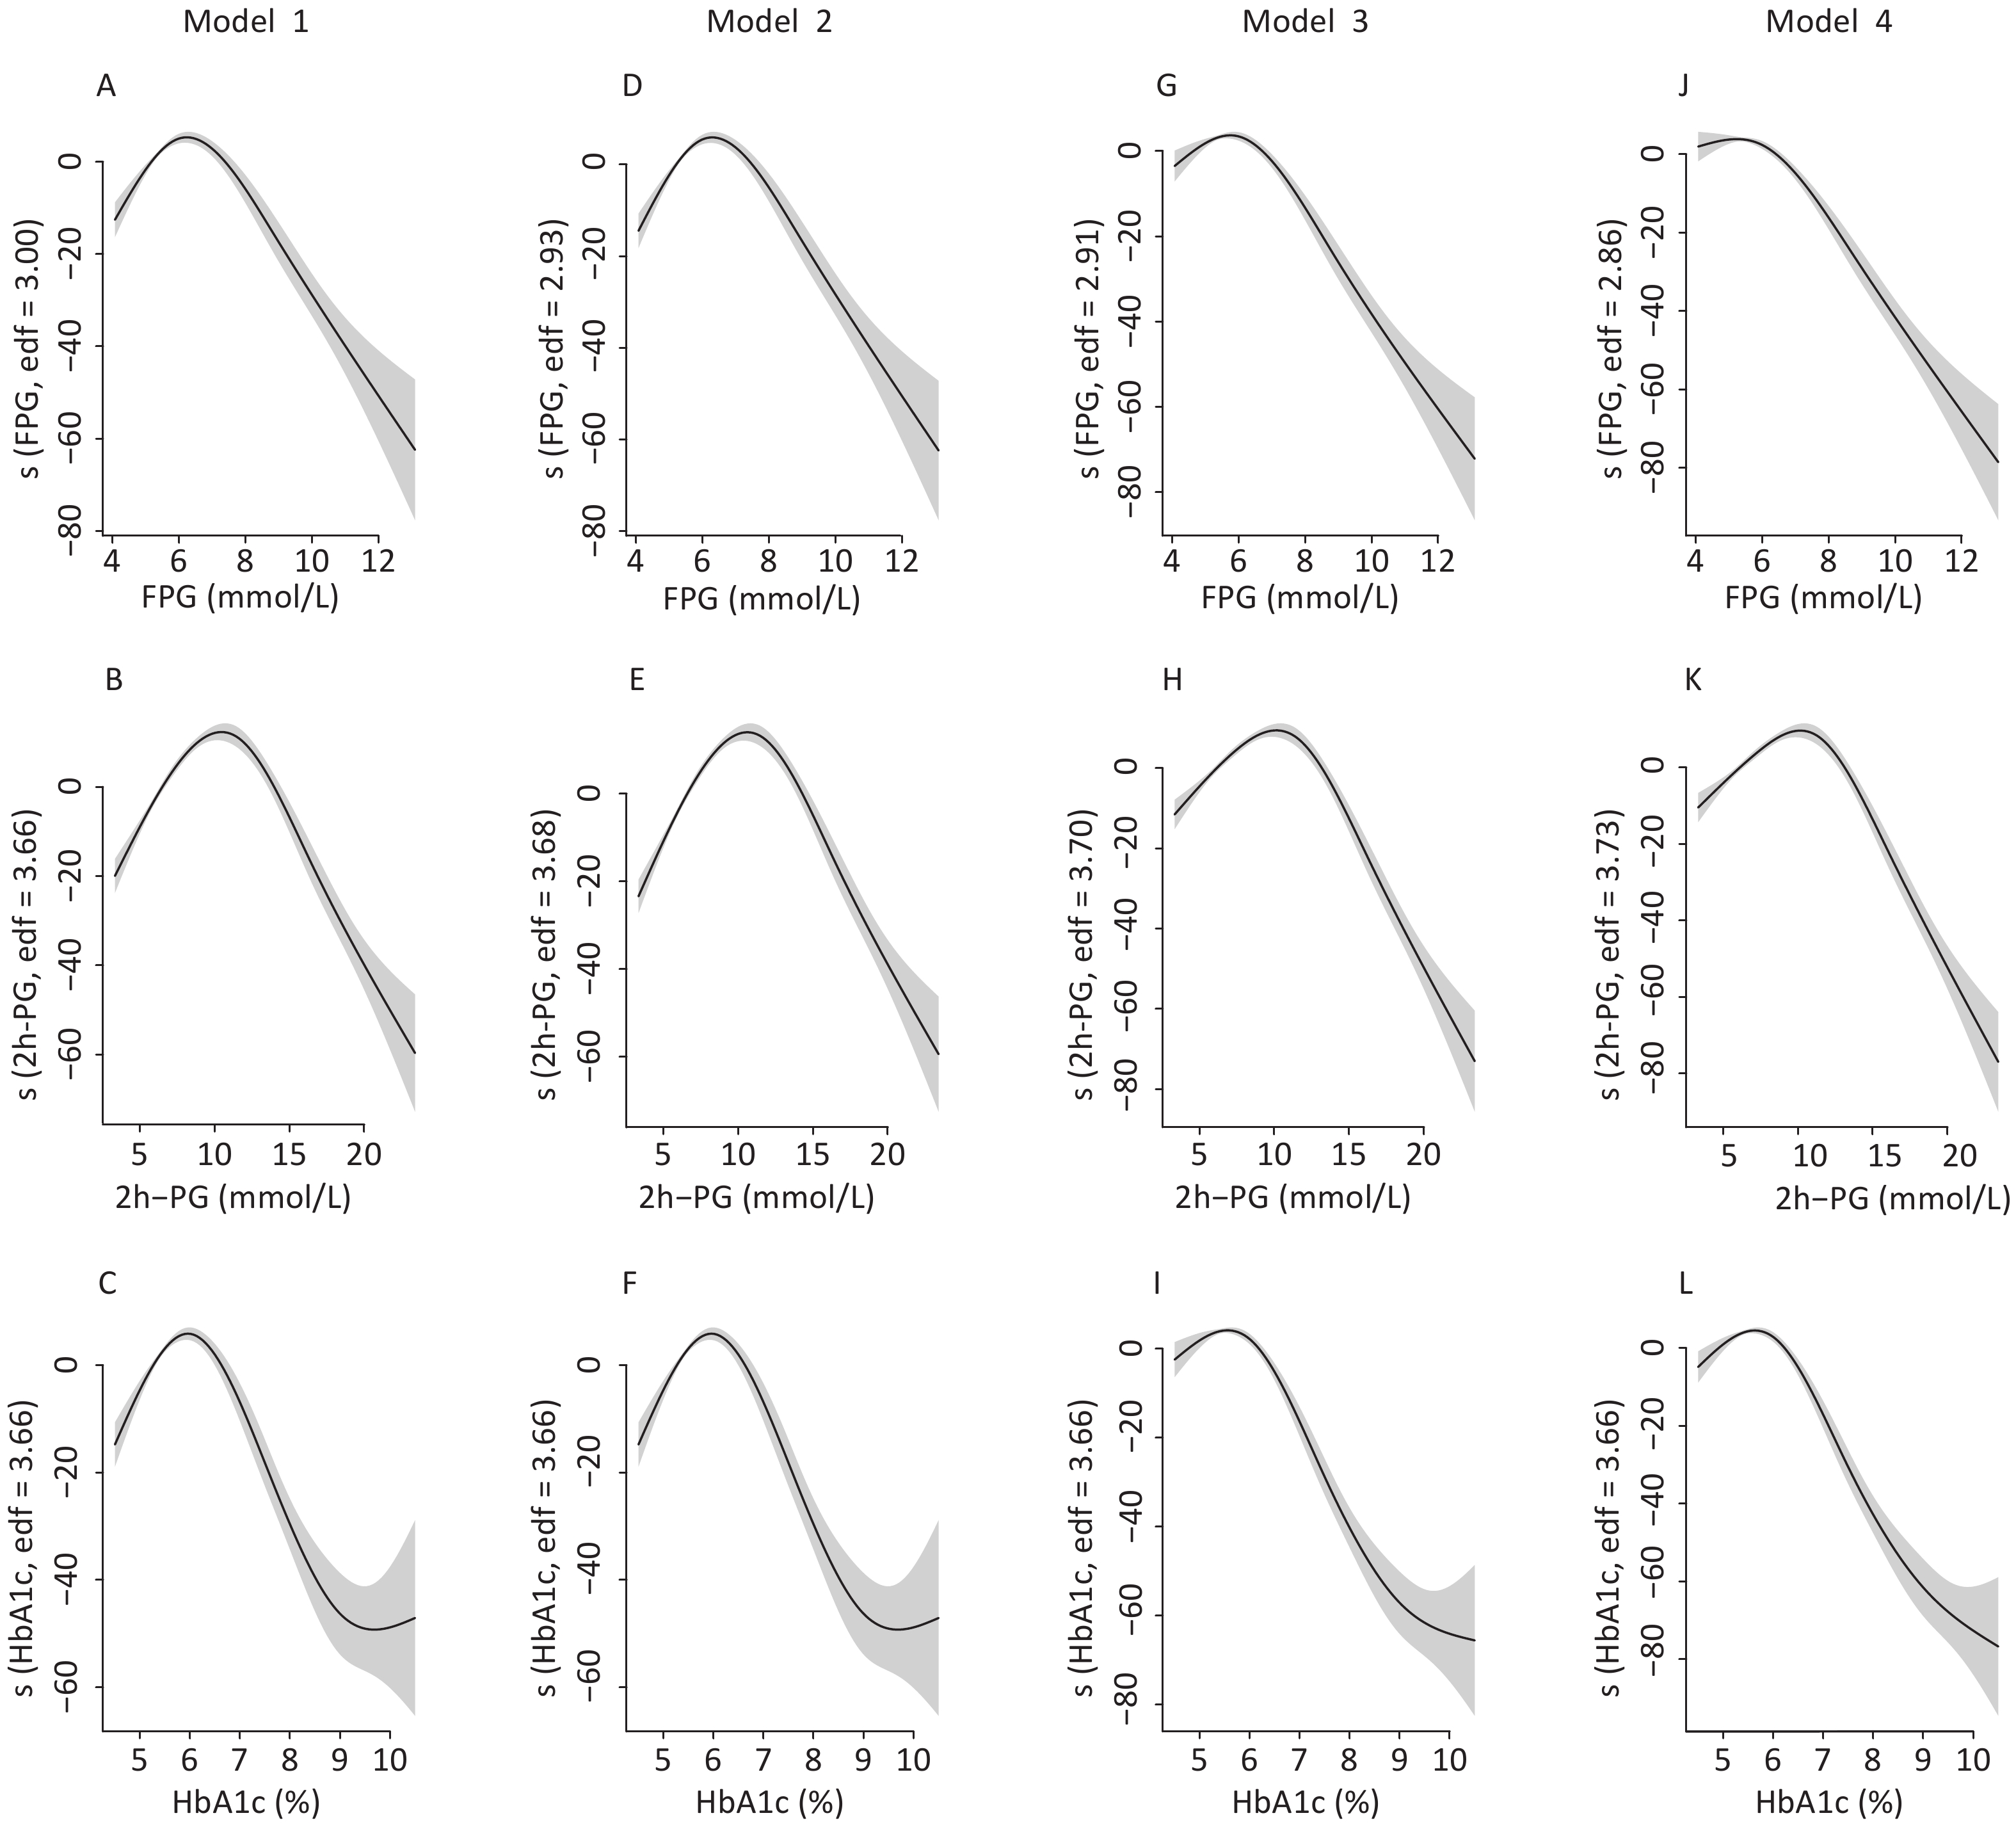
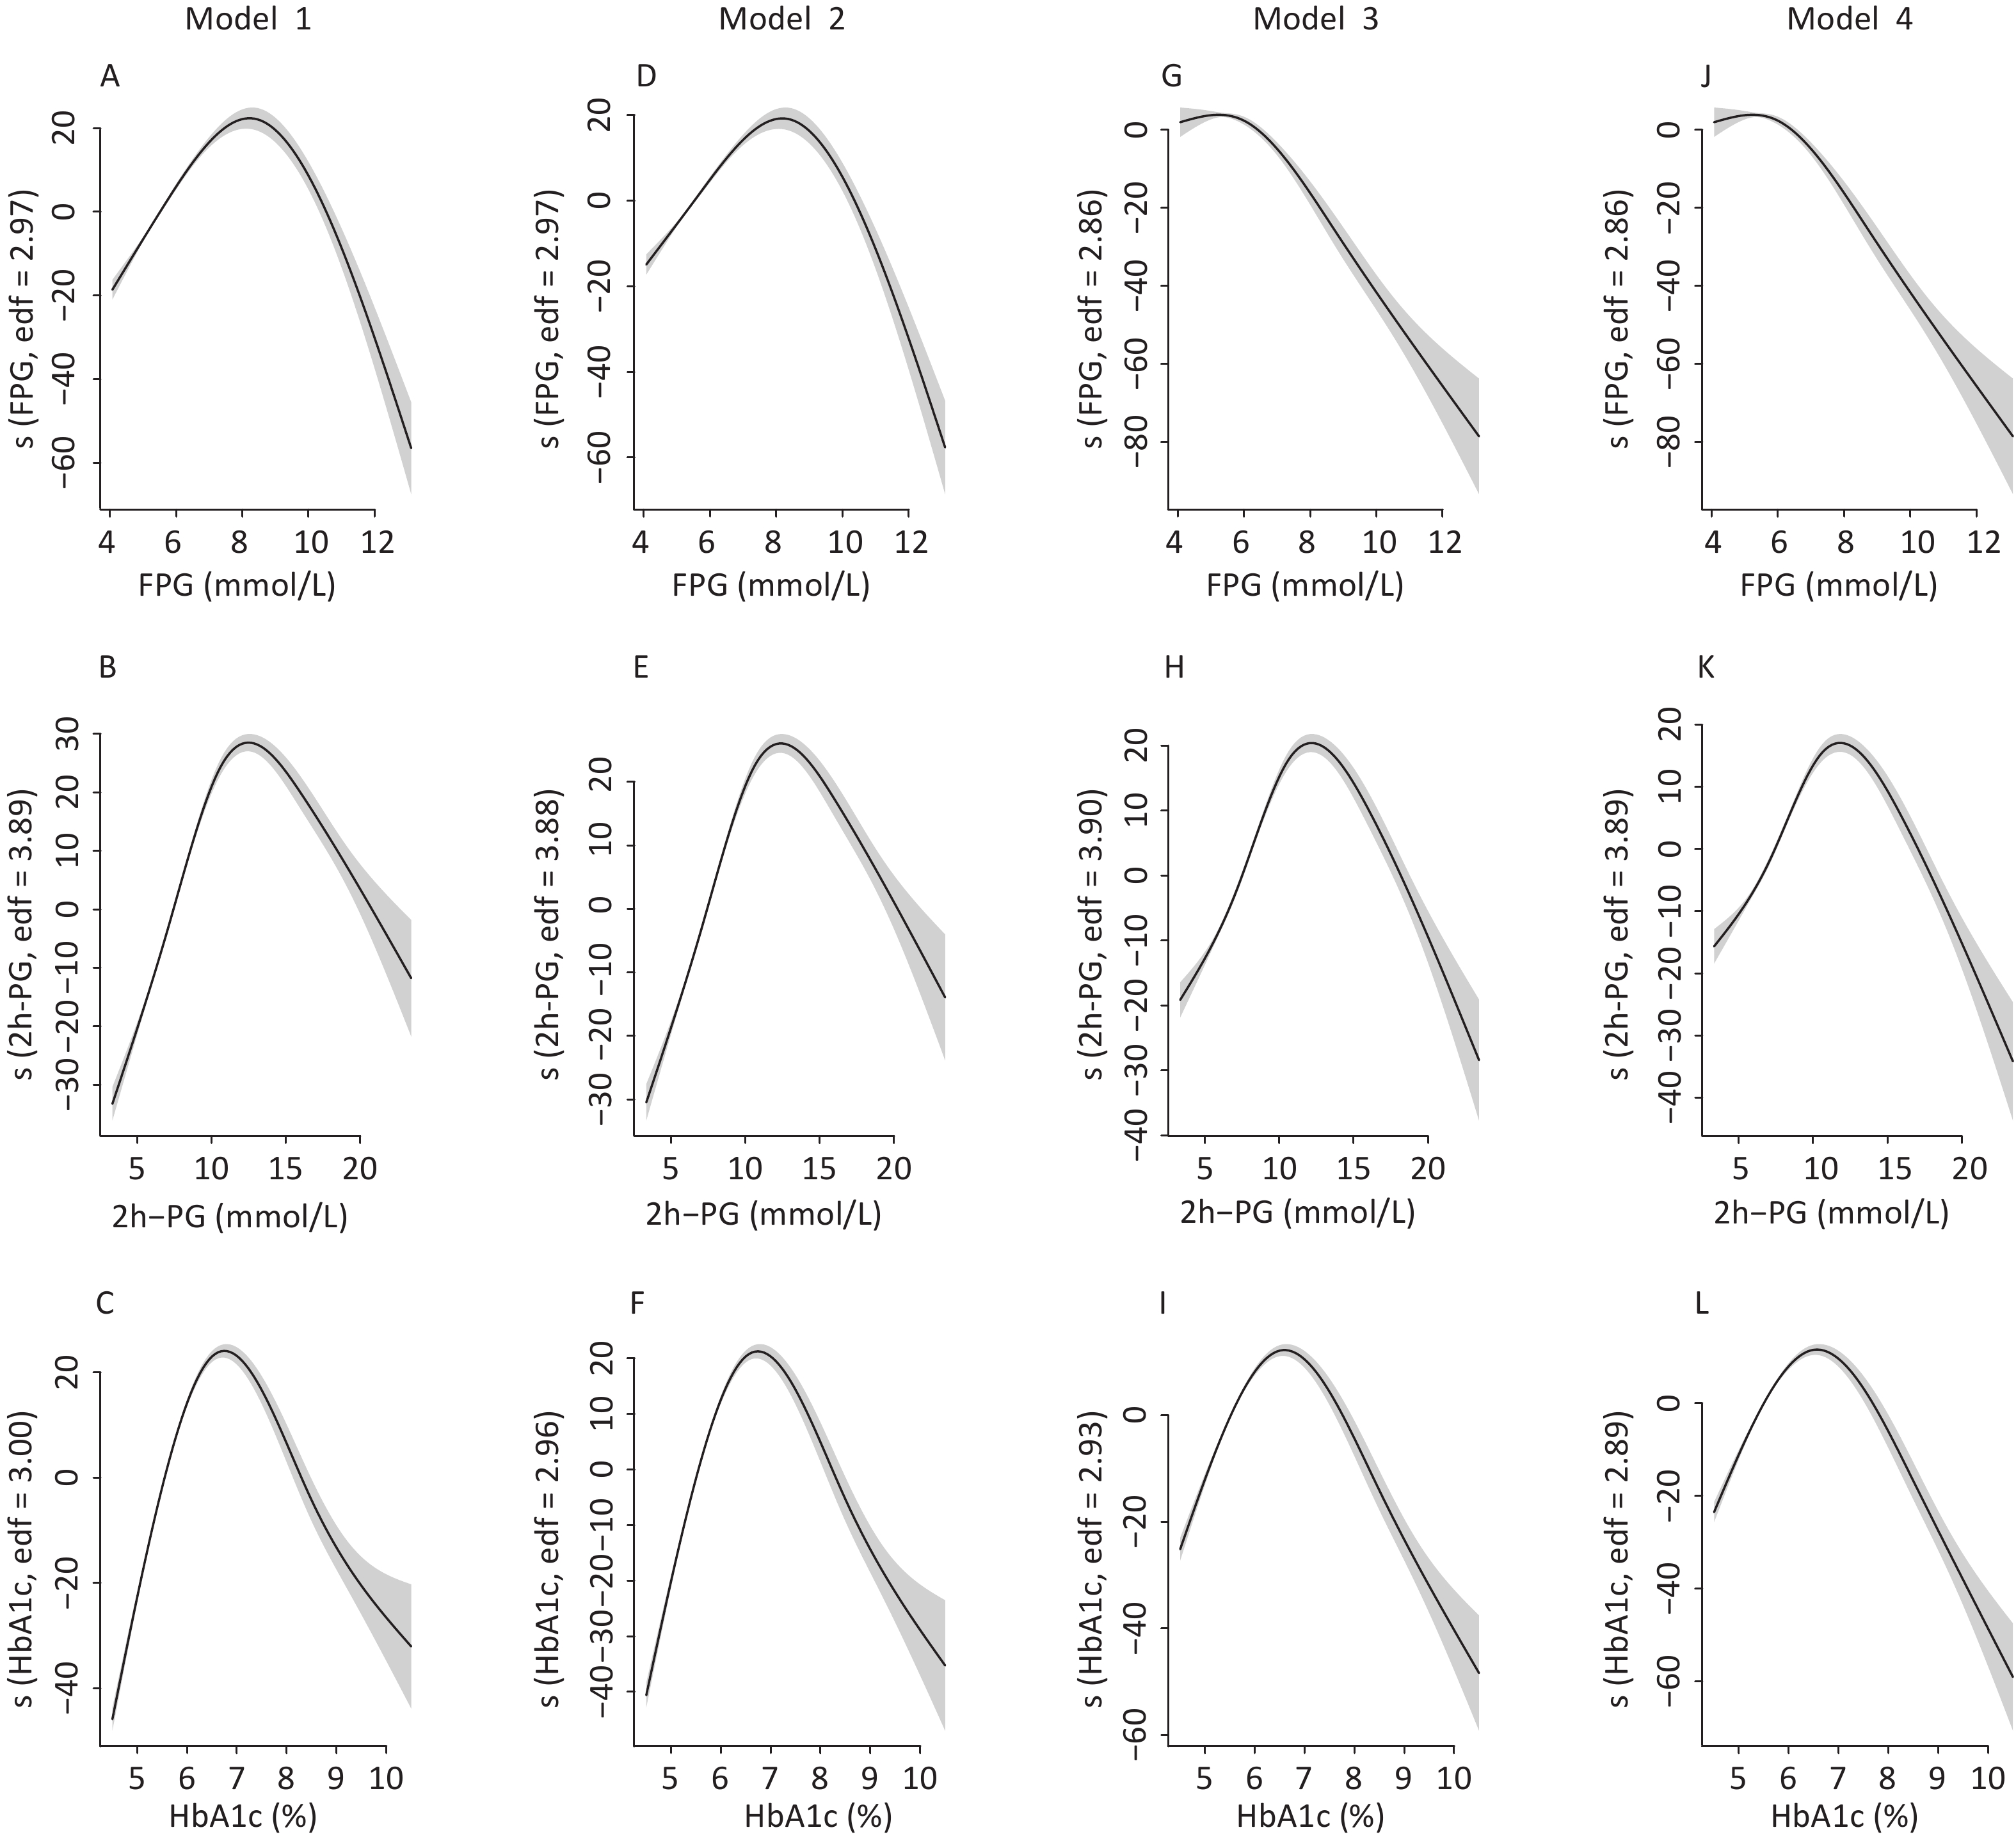
To identify the potential nonlinearity, the associations between glycemic indices and SUA levels were explored separately for men and women with unadjusted GAM (Figure 3A – 3C). Similar to the shapes in Figure 1, the SUA levels showed an inverted U-shaped relationship with major glycemic indices. SUA increased with an increase in FPG, 2h-PG, and HbA1c before the inflection points and then decreased with a further increase in these glycemic indices. The inflection points differed between sexes, with a threshold of 6.5 mmol/L for FPG, 11.0 mmol/L for 2h-PG, and 6.1% for HbA1c in men and 8.0 mmol/L for FPG, 14.0 mmol/L for 2h-PG, and 6.5% for HbA1c in women. The trends of associations between glycemic indices (FPG, 2h-PG, and HbA1c) and uric acid levels in all four models are visualized using GAM in Supplementary Figures S1–S2 (available in www.besjournal.com).
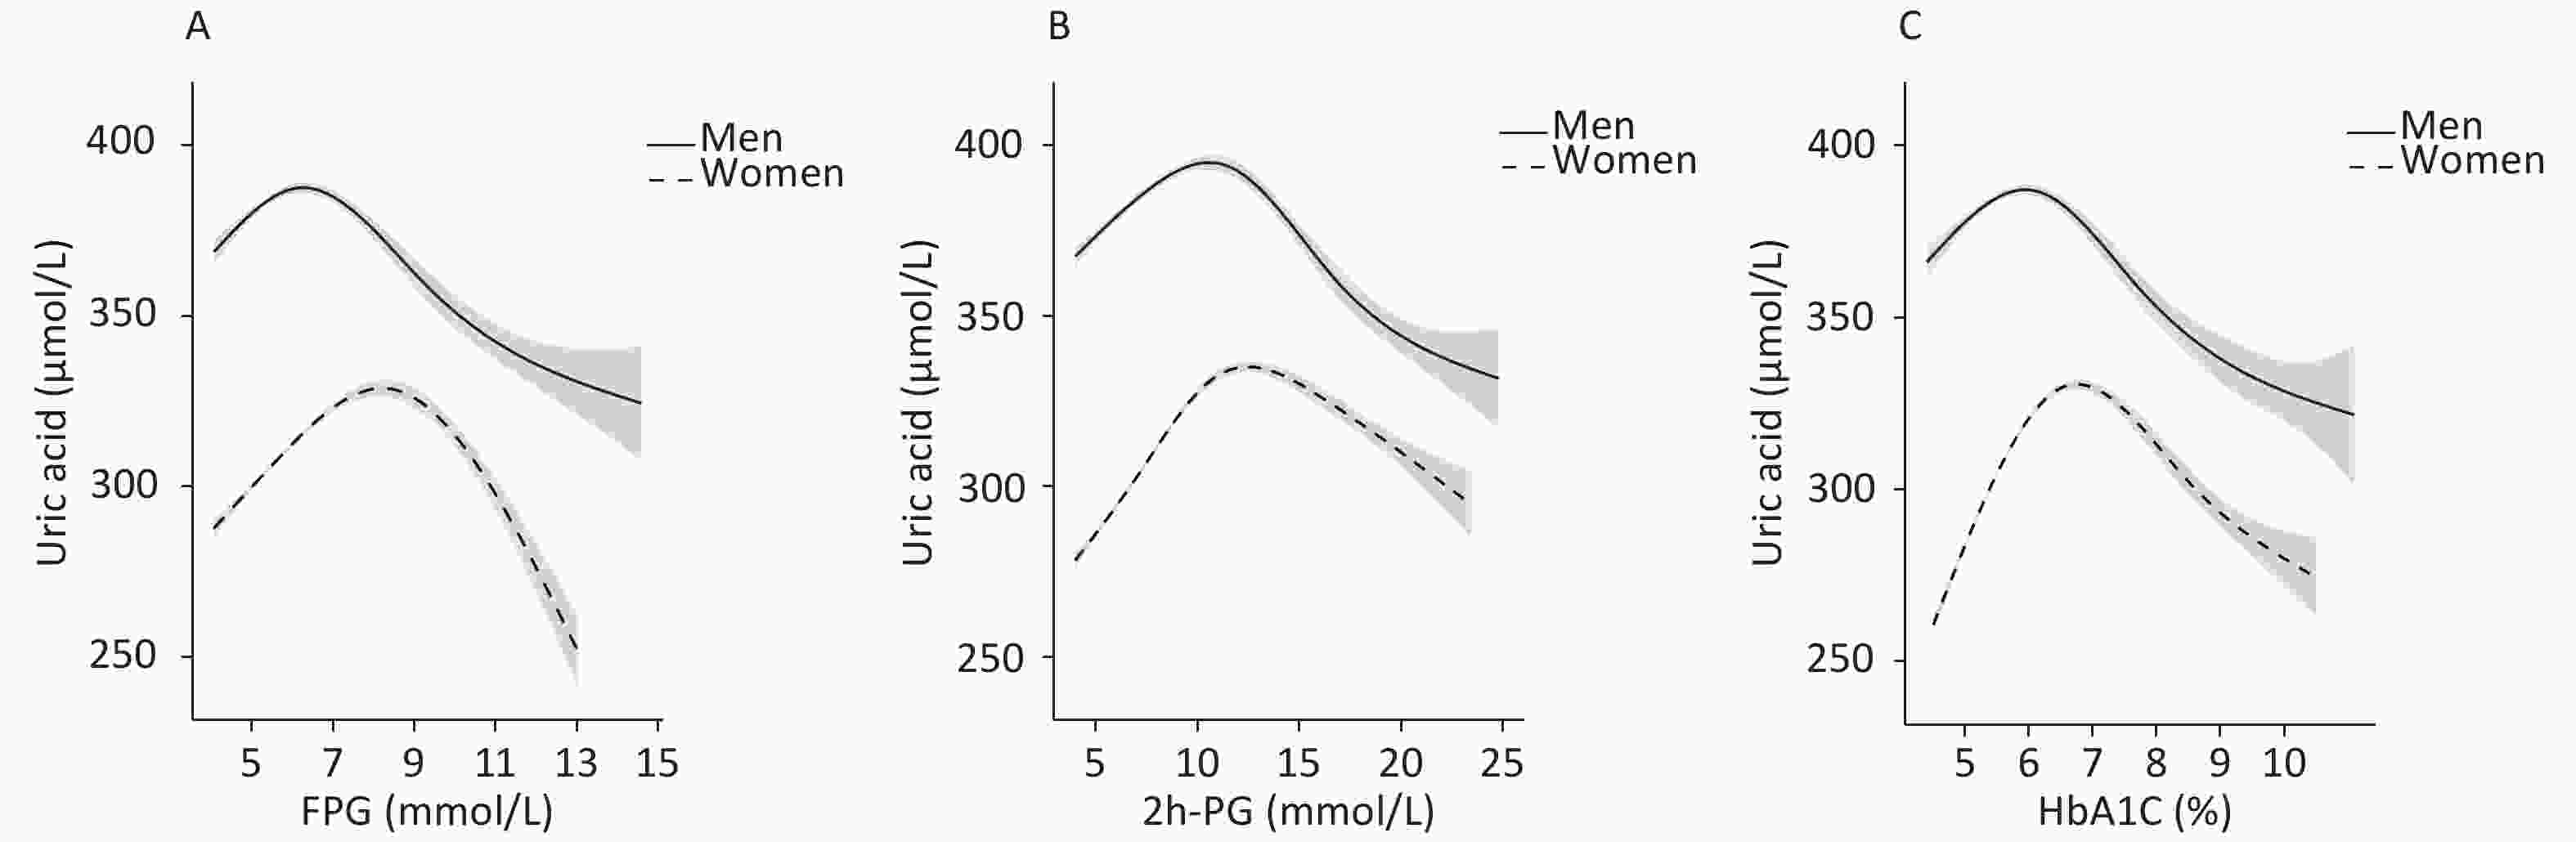
Figure 3. Association of glycemic indices and SUA levels
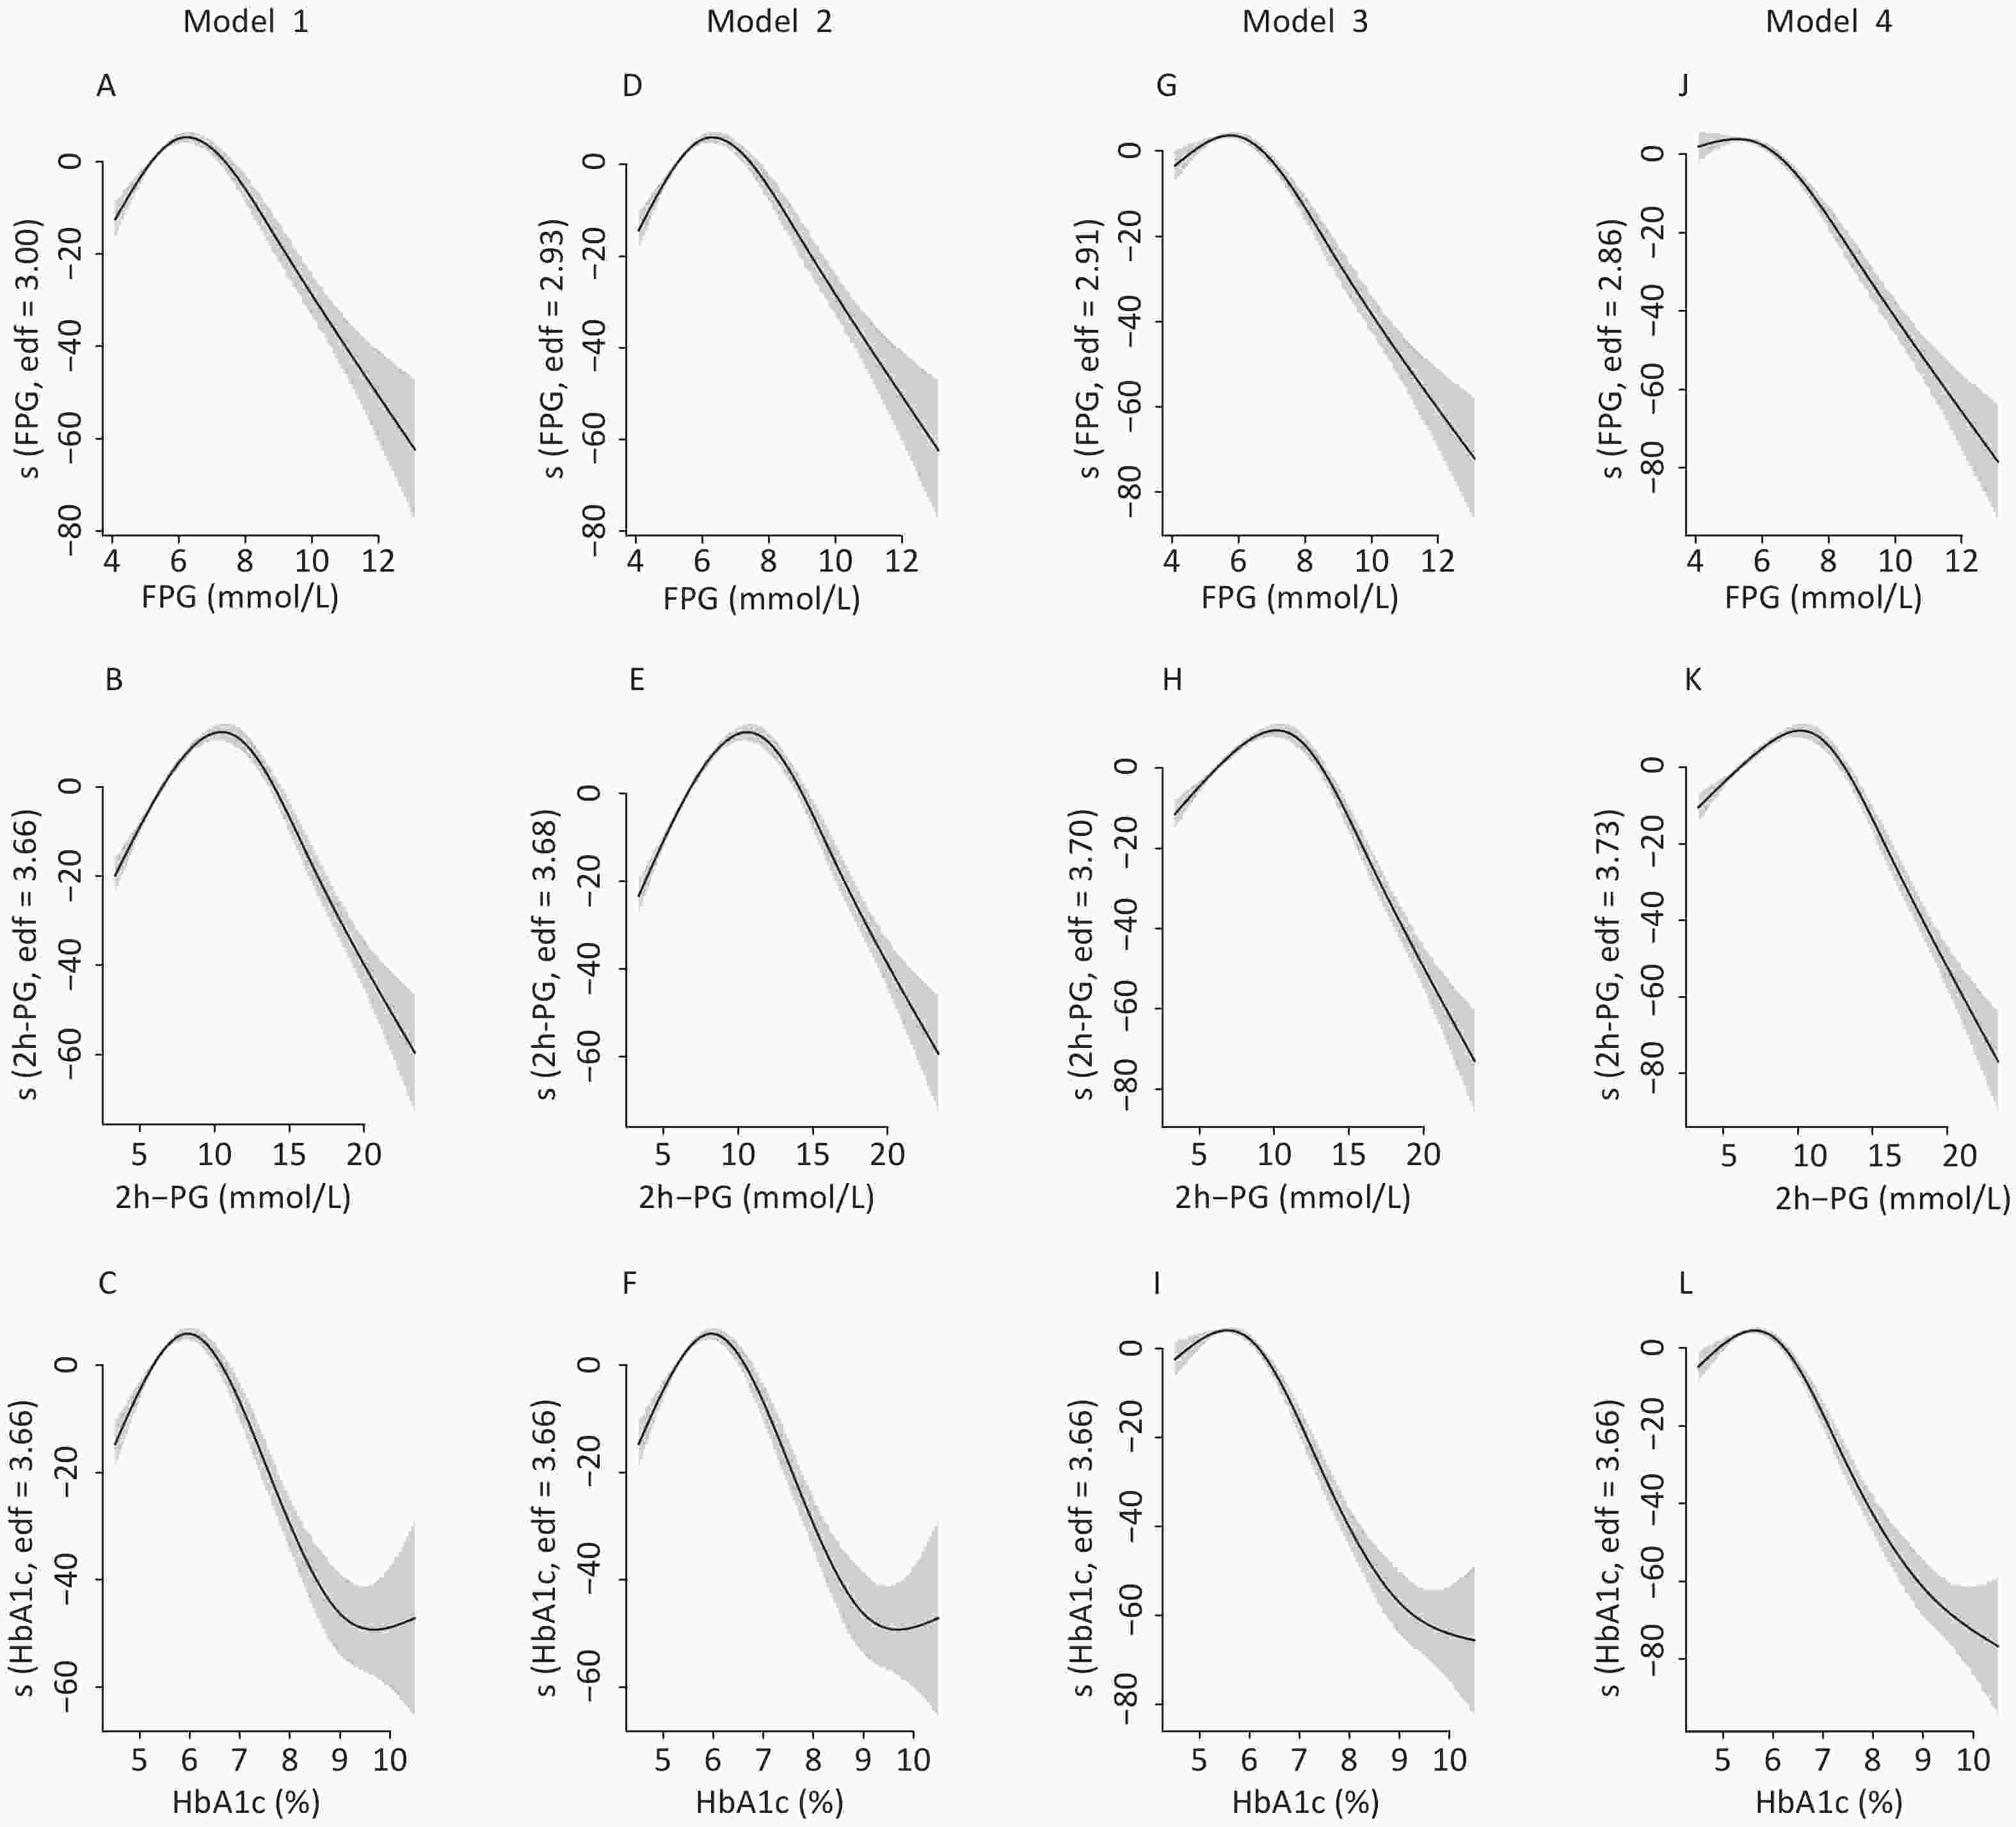
Figure S1. The nonlinear association between glycemic indices and uric acid in men by unadjusted and adjusted GAM model. The y-axis represents the spline function. Shade scope indicate 95% confidence bounds
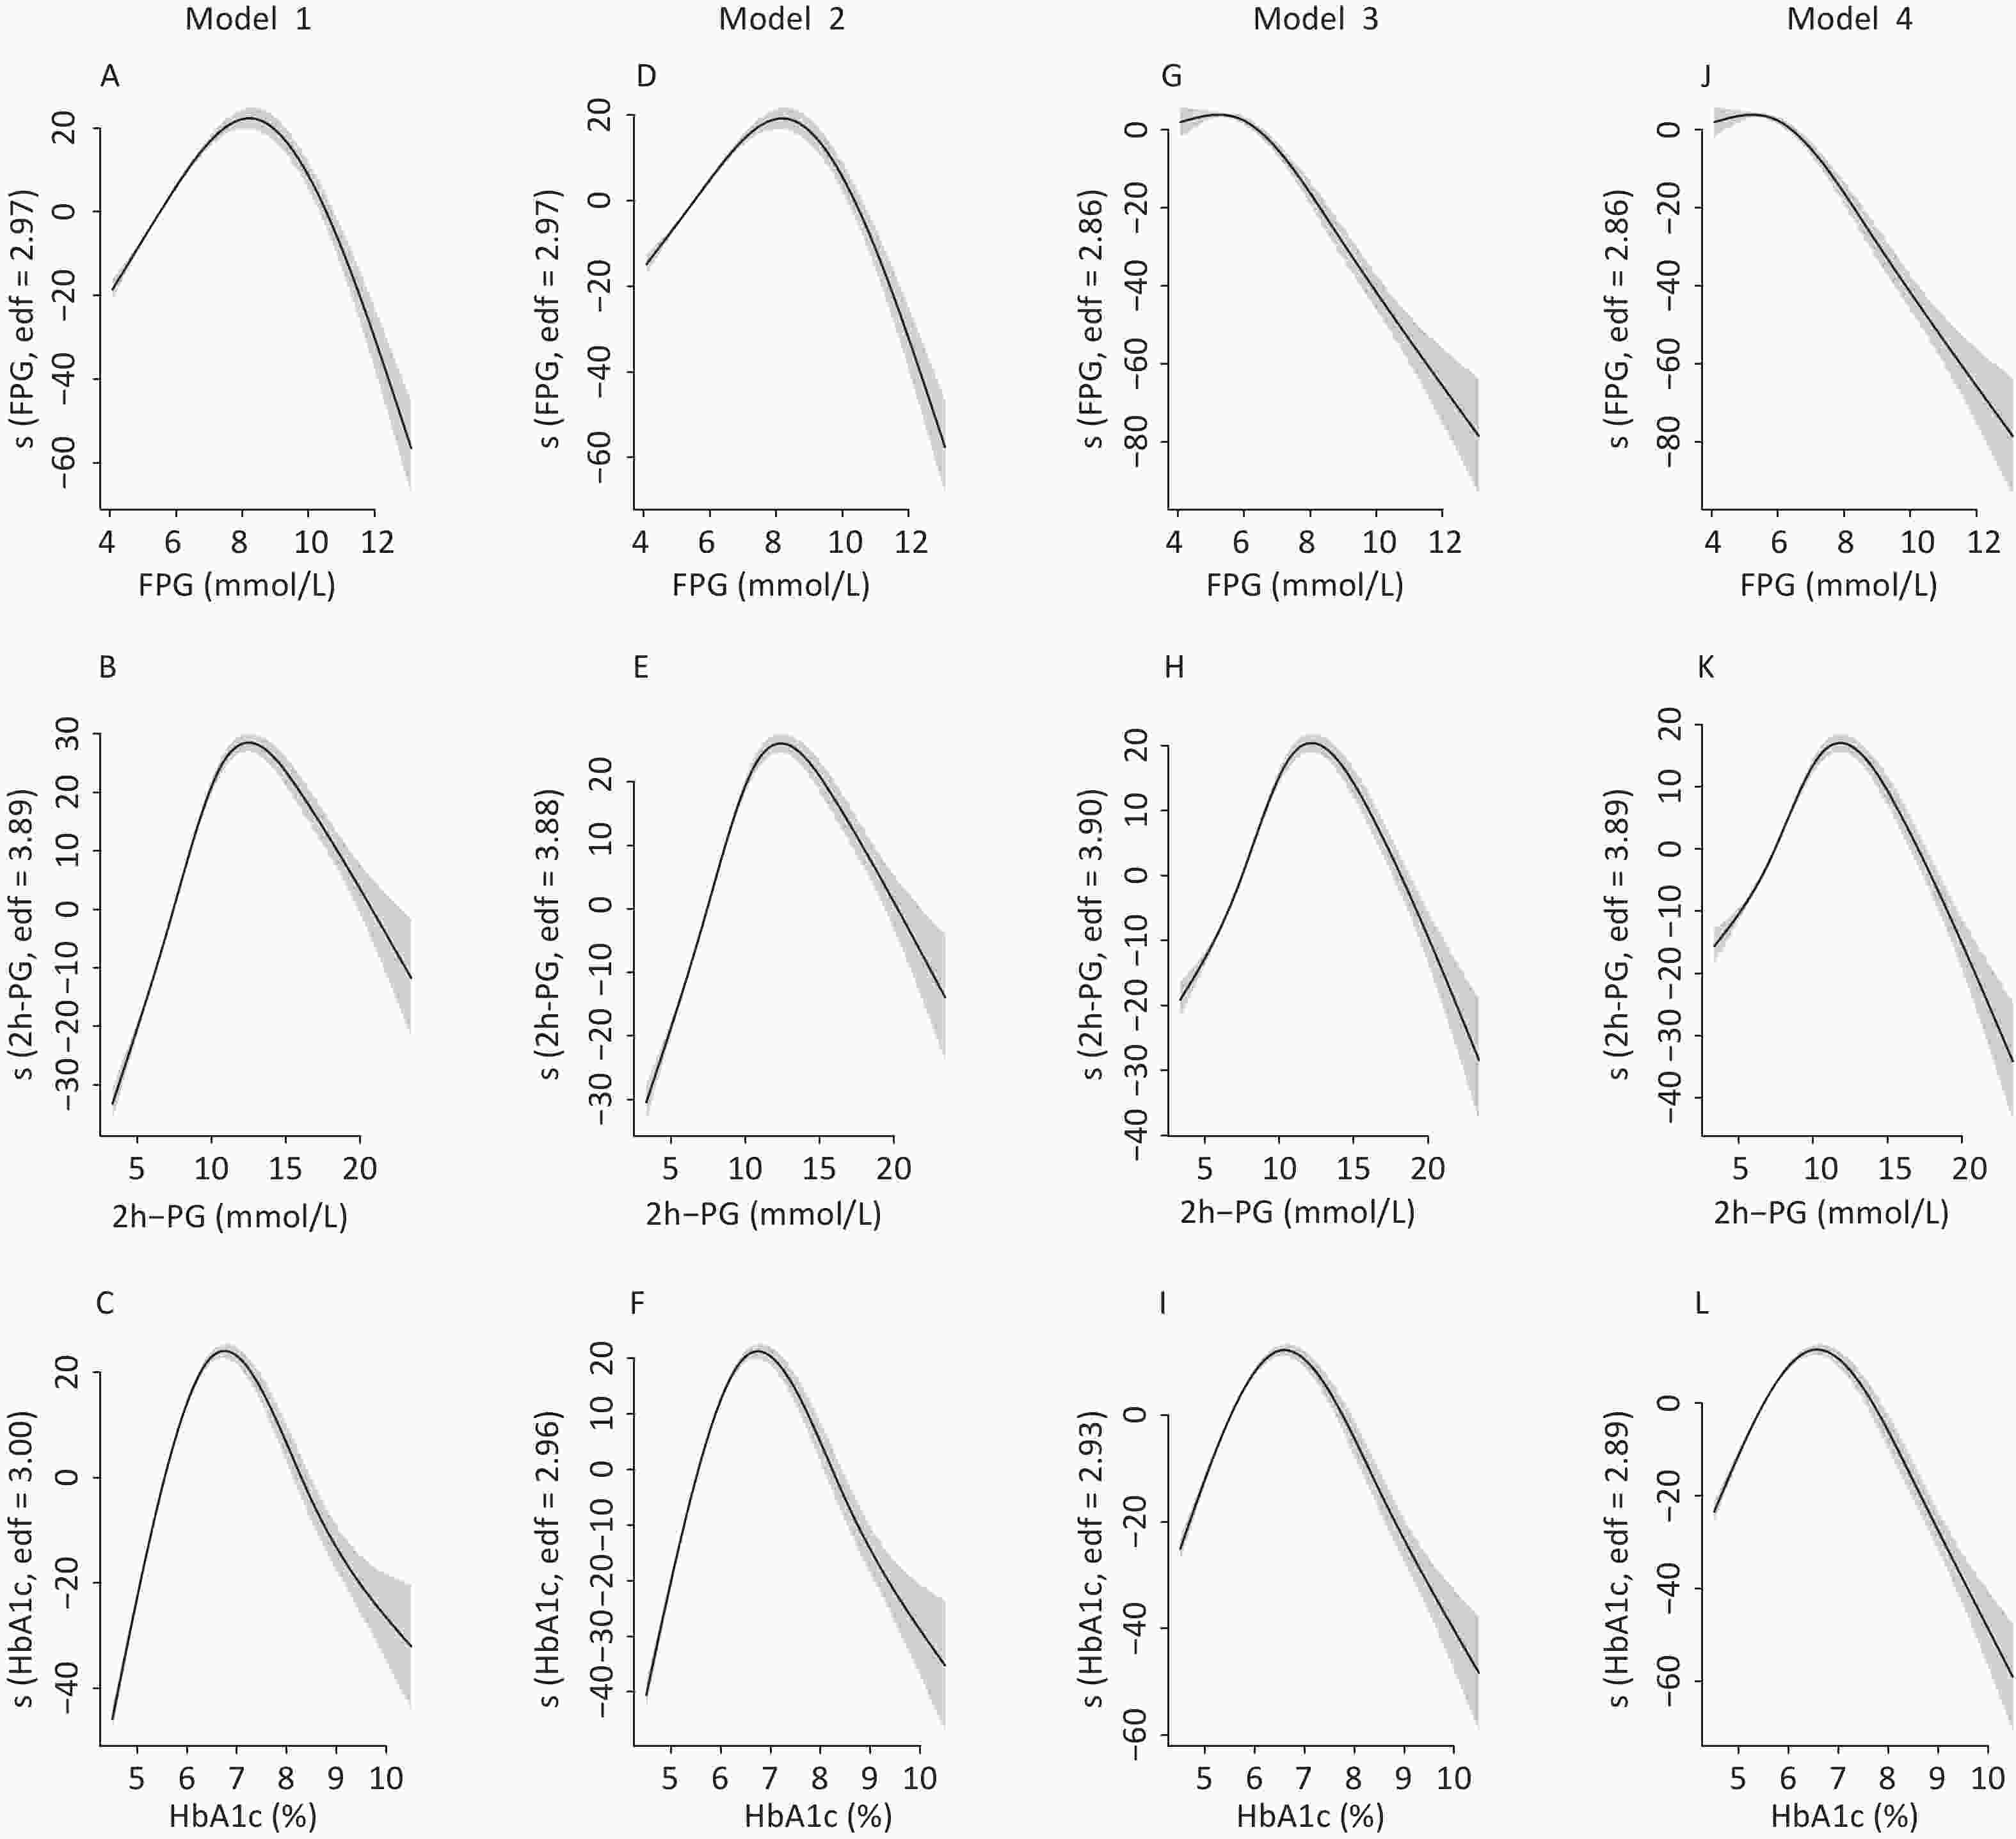
Figure S2. The nonlinear association between glycemic indices and uric acid in women by unadjusted and adjusted GAM model. The y-axis represents the spline function. Shade scope indicate 95% confidence bounds
Stratified analysis was performed to verify the results of the pre-specified subgroups. As shown in Table 2, positive correlations were observed between glycemic indices and SUA levels in participants whose values did not exceed the abovementioned cut-off points. Meanwhile, a negative correlation was observed in participants whose glucose levels were greater than the cut-off points in crude models and most adjusted models. In fully adjusted models, negative associations were observed between FPG, HbA1c and SUA levels before the inflection points after accounting for serum insulin levels (−0.90 and −2.66, respectively) in men. All regression coefficients were significant in all four models
Glycemic index Model 1 Model 2 Model 3 Model 4 β SE P β SE P β SE P β SE P Men FPG (mmol/L) ≤ 6.5 6.86 1.09 < 0.0001 7.49 1.09 < 0.0001 2.16 1.04 < 0.0001 −0.90 1.08 < 0.0001 > 6.5 −7.99 0.55 < 0.0001 −8.15 0.55 < 0.0001 −9.73 0.52 < 0.0001 −9.99 0.55 < 0.0001 2h-PG (mmol/L) ≤ 11 5.06 0.31 < 0.0001 5.64 0.31 < 0.0001 3.07 0.30 < 0.0001 2.94 0.31 < 0.0001 > 11 −4.27 0.32 < 0.0001 −4.29 0.32 < 0.0001 −5.06 0.31 < 0.0001 −5.29 0.32 < 0.0001 HbA1c (%) ≤ 6.1 10.45 1.61 < 0.0001 13.22 1.62 < 0.0001 0.91 1.54 < 0.0001 −2.66 1.59 < 0.0001 > 6.1 −15.60 0.93 < 0.0001 −15.73 0.93 < 0.0001 −17.20 0.87 < 0.0001 −18.83 0.94 < 0.0001 Women FPG (mmol/L) ≤ 8 12.76 0.46 < 0.0001 10.23 0.46 < 0.0001 5.36 0.44 < 0.0001 0.60 0.45 < 0.0001 > 8 −6.10 0.67 < 0.0001 −5.89 0.67 < 0.0001 −7.63 0.63 < 0.0001 −7.76 0.66 < 0.0001 2h-PG (mmol/L) ≤ 14 7.30 0.15 < 0.0001 6.48 0.15 < 0.0001 4.61 0.14 < 0.0001 3.77 0.15 < 0.0001 > 14 −4.34 0.41 < 0.0001 −4.29 0.41 < 0.0001 −5.36 0.39 < 0.0001 −5.55 0.41 < 0.0001 HbA1c (%) ≤ 6.5 36.19 0.82 < 0.0001 30.93 0.84 < 0.0001 18.95 0.79 < 0.0001 17.63 0.82 < 0.0001 > 6.5 −13.18 0.89 < 0.0001 −12.98 0.88 < 0.0001 −14.84 0.83 < 0.0001 −16.66 0.91 < 0.0001 Note. Model 1 was an unadjusted model. Model 2 was adjusted for age. Model 3 was adjusted for age, body mass index, low-density lipoprotein cholesterol, systolic blood pressure, residence, education level, current drinking status, current smoking status, physical activity, and glomerular filtration rate. Model 4 was adjusted for age, body mass index, low-density lipoprotein cholesterol, systolic blood pressure, residence, education level, current drinking status, current smoking status, physical activity, glomerular filtration rate, and fasting insulin level. Abbreviations: FPG, fasting plasma glucose; 2h-PG, 2-hour postload glucose; HbA1c, glycated hemoglobin; SUA, serum uric acid. Table 2. Association of glycemic indices and SUA by sex
-
In the present study, inverted U-shaped associations between glycemic indices (FPG, 2h-PG, and HbA1c) and SUA levels were observed in both sexes. The thresholds for FPG, 2h-PG, and HbA1c were generally lower in men than in women. These associations partly explained the different trends of hyperuricemia prevalence according to glucose tolerance in men and women. To the best of our knowledge, this is the first study to evaluate the association in a nationwide, general Chinese population with a full range of glucose tolerance.
Similar to the results of other studies, the prevalence of hyperuricemia increased with an increase in BMI in both sexes. This trend suggested that adiposity might be involved in purine metabolism, which had been discovered previously[21]. Moreover, the prevalence of hyperuricemia decreased with age in men but increased with age in women. The gender difference could partly be due to the interactions of sex hormones, especially estrogen, which promotes renal uric acid excretion and decrease the level of SUA[22]. In addition, a significant change in food pattern and alcohol consumption in men and women may also contribute to this difference[23]. Similar to the result of a previous study in China[24], the prevalence of hyperuricemia was higher in individuals living in urban areas than those living in rural areas in our study, which is in accordance with the pattern of prevalence of other metabolic diseases in China[25].
Even though NGT individuals had the lowest prevalence of hyperuricemia in both sexes, the trend in hyperuricemia prevalence with worsening glycemic status differed between men and women. The prevalence of hyperuricemia stably rose from NGT to diabetic condition in women, while the highest prevalence was observed among prediabetic men rather than diabetic men. These results agreed with those of previous studies. For example, Cheng et al. demonstrated that the positive association between hyperuricemia and diabetes was stronger in women than in men[26]. Moreover, Kivity et al. discovered a negative association between SUA and diabetes only in men, but not in women[27], similar to the findings reported by Kawamoto et al.[28]. These studies suggested a sex-specific association between glucose and purine metabolism.
The nonlinear relationship analysis demonstrated that both lower and extremely higher serum glucose levels were associated with a lower prevalence of hyperuricemia, showing an inverted U-shaped relationship between glucose indices and SUA in both sexes. This finding was consistent with the reports from both China and Western countries, although the inflection points varied[7,29-32]. Interestingly, the peak point of estimated hyperuricemia prevalence according to glycemic levels occurred earlier in men than in women in our study. Therefore, the prevalence of hyperuricemia decreased earlier with glucose indices in men than in women. Since SUA levels have already begun to drop at prediabetic stages in men, it might decrease further in diabetic men, even lower than that in their NGT counterparts.
The multivariable regression analysis confirmed these results. Before the abovementioned thresholds, the association between glycemic indices and SUA levels was generally positive. In contrast, an absolutely negative association between each glycemic index and SUA levels was observed in all models after the thresholds. However, the regression coefficients between FPG, HbA1c, and SUA were consistently negative in men when serum insulin was included. In addition to the major biochemical indicators and lifestyle factors, insulin might play an active role in the interaction between glycemic indices and SUA levels, consistent with the findings of a previous study[20]. Indeed, most studies suggested that hyperinsulinemia, a marked feature of early-stage T2DM, might be the driver of the ascending segment of the splines. High insulin concentrations can increase SUA levels through several pathways. Insulin can reduce the renal excretion of uric acid[33] and is also capable of activating renal uric reabsorption through sodium-dependent anion transporters[34]. Moreover, insulin can promote uric acid synthesis by enhancing the xanthine dehydrogenase and purine nucleoside phosphorylase activities[35]. Collectively, these results indicate that high serum insulin levels could be correlated to increased SUA levels. However, when hyperglycemia subsequently develops, insulin secretion declines and the ß-cell function is altered[36]. Therefore, the effect of insulin on SUA levels would be offset by pronounced hyperglycemia. In fact, a markedly elevated serum glucose level could decrease uric acid in many aspects[37]. First, higher serum glucose increases the level of glucose in the urine, which is negatively correlated with uric acid[38]. Both glucose and uric acid are reabsorbed in the proximal renal tubules[39], and increased levels of glucose in the urine could competitively inhibit renal uric acid reabsorption[40]. Next, other studies implied that the increased urine osmolarity in diabetic patients, or glycosuria at an even more progressed stage[41,42], could also exert an uricosuric effect. Despite this, we cannot determine whether these factors could function as mediators in the association between glycemic indices and uric acid owing to the cross-sectional nature of the study. Hence, further longitudinal studies are warranted to address this issue. From the perspective of clinical practice, the current findings support the hypothesis that SUA levels might be involved in the early, rather than advanced, stages of glucose metabolism disorder[10,27]. Therefore, patients with prediabetes and newly diagnosed diabetes might be at a higher risk of hyperuricemia.
Moreover, the results of our present study are in line with those of previous studies in terms of the sex-based differences in the nonlinear relationships between glycemic indices and SUA levels. For example, Whitehead et al. found that the inflection points of glucose were 9.0 mmol/L in women and 7.0 mmol/L in men[30]. More recently, Choi et al. demonstrated that the cut-off values of the inverted U-shapes were higher in women than in men[43]. Consequently, the association became negative earlier in men than in women, which is possibly the reason for the stronger negative association between blood glucose and SUA levels in diabetic men than in women, as observed in previous studies[26,44,45]. A possible explanation for the difference in inflection points is that hyperuricemia in women is relatively mild, which is not enough to inhibit the reabsorption of serum glucose until it reaches a higher level[25]. However, further studies with a longitudinal design are essential to examine the underlying mechanisms.
The main strength of the present study included the large sample size and the simultaneous assessment of all three major glycemic indices. Moreover, the inclusion of individuals with different glycemic status from extensive geographies enabled the more comprehensive description of the association between blood glucose and SUA levels. The medical histories were rigorously recorded, which allowed the researchers to eliminate the influence of related drugs or impaired renal function on the association. Some limitations of our study need to be considered. First, the cross-sectional design precluded the reliable establishment of the causality of the association between glycemic indices and SUA levels. Second, most participants were of Han ethnicity. Therefore, the findings might not be directly applicable to other ethnic groups.
In this large-scale, nationwide study, we reported the inverted U-shaped associations between glycemic indices and SUA levels in the general Chinese population. The sex-based difference in inflection points might explain the inconsistent pattern of hyperuricemia prevalence in men and women. However, the exact association between glycemic indices and SUA levels requires further exploration using longitudinal studies.
-
We thank DAI Meng, ZHANG Di, WANG Bin, DU Rui, ZHANG Jie, and LAI Sheng Han for their contribution to scientific discussion.
-
The authors declare that they have no conflicts of interest.
Funds:
This work is supported by grants from the Ministry of Science and Technology of the People’s Republic of China [grant nos. 2016YFC1305600, 2016YFC1305202, 2016YFC1304904, 2017YFC1310700, and 2018YFC1311800]; the National Natural Science Foundation of China [grant nos. 81970706, 81970691, 81970728, and 81800683]
*These authors contributed equally to this work
 Quick Links
 DownLoad: