-
Colorectal cancer (CRC) is a kind of malignant tumor that occurs in the digestive tract. CRC occurs globally and has high rates of morbidity and mortality. Its incidence and mortality are second only to gastric cancer, esophageal cancer, and primary liver cancer in digestive system malignancies. Most CRC cases are adenomas. A few are squamous epithelial cancers, which can spread to adjacent tissues and organs through lymph and blood circulation, or directly. The occurrence of CRC is related to factors that include gene mutation, dietary habits, family disease history, smoking, drinking, and external carcinogens. Diagnostic methods for CRC mainly include digital rectal examination, X-ray barium enema, sigmoidoscopy, and fiber colonoscopy. However, low sensitivity of detection is a problem, and false positives still occur. Thus, screening for specific over-expressed genes as biomarkers is meaningful in the clinic for diagnosis. Additionally, several reports have discussed molecular mechanisms associated with the occurrence of CRC, such as the K-Ras and p53 signaling pathways. The crucial pathways have not been identical. Data of clinical samples from bioinformatics databases with information of gene expression on a large scale may reveal significant pathways that are involved in cancer development[1].
The Gene Expression Omnibus (GEO) database includes information acquired globally using many gene chips. The data include clinically relevant expression of genes and several types of RNA, including messenger RNA (mRNA), micro RNA (miRNA), and long noncoding RNA (lncRNA), and data of DNA methylation. Clinical data can be downloaded from the website and visualized by R language software through special packages such as bioconductors and limma[2]. In addition, analysis of down-regulated genes may reveal functional defects and mutations that trigger the occurrence of cancer. Meanwhile, over-expressed genes may be useful as biomarkers in the clinic or to identify potential antigen targets. Analysis using conventional methods, such as enrichment analysis and protein-protein interaction (PPI) networks, analysis of differentially expressed genes (DEGs) may provide a novel approach to reveal significant genes and signaling pathways related to disease.
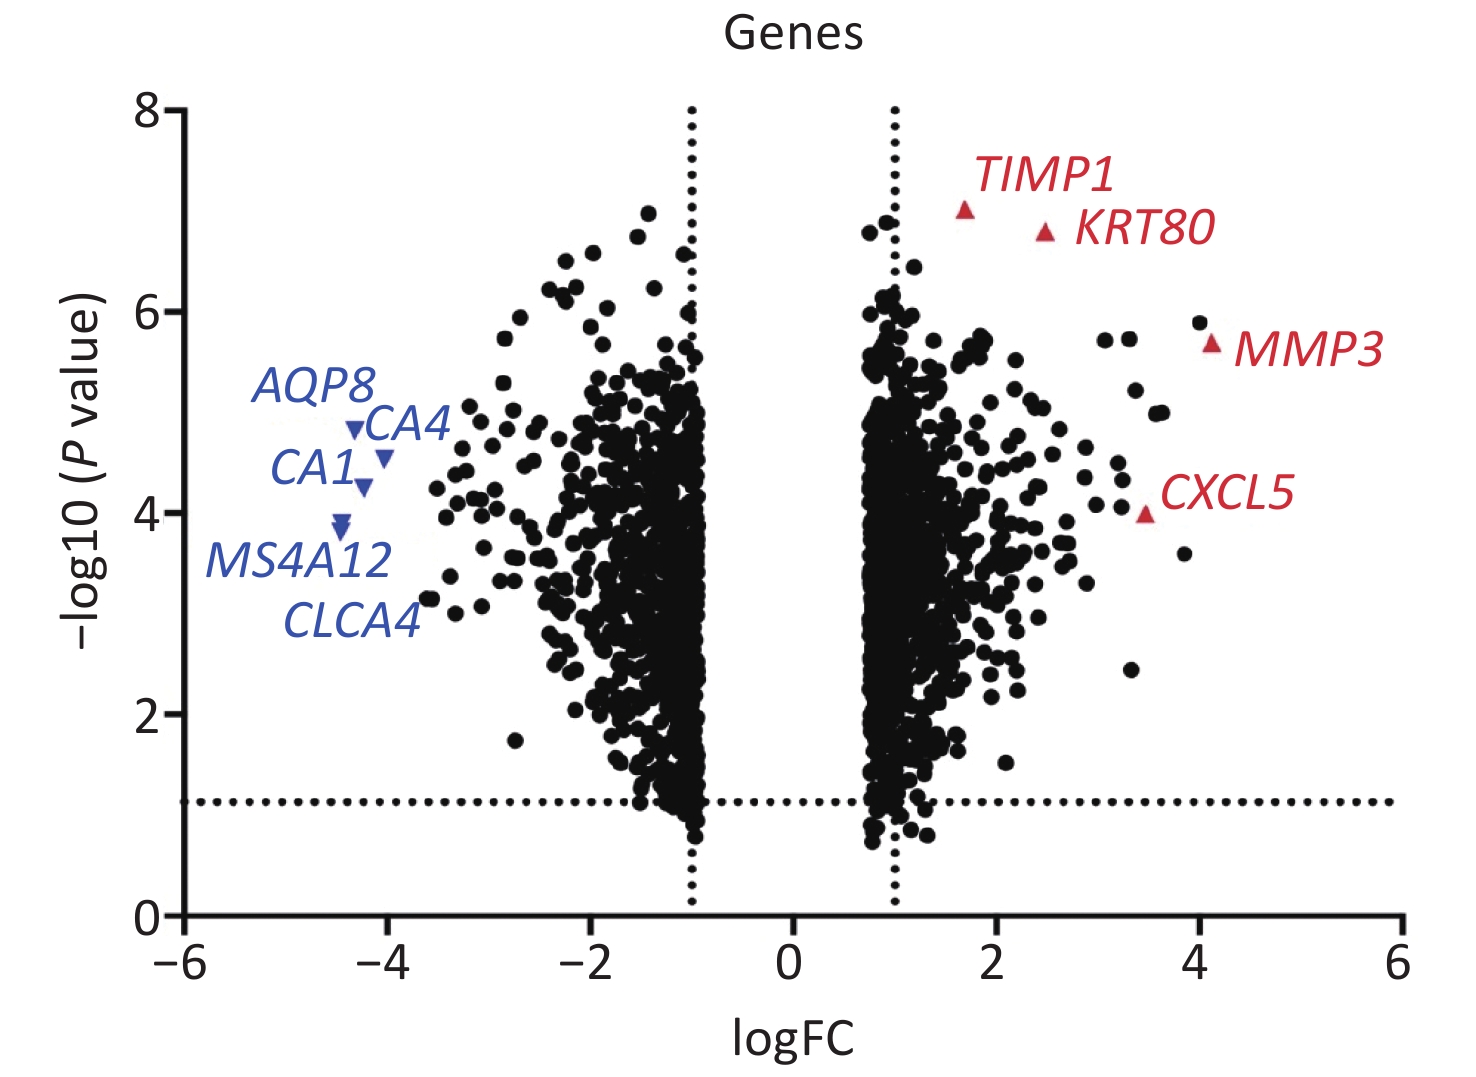
Based on special experimental processing conditions and uniform statistical method of samples, the refined GAE110224 gene chips were chosen for this study from the GEO database. The original GSE110224 gene chip contains information on gene expression in CRC tissue and normal tissue from 17 patients treated clinically. In total, 36,951 DEGs were identified. Of these, 20,006 that were over-expressed and 16,945 that were down-regulated were included. By setting with the parameters |logFC| > 2 and P < 0.05, 71 markedly over-expressed and 106 markedly down-regulated genes were screened. The volcano map of DEGs from the downloaded document was drawn using Prism 8 software (Figure 1). The top ten over-expressed genes according to value of log (fold change) expression levels are listed in Supplementary Table S1 available in www.besjournal.com.
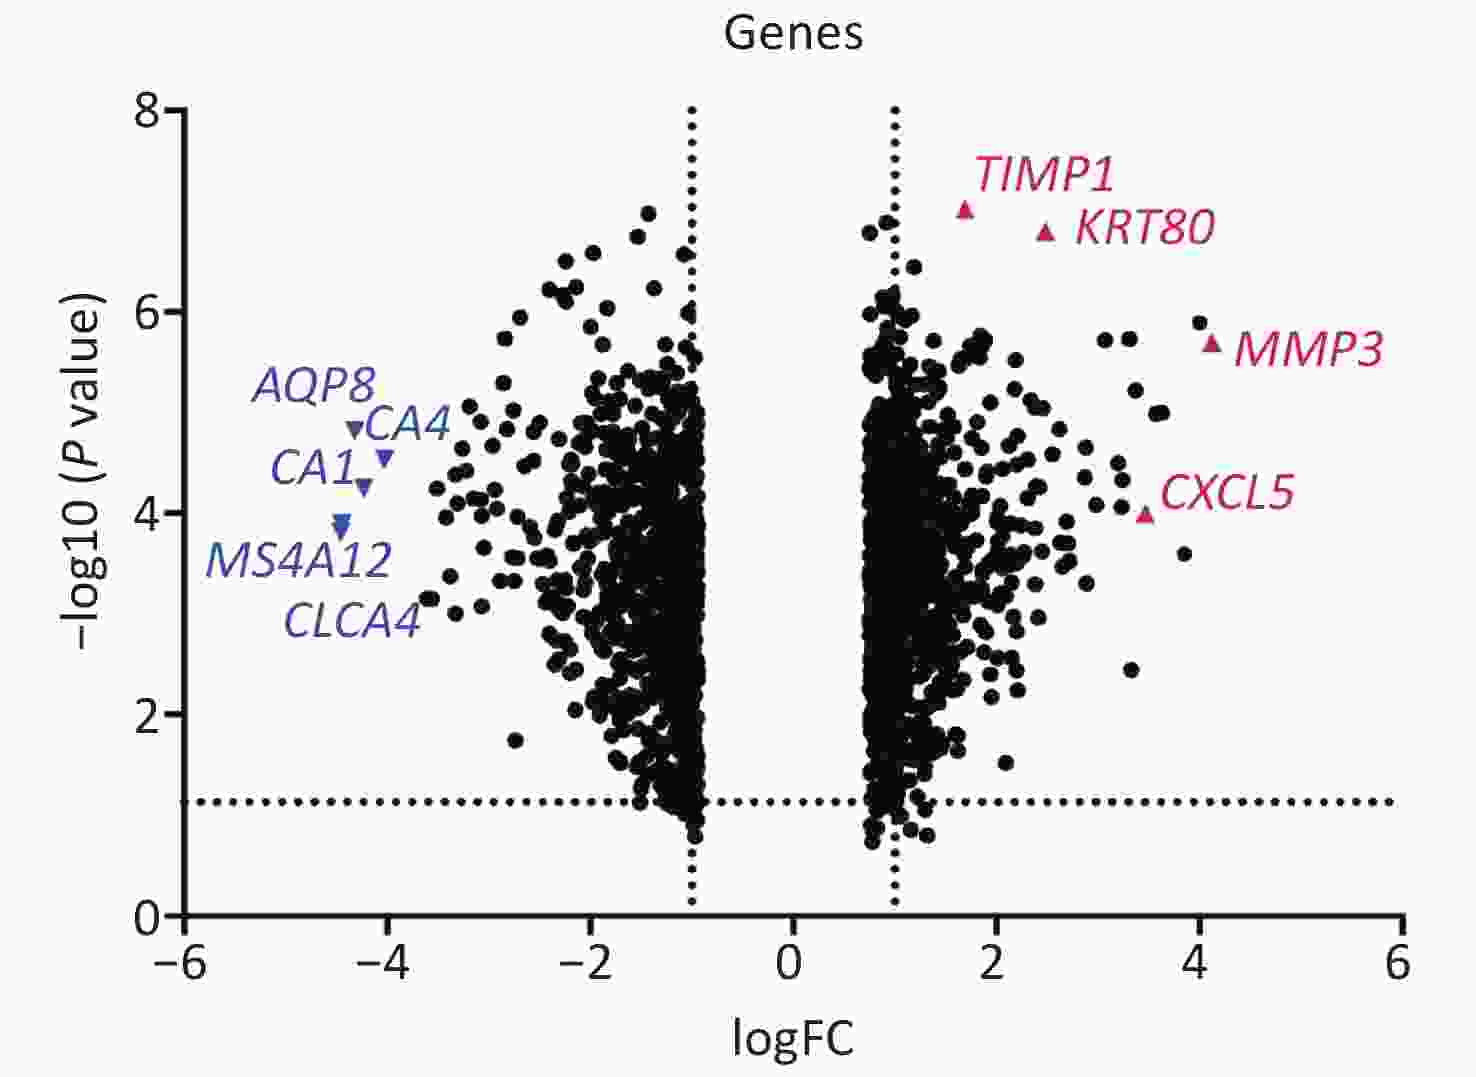
Figure 1. Volcano map of differentially expressed genes. The X-axis displays values of −logFC for each gene. The y-axis displays the −log10 (P value). Genes with positive logFC are over-expressed, and genes with negative logFC are down-regulated. Four remarkably over-expressed and significantly down-regulated genes are denoted in red and blue, respectively.
ID P value logFC Gene Gene name 205828 2.03 × 10⁻⁶ 4.12 MMP3 Matrix metallopeptidase 3 227140 1.28 × 10⁻⁶ 4.00 INHBA Inhibin beta A subunit 209752 2.53 × 10⁻⁴ 3.85 REG1A Regenerating family member 1 alpha 211122 1.01 × 10⁻⁵ 3.63 CXCL11 C-X-C motif chemokine ligand 11 227475 1.04 × 10⁻⁵ 3.57 FOXQ1 Forkhead box Q1 214974 1.01× 10⁻⁴ 3.47 CXCL5 C-X-C motif chemokine ligand 5 204259 6.07 × 10⁻⁶ 3.37 MMP7 Matrix metallopeptidase 7 205886 3.59 × 10⁻³ 3.33 REG1B Regenerating family member 1 beta 212942 1.87 × 10⁻⁶ 3.31 CEMIP Cell migration inducing hyaluronan binding protein 204475 4.68 × 10⁻⁵ 3.24 MMP1 Matrix metallopeptidase 1 Note. Fold change (FC) of specific gene represents the multiple of expression in cancer tissue contrasting with normal tissue. P value indicates about significant difference bwteen two groups. By setting with filter of |logFC| > 2 and P value < 0.05, remarkably over-expressed and down-regulated genes were screened. Table S1. Top 10 over-expressed genes
In addition to the aforementioned GEO database, online platforms including Gene Expression Profiling Interactive Analysis (GEPIA) and OncoLnc can be useful to visualize gene expression and survival curves based on clinical data from The Cancer Genome Atlas (TCGA) website. The Human Protein Atlas database contains a variety of immune-histochemical patches for significant genes in several types of cancer tissues and normal tissues. Functional protein association networks (STRING) is an online platform for the analysis of gene enrichment and PPI. The Functional Annotation Bioinformatics Microarray Analysis (DAVID) website is useful for Gene Ontology enrichment analyses of DEGs identified from gene chips. Presently, the functions and involved signaling pathways of significant genes were searched from GeneCards and the Kyoto Encyclopedia of Genes and Genomes website for further demonstration. Volcano maps of DEGs, expression histograms, survival curves, and receiver operating characteristic (ROC) curves were plotted using Prism 8 software. Bubble charts of pathway enrichment were constructed using R 3.6.3 software based on the results of enrichment analysis from the DAVID website[3].
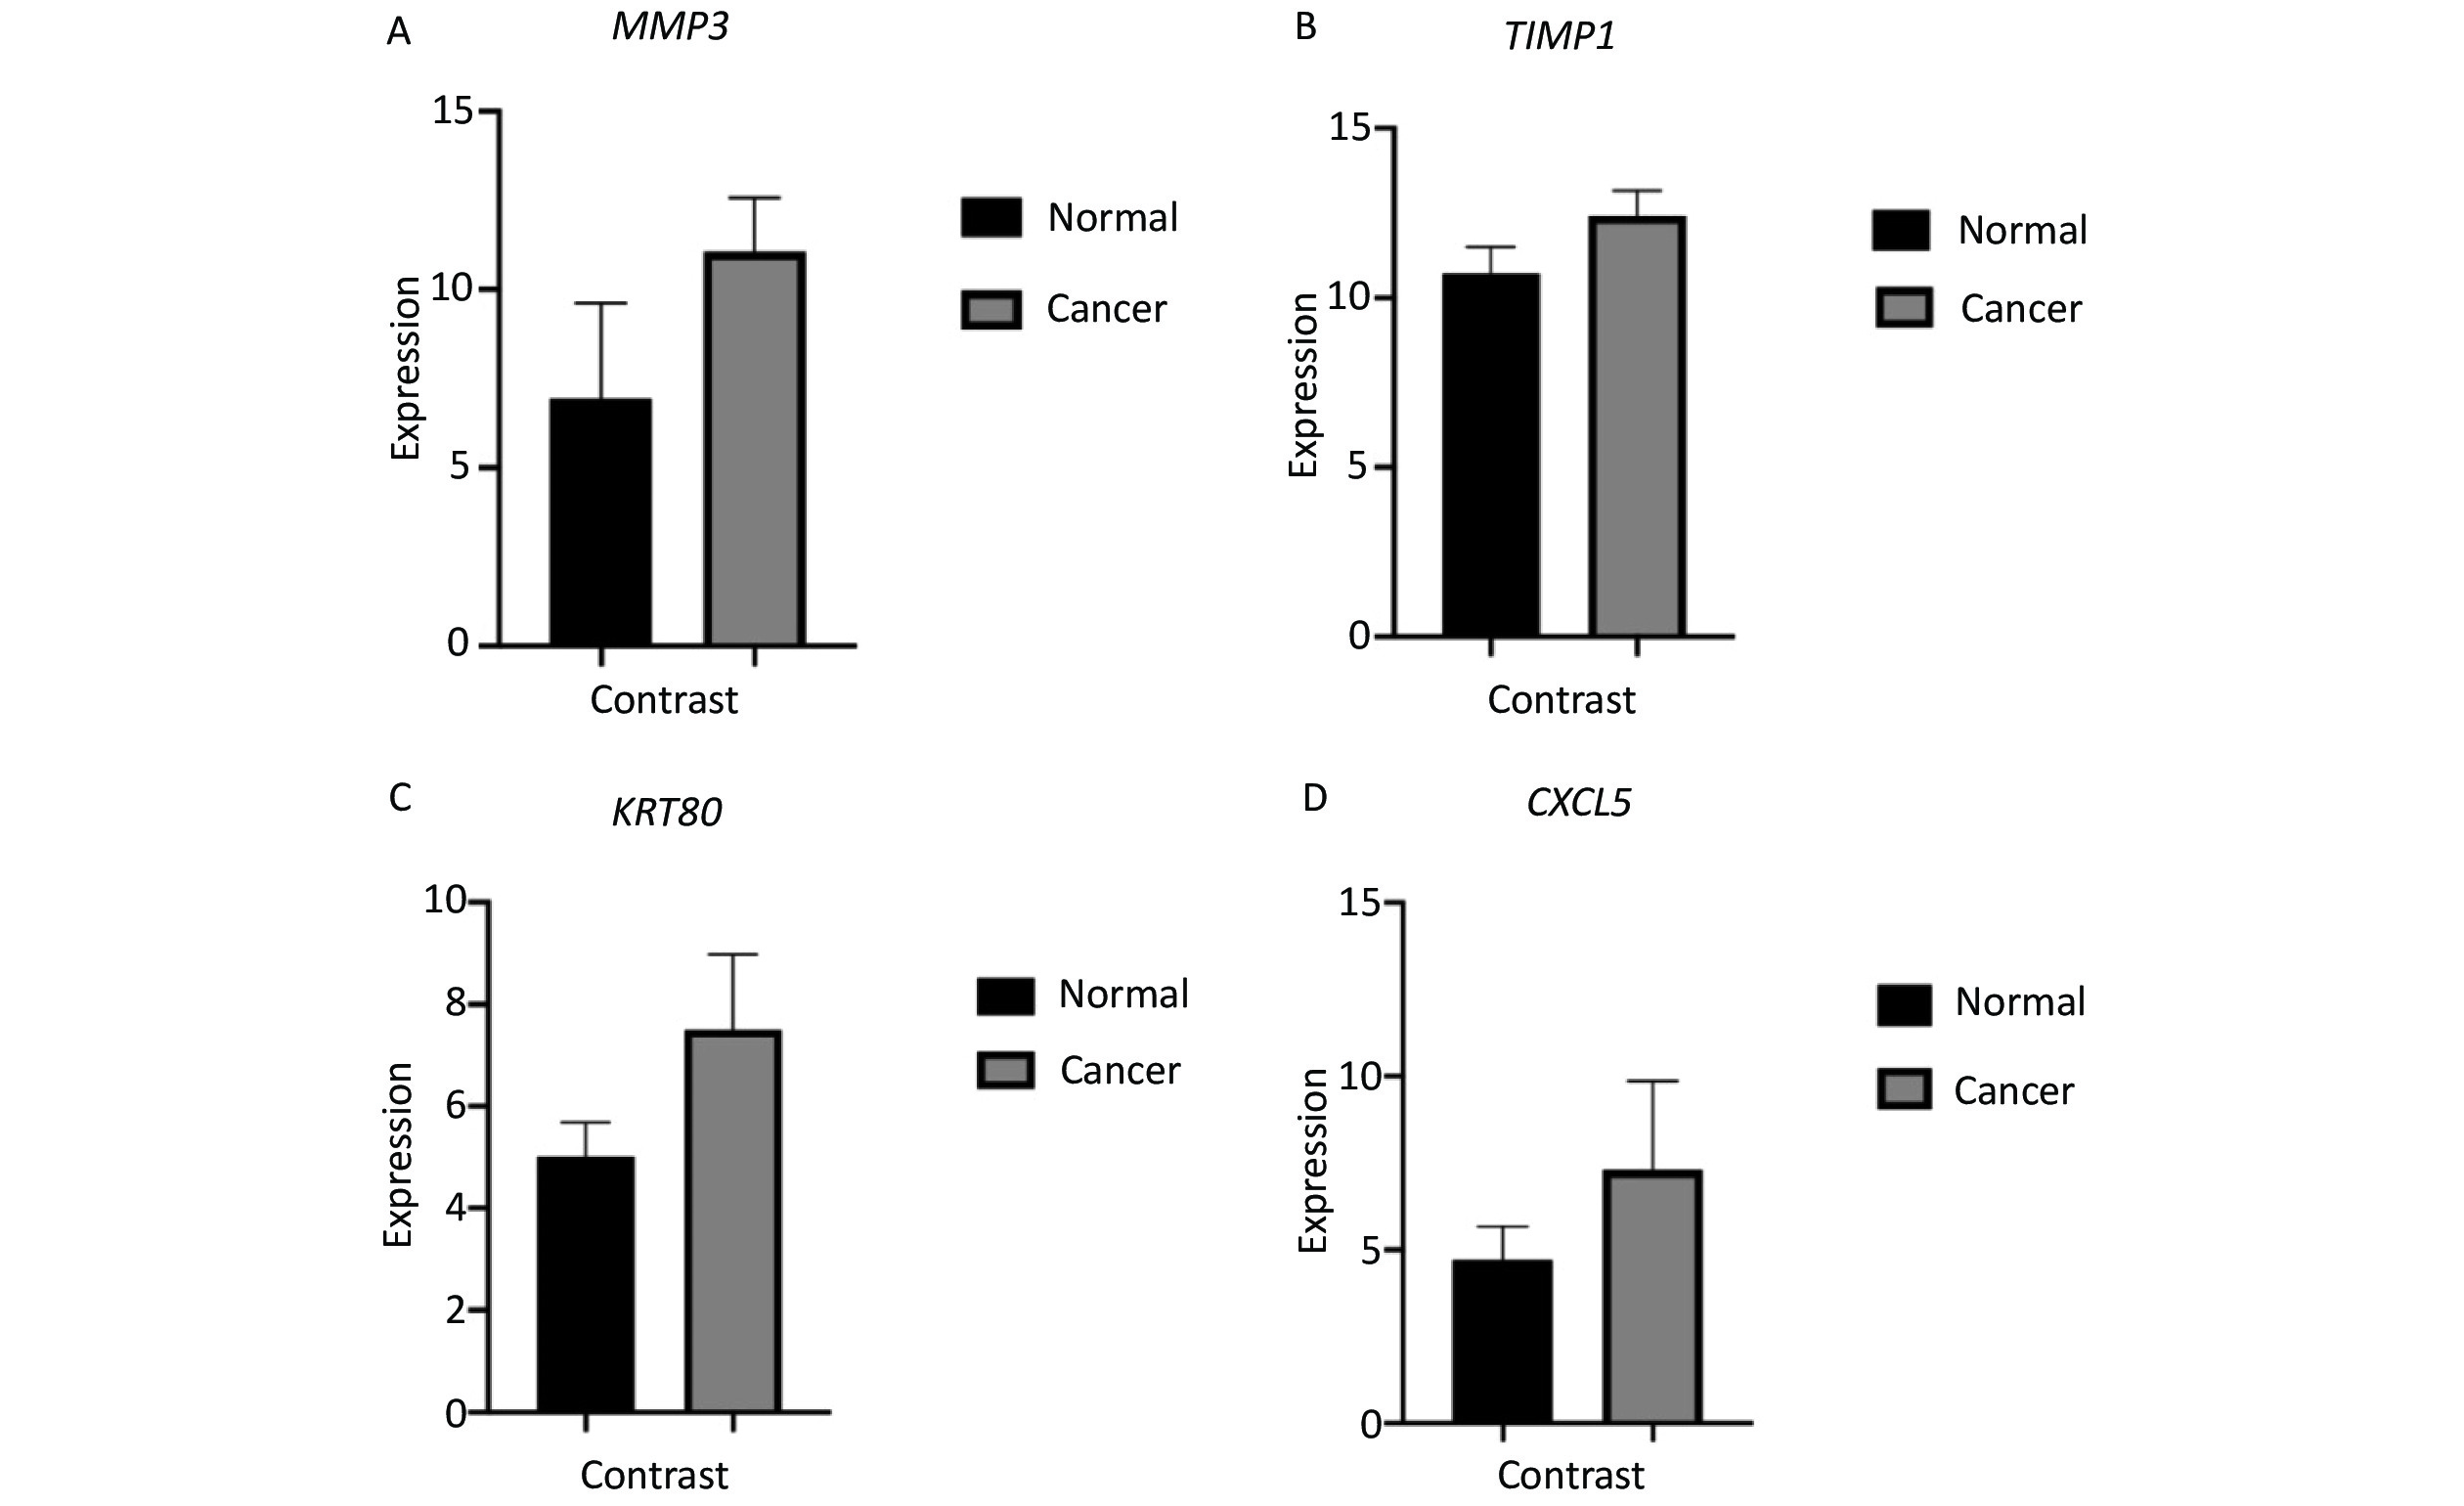
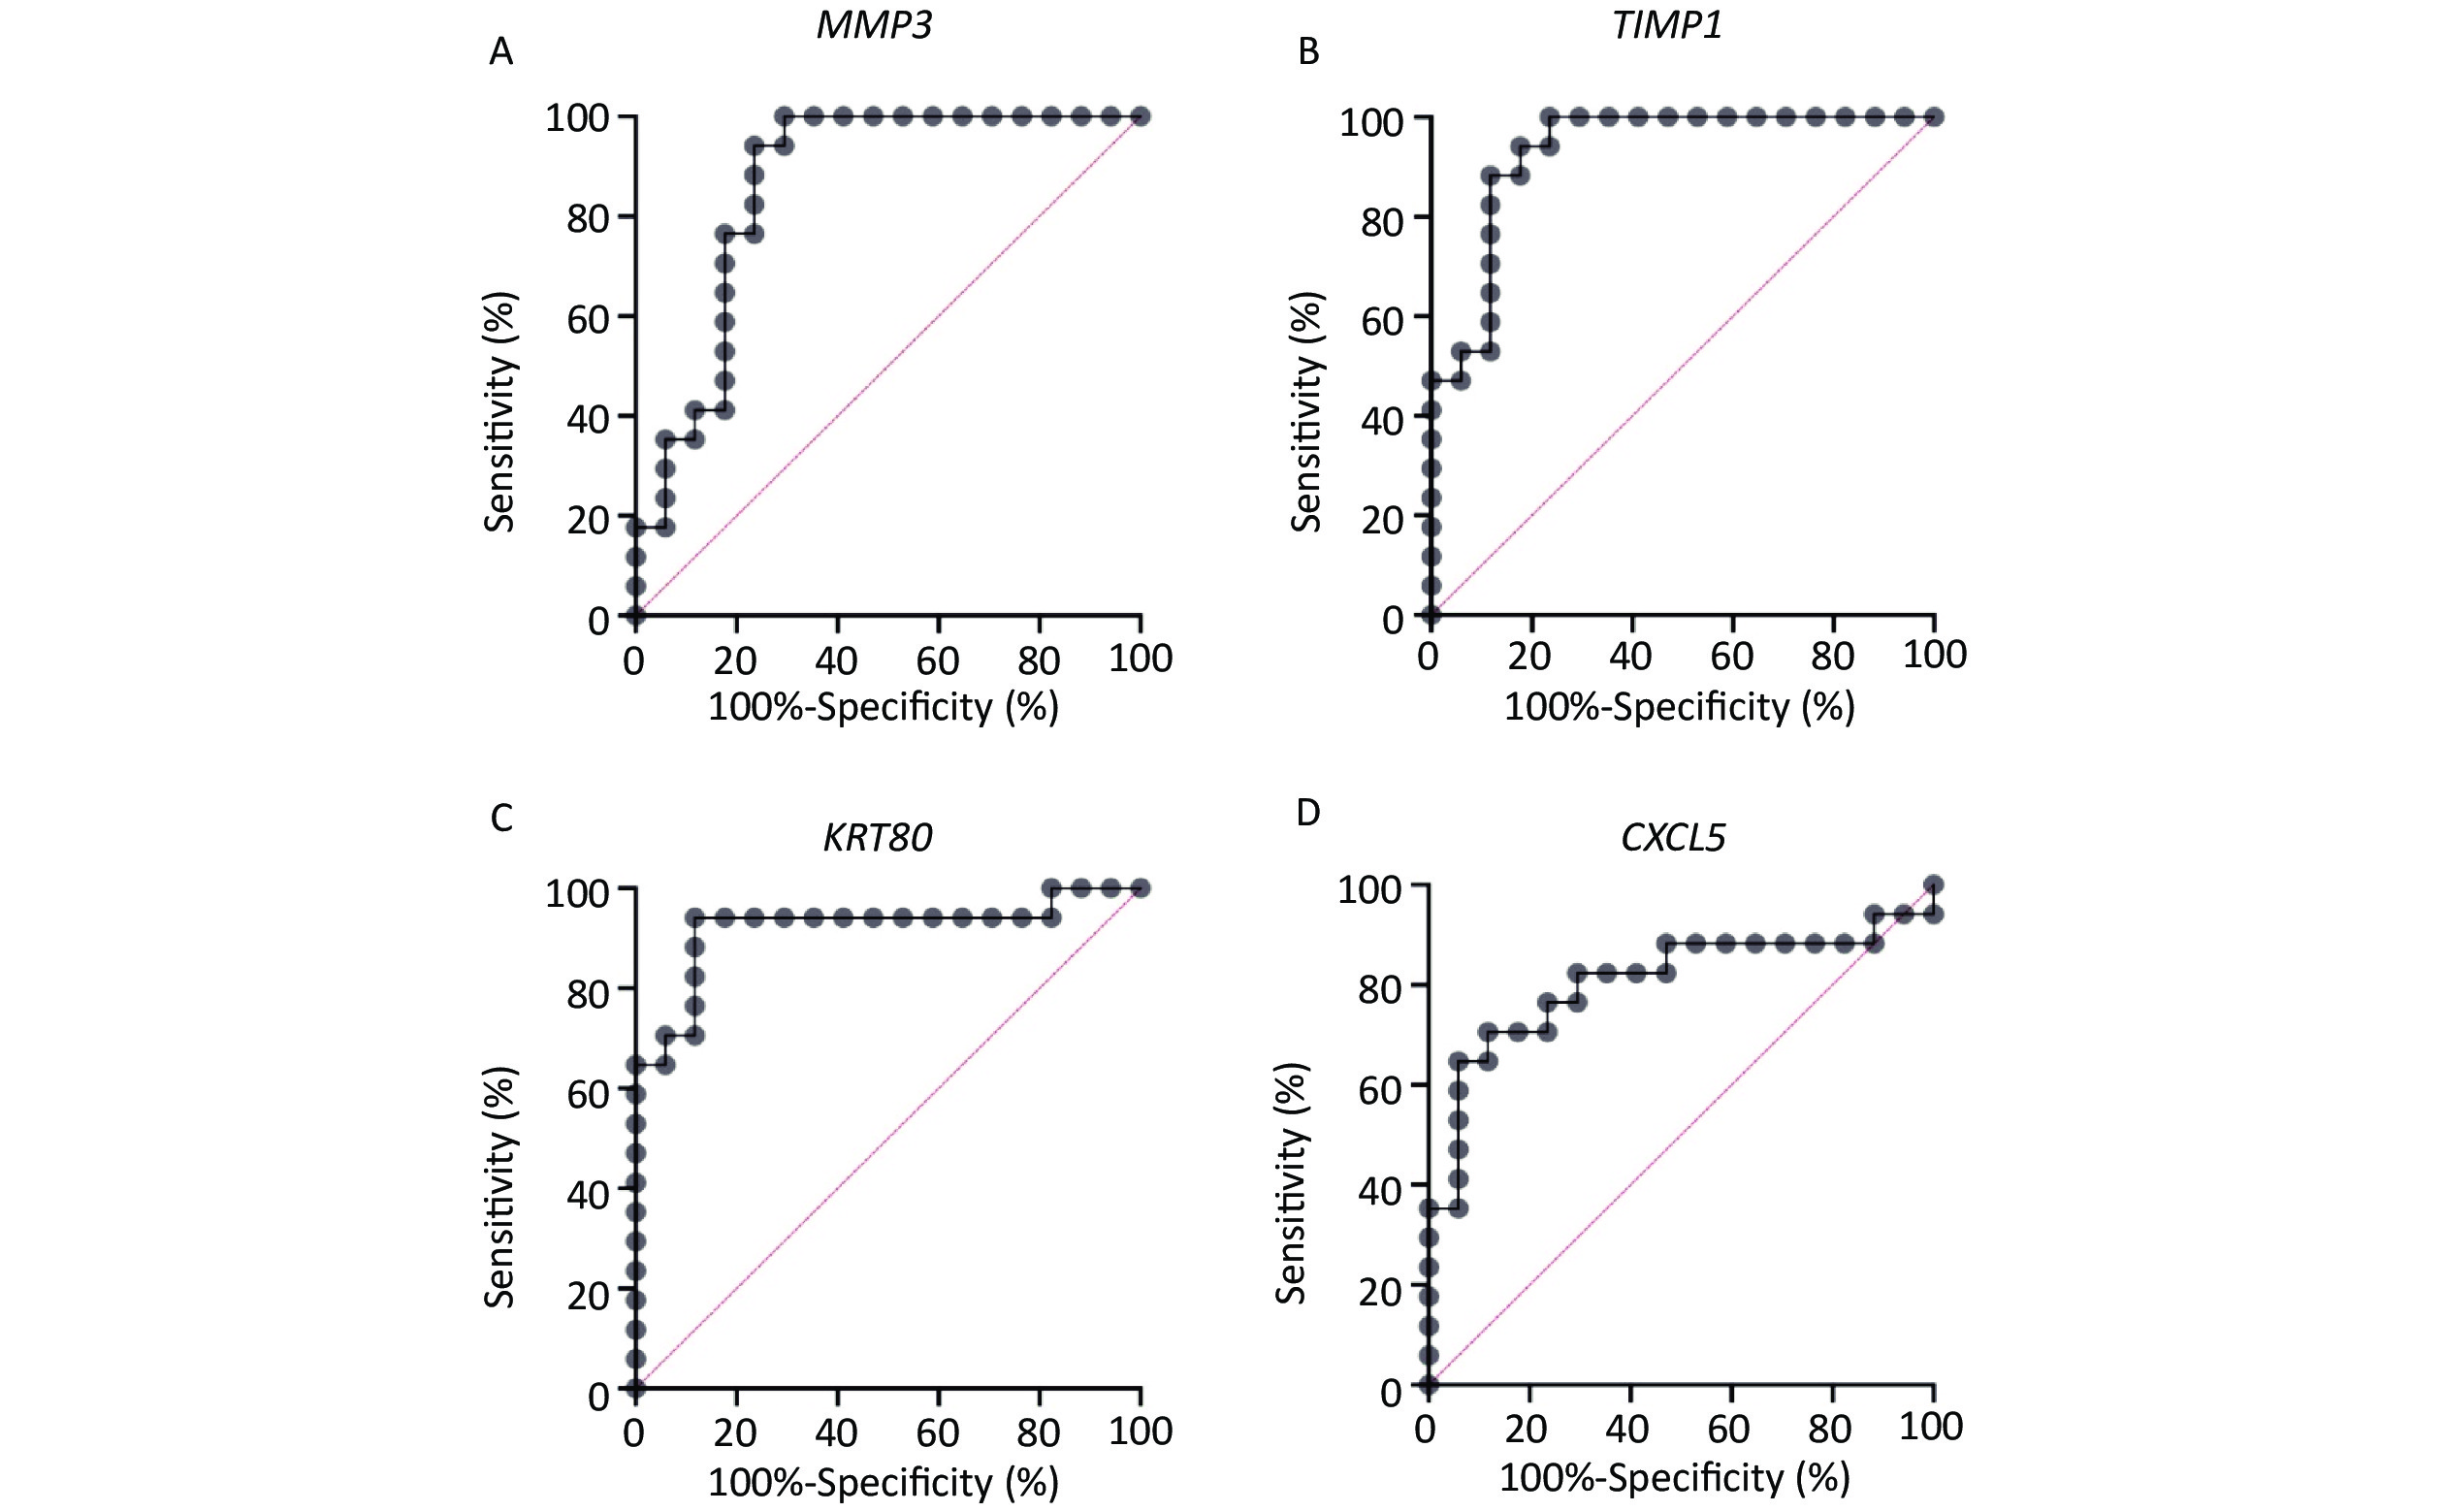
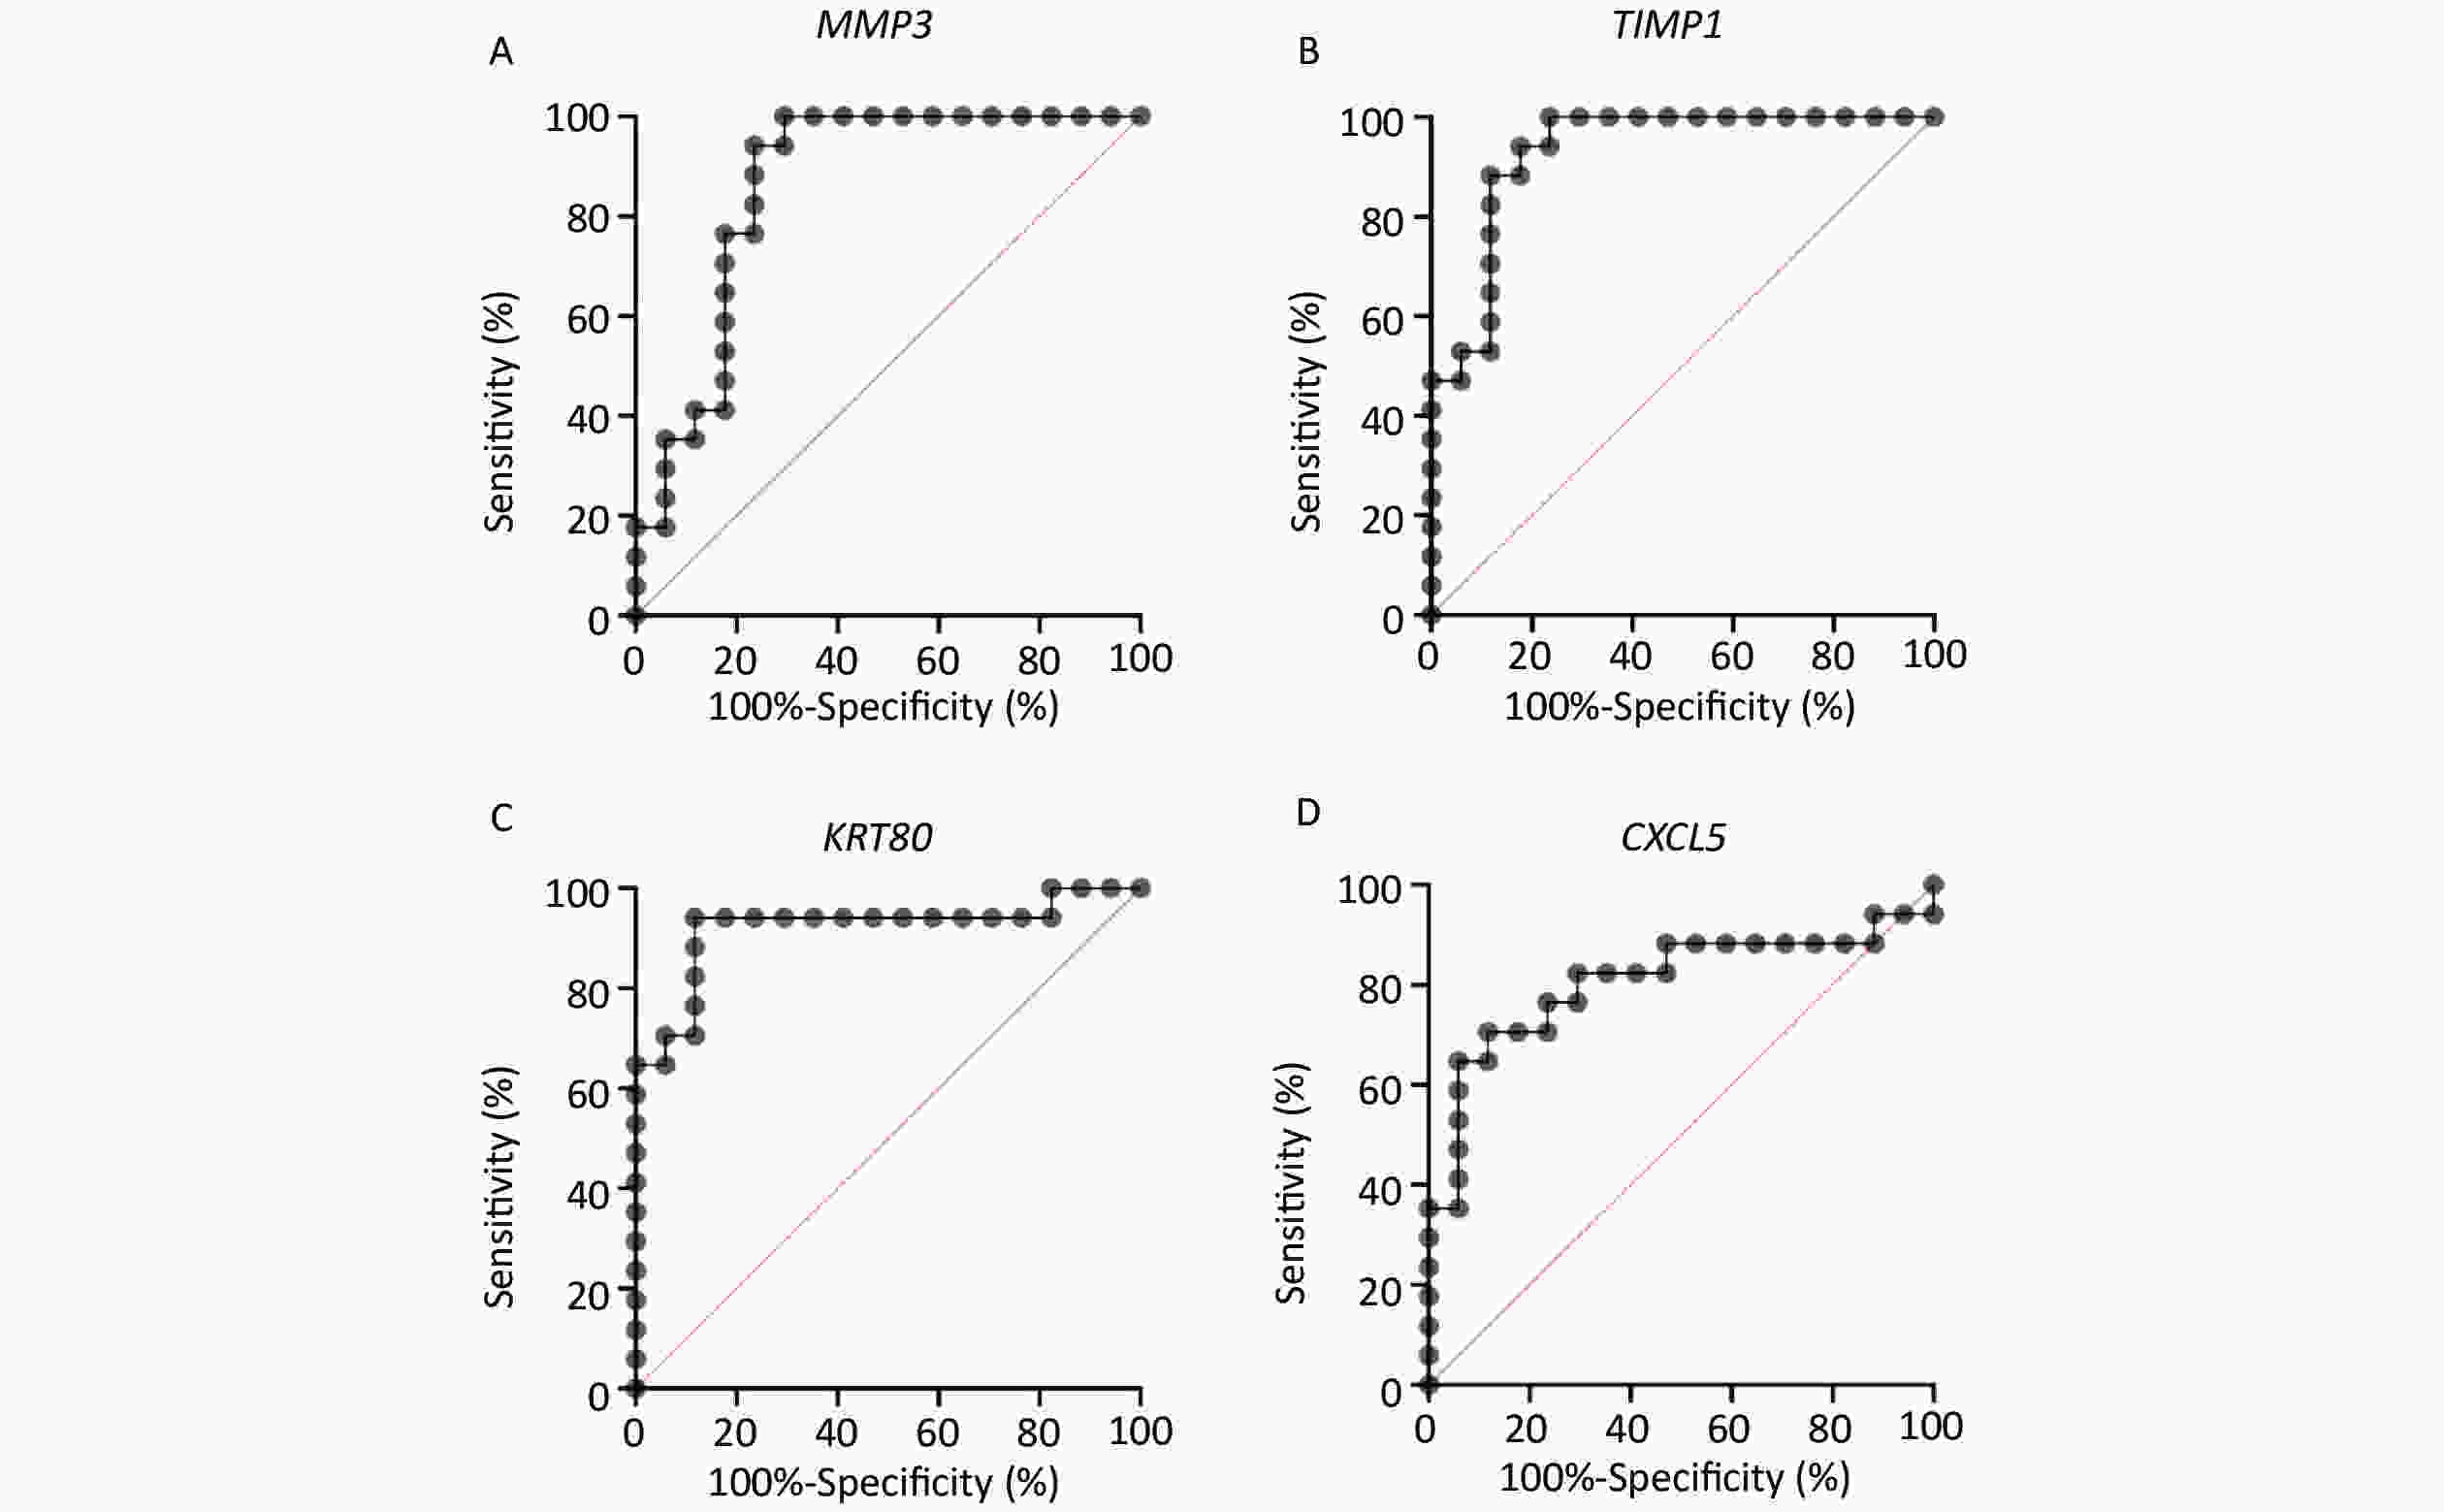
Based on a survey of relevant reports, four genes (MMP3, TIMP1, KRT80, and CXCL5) with high levels of expression and significant differences were selected for further analysis as shown in Supplementary Figure S1 available in www.besjournal.com. The area under the ROC curve for MMP3, TIMP1, KRT80, and CXCL5 was 0.8616, 0.9308, 0.9204, and 0.8062, respectively (Supplementary Figure S2 available in www.besjournal.com). In addition, MMP3 and CXCL5 were comparatively over-expressed in CRC tissue with significant differences. These genes could be potential biomarkers for diagnosis in clinical settings based on the high accuracy of their ROC curves as reported.
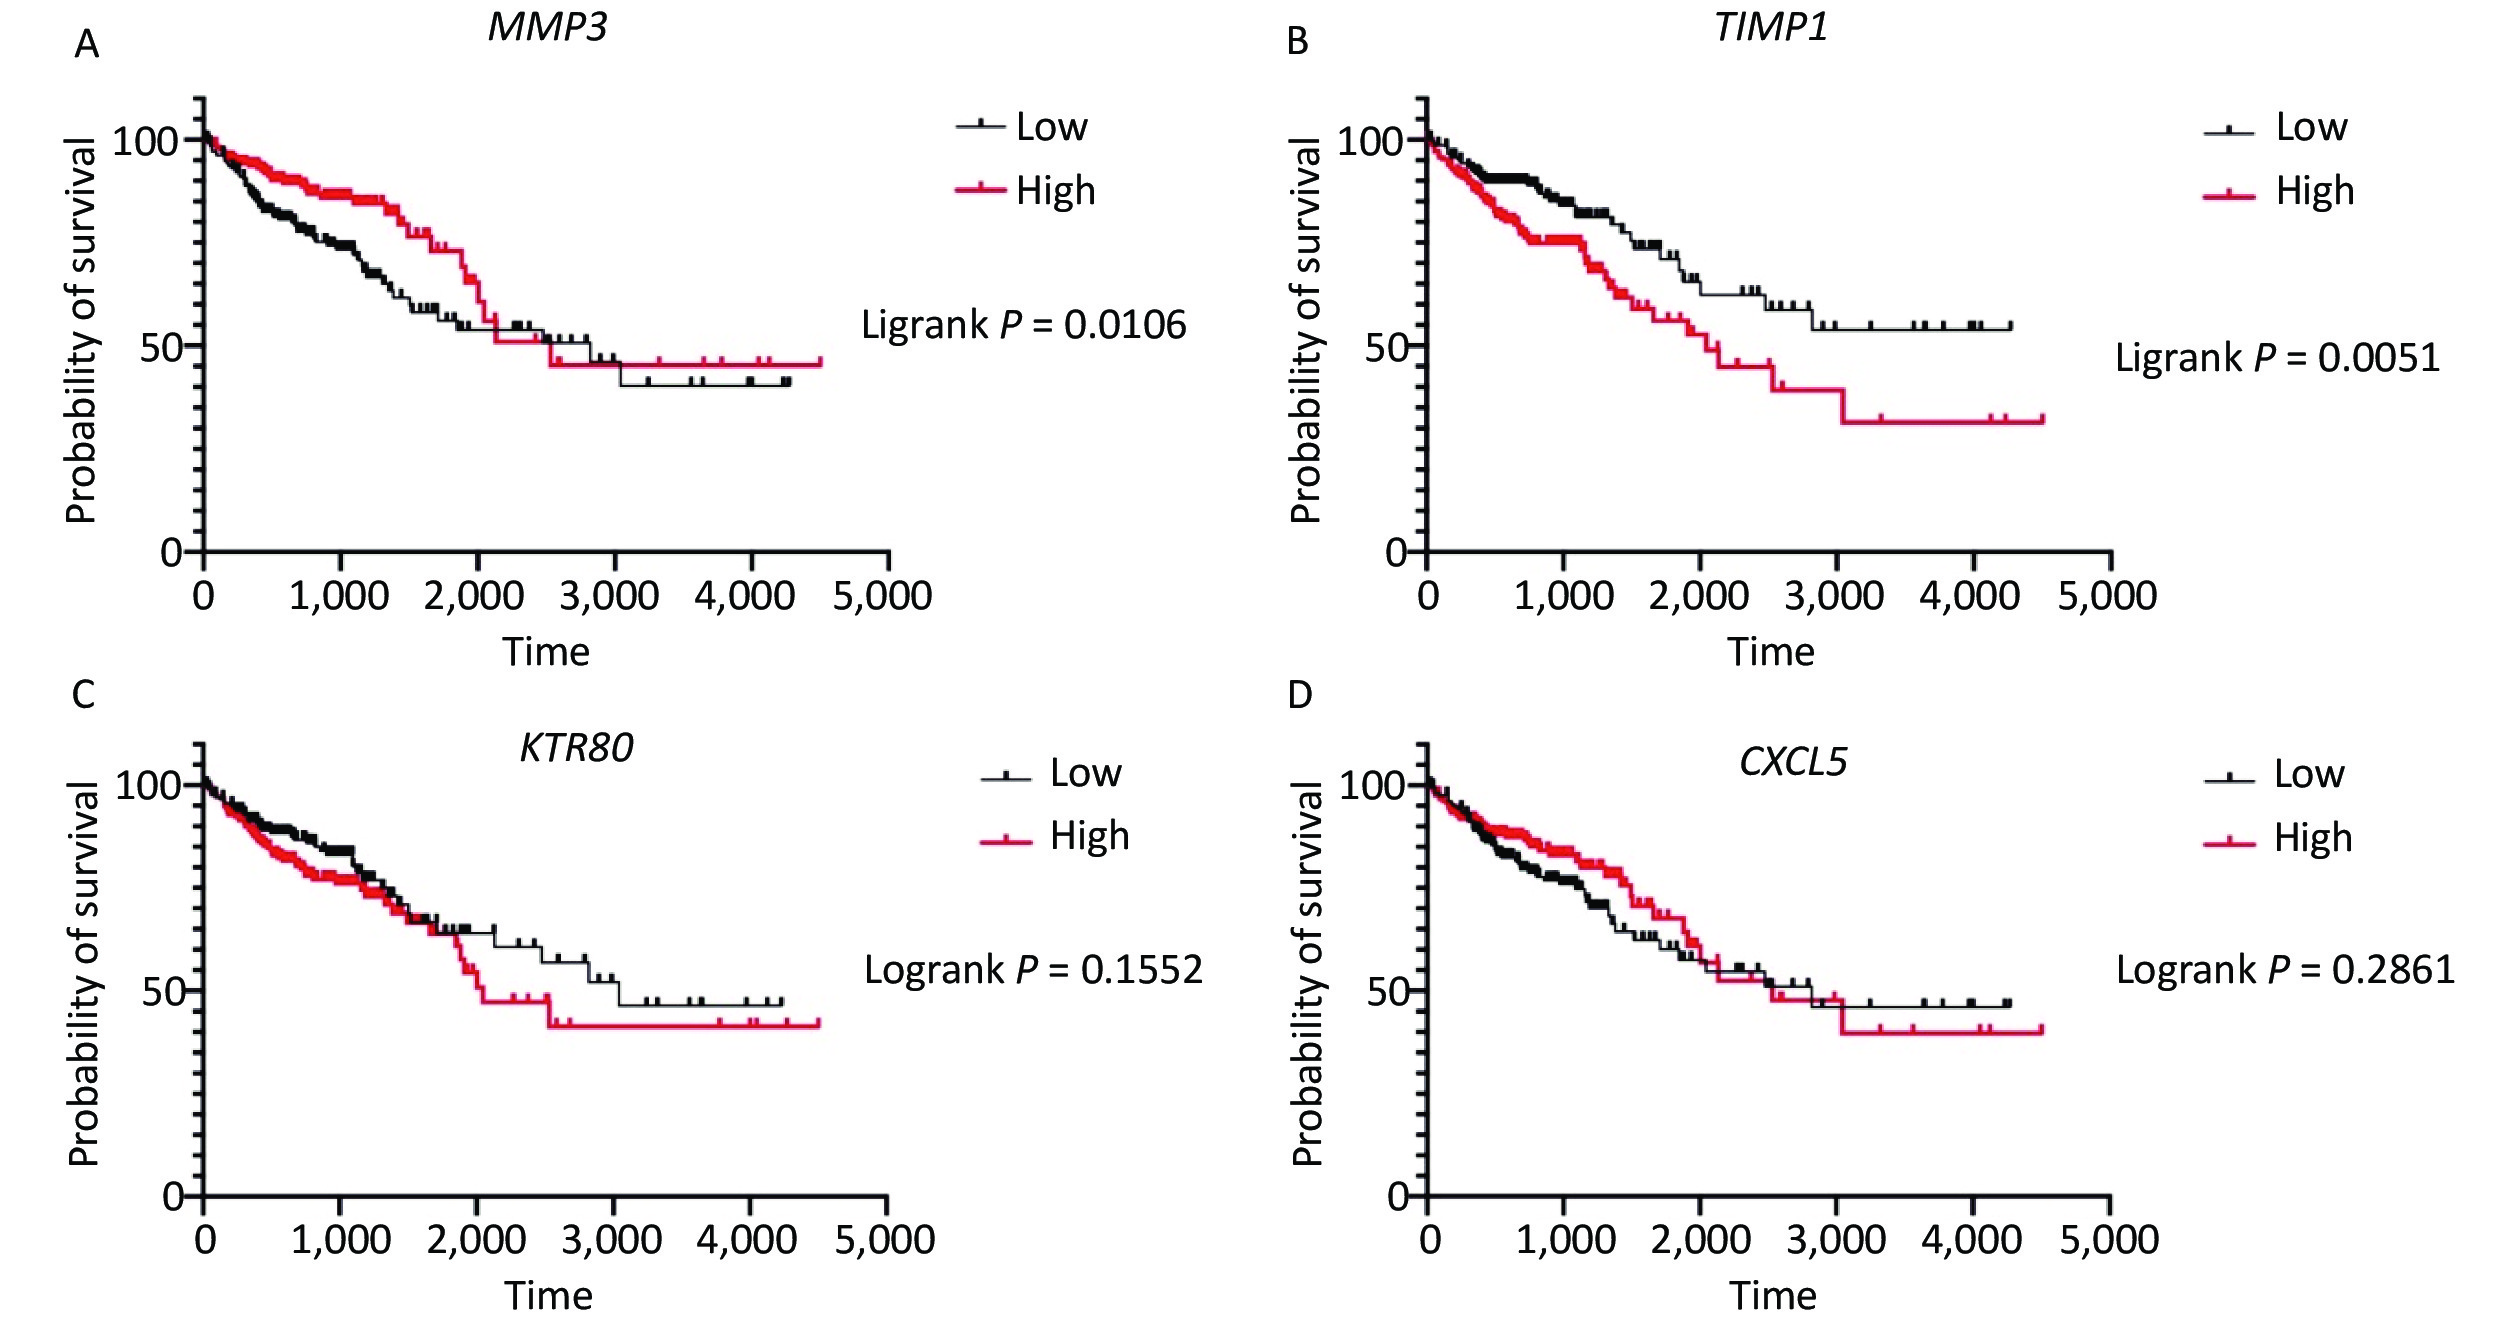
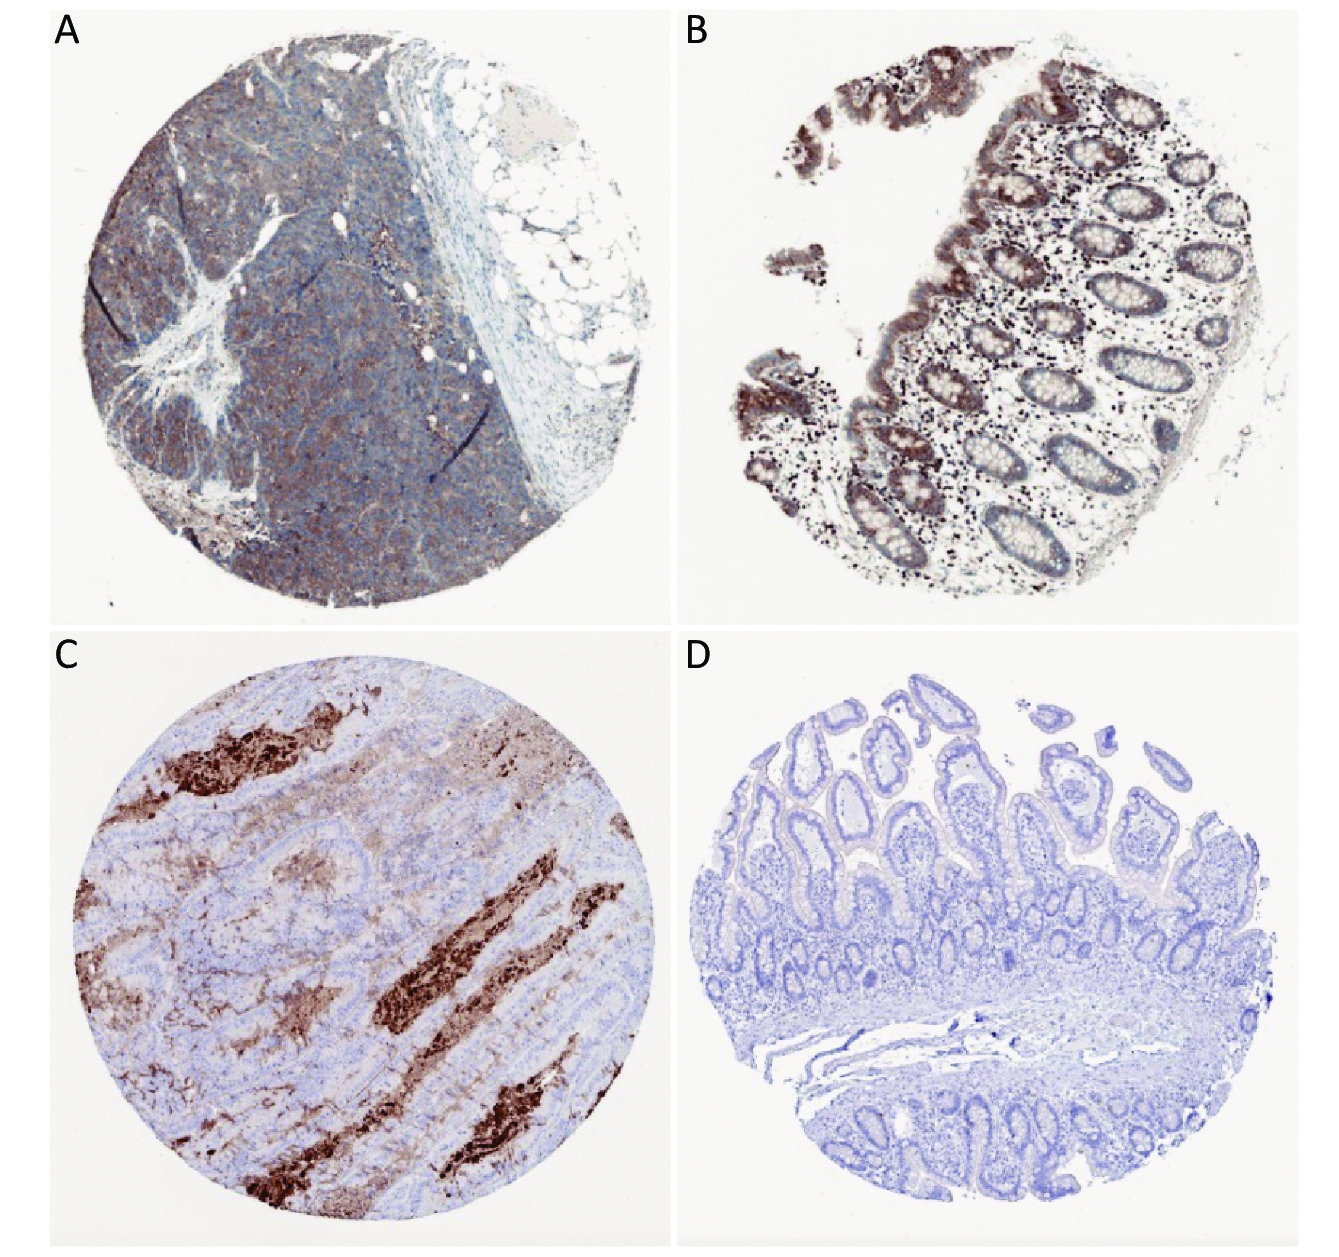
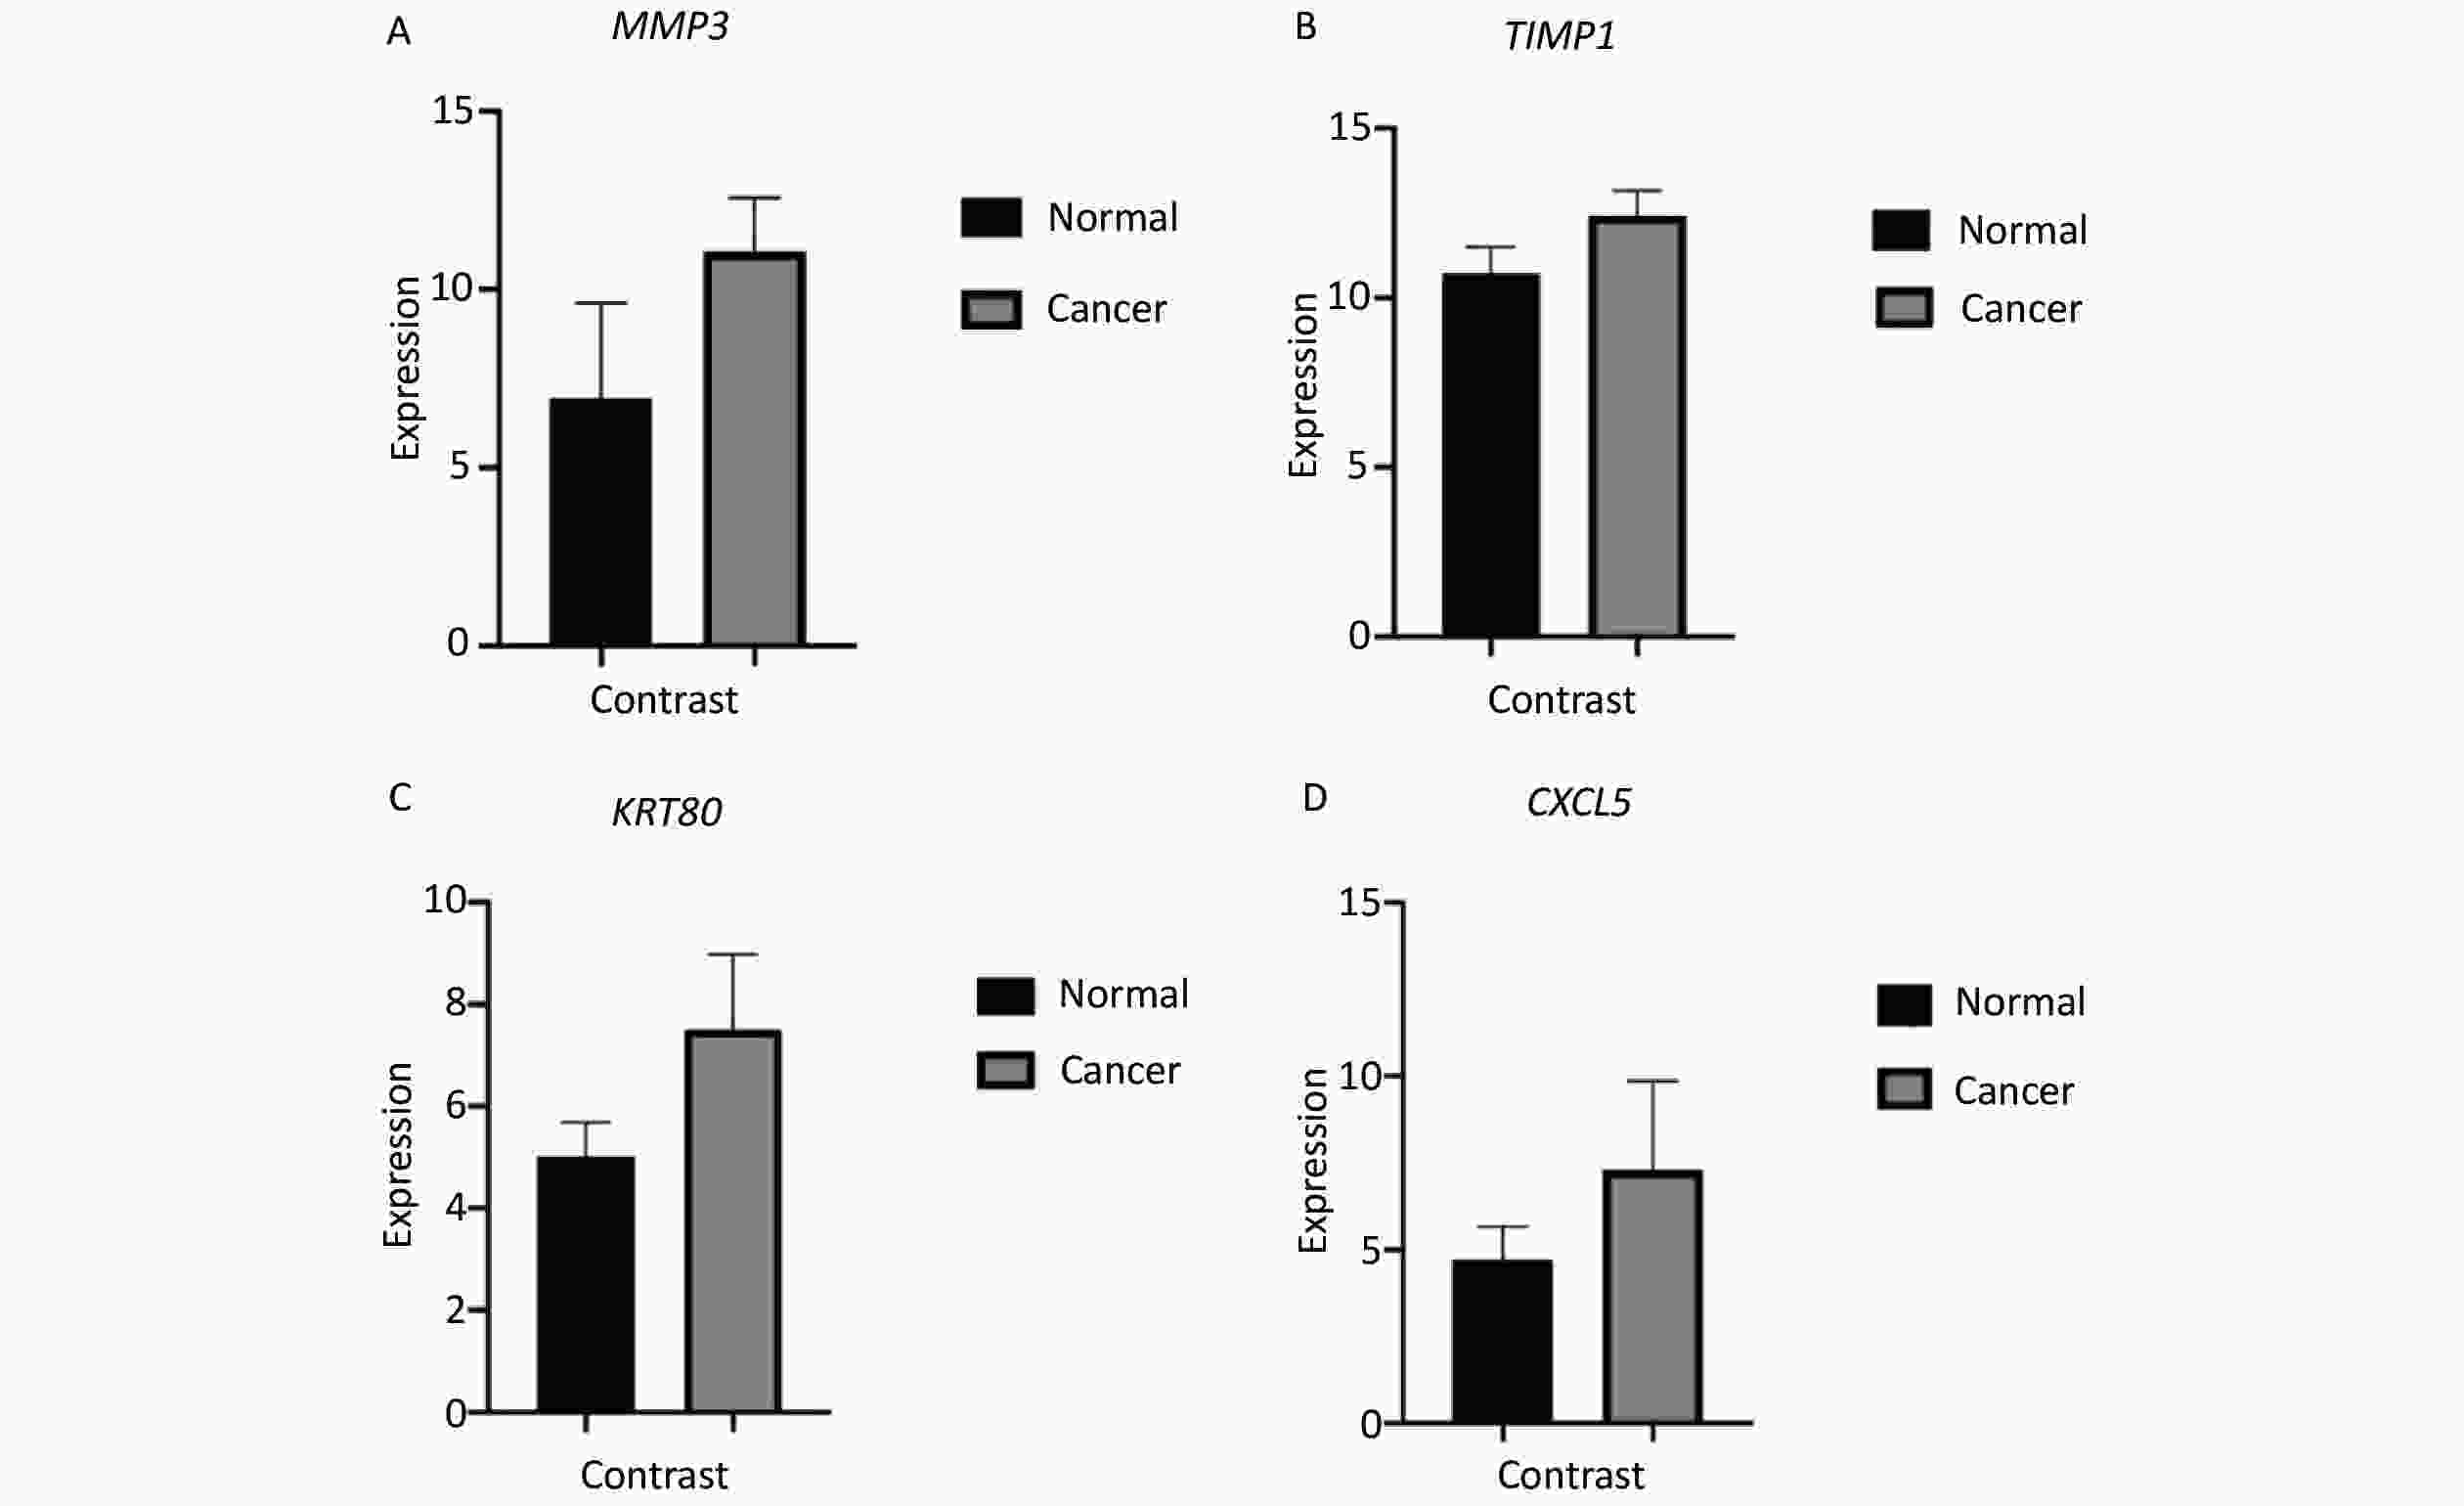
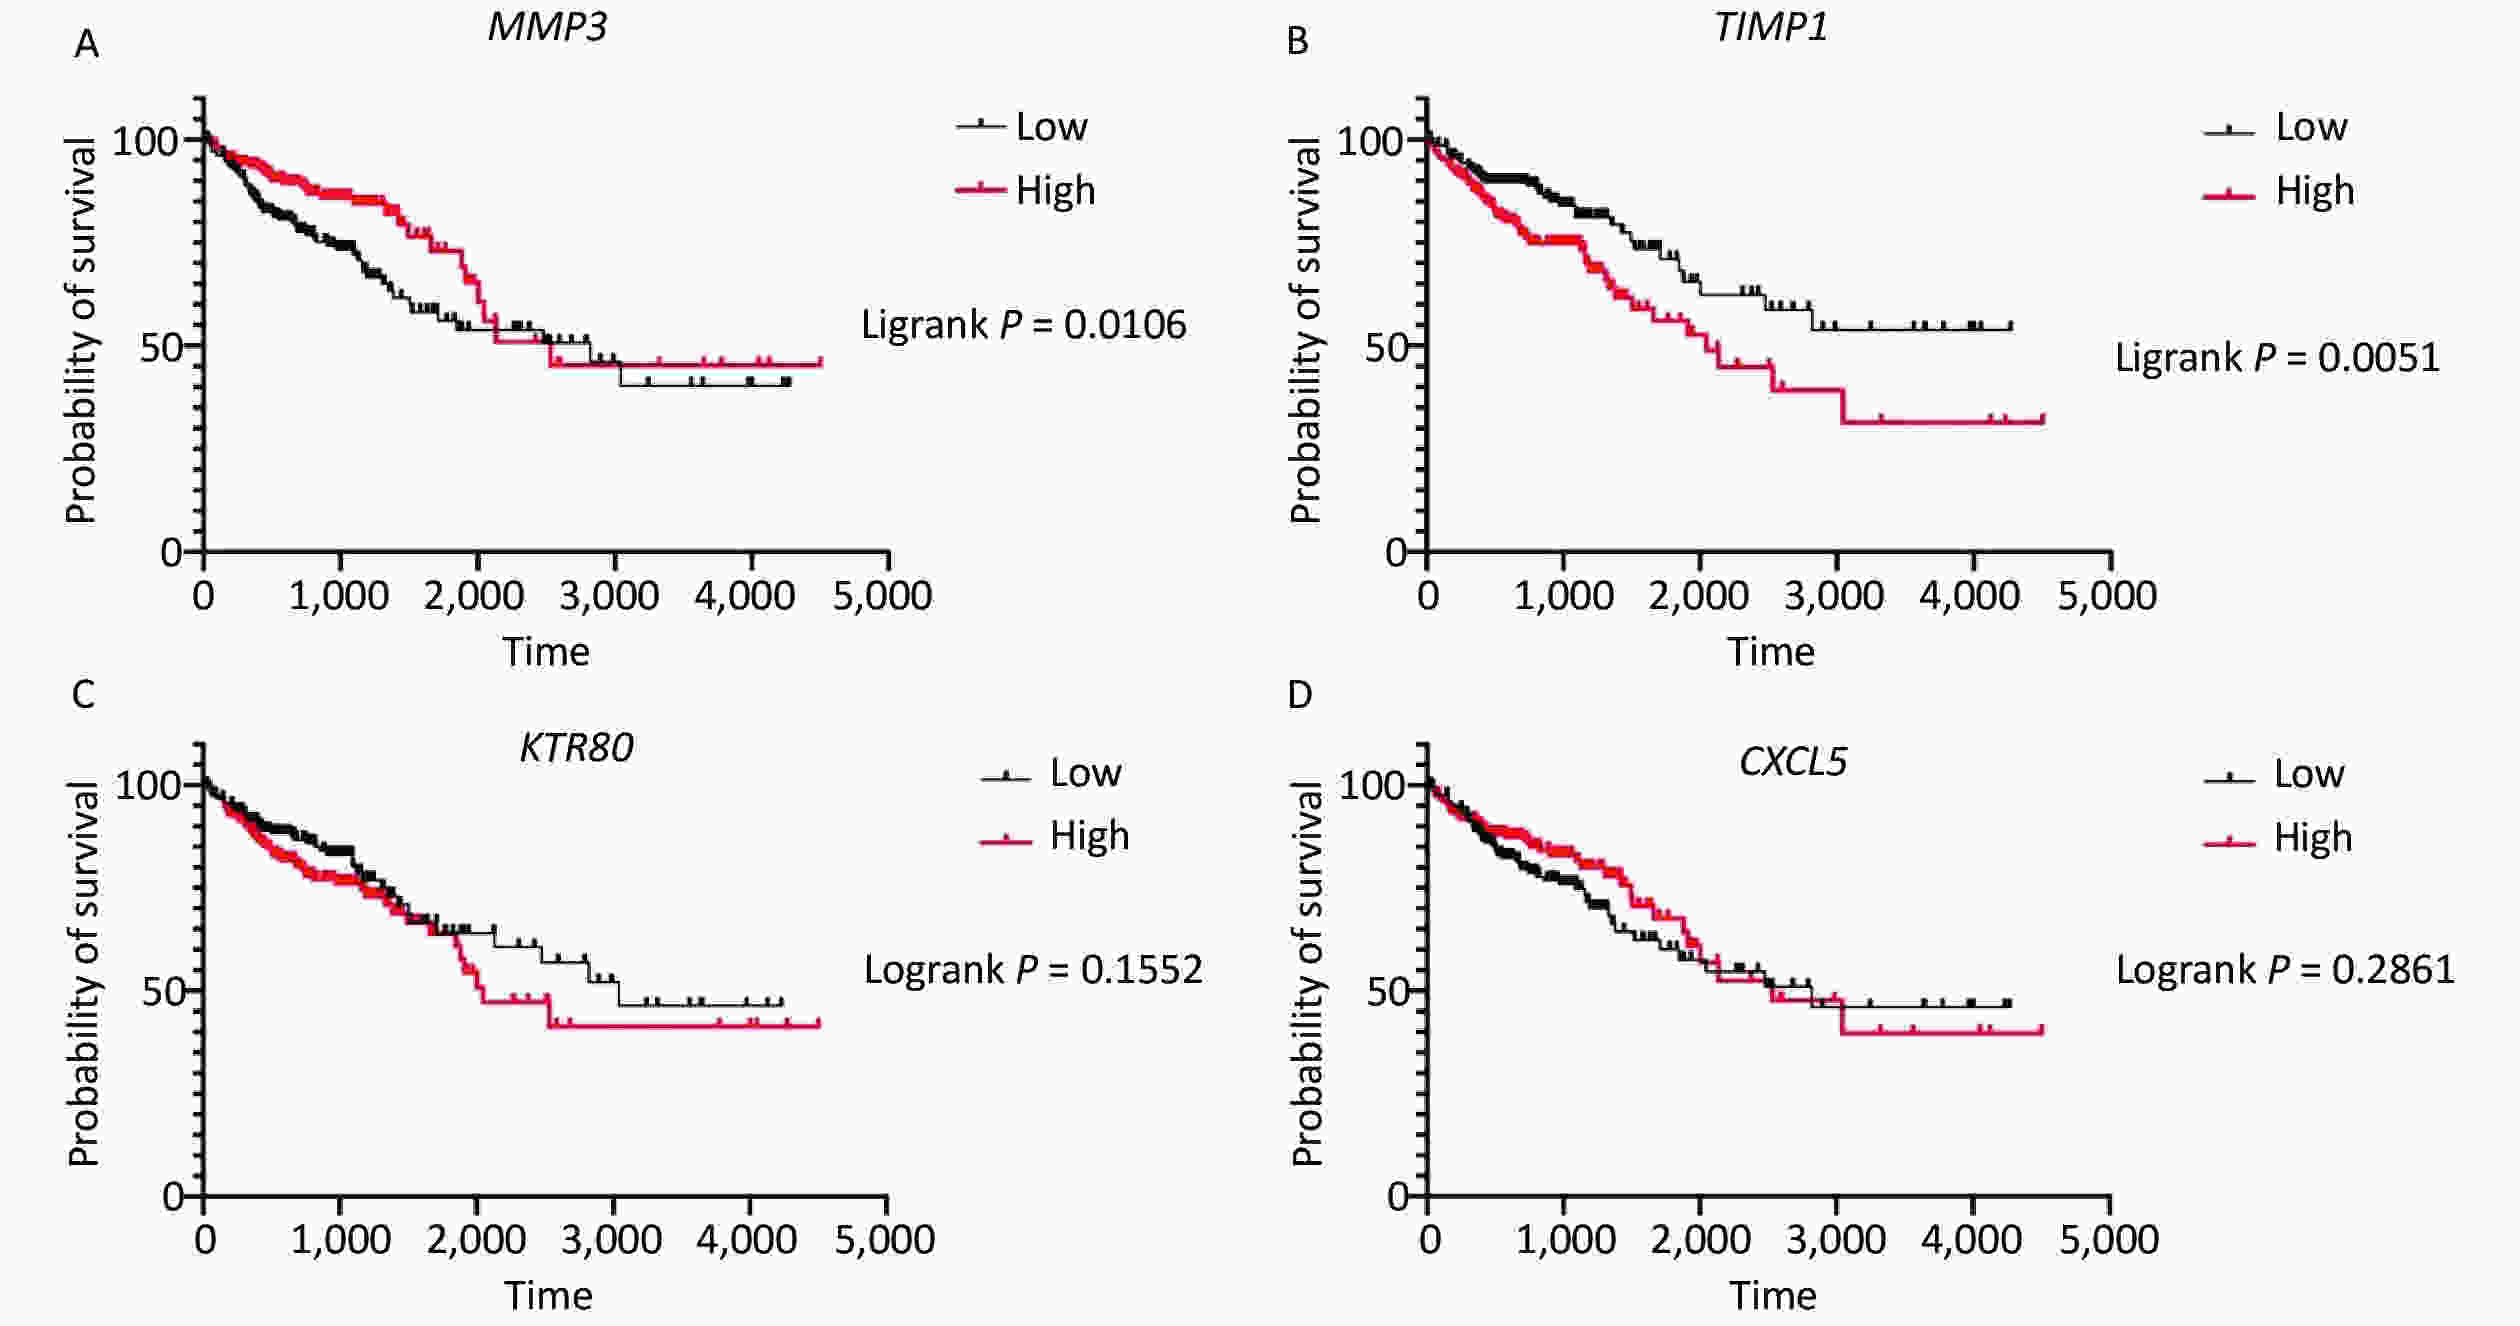
Survival analysis revealed log-rank P values of 0.0106, 0.0051, 0.1552, and 0.2861 for MMP3, TIMP1, KRT80, and CXCL5, respectively (Supplementary Figure S3 available in www.besjournal.com). Therefore, expression of MMP3 and TIMP1 might be closely associated with patient survival. In particular, the MMP3 gene is important for collagen degradation, extracellular matrix (ECM) structure, wound repair, and tissue remodeling. It is closely related to cancer occurrence and cancer cell migration. The TIMP1 protein is an inhibitor of matrix metallopeptidase and has a negative relationship with MMP3. Immunohistochemical examinations of pathological and normal tissues revealed less frequent gene expression of TIMP1, while MMP3 gene expression in CRC tissues was comparatively increased. The findings were consistent with the analysis results from the GEO and TCGA databases (Supplementary Figure S4 available in www.besjournal.com). Thus, MMP3 was implicated as being functionally important in the development of CRC.
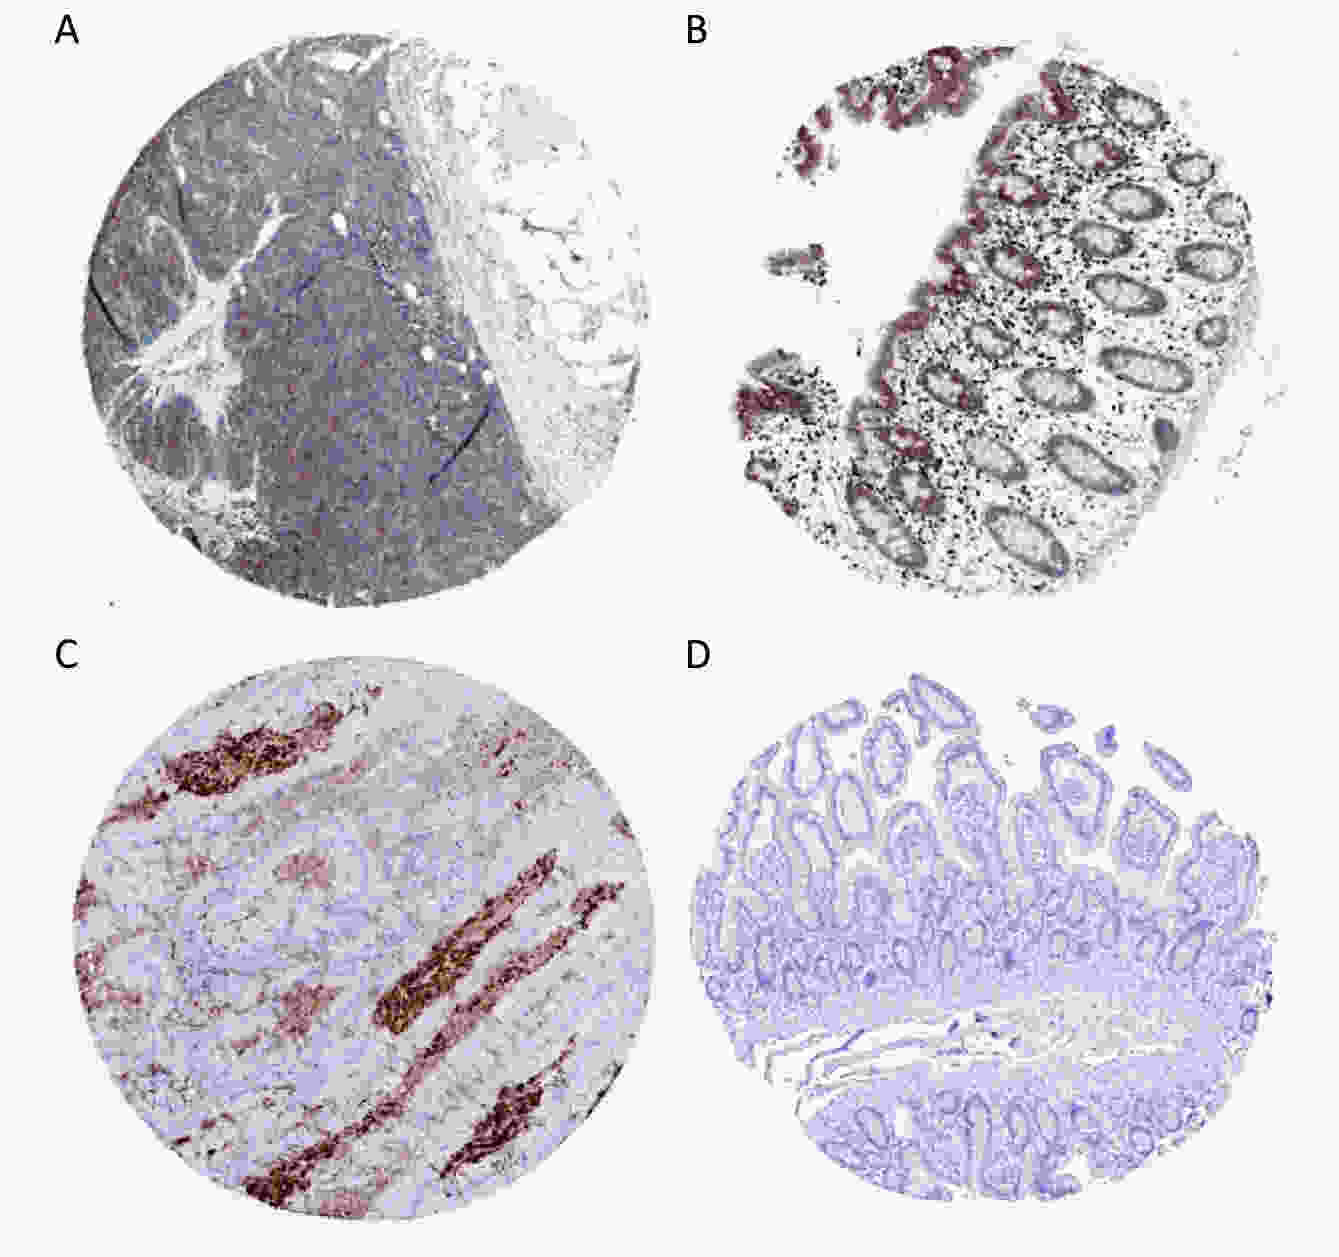
Figure S4. Expression of curve of gene MMP3 (A), TIMP1 (B), KRT80 (C), CXCL5 (D) in colorectal cancer tissue (with scalar 200 μm).
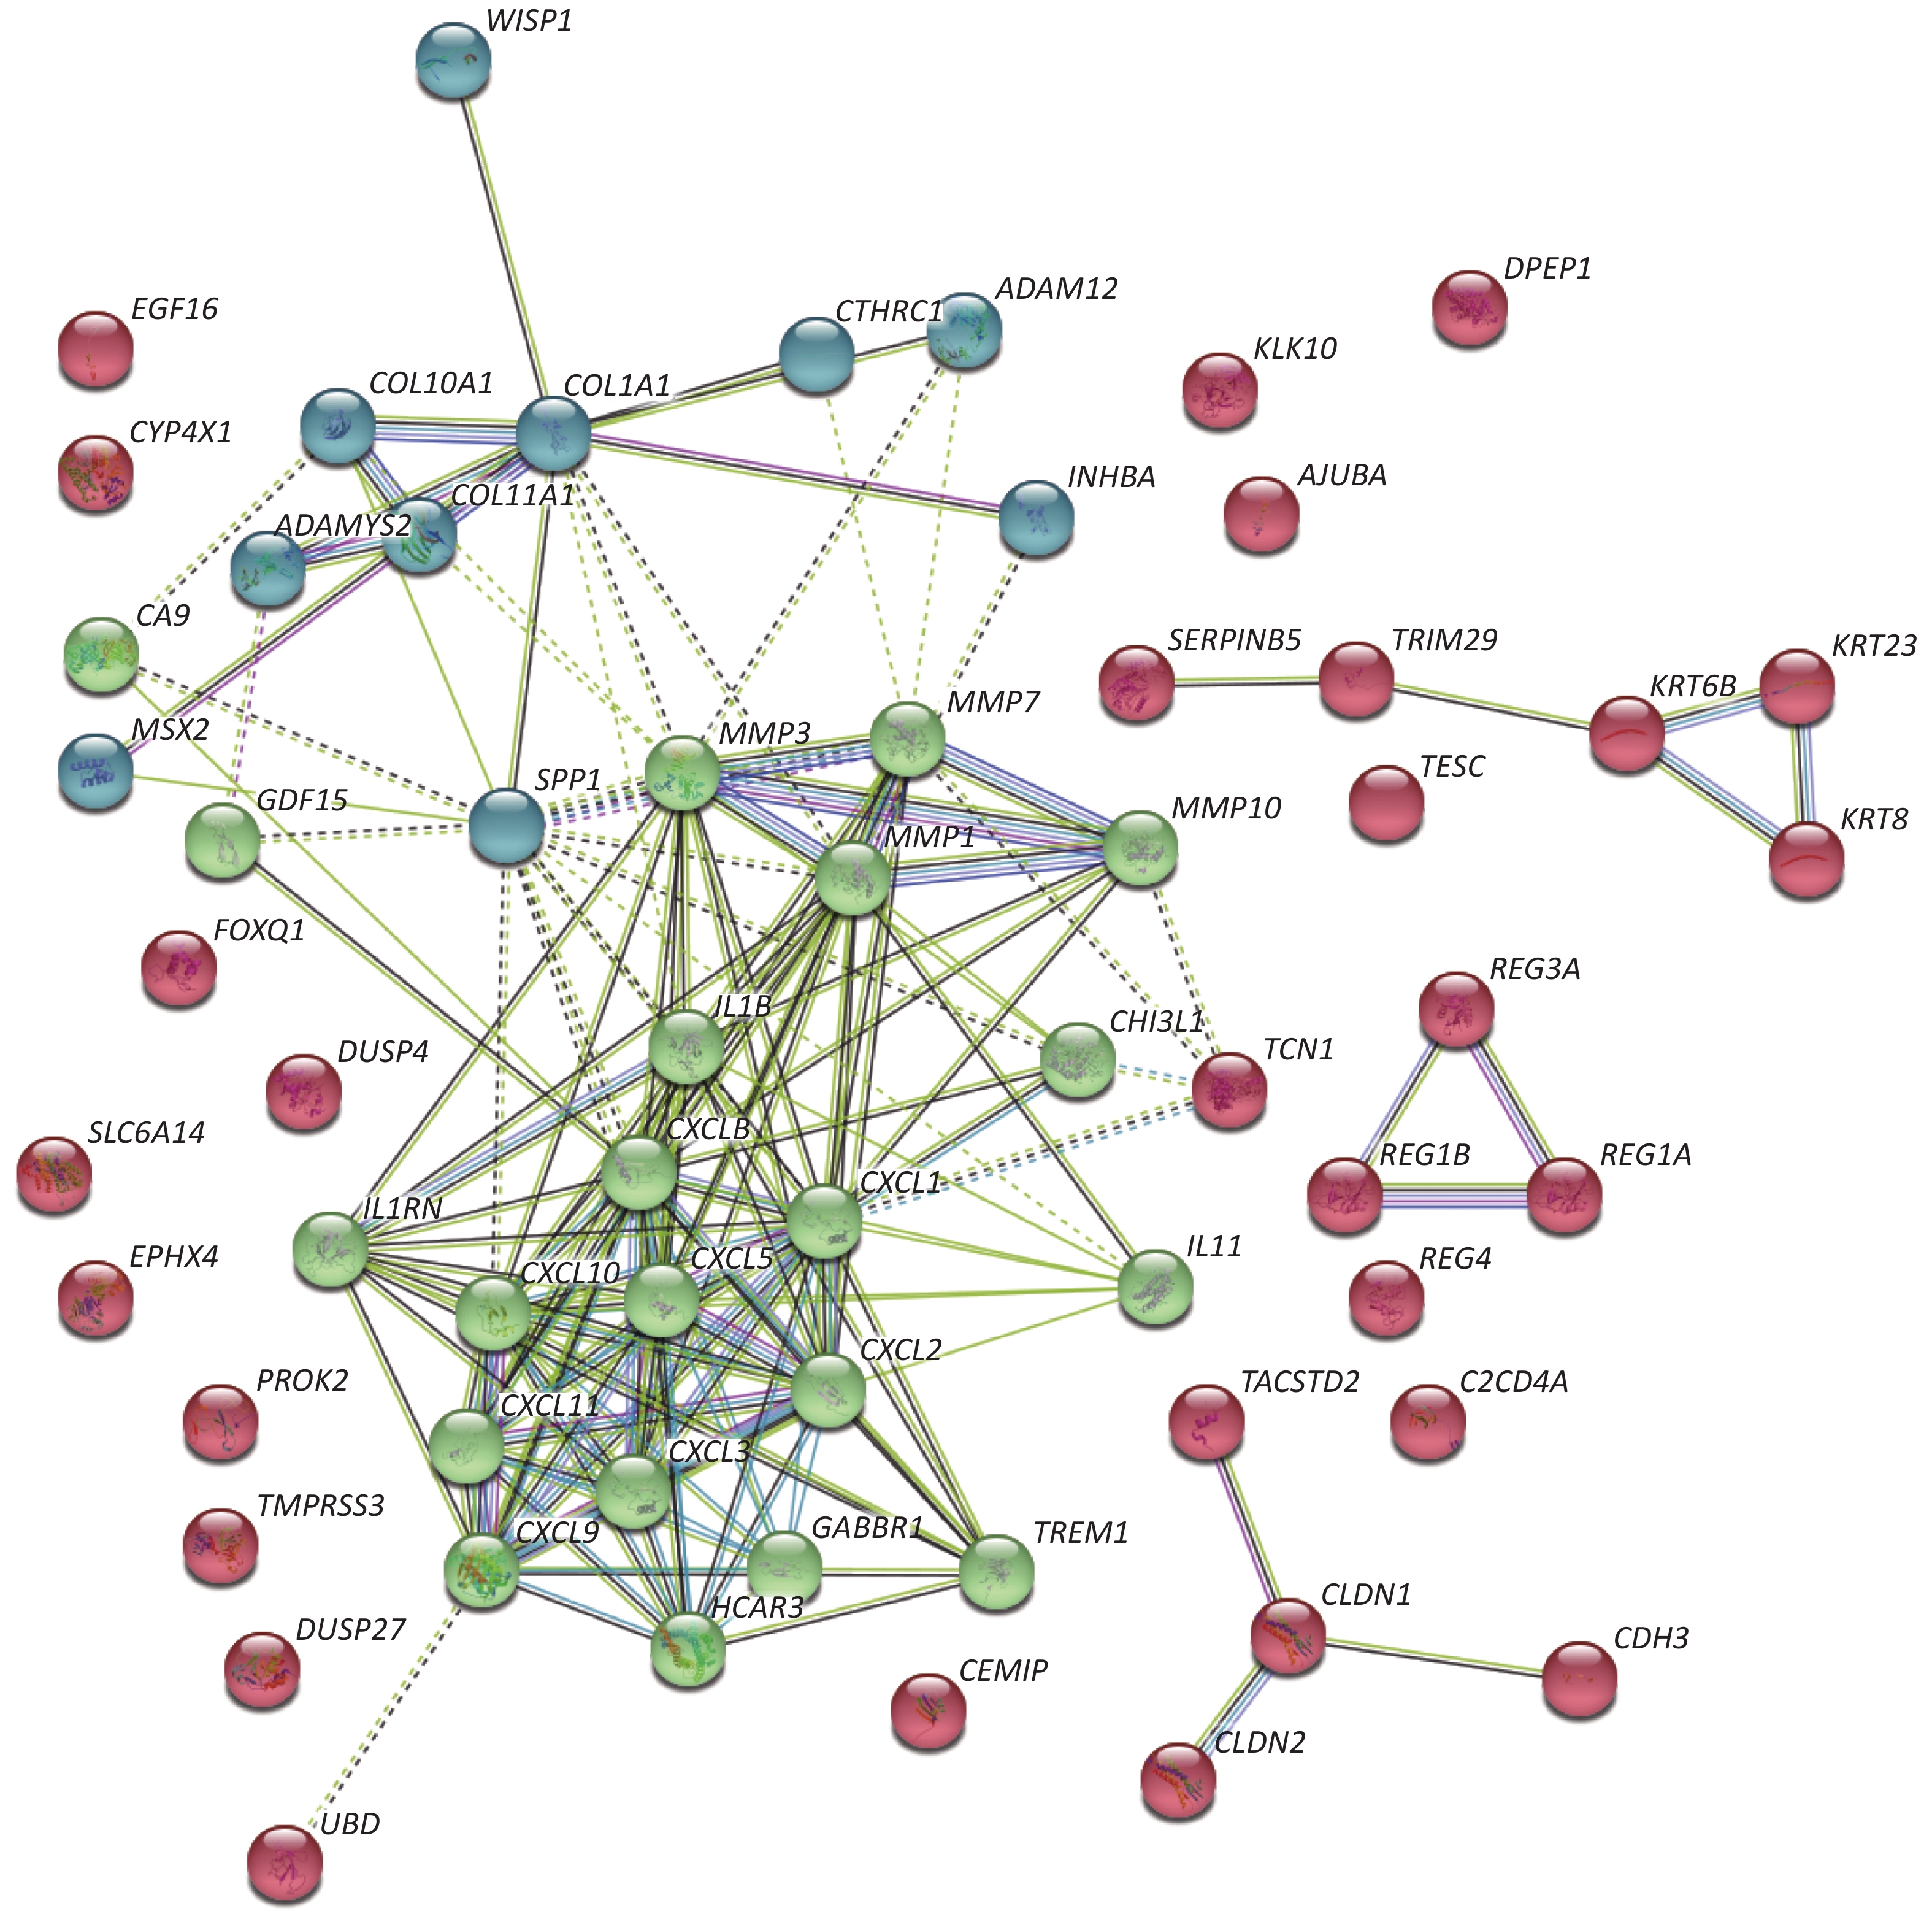
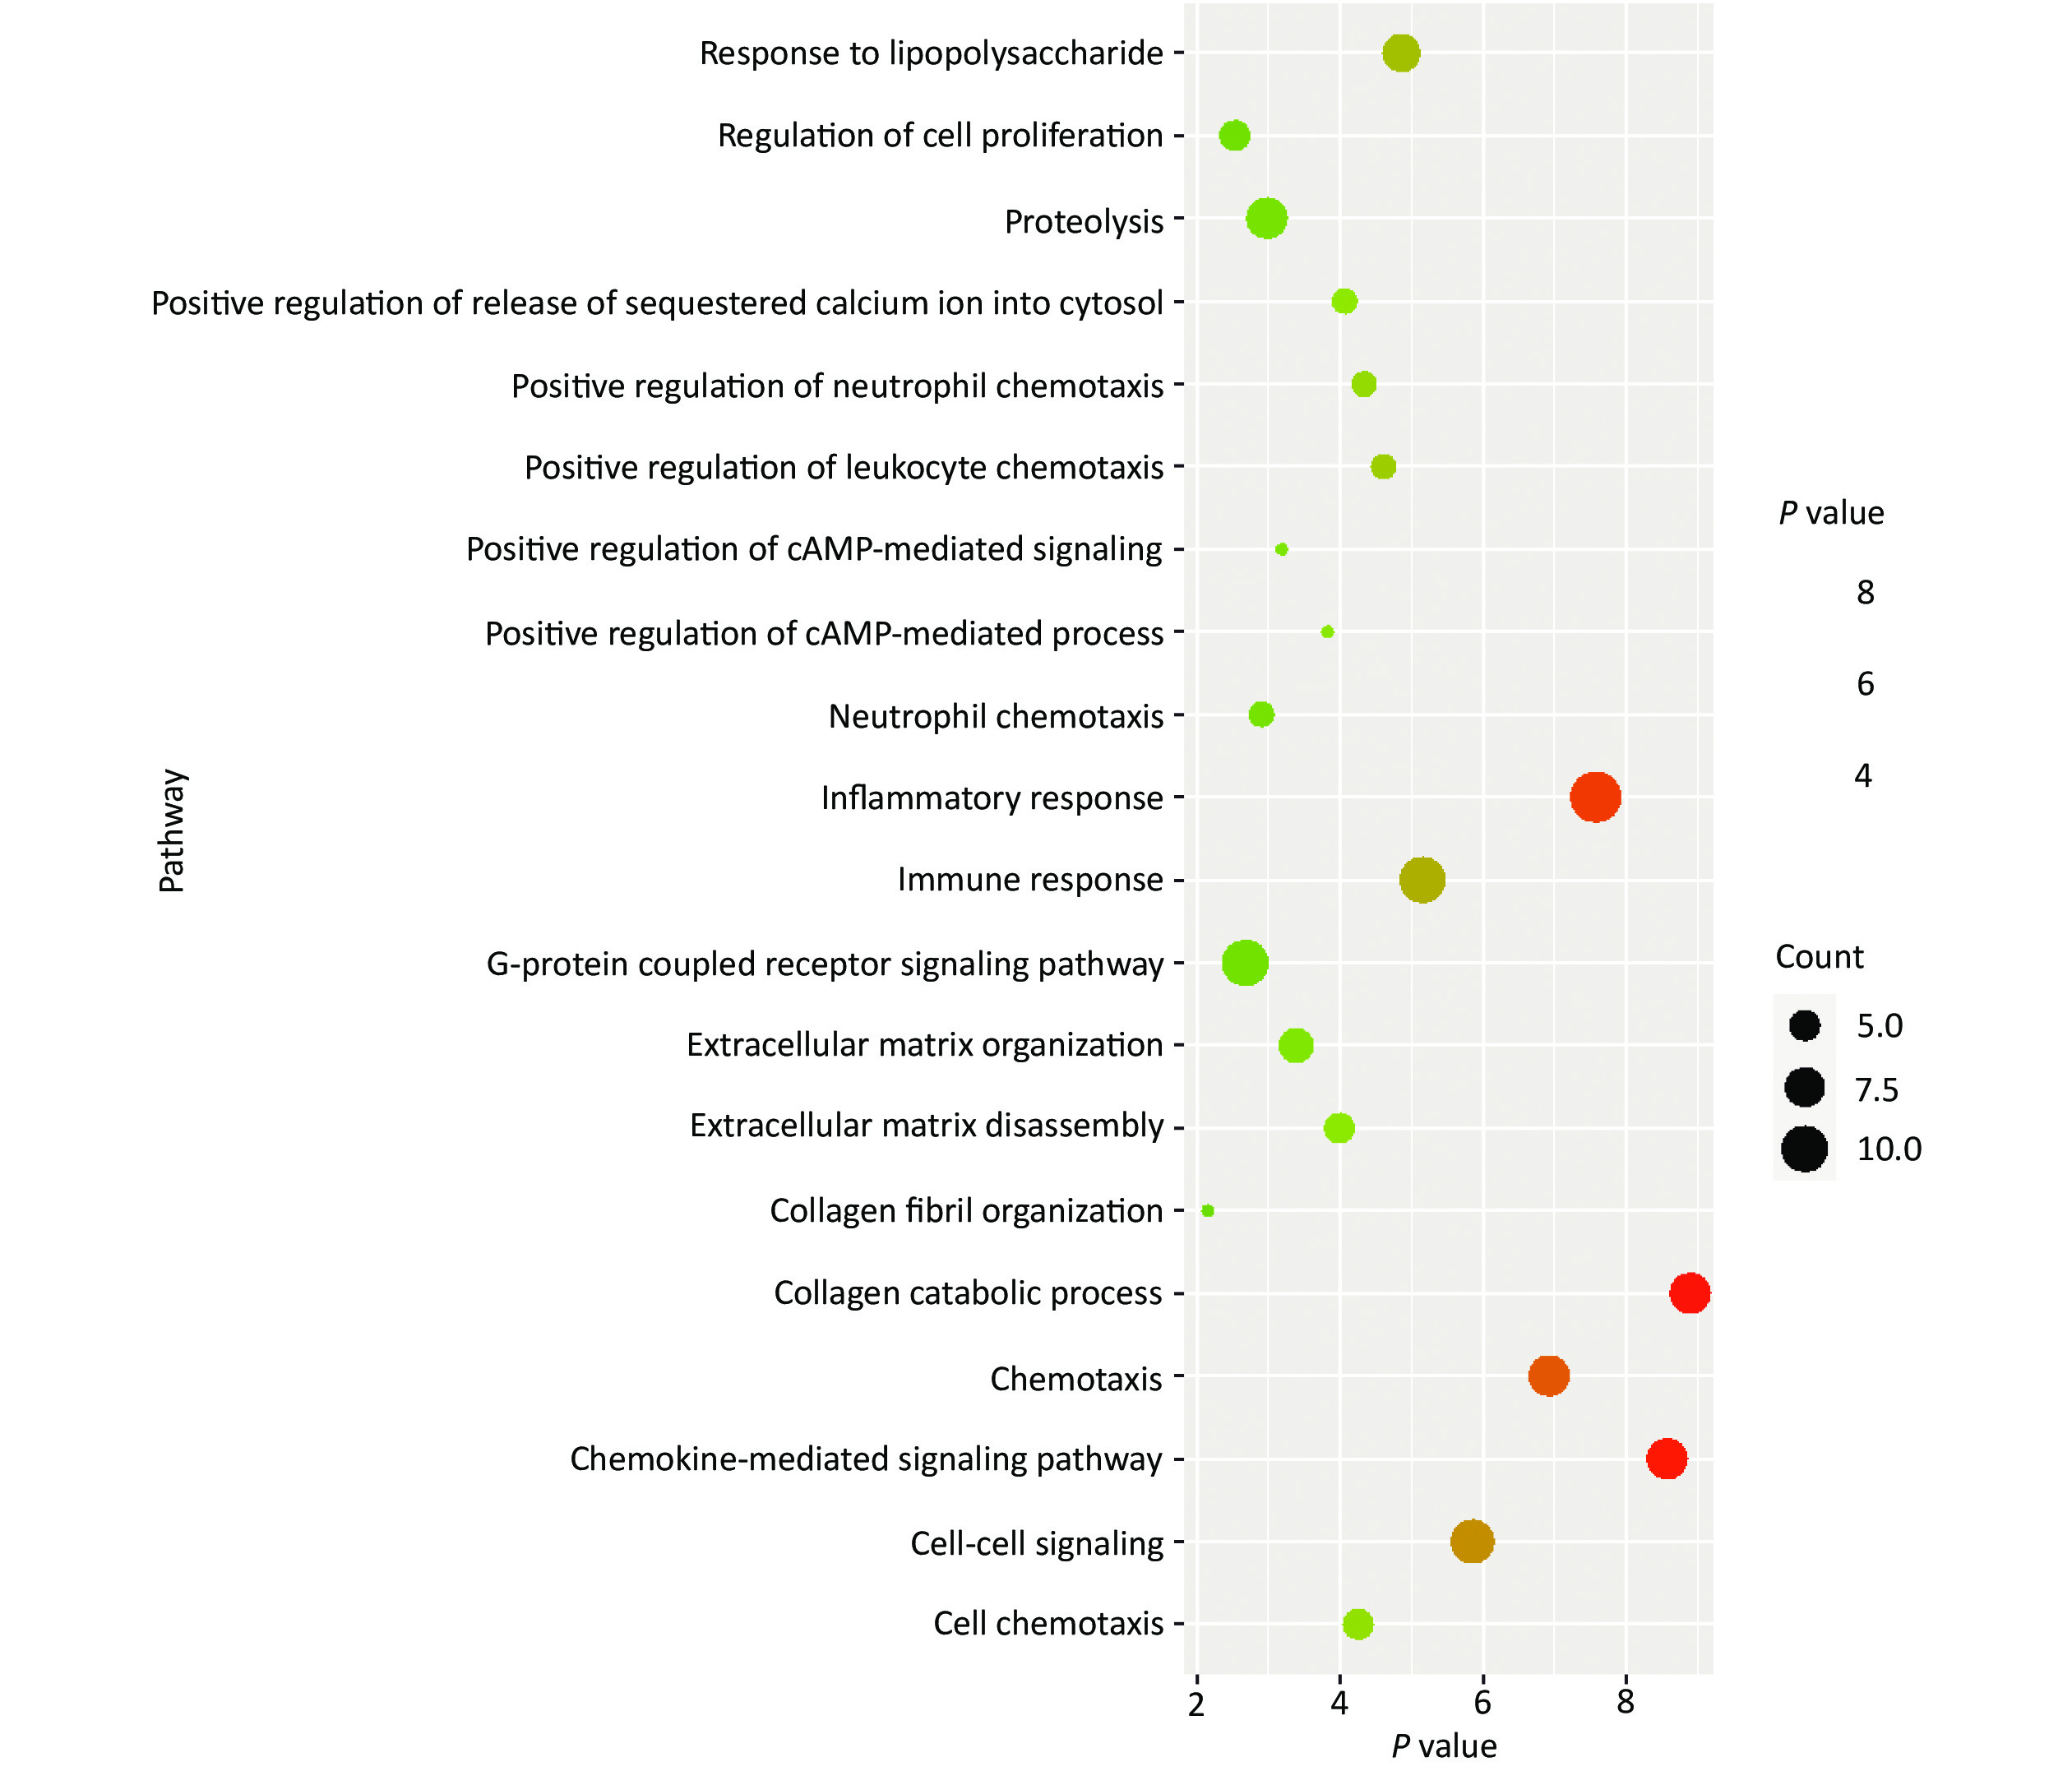
Concerning DEGs, 71 markedly over-expressed genes were selected for enrichment analysis using the parameters of logFC > 2 and P < 0.05. PPI network and pathway enrichment were performed using the STRING website (Figure 2)[4]. Processes related to chemokine receptors CXCL1, CXCL5, and CXCL11, and the function of ECM related to matrix metalloproteinase (MMPs) were relatively concentrated from PPI network. In addition, the MMP1, MMP3, MMP7, and MMP10 were located in the kernel of the PPI network, and so may be influential on the development of CRC. We also imported 71 markedly over-expressed genes into the DAVID website for enrichment analysis. The genes included those associated with important signaling pathways of biological process, molecular functions, and cellular components. The results were analyzed and visualized with R language software (Figure 3)[5].
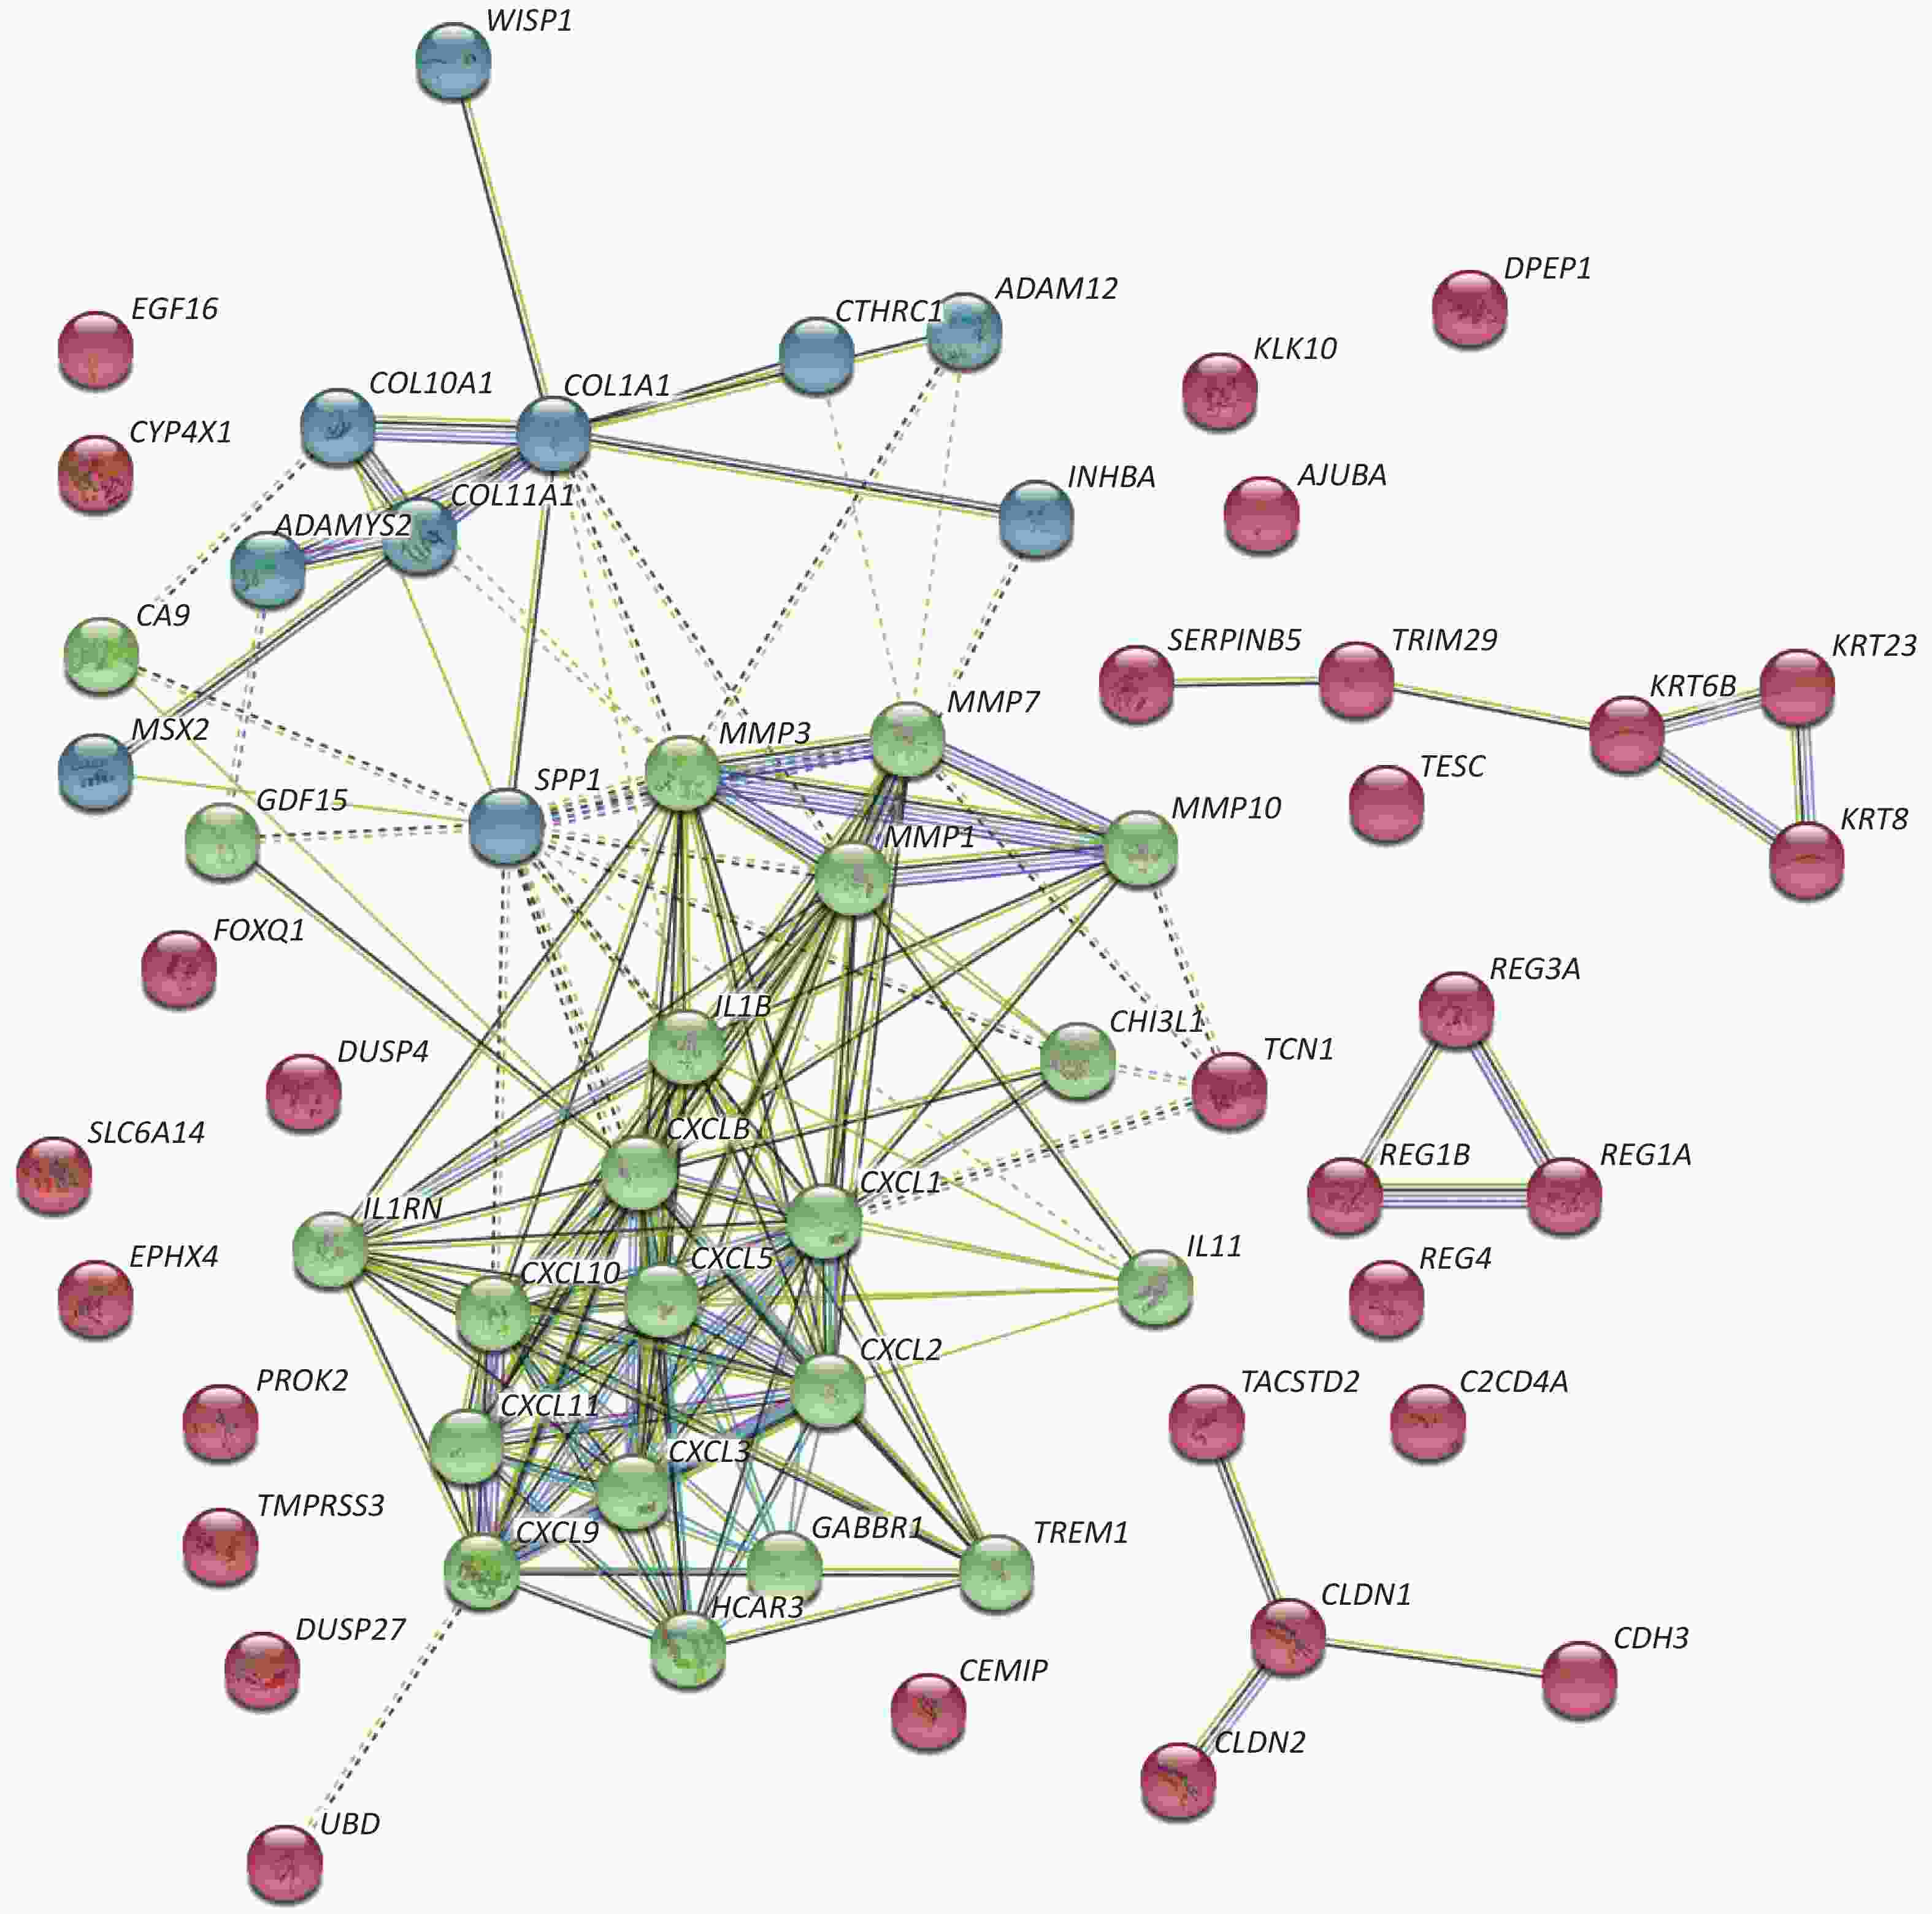
Figure 2. PPI network of highly expressed genes. Seventy-one markedly over-expressed genes from GEO database were imported and analyzed through the STRING website. The results show that chemokines and matrix metallopeptidases are most concentrated and associated with each other. These two clusters of genes are in the kernel of the PPI network with multiple relations with other genes.
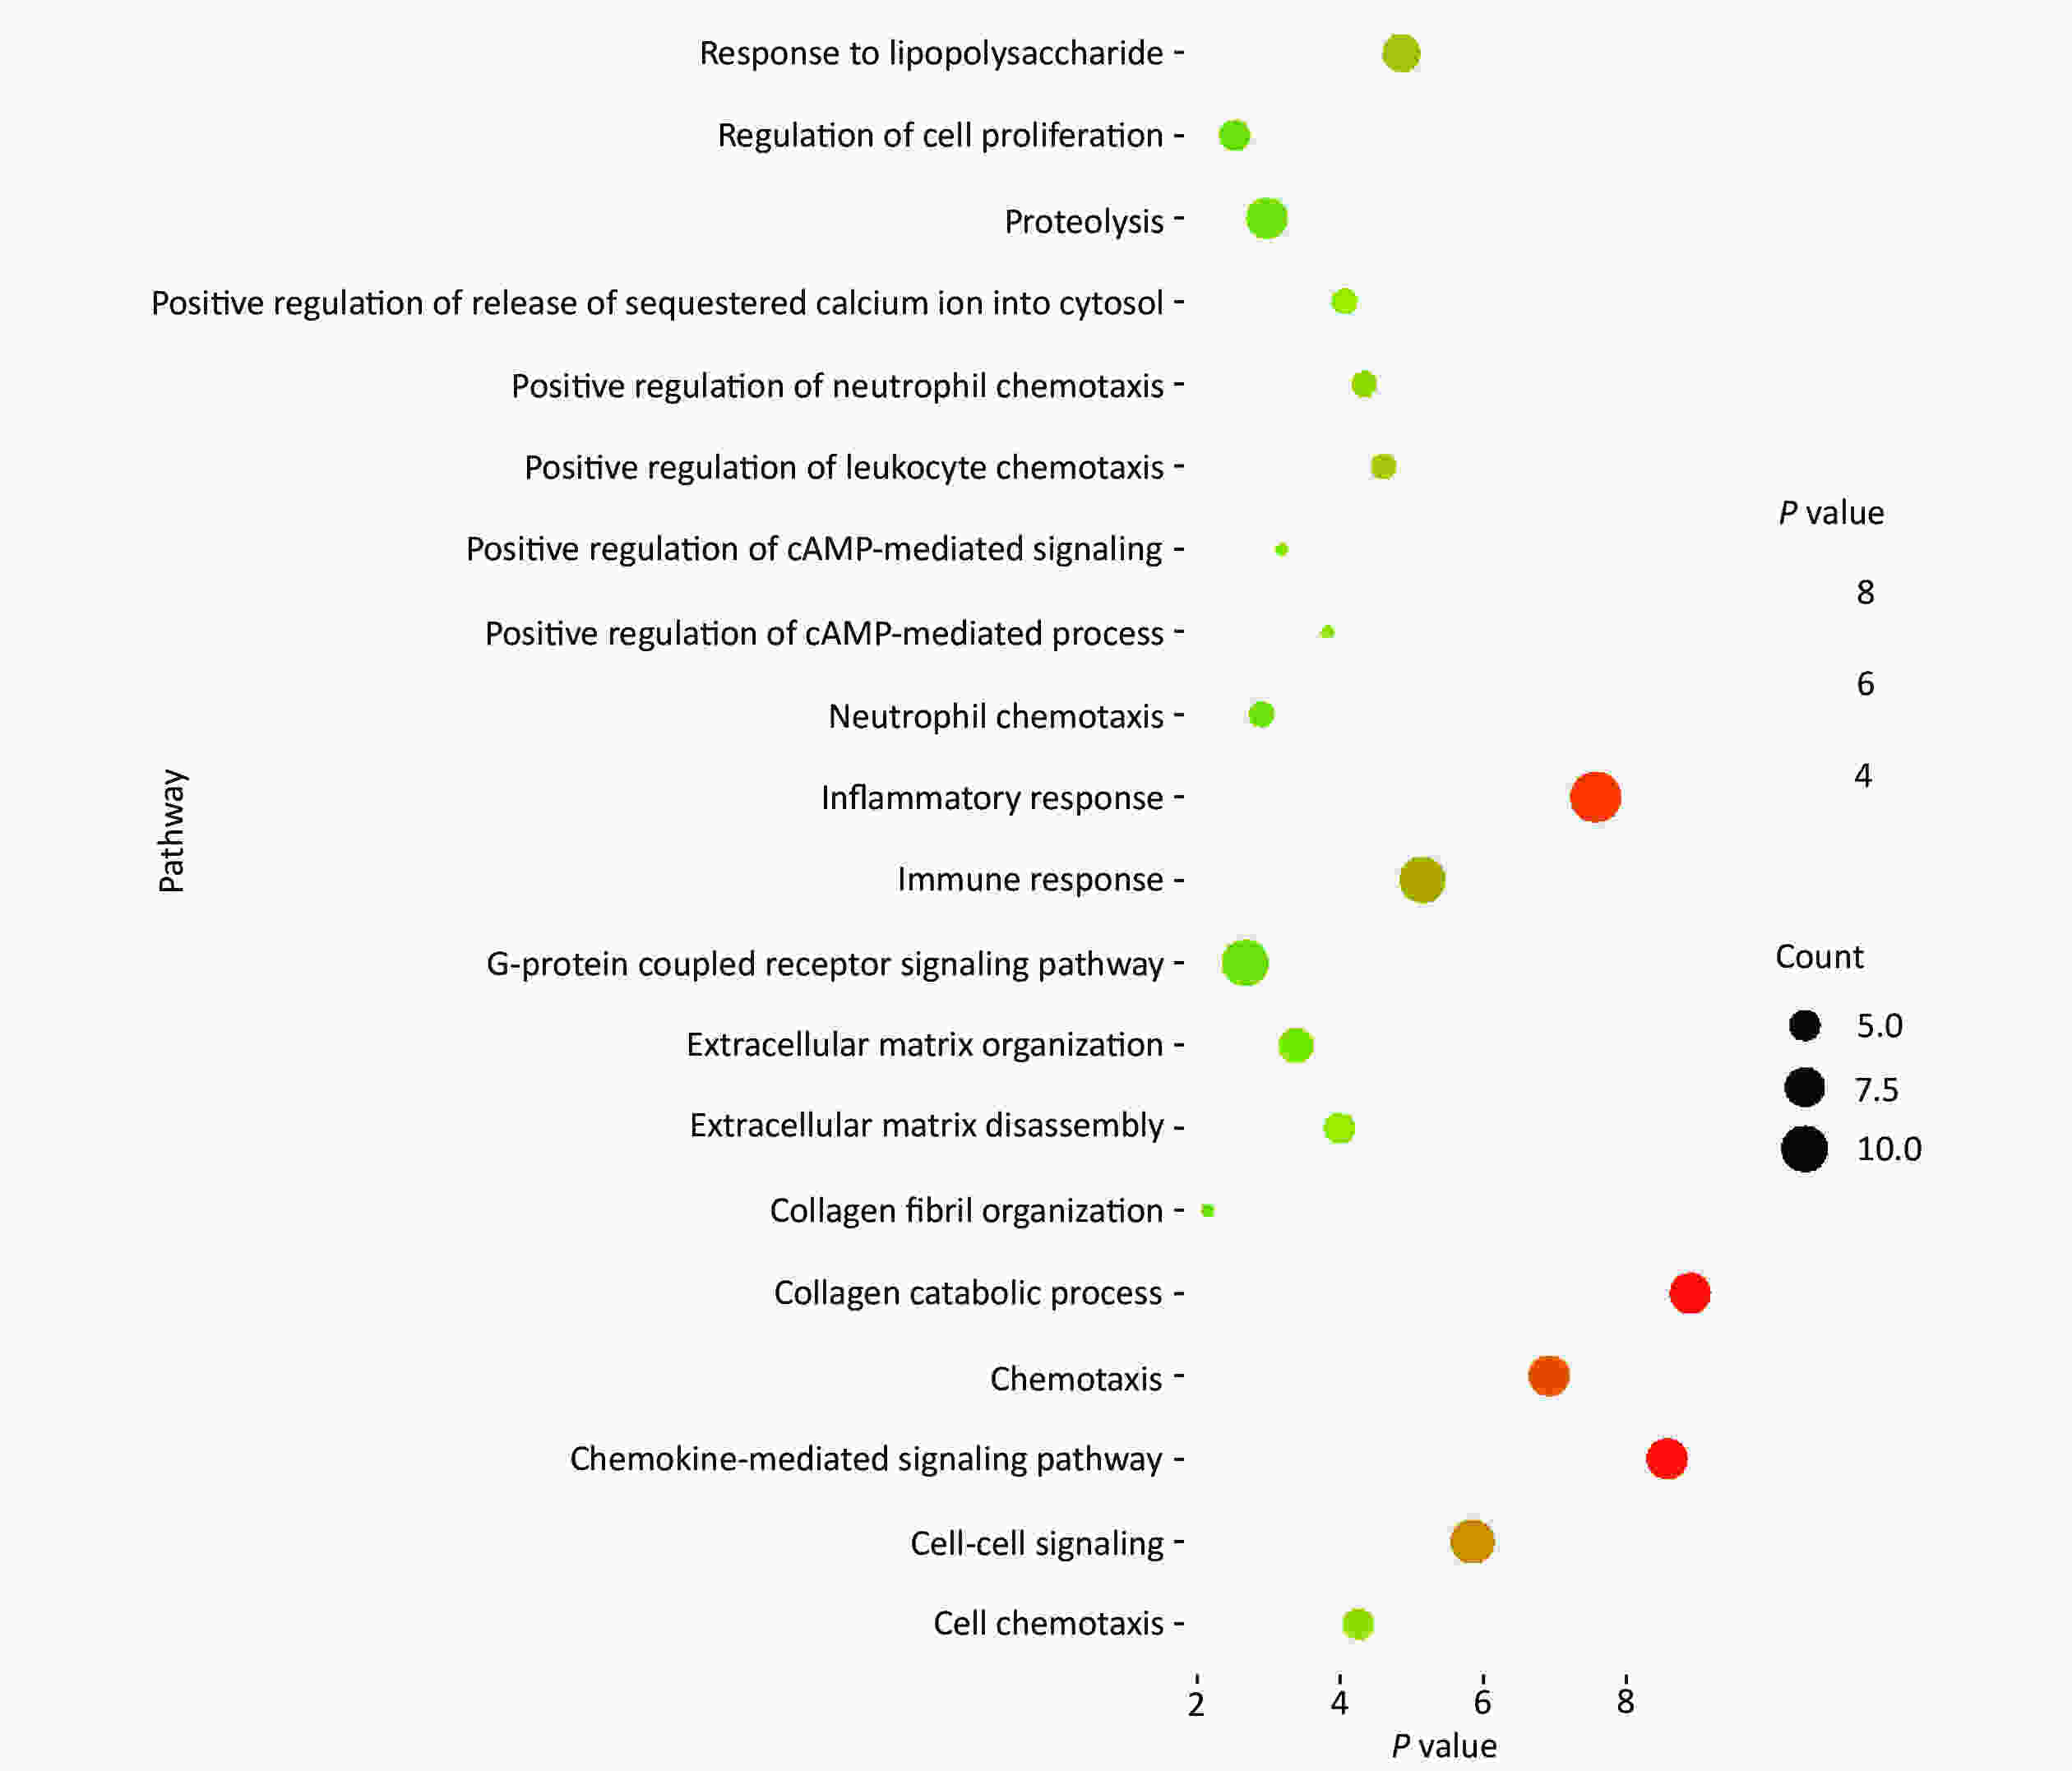
Figure 3. Enrichment analysis of highly expressed genes. Seventy-one markedly over-expressed genes were input into the DAVID website for enrichment analysis. The result was visualized with R language software. The size of each dot depends on the enrichment of each pathway. The color for each dot is in accordance with the value of –log10 (P value) for each pathway.
Generally, the processes of inflammatory response, immune response, collagen catabolic process, chemokine-mediated signaling pathway, cell-cell signaling, and chemotaxis were more concentrated in the enrichment analysis. In addition, the enrichment analysis revealed the association of the processes of extracellular matrix organization, extracellular matrix disassembly, and collagen fibril organization with the MMP3 gene according to a previous survey from the Genecards website. As reported, MMPs has appreciable impacts on collagen degradation, maintenance of the structure of the extracellular matrix, tissue remodeling, wound healing, and cancer migration, which may play a significant role in the development of colorectal cancer according to PPI network and enrichment analysis[6].
The MMP family of proteins are involved in the breakdown of the extracellular matrix during disease processes, such as arthritis and cancer metastasis[7]. MMP3 is a zinc-dependent endopeptidase that can degrade several extracellular components and molecules, including transferrin, laminin, collagen, and chondroitin. The extracellular matrix is mainly composed of collagen, elastin, proteoglycans, and aminoglycans[8]. Tumor invasion that breaches the extracellular matrix barrier is a critical event in metastasis. MMP3 expresses a MMP capable of degrading collagen, which is the main structure of the extracellular matrix. This degradation could destroy the structure and function of the extracellular matrix. This might cause the loss of fixed dependence of tumor cells and may have an important relationship with epithelial cancer and cancer cell migration.
This study mainly explored DEGs using the GSE110224 and GSE126092 gene chips. Parameters of logFC > 2 and P < 0.02 identified the MMP3, TIMP1, KRT80, and CXCL5 genes for further analysis. Survival and ROC curves revealed that these genes were important for the accurate diagnosis of CRC. The expression levels of MMP3 and TIMP1 in CRC were verified using the Human Protein Atlas website. Immunohistochemical analyses of MMP3 and TIMP1 demonstrated the over-expression of MMP3 in several types of cancer. Enrichment analysis of significantly over-expressed genes revealed several signaling pathways involved in the development of CRC. The pathways included skin development, extracellular matrix complexes, and degradation of collagen. Further examinations indicated the importance of MMP3 for the degradation of collagen, which is a main component of extracellular matrix complexes. Therefore, the destruction of these complexes may have a great impact on the maintenance of cell morphology, tissue remodeling, and cancer cell migration. The extracellular matrix is important to maintain cell morphology and function. High expression of the MMP3 gene and the subsequent degradation of collagen, destroys the structure of the extracellular matrix. This destruction has an important impact on the occurrence of CRC and cell migration. Enrichment and survival analyses revealed that MMP3 may be crucial for the development of CRC and migration promoted by the degradation of collagen.
Potential Function of MMP3 Gene in Degradation of Extracellular Matrix Complex in Colorectal Carcinoma
doi: 10.3967/bes2021.009
- Received Date: 2020-04-24
- Accepted Date: 2020-09-09
| Citation: | DAI Xiao Yong, SONG An Yi, MU Lan, WANG Li Jun, HUANG Lai Qiang. Potential Function of MMP3 Gene in Degradation of Extracellular Matrix Complex in Colorectal Carcinoma[J]. Biomedical and Environmental Sciences, 2021, 34(1): 66-70. doi: 10.3967/bes2021.009 |







 Quick Links
 DownLoad:
