


-
According to the World Health Organization[1], cardiovascular diseases (CVDs) caused 17.9 million deaths worldwide in 2016, accounting for 44% of all noncommunicable disease (NCD) deaths and 31% all-cause deaths. Over three-quarters of CVD deaths occurred in low-and-middle-income countries[2]. More than one-fourth of Chinese adults have hypertension, and the prevalence has increased significantly during the recent decades[3]. CVDs remain the leading cause of deaths and disability-adjusted life-years (DALYs) globally[4, 5]. Moreover, numerous studies have shown that elevated blood pressure (BP) is an independent risk factor for CVDs[6-9]. However, the causes of elevated BP have been inconclusive[1].
Previous epidemiological studies have shown that outdoor temperature has an adverse effect on BP[10-20]. The majority of studies found an inverse linear relationship of outdoor temperature with BP in the general population[10-13, 21] and in patients with CVDs[14-16, 22] and diabetes[17, 18]. Radin et al.[10] reported that mean outdoor temperature was inversely correlated with both systolic (r = −0.69) and diastolic (r = −0.71) BPs in six US cities. Yang et al.[16] reported that above 5 ℃, a 10 ℃ decrease in outdoor temperature was associated with a 6.2 mmHg increase in systolic BP among individuals with CVDs in China. However, one study found a U-shaped relationship with the thresholds ranging from 22 ℃ to 28 ℃ in Chinese adults[19]. Another study from the Netherlands found a curved negative association between mean daily temperature and BP[20]. Moreover, a study from Brazil did not find a significant association between the seasonal temperature variation and BP in 902 patients[23]. These results indicate that the association between outdoor temperature and BP remains inconsistent.
Previous studies also have revealed a seasonal fluctuation of BP[13, 24]; generally, BP levels are higher in winter and lower in summer. However, only two studies[11, 25] have examined potential interactions between season and temperature on BP and have reached inconsistent results. In addition, several studies suggested a lag effect of outdoor temperature on BP[14, 18, 25, 26]. None of these studies, however, have reported a lag effect of temperature on BP by the four seasons. In light of the inconsistent results between temperature and BP and the paucity of the studies investigating temperature-season interactions in relation to BP, we analyzed data from a large population cohort in Jinchang, located at a high-altitude area in northwest China, to address the relationship between outdoor temperature and BP.
-
The study population was from an ongoing prospective population-based cohort study in Jinchang, China[27]. From August 2011 to November 2015, a total of 33,355 individuals participated in both baseline and follow-up surveys. In this cohort, the follow-up was based on a health examination every two years. During each survey, physical examinations, in-person interviews, laboratory tests, and biosample collections were conducted. We excluded 645 participants due to the lack of information on BP or weight and height. A total of 32,710 participants were included in our final analysis.
A standardized and structured questionnaire was administered to collect information on demographics (including age, sex, education level, and marital status), occupation, smoking, and alcohol consumption. Smoking was categorized into current, former, or non-smokers. People who smoked at least one cigarette per day over the past six months were defined as current smokers, those who used to be a smoker and had stopped smoking for more than six months were defined as former smokers, and the remaining individuals were defined as non-smokers. Current drinkers were those who drank hard liquor, beer, or wine at least once per week during the past six months. Former drinkers were those who used to be a drinker and had stopped drinking for more than six months. Non-drinkers were those who consistently drank less than once per week or not at all. All participants were asked whether they had been diagnosed with any chronic diseases in the secondary or tertiary level hospitals. If so, the age at first diagnosis and whether they were still on treatment were also recorded.
-
BP was measured at least twice using an automatic blood pressure monitor (BP705, AMPall Co., Ltd, Seoul, Korea) during each survey. All participants were asked to remain in a calm and stable state and keep a seated position to measure BP. If the difference between two measurements was greater than 10 mmHg, a physician measured BP using a mercury sphygmomanometer, and the final BP measurements were based on the average of two mercury sphygmomanometers. The averages of the two repetitive measurements were used in this study. An automatic recording instrument (SK-X80/TCS-160D-W/H, Sonka, Shenzhen, China) was used to measure weight and height.
-
Daily meteorological data during the study period, including daily average temperature, relative humidity, mean wind speed, and atmospheric pressure, were obtained from the Jinchang Meteorological Service. Daily average concentrations of sulfur dioxide (SO2), nitrogen dioxide (NO2), and particulate matter less than 10 μm in aerodynamic diameter (PM10) over the study period were collected from the Jinchang Environmental Monitoring Centre.
-
Descriptive statistics were presented as mean ± standard deviation (SD) or constituent ratio. The mean systolic blood pressure (SBP) and diastolic blood pressure (DBP) were calculated for each calendar month of the study period and plotted against the mean temperature of the same month in five years. We defined the four seasons as spring (from March to May), summer (from June to August), autumn (from September to November), and winter (from December to February). One-way analysis of variance (ANOVA) was used to compare the temperature and BP in different seasons. A t-test and chi-square test were used for comparison of the differences in the basic information between the included and excluded participants. The Spearman correlation was used to analyze the correlation between meteorological factors and air pollutants. Linear mixed-effect models[14, 28] were used to investigate the associations between average outdoor temperature and SBP and DBP. In each model, a random intercept for each subject was introduced to account for the correlation among multiple measurements. All models included fixed effects for gender, age, education, marriage, occupation, body mass index (BMI), smoking and drinking, CVDs, diabetes, weather conditions (atmospheric pressure, relative humidity, and wind), air pollutants (SO2, NO2, and PM10), and season. The interaction term was introduced into the model to analyze the interaction between temperature and season on BP to examine whether the relationships between temperature and BP vary by season. We then conducted the mixed-effect model in each of the four seasons and assessed the statistical significance of temperature effect on BP in each season. The smoothing plots of outdoor temperature against BP in the full year and three seasons were developed using generalized additive mixed models (GAMM), adding penalized spline terms for the random intercept. The above-mentioned confounding variables were all controlled in the model.
Similarly, we examined the potential effect modifications of individual risk factors on the association of BP with temperature. An interaction term between each effect modifier and temperature was added to the mixed-effect model to test the statistical significance of the effect modification. We then conducted a subgroup analysis by age, gender, BMI, smoking, drinking, CVDs, and diabetes. Moreover, we ran a model that adjusted different covariants to examine the potential influence of confounding variables on the association between temperature and BP. We also conducted a sensitivity analysis for the hypertensive patients by applying the mixed-effect model to those with reported hypertension. Considering the potential impact of drug use on BP, a binary variable was created to indicate patients with hypertension whose BP level was below the clinical threshold. In addition, we defined those who did not report hypertension or take an antihypertensive drug but whose BP was higher than 140/90 mmHg (1 mmHg = 0.133 kPa), as detected hypertension, and created a binary variable to control the potential impact in the sensitivity analysis of non-hypertensive individuals.
Delayed effects were investigated with single day lags [lag 0 day (L0) to lag 6 day (L6)] and cumulative lag days [lag 01 day (L01) to lag 06 day (L06)] for outdoor temperature. The lag structures with the largest effect sizes were chosen to visualize the relationships of temperature and BP and conduct the subgroup analysis and sensitivity analysis. The effects were estimated for a 1 ℃ decrease in the average outdoor temperature. All analyses were conducted using R 3.2.3 (The R foundation: Vienna, Austria). The 'lme4' package was used to develop the linear mixed-effect models, and a 'mgcv' package of R was used for the plots.
-
Table 1 shows the characteristics of the study participants at baseline. The mean (SD) SBP and DBP was (123.57 ± 19.77) mmHg and (78.86 ± 12.44) mmHg, respectively. At baseline, the mean average age and BMI was (46.37 ± 12.77) years and (23.55 ± 3.25) kg/m2, respectively. Overall, 60.9% of the participants were men, 86.3% were married, 48.4% received medium-level education, and 58.8% were blue-collar workers. Moreover, nearly 36.6% were current smokers, and 19.0% were current drinkers. Individuals who reported physician-diagnosed CVDs, hypertension, and diabetes accounted for 19.7%, 14.7%, and 4.0% of all participants, respectively.
Variables Baseline, Mean ± SD
or n (%)Systolic blood pressure (mmHg) 123.57 ± 19.77 Diastolic blood pressure (mmHg) 78.86 ± 12.44 Age (years) 46.37 ± 12.77 < 40 9,310 (28.5) 40–60 17,276 (52.8) ≥ 60 6,124 (18.7) Male, n (%) 19,916 (60.9) Married, n (%) 28,222 (86.3) Education level Low (Junior middle school or less) 12,393 (37.9) Medium (Senior higher school or equivalent ) 15,844 (48.4) High (College degree and more) 4,473 (13.7) Occupation Blue-collar worker 19,241 (58.8) Managerial staff 3,457 (10.6) Logistics staff 380 (1.2) Technical staff 1,338 (4.1) Retirees 8,294 (25.4) Body mass index (kg/m2) 23.55 ± 3.25 < 24 18,812 (57.5) 24–28 10,986 (33.6) ≥ 28 2,912 (8.9) Smoking Non-smoker 18,022 (55.1) Current smoker 11,968 (36.6) Former smoker 2,720 (8.3) Drinking Non-drinker 25,210 (77.1) Current drinker 6,215 (19.0) Former drinker 1,285 (3.9) Cardiovascular disease 6,442 (19.7) Hypertension 4,798 (14.7) Diabetes 1,295 (4.0) Table 1. General characteristics of the study participants at baseline
Table 2 shows the summary statistics of the meteorological and air pollution variables during the study period. The average temperature was 9.81 ℃, with a range of −18.7 ℃ to 29.6 ℃. The mean relative humidity, wind speed, and atmospheric pressure was 39.57%, 1.75 m/s, and 848.70 hpa, respectively. The average concentrations of PM10, SO2, and NO2 were 100.85, 55.71, and 22.39 μg/m3.
Variables Mean SD Min P25 P50 P75 Max Meteorological measures Average temperature (°C) 9.81 11.05 −18.70 0.50 10.95 19.33 29.60 Relative humidity (%) 39.57 14.43 2.00 26.00 38.00 50.00 98.00 Atmospheric pressure (hpa) 848.70 5.40 833.80 844.80 848.50 852.60 865.10 Mean wind speed (m/s) 1.75 0.80 0.30 1.20 1.50 2.10 5.50 Air pollutant concentrations PM10 (μg/m3) 100.85 93.92 12.42 58.37 79.65 111.43 1180.67 SO2 (μg/m3) 55.71 37.63 2.00 32.33 48.67 69.67 329.67 NO2 (μg/m3) 22.39 8.36 3.35 16.01 22.67 27.58 62.00 Note. SD, standard deviation: Px, xth percentiles; Min, minimum; Max, maximum. Table 2. Summary statistics of daily average meteorological factors and air pollution concentrations in Jinchang (2011–2015)
The Spearman’s correlations between meteorological factors and air pollutants are shown in Supplementary Table S1, available in www.besjournal.com. The average temperature had a significant negative correlation with three air pollutants and relative humidity and atmospheric pressure and was positively correlated with wind.
Variables PM10 SO2 NO2 Temperature Relative humidity Atmospheric pressure Average temperature −0.338* −0.300* −0.217* Relative humidity −0.227* −0.170* −0.064* −0.166* Atmospheric pressure 0.110* 0.056* 0.077* −0.623* 0.138* Wind 0.002 −0.154* −0.238* 0.267* −0.237* −0.071* Note. *P < 0.05 Table S1. Spearman’s correlations between daily average meteorological factors and air pollutant concentrations in Jinchang (2011–2015)
Table 3 shows the seasonal variations of BP and outdoor temperature. Both SBP and DBP differed significantly across the four seasons at baseline and follow-up. The difference in average SBP between winter and summer was 3.5 mmHg, and the difference in average DBP was 2.75 mmHg in the two-repeated measurement.
Item Spring Summer Autumn Winter P value Baseline No. 8,779 7,372 9,139 7,420 Mean temperature (°C) 12.11 ± 6.51 22.52 ± 3.22 8.76 ± 6.84 −5.41 ± 4.30 < 0.001 SBP (mmHg) 125.05 ± 20.31 120.55 ± 18.72 123.30 ± 19.54 125.15 ± 20.26 < 0.001 DBP (mmHg) 79.14 ± 12.59 76.81 ± 12.01 79.00 ± 12.20 80.37 ± 12.72 < 0.001 Follow-up No. 8,066 8,089 9,237 7,318 Mean temperature (°C) 12.23 ± 6.46 22.40 ± 3.18 8.64 ± 7.07 −4.37 ± 4.00 < 0.001 SBP (mmHg) 125.52 ± 19.63 121.80 ± 20.22 124.75 ± 20.79 124.24 ± 18.24 < 0.001 DBP (mmHg) 78.55 ± 12.43 76.66 ± 12.08 78.43 ± 12.36 78.59 ± 12.01 < 0.001 Total SBP (mmHg) 125.27 ± 19.99 121.20 ± 19.53 124.03 ± 20.19 124.70 ± 19.18 < 0.001 DBP (mmHg) 78.86 ± 12.52 76.74 ± 12.05 78.72 ± 12.28 79.49 ± 12.40 < 0.001 Note. SBP, systolic blood pressure; DBP, diastolic blood pressure. Table 3. Average temperature and BP by season
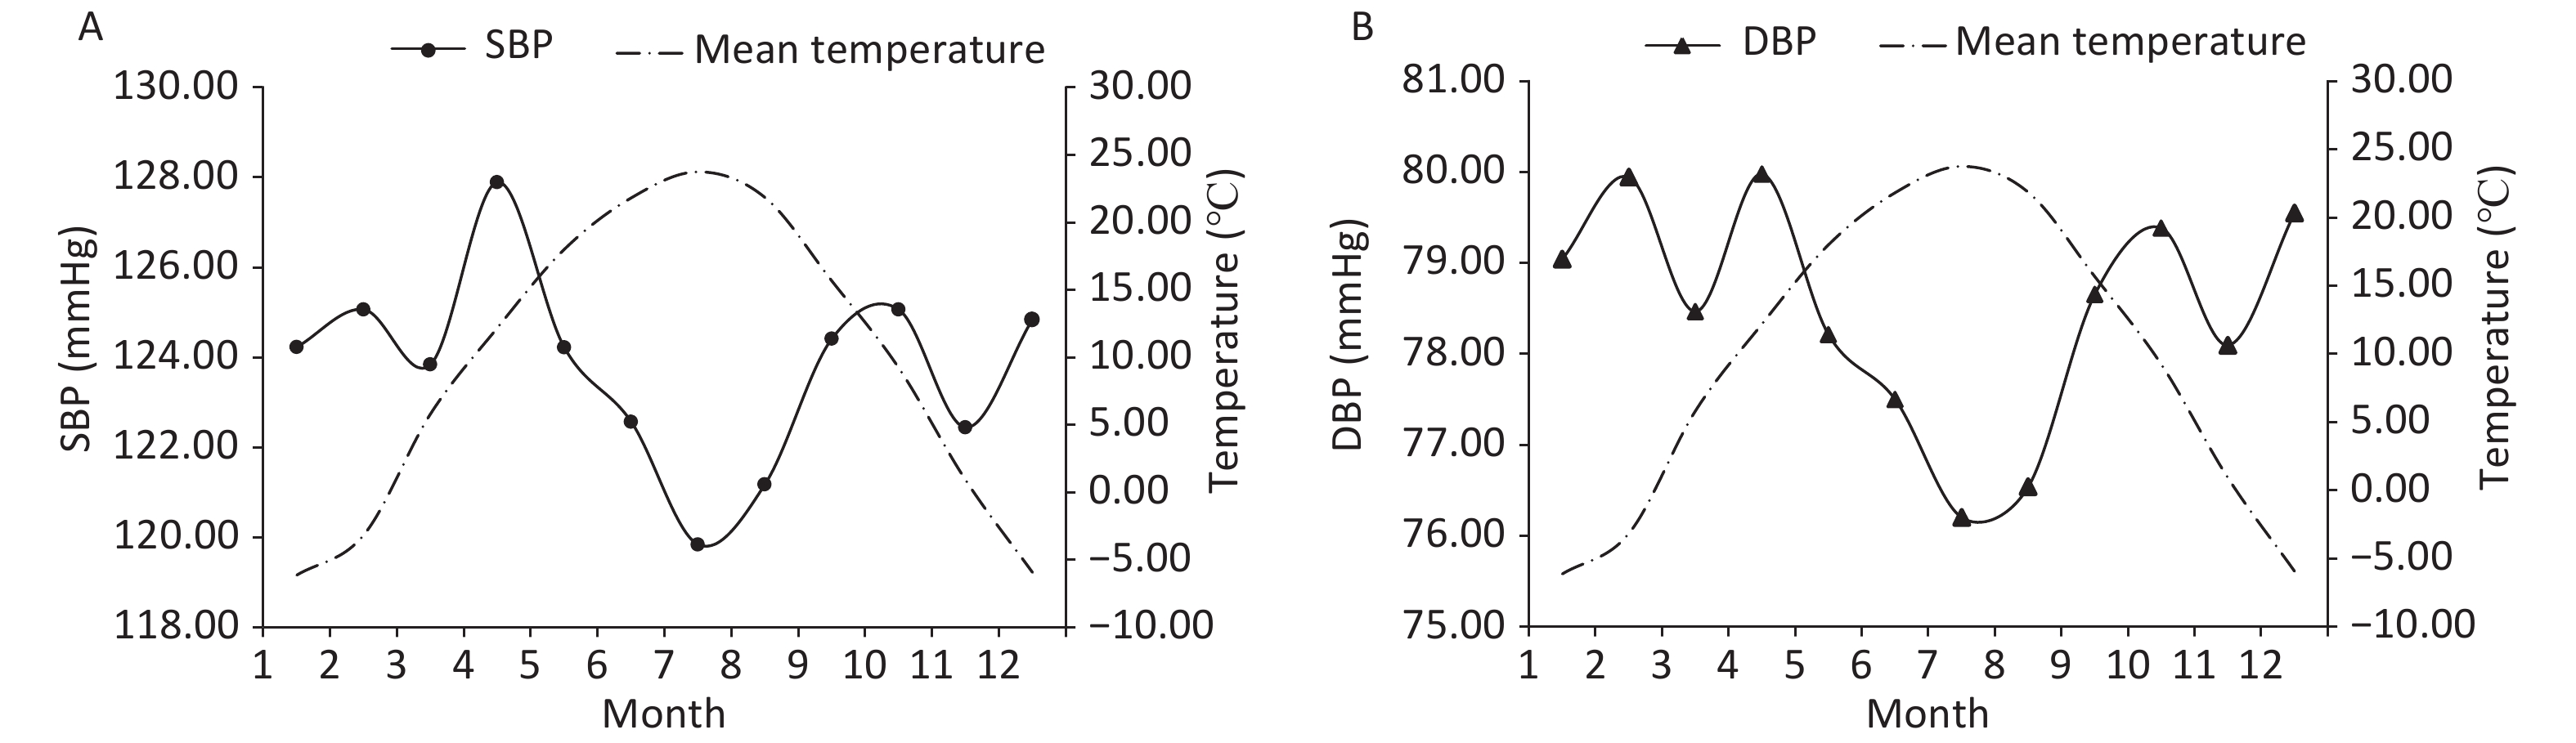
Figure 1 shows the monthly variation of BP and the average temperature. The monthly average BP was the lowest in summer and at an elevated level in spring and winter. Generally, the monthly average temperature was negatively correlated with BP.
Figure 1. Monthly variation of SBP (A), DBP (B) and the average temperature. SBP, systolic blood pressure; DBP, diastolic blood pressure.
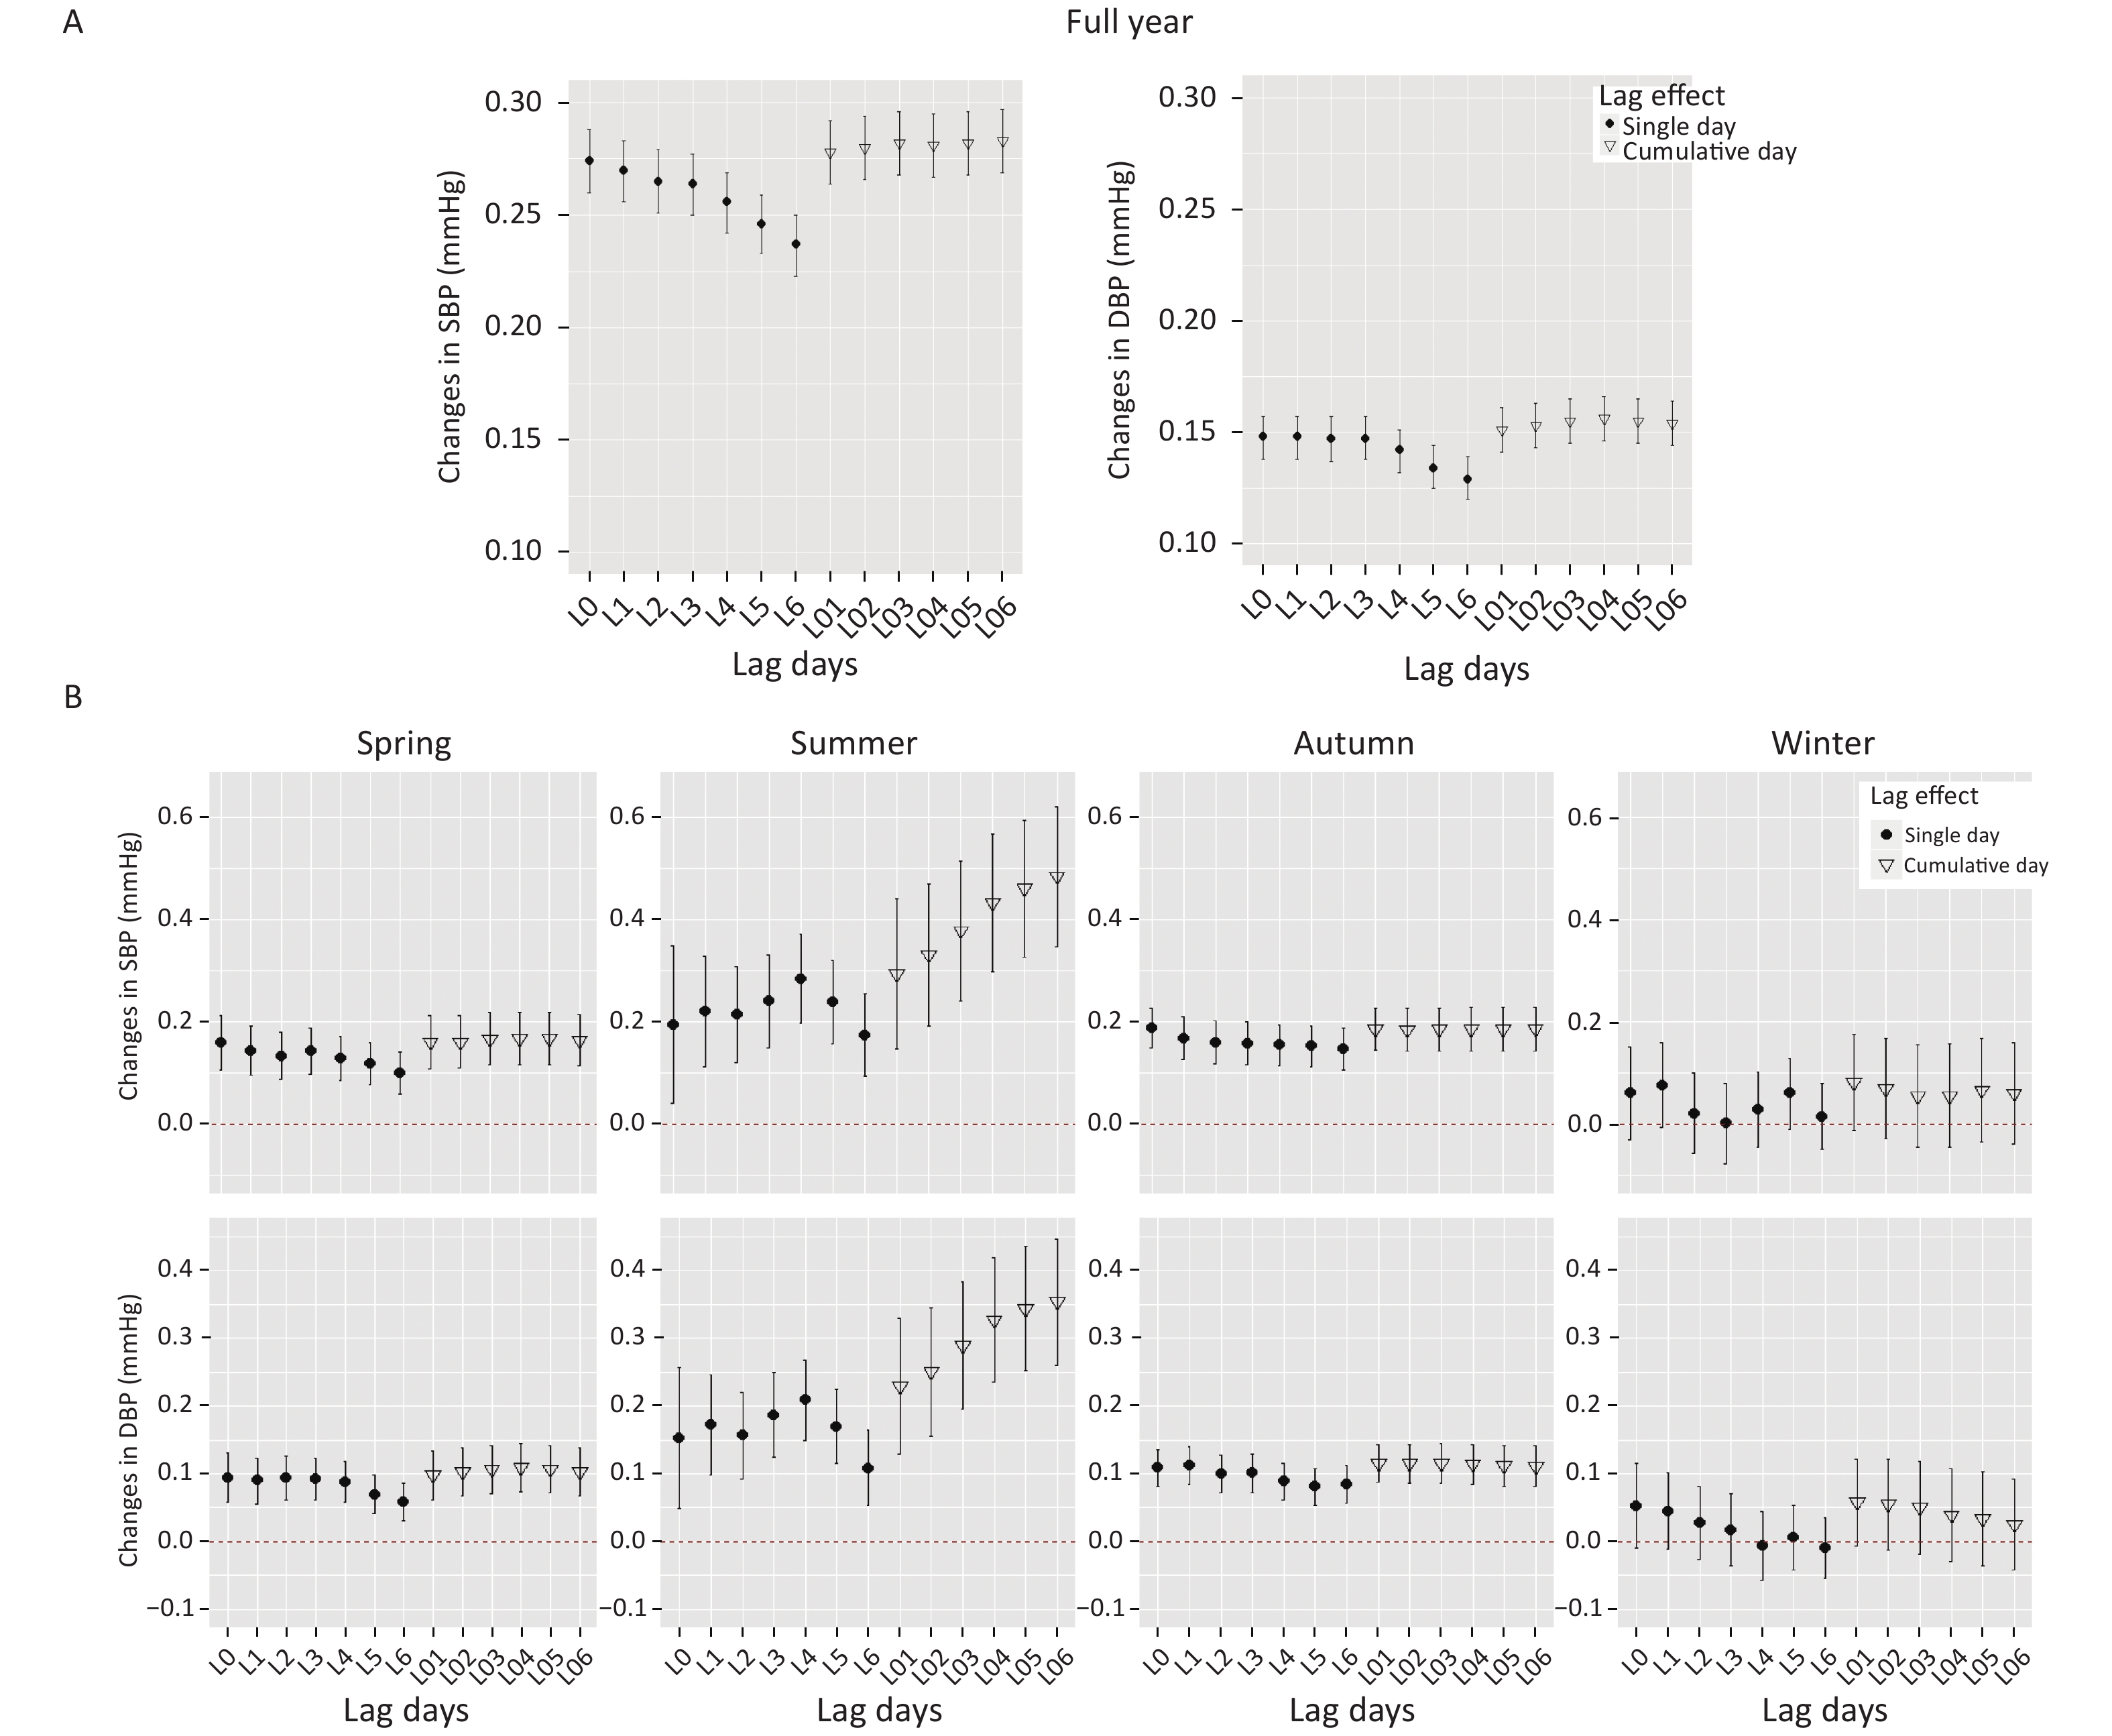
Figure 2A shows the estimated effects of the average temperature on BP on different lag days from the mixed-effect models. Significantly inverse associations between temperature and BP were found on all lag days. The largest effect size was found for lag 06 day for SBP and lag 04 day for DBP. For a 1 °C decrease in the average temperature on lag 06 day, SBP increased by 0.28 mmHg (95% CI: 0.27–0.30), while for a 1 °C decrease in the average temperature on lag 04 day, DBP increased by 0.16 mmHg (95% CI: 0.15–0.17).
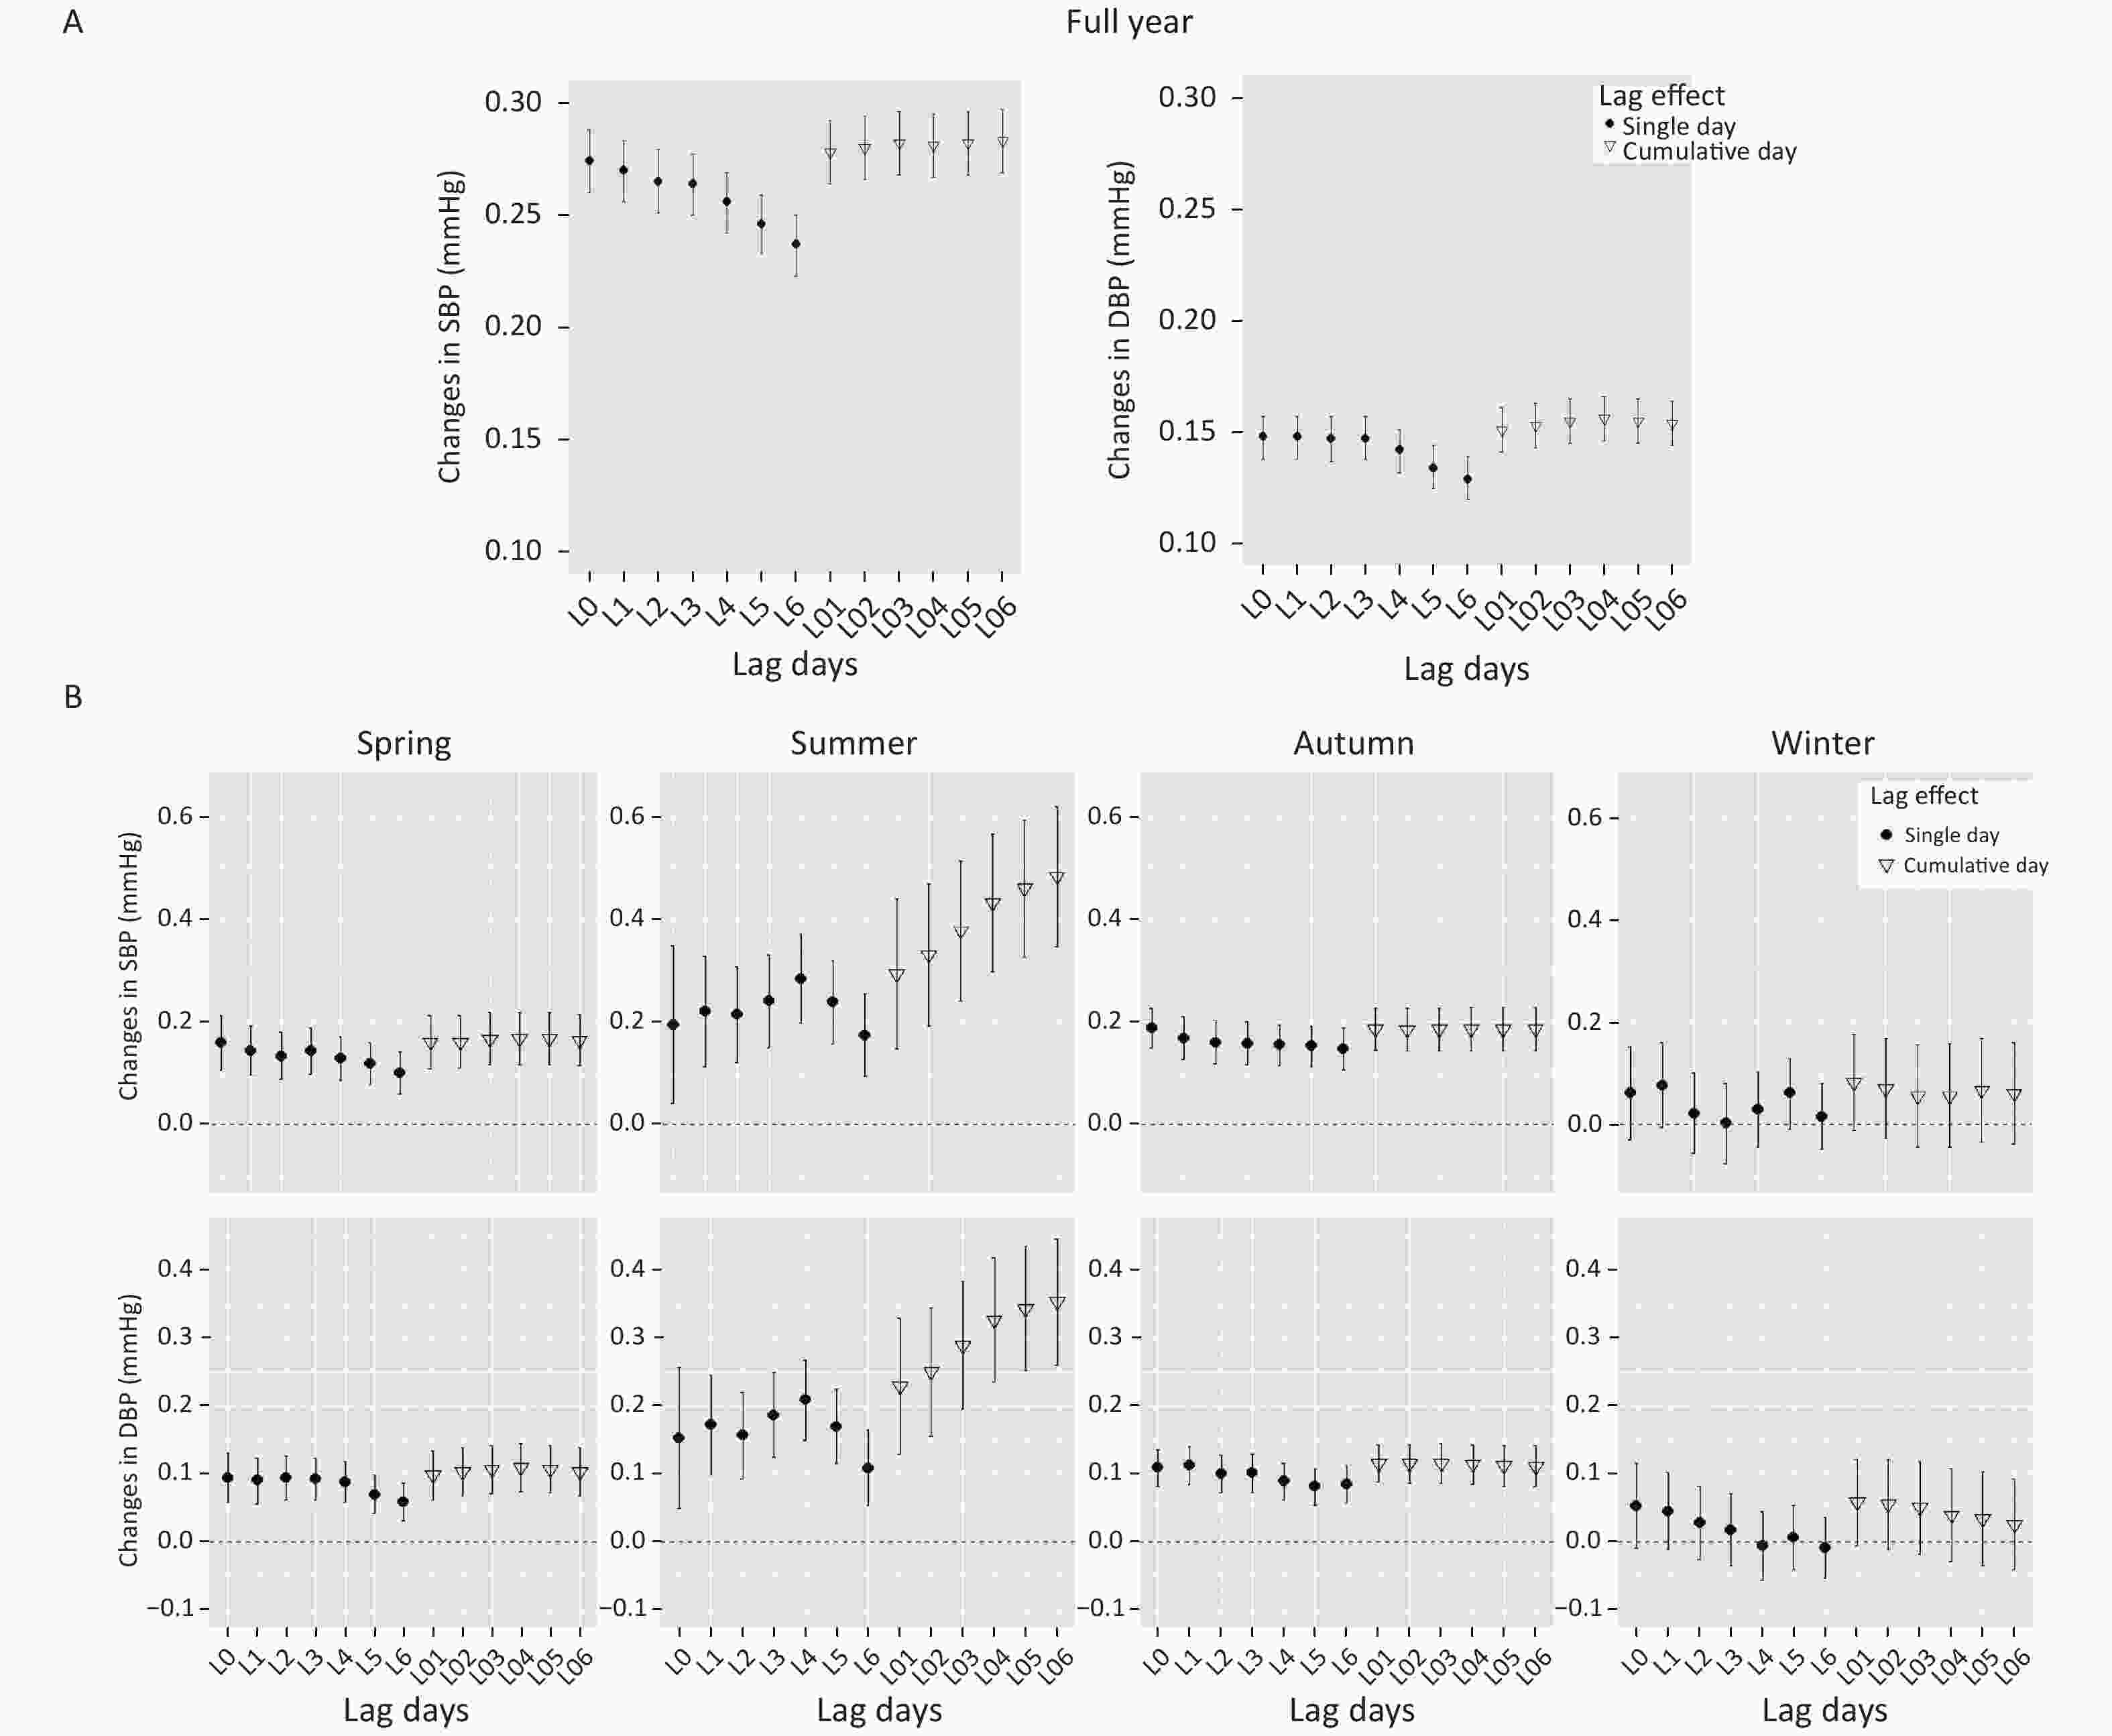
Figure 2. Changes (95% confidence interval) in BP associated with a 1 °C decrease in the average temperature on the present day and lag days in (A) full year and (B) four seasons. SBP, systolic blood pressure; DBP, diastolic blood pressure. In full year, models control for age, gender, education, marriage, occupation, smoking, drinking, BMI, atmospheric pressure, relative humidity, wind, SO2, NO2, PM10, CVDs, diabetes and season. In four seasons, models did not control for season.
Figure 2B shows the estimated effects of the average temperature on BP stratified by season. The four seasons were a significant effect modifier on the relationship between BP and average temperature. Significant associations between temperature and BP were found in spring, summer, and fall, with the largest effect size in summer, but no significant association was found in winter. In summer, for a 1 ℃ decrease in temperature on lag 06 day, SBP increased by 0.48 mmHg (95% CI: 0.35–0.62) and DBP increased by 0.35 mmHg (95% CI: 0.26–0.45). In general, the delayed effects of temperature on BP on cumulate lag days were stronger than the effects on single lag days.
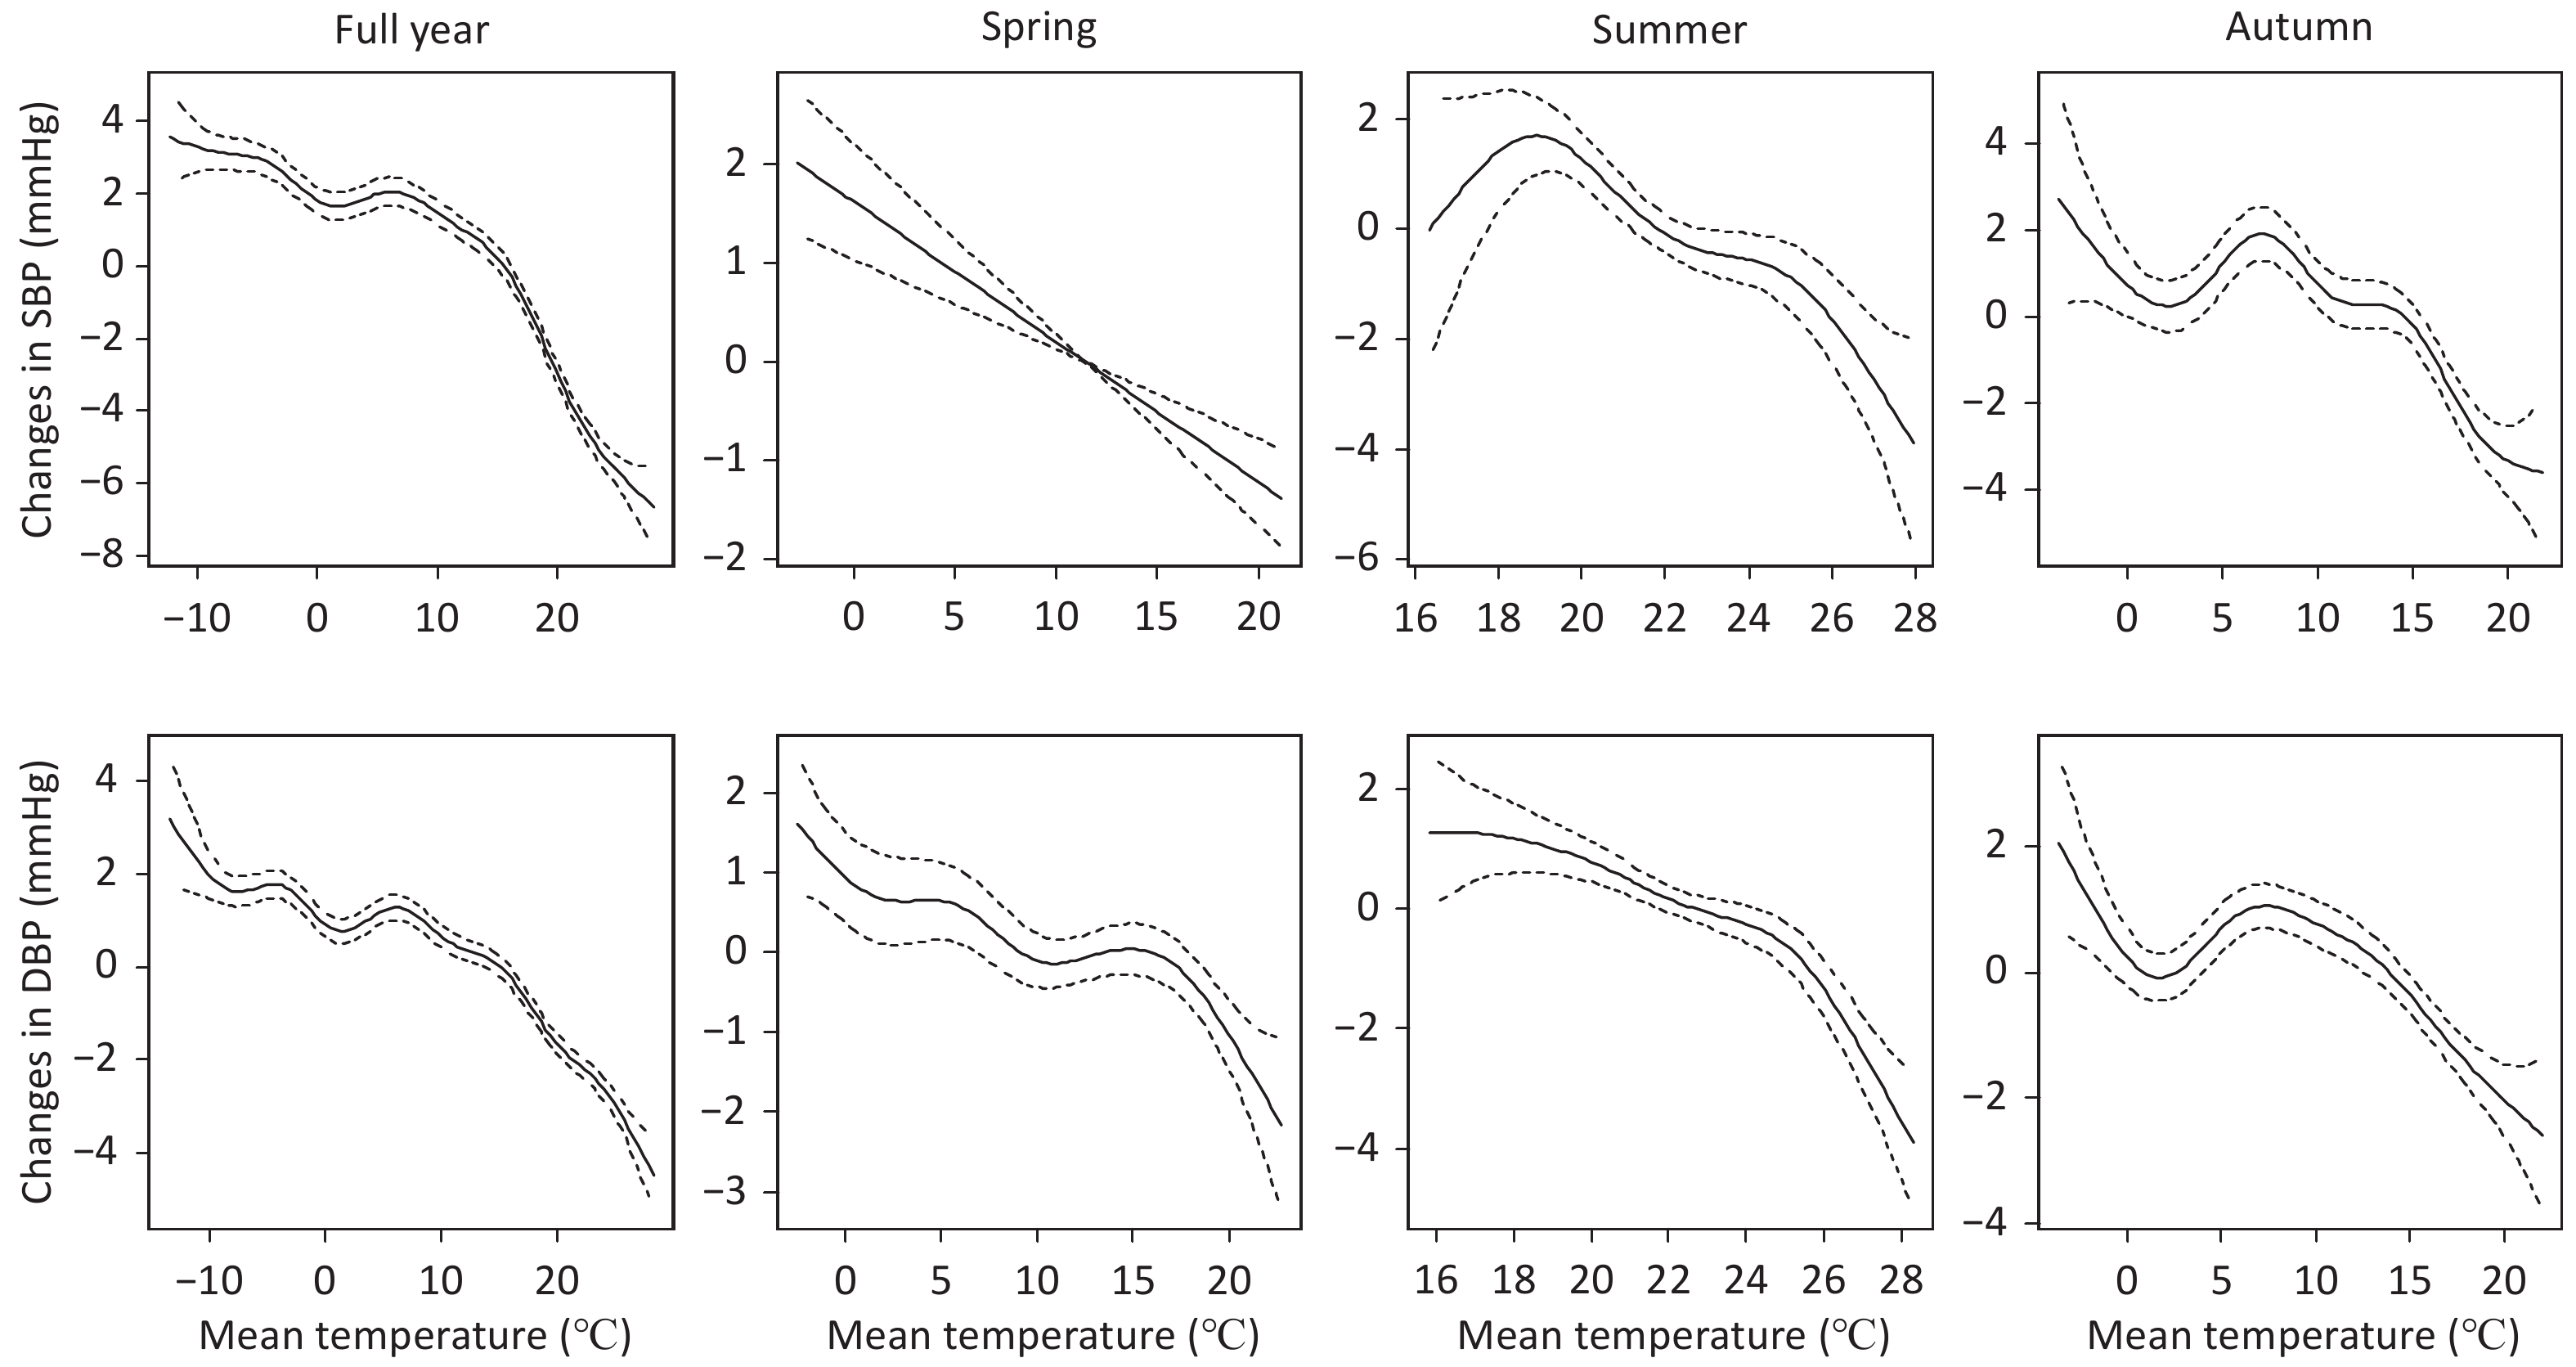
Figure 3 shows the exposure-response relationships between BP and the average temperature in the full year and three seasons, after controlling for individual characteristics, meteorological factors, and air pollutants and demonstrates that the relative risk of BP increased as the daily average temperature decreased in the study population.
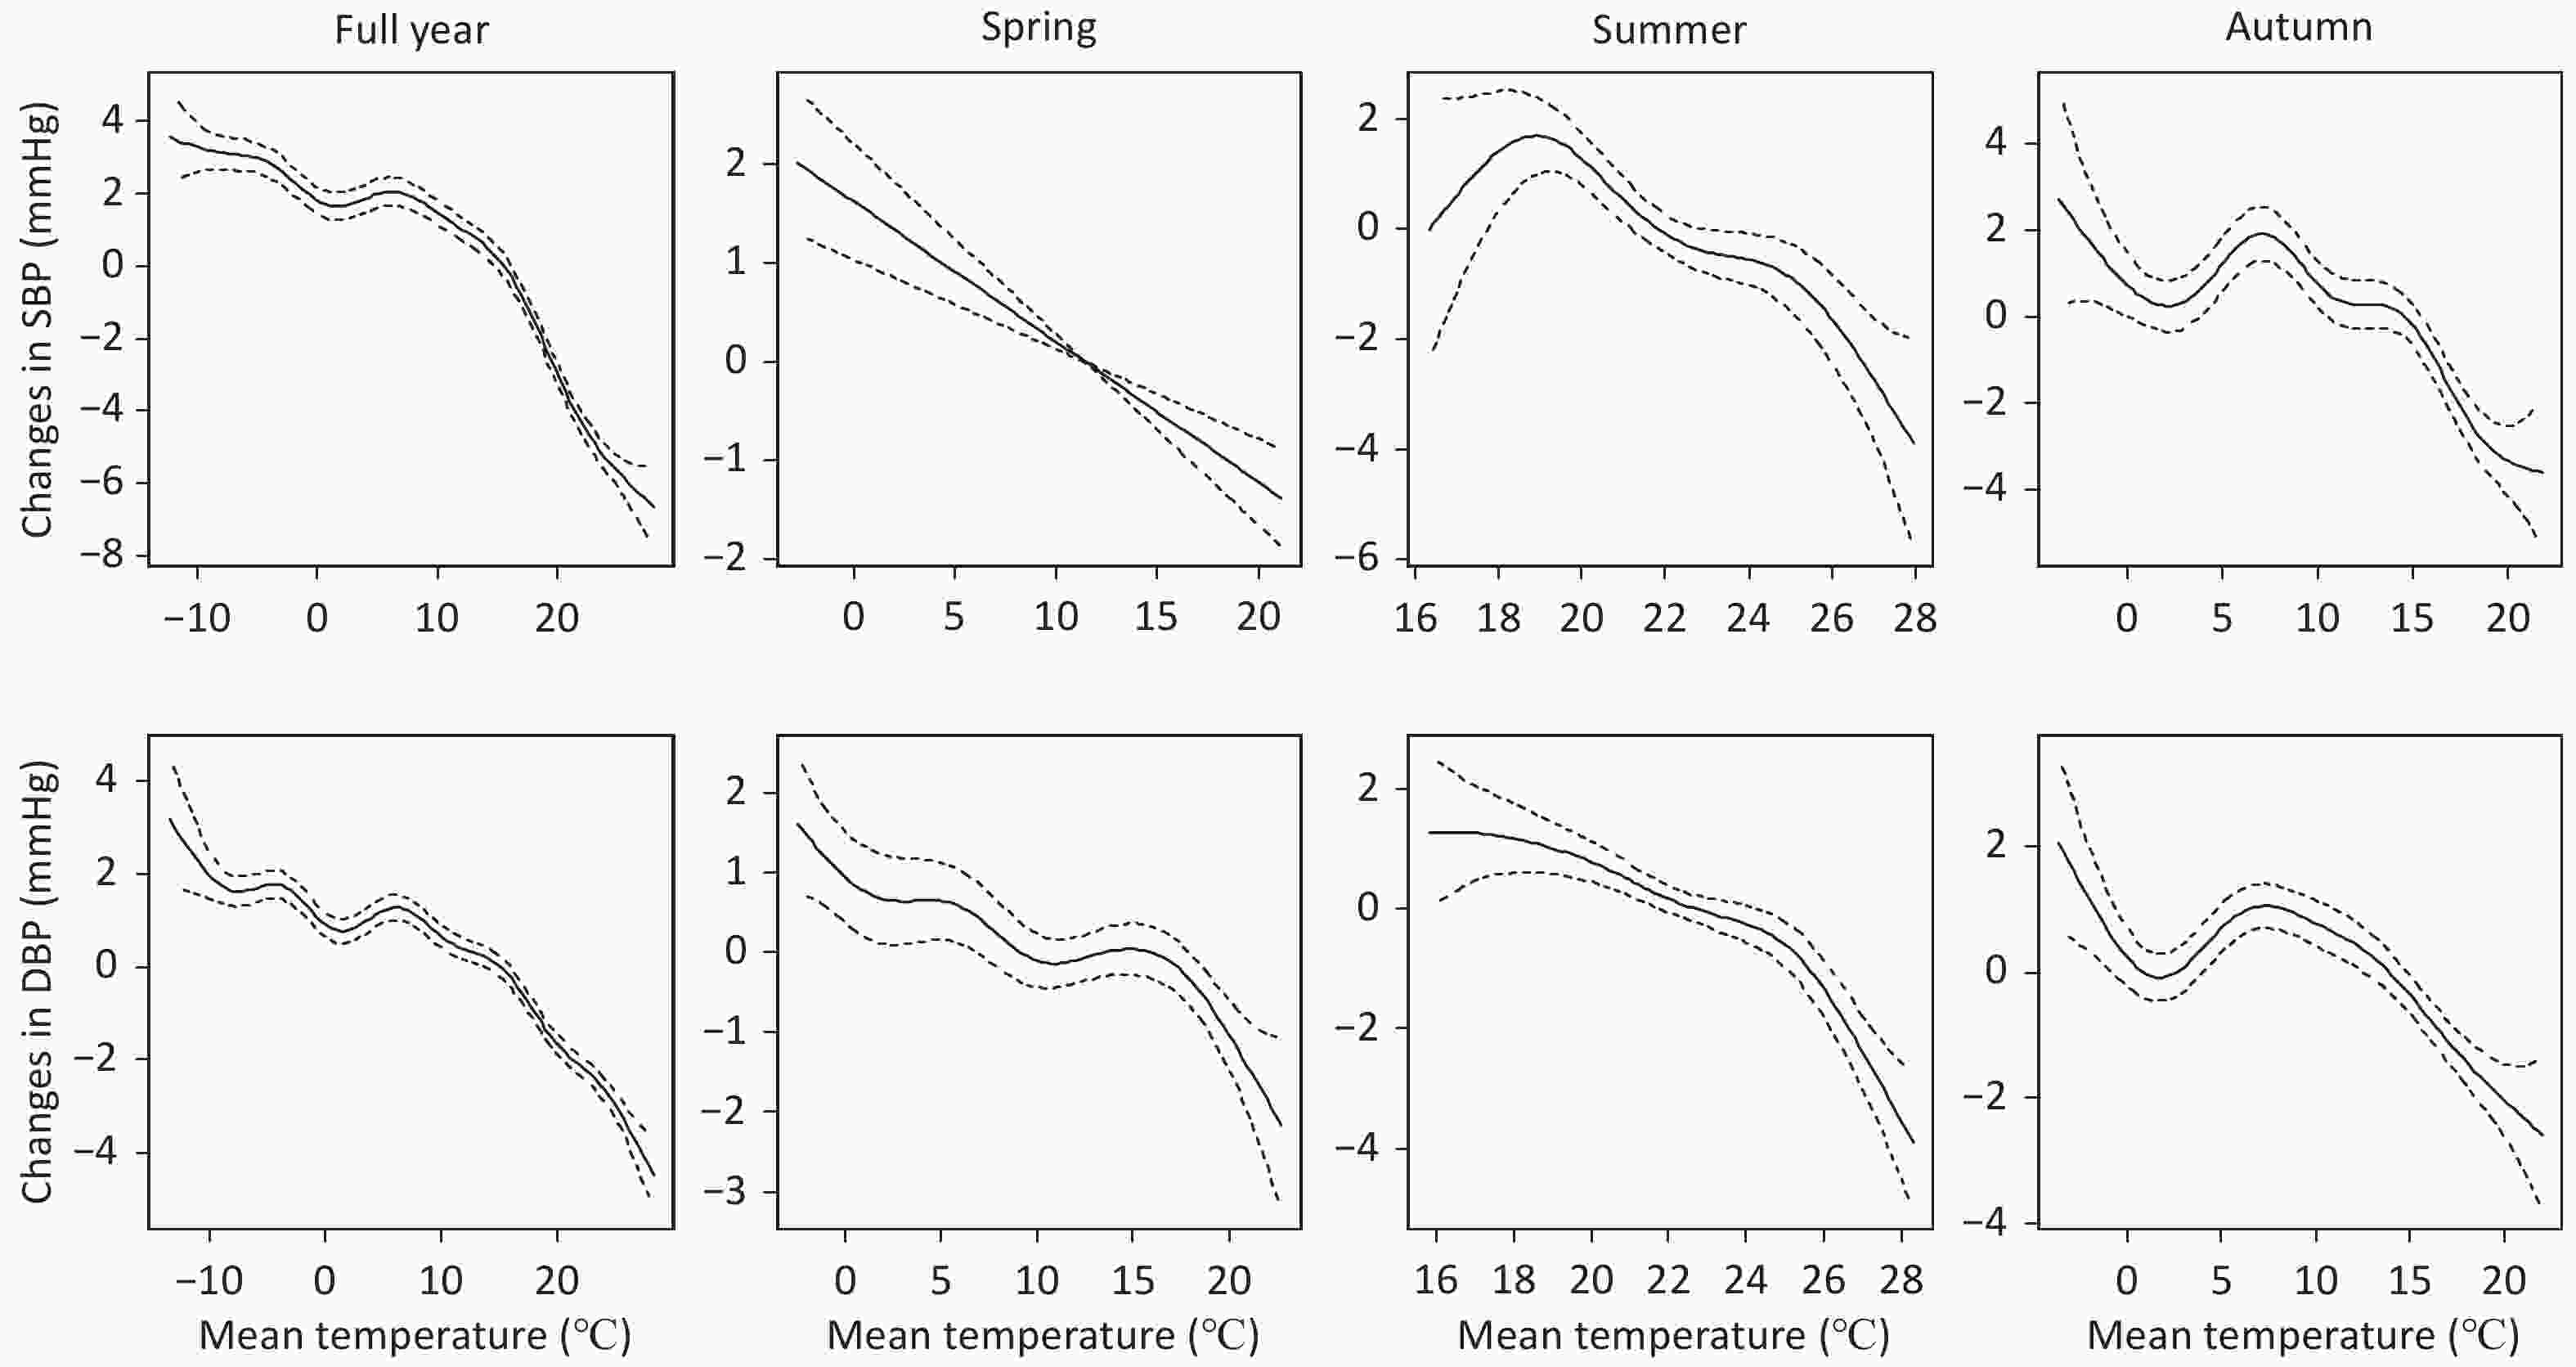
Figure 3. Association between daily average temperature and BP by season. SBP, systolic blood pressure; DBP, diastolic blood pressure. Lag 06 day was used for SBP and Lag 04 day was used for DBP. In full year, models control for age, gender, education, marriage, occupation, smoking, drinking, BMI, atmospheric pressure, relative humidity, wind, SO2, NO2, PM10, CVDs, diabetes and season. In the three seasons, models did not control for season.
Table 4 shows the effects of a decrease in temperature on BP stratified by different individual characteristics. Significant adverse relationships were observed between outdoor temperature and BP in all subgroups. All individual characteristics were significant effect modifiers on the relationship between BP and outdoor temperature. The effects of outdoor temperature on SBP and DBP were significantly stronger for people who were older, male, overweight or obese, smokers, drinkers, or had chronic conditions (including CVDs and diabetes), compared to their counterparts.
Variables SBPa DBPb β 95% CI β 95% CI Age (years) < 40 0.23 0.21–0.26 0.13 0.12–0.15 40–60 0.29 0.27–0.31 0.16 0.15–0.18 ≥ 60 0.39 0.34–0.43 0.18 0.15–0.21 Interaction term P < 0.001 P < 0.001 Gender Female 0.20 0.18–0.23 0.08 0.07–0.10 Male 0.33 0.31–0.35 0.20 0.19–0.21 Interaction term P < 0.001 P < 0.001 Body mass index (kg/m2) < 24 0.26 0.24–0.27 0.14 0.12–0.15 24–28 0.31 0.29–0.34 0.18 0.16–0.20 ≥ 28 0.32 0.27–0.37 0.19 0.15–0.23 Interaction term P < 0.001 P < 0.001 Smoking Non-smoker 0.24 0.22−0.26 0.12 0.10–0.13 Current smoker 0.32 0.30−0.34 0.21 0.19–0.22 Former smoker 0.37 0.32−0.42 0.18 0.15, 0.22 Interaction term P < 0.001 P < 0.001 Drinking Non-drinker 0.27 0.25–0.29 0.14 0.13–0.16 Current drinker 0.29 0.26–0.33 0.18 0.16–0.20 Former drinker 0.36 0.27−0.44 0.18 0.12–0.24 Interaction term P < 0.001 P < 0.001 Cardiovascular disease No 0.26 0.25–0.38 0.15 0.14–0.16 Yes 0.36 0.27−0.44 0.18 0.12–0.24 Interaction term P < 0.001 P < 0.001 Diabetes No 0.28 0.26–0.29 0.16 0.15–0.17 Yes 0.42 0.33–0.50 0.17 0.11–0.24 Interaction term P < 0.001 P < 0.05 Note. SBP, systolic blood pressure; DBP, diastolic blood pressure; CI, confidence interval; BMI, body mass index. All models controlled for age, gender, education, marriage, occupation, BMI, smoking, drinking, atmospheric pressure, relative humidity, wind, SO2, NO2, PM10, CVDs, diabetes, and season. a, Lag 06 day was used for SBP. b, Lag 04 day was used for DBP. Table 4. Changes (95% confidence interval) in BP associated with a 1 °C decrease in the average temperature stratified by different levels of individual characteristics
Table 5 shows the associations between outdoor temperature and BP before and after adjusting for covariates. The associations of outdoor temperature with SBP and DBP were consistently significant before and after adjusting for the covariates. The effect sizes between temperature and BP increased after adjusting for individual characteristics, season, meteorological factors, and air pollutants.
Models SBPa DBPb β 95% CI β 95% CI T 0.21 0.20–0.22 0.12 0.11−0.13 T + Individual characteristics 0.26 0.25–0.27 0.15 0.14−0.16 T + Individual characteristics + Season 0.28 0.26–0.29 0.15 0.14−0.16 T + Individual characteristics + Season+ Meteorological factors 0.28 0.26–0.29 0.15 0.14−0.16 T + Individual characteristics +Season+ Meteorological factors + Air pollutants 0.28 0.27–0.30 0.16 0.15−0.17 Note. SBP, systolic blood pressure; DBP, diastolic blood pressure; CI, confidence interval. a, Lag 06 day was used for SBP. b, Lag 04 day was used for DBP. T, mean temperature. Individual characteristics, including age, gender, education level, marital status, occupation status, BMI, smoking, drinking, CVDs, and diabetes. Meteorological factors, including mean relative humidity, wind speed, and atmospheric pressure. Air pollutants, including PM10, SO2, and NO2. Table 5. Changes (95% confidence interval) in BP associated with a 1 °C decrease in the average temperature before and after adjustment for covariates
Table 6 shows the association between average temperature and BP in hypertensive patients and non-hypertensive individuals. In non-hypertensive individuals, the effect of temperature on BP decreases after adjusting for the variable of detected hypertension. Similarly, the effect also declines after adjusting the variable of drug use in hypertensive patients. In general, the effect size of temperature on BP is higher in hypertensive patients than in non-hypertensive individuals.
Item SBP DBP Lag days β 95% CI Lag days β 95% CI Non-hypertensivea 04 0.26 0.25−0.28 04 0.15 0.14−0.16 Non-hypertensiveb 0.19 0.17−0.20 0.09 0.08−0.10 Hypertensionc 03 0.38 0.34−0.43 04 0.19 0.16−0.22 Hypertensiond 0.20 0.16−0.23 0.07 0.04−0.10 Note. SBP, systolic blood pressure; DBP, diastolic blood pressure; CI, confidence interval. a, Models controlling for age, gender, education, marriage, occupation, smoking, drinking, BMI, atmospheric pressure, relative humidity, wind, SO2, NO2, PM10, CVDs, diabetes, and season. b, a plus detected hypertension. c, Models controlling for age, gender, education, marriage, occupation, smoking, drinking, BMI, atmospheric pressure, relative humidity, wind, SO2, NO2, PM10, diabetes, and season. d, c plus drug use. Table 6. Changes (95% confidence interval) in BP associated with a 1 °C decrease in the average temperature stratified by hypertension
-
In this longitudinal study, we observed a seasonal variation in BP and significant acute effects of average outdoor temperature on BP in a large cohort in Jinchang, China. The effect sizes of outdoor temperature on both SBP and DBP were larger in summer than in the other seasons. Furthermore, the association varied significantly with age, gender, BMI, unhealthy behaviors, and chronic disease status.
Previous studies have provided inconsistent results of the relationship between outdoor temperature and BP. In this study, we found a curved negative significant association between outdoor temperature and BP, which was consistent with Hurk’s study in the Netherlands[20]. Moreover, a study from Kailuan, China, reported a U-shaped association[19]. The difference in the relationship might be due to variations of the study population, geographic location, and potentially statistical methods[29]. In addition, we found short-term lag effects in both single- and cumulative-lag models in three seasons, except for winter. The coefficients for both SBP and DBP showed a decreasing trend with the increase of single lag days. Similar results were found in studys[14,18]. Temperature and atmospheric particulates have been reported to have significant lag effects on human mortality[30, 31] and morbidity[32, 33]. These effects could possibly result from the lag effect of temperature on BP. Therefore, patients with CVDs should be more cautious with sudden changes in temperature.
We found that both SBP and DBP showed seasonal fluctuations. The difference in mean temperature between summer and winter reached 27.54 ℃ during the study period, and the corresponding differences in SBP and DBP between the two seasons were 3.5 mmHg and 2.75 mmHg, respectively. Several studies have shown significant effects of the seasons on BP in adults[20, 25, 29]. In our study, the associations between temperature and BP differed by season, after controlling for the potential confounding factors. The effects of temperature on BP in summer were greater than the effects in spring and autumn. In contrast, a study conducted in Hangzhou City in southern China found larger effects of outdoor temperature on BP in spring and autumn[11]. Our study revealed a significant interaction between temperature and season on BP, which was inconsistent with previous study conducted in the US[25]. Outdoor temperature was not significantly associated with BP in winter in our study, which could be due to the fact that participants spent the majority of their time indoors due to the cold outdoor temperatures (average annual temperature was below 10 ℃), and all residences used heating in winter. One study conducted in 10 different regions in China also reported no significant association between outdoor temperature and BP among participants who reported having central heating in their homes during the time periods with lower temperatures[13]. Another study found that the use of air conditioning in warmer temperatures did not affect the relationship between season and BP[34].
Our study found that the effects of outdoor temperature on BP varied by demographic characteristics, unhealthy behaviors, and chronic disease status. Those who were older, male, overweight or obese, smokers and drinkers, or who had CVDs and diabetes, were more susceptible to the impacts of temperature changes on BP. Previous studies have found significant associations between outdoor temperature and BP in individuals with CVDs[16], type 1 or type 2 diabetes mellitus[35], those who are taking antihypertensive medications[36], and the elderly[14]. Studies have reported a stronger impact of temperature change on BP in patients with CVDs than in those without CVDs[13, 16]. Together, these results suggest that individuals with preexisting conditions (i.e., CVDs) are more susceptible to temperature changes on their BP.
While the biological mechanisms underlying the association between temperature and BP have not been fully understood, several epidemiological studies have indicated that sympathetic nervous activity[37] and endothelial dysfunction[38] might cause elevated BP after exposure to cold temperatures in certain cardiovascular events. Experimental studies have suggested that exposure to low temperatures could influence the renin-angiotensin system to elevate BP through upregulation of AngII receptors, leading to the vasoconstriction of blood vessels[39, 40]. When the temperature increases, the expansion of blood vessels and the decrease of vascular resistance may cause a decrease in blood pressure. The high temperatures in summer can cause the body to sweat more, and a decrease in blood volume may decrease blood pressure. Additionally, aging and/or disease could impact the adaption capacity of physiological responses to perturbations resulting from the environment[41].
The strengths and limitations of our study should be considered when interpreting the results. Our study was based on a prospective cohort study with repeated BP measurements, which increased our statistical power and controlled for variability between participants. Detailed information on individual factors allowed us to control for confounding effects and conduct stratified analyses to investigate potential effect modifiers. However, our study did not control for indoor temperature due to the lack of information on indoor temperature. Several studies have suggested that indoor temperature is associated with BP[42, 43] and contributes to the seasonal effects on BP[44]. Due to the significant difference in outdoor and indoor temperature during winter in this region, we performed stratified analyses by season. No significant association between temperature and BP in winter observed in our study could be due to the impact of indoor temperature. We used data from one meteorological station as a surrogate of personal exposure to outdoor temperature, which could have caused potential misclassification of individual exposure to outdoor temperature if participants traveled to other places during the study period. However, the potential misclassification was likely to be non-differential, resulting in an under-estimation of the observed association. In addition, by comparing the differences in the basic information between the selected and excluded individuals (see Supplementary Table S2 available in www.besjournal.com), it was found that the excluded individuals were generally older, less educated, retired, and had a larger proportion of smoking and drinking than the selected individuals. The differences in these characteristics may suggest that the effect of temperature on BP among the selected individuals was underestimated.
Variables Included, Mean ± SD or n (%) Excluded, Mean ± SD or n (%) P Total 32,710 (100.0) 645 (100.0) Age (years) 46.37 ± 12.77 49.28 ± 14.09 < 0.05 Male, n (%) 19,916 (60.9) 401 (62.2) > 0.05 Married, n (%) 28,222 (86.3) 562 (87.1) > 0.05 Education level < 0.05 Low (Junior middle school or less) 12,393 (37.9) 296 (45.9) Medium (senior higher school or equivalent) 15,844 (48.4) 273 (42.3) High (College degree and more) 4,473 (13.7) 76 (11.8) Occupation < 0.05 Blue collar worker 19,241 (58.8) 304 (47.1) Managerial staff 3,457 (10.6) 96 (14.9) Logistics staff 380 (1.2) 9 (1.4) Technical staff 1,338 (4.1) 13 (2.0) Retirees 8,294 (25.4) 223 (34.6) Body mass index (kg/m2) 23.55 ± 3.25 23.36 ± 3.19* > 0.05 Smoking < 0.05 Non-smoker 18,022 (55.1) 325 (50.4) Current smoker 11,968 (36.6) 251 (38.9) Former smoker 2,720 (8.3) 69 (10.7) Drinking < 0.05 Non-drinker 25,210 (77.1) 476 (73.8) Current drinker 6,215 (19.0) 128 (19.8) Former drinker 1,285 (3.9) 41 (6.4) Cardiovascular disease 6,442 (19.7) 130 (20.2) > 0.05 Hypertension 4,798 (14.7) 83 (12.9) > 0.05 Diabetes 1,295 (4.0) 26 (4.0) > 0.05 Note. *264 subjects lack height and weight data. Table S2. The differences of the basic information between the participants included and excluded
We observed a significant negative association between outdoor temperature and BP in a large cohort population of northwest China. Our results also suggested that the association between BP and temperature varied by season. Furthermore, demographic characteristics (age, gender, and BMI), unhealthy behaviors (smoking and alcohol consumption), and chronic disease status (CVDs, hypertension, and diabetes) might modify this association. Our results warrant replication in other study populations, and future mechanistic studies are needed to elucidate the underlying mechanisms.
-
We would like to thank all study participants and staff of the Worker’s Hospital of the Jinchuan Nonferrous Metals Corporation (JNMC) for their generous work and the interviewers from the Institute of Epidemiology and Statistics, School of Public Health, Lanzhou University. S.Z. would like to thank the China Scholarship Council for their support.
-
ZHENG Shan and WANG Min Zhen wrote the first draft of the manuscript. ZHENG Shan and CHENG Zhi Yuan performed the data analyses. LI Hai Yan, NIE Yong Hong, MI Xiu Ying, and KANG Feng contributed to data collection. JIN Lan, ZHANG Ya Wei, and BAI Ya Na gave advice on data analysis and critically revised the final manuscript. All authors read and approved the final manuscript.
-
The study was approved by the Ethical Committee of the Public Health School of Lanzhou University (Ethical Approval Code: 2015-01). A letter of informed consent was signed for each individual participating in the cohort study.
-
The authors declare they have no competing financial interest.
Funds:
The study was supported by the National Science Foundation of China [Grant Number: 41505095, 41705122, 81673248] and the Fundamental Research Funds for the Central Universities in China [Grant Number: lzujbky-2018-69, lzujbky-2018-66]

 Quick Links
 DownLoad: