


-
Aseries of efforts, such as including cataracts in most national plans for the prevention of visual impairment[1], have been made to improve cataract-related health services. However, cataracts remain a major public health problem[2]. In 2010, cataracts were responsible for 33.4% of global blindness and 18.4% of global moderate to severe vision impairment[2]. With the increasing life expectancy and rapidly aging population, the number of people with vision impairment due to cataracts is expected to increase continuously. The burden of cataracts can be quantified by disability adjusted life year (DALY) as the sum of year of life lost (YLL) and year lived with disability (YLD) for each location estimated by the Global Burden of Diseases (GBD), Injuries, and Risk Factors Study 2017[3]. The GBD study 2017 was the result of a global collaboration to examine data on 359 diseases and injuries in 195 countries and territories, and it revealed that the global DALYs for cataracts increased by 29.6% from 2007 to 2017, reaching 8,010 thousands[3].
Cataracts are the most unevenly distributed noncommunicable eye disease in the world, placing the greatest burden on middle- and low-income countries[4], which result from the combined effects of socioeconomic and environmental factors. From a socioeconomic perspective, previous studies have found that the health burden of cataract vision loss is correlated with socioeconomic status[5, 6]. Cataracts can not only cause vision loss but also cause more serious blindness[1, 2], which leading to an increased risk of death[7] and impaired quality of life[8]. We speculate that burden of cataract-related blindness is also correlated with socioeconomic status. From an environmental perspective, as it is well known, exposure to ultraviolet radiation (UVR) is one of the risk factors for cataract blindness, and the association of a higher cataract blindness burden with UVR has been documented in numerous reports[9-11]. A study concluded that the prevalence of cataracts increased at a rate of 3% for each degree of latitude to the south[12]. Therefore, UVR is a major factor leading to an uneven worldwide distribution of the cataract-related blindness burden, and it cannot be ignored. However, little evidence of evaluation of the effect of co-exposure to high-UVR and poor socioeconomic status on burden of cataract-related blindness.
We hypothesized that co-exposure on high-UVR and poor socioeconomic development jointly leads to the inequality in global cataract-related burden, with a stronger association of socioeconomic status with cataract-related burden in high-UVR countries than in countries of low UVR exposure. Therefore, in addition to evaluating the association of socioeconomic status and the burden of cataract-related blindness, we further explored the potential interaction effect between socioeconomic status and UVR exposure on the burden of cataract blindness in 185 countries and territories worldwide. Our study may be informative and helpful in achieving the aim proposed by the World Health Organization (WHO) Global Action Plan (GAP)[1] of eliminating blindness caused by cataracts.
-
This study involved all countries in the world, using both country-level and subnational-level data. In the country-level analysis, countries with data in the GBD study 2017 but not in the Human Development Report were excluded (Supplementary Table S1 available in www.besjournal.com). We also analyzed subnational-level data if subnational regions were included in the GBD study 2017 (Supplementary Table S2 available in www.besjournal.com). All variables used the latest values, except UVR exposure and gross domestic product (GDP) per capita (Supplementary Table S3 available in www.besjournal.com). Satellite-derived UVR exposure data were incomplete from June 1–14, 2016 and from May 12–16, 2017, so we used 2015 solar UVR data. The GDP per capita of Japan was available only in 2014.
Country_ida Country_name GBD Study 2017 Human development report 6 China √ √ 7 North Korea √ 8 Taiwan √ 10 Cambodia √ √ 11 Indonesia √ √ 12 Laos √ √ 13 Malaysia √ √ 14 Maldives √ √ 15 Myanmar √ √ 16 Philippines √ √ 17 Sri Lanka √ √ 18 Thailand √ √ 19 Timor-Leste √ √ 20 Vietnam √ √ 22 Fiji √ √ 23 Kiribati √ √ 24 Marshall Islands √ √ 25 Federated States of Micronesia √ √ 26 Papua New Guinea √ √ 27 Samoa √ √ 28 Solomon Islands √ √ 29 Tonga √ √ 30 Vanuatu √ √ 33 Armenia √ √ 34 Azerbaijan √ √ 35 Georgia √ √ 36 Kazakhstan √ √ 37 Kyrgyzstan √ √ 38 Mongolia √ √ 39 Tajikistan √ √ 40 Turkmenistan √ √ 41 Uzbekistan √ √ 43 Albania √ √ 44 Bosnia and Herzegovina √ √ 45 Bulgaria √ √ 46 Croatia √ √ 47 Czech Republic √ √ 48 Hungary √ √ 49 Macedonia √ √ 50 Montenegro √ √ 51 Poland √ √ 52 Romania √ √ 53 Serbia √ √ 54 Slovakia √ √ 55 Slovenia √ √ 57 Belarus √ √ 58 Estonia √ √ 59 Latvia √ √ 60 Lithuania √ √ 61 Moldova √ √ 62 Russian Federation √ √ 63 Ukraine √ √ 66 Brunei √ √ 67 Japan √ √ 68 South Korea √ √ 69 Singapore √ √ 71 Australia √ √ 72 New Zealand √ √ 74 Andorra √ √ 75 Austria √ √ 76 Belgium √ √ 77 Cyprus √ √ 78 Denmark √ √ 79 Finland √ √ 80 France √ √ 81 Germany √ √ 82 Greece √ √ 83 Iceland √ √ 84 Ireland √ √ 85 Israel √ √ 86 Italy √ √ 87 Luxembourg √ √ 88 Malta √ √ 89 Netherlands √ √ 90 Norway √ √ 91 Portugal √ √ 92 Spain √ √ 93 Sweden √ √ 94 Switzerland √ √ 95 United Kingdom √ √ 97 Argentina √ √ 98 Chile √ √ 99 Uruguay √ √ 101 Canada √ √ 102 United States √ √ 105 Antigua and Barbuda √ √ 106 The Bahamas √ √ 107 Barbados √ √ 108 Belize √ √ 109 Cuba √ √ 110 Dominica √ √ 111 Dominican Republic √ √ 112 Grenada √ √ 113 Guyana √ √ 114 Haiti √ √ 115 Jamaica √ √ 116 Saint Lucia √ √ 117 Saint Vincent and the Grenadines √ √ 118 Suriname √ √ 119 Trinidad and Tobago √ √ 121 Bolivia √ √ 122 Ecuador √ √ 123 Peru √ √ 125 Colombia √ √ 126 Costa Rica √ √ 127 El Salvador √ √ 128 Guatemala √ √ 129 Honduras √ √ 130 Mexico √ √ 131 Nicaragua √ √ 132 Panama √ √ 133 Venezuela √ √ 135 Brazil √ √ 136 Paraguay √ √ 139 Algeria √ √ 140 Bahrain √ √ 141 Egypt √ √ 142 Iran √ √ 143 Iraq √ √ 144 Jordan √ √ 145 Kuwait √ √ 146 Lebanon √ √ 147 Libya √ √ 148 Morocco √ √ 149 Palestine √ √ 150 Oman √ √ 151 Qatar √ √ 152 Saudi Arabia √ √ 153 Syria √ √ 154 Tunisia √ √ 155 Turkey √ √ 156 United Arab Emirates √ √ 157 Yemen √ √ 160 Afghanistan √ √ 161 Bangladesh √ √ 162 Bhutan √ √ 163 India √ √ 164 Nepal √ √ 165 Pakistan √ √ 168 Angola √ √ 169 Central African Republic √ √ 170 Congo √ √ 171 Democratic Republic of the Congo √ √ 172 Equatorial Guinea √ √ 173 Gabon √ √ 175 Burundi √ √ 176 Comoros √ √ 177 Djibouti √ √ 178 Eritrea √ √ 179 Ethiopia √ √ 180 Kenya √ √ 181 Madagascar √ √ 182 Malawi √ √ 183 Mauritius √ √ 184 Mozambique √ √ 185 Rwanda √ √ 186 Seychelles √ √ 187 Somalia √ 189 Tanzania √ √ 190 Uganda √ √ 191 Zambia √ √ 193 Botswana √ √ 194 Lesotho √ √ 195 Namibia √ √ 196 South Africa √ √ 197 Swaziland √ √ 198 Zimbabwe √ √ 200 Benin √ √ 201 Burkina Faso √ √ 202 Cameroon √ √ 203 Cape Verde √ √ 204 Chad √ √ 205 Cote d'Ivoire √ √ 206 The Gambia √ √ 207 Ghana √ √ 208 Guinea √ √ 209 Guinea-Bissau √ √ 210 Liberia √ √ 211 Mali √ √ 212 Mauritania √ √ 213 Niger √ √ 214 Nigeria √ √ 215 Sao Tome and Principe √ √ 216 Senegal √ √ 217 Sierra Leone √ √ 218 Togo √ √ 298 American Samoa √ 305 Bermuda √ 349 Greenland √ 351 Guam √ 376 Northern Mariana Islands √ 385 Puerto Rico √ 422 Virgin Islands, U.S. √ 435 South Sudan √ √ 522 Sudan √ √ Note. aCountry_id for geographic variables comes from the GBD Study 2017 database that creates and stores unique numeric identifiers. Table S1. Countries included in the GBD study 2017 and human development report
Location_ida Location_name Levelb 67 Japan 0 35446 Aichi 1 35428 Akita 1 35425 Aomori 1 35435 Chiba 1 35461 Ehime 1 35441 Fukui 1 35463 Fukuoka 1 35430 Fukushima 1 35444 Gifu 1 35433 Gunma 1 35457 Hiroshima 1 35424 Hokkaidō 1 35451 Hyōgo 1 35431 Ibaraki 1 35440 Ishikawa 1 35426 Iwate 1 35460 Kagawa 1 35469 Kagoshima 1 35437 Kanagawa 1 35462 Kōchi 1 35466 Kumamoto 1 35449 Kyōto 1 35447 Mie 1 35427 Miyagi 1 35468 Miyazaki 1 35443 Nagano 1 35465 Nagasaki 1 35452 Nara 1 35438 Niigata 1 35467 Ōita 1 35456 Okayama 1 35470 Okinawa 1 35450 Ōsaka 1 35464 Saga 1 35434 Saitama 1 35448 Shiga 1 35455 Shimane 1 35445 Shizuoka 1 35432 Tochigi 1 35459 Tokushima 1 35436 Tōkyō 1 35454 Tottori 1 35439 Toyama 1 35453 Wakayama 1 35429 Yamagata 1 35458 Yamaguchi 1 35442 Yamanashi 1 102 United States 0 523 Alabama 1 524 Alaska 1 525 Arizona 1 526 Arkansas 1 527 California 1 528 Colorado 1 529 Connecticut 1 530 Delaware 1 531 District of Columbia 1 532 Florida 1 533 Georgia 1 534 Hawaii 1 535 Idaho 1 536 Illinois 1 537 Indiana 1 538 Iowa 1 539 Kansas 1 540 Kentucky 1 541 Louisiana 1 542 Maine 1 543 Maryland 1 544 Massachusetts 1 545 Michigan 1 546 Minnesota 1 547 Mississippi 1 548 Missouri 1 549 Montana 1 550 Nebraska 1 551 Nevada 1 552 New Hampshire 1 553 New Jersey 1 554 New Mexico 1 555 New York 1 556 North Carolina 1 557 North Dakota 1 558 Ohio 1 559 Oklahoma 1 560 Oregon 1 561 Pennsylvania 1 562 Rhode Island 1 563 South Carolina 1 564 South Dakota 1 565 Tennessee 1 566 Texas 1 567 Utah 1 568 Vermont 1 569 Virginia 1 570 Washington 1 571 West Virginia 1 572 Wisconsin 1 573 Wyoming 1 93 Sweden 0 4944 Stockholm 1 4940 Sweden except Stockholm 1 95 United Kingdom 0 4749 England 1 4621 East Midlands 2 4623 East of England 2 4624 Greater London 2 4618 North East England 2 4619 North West England 2 4625 South East England 2 4626 South West England 2 4622 West Midlands 2 4620 Yorkshire and the Humber 2 433 Northern Ireland 1 434 Scotland 1 4636 Wales 1 130 Mexico 0 4643 Aguascalientes 1 4644 Baja California 1 4645 Baja California Sur 1 4646 Campeche 1 4649 Chiapas 1 4650 Chihuahua 1 4647 Coahuila 1 4648 Colima 1 4652 Durango 1 4653 Guanajuato 1 4654 Guerrero 1 4655 Hidalgo 1 4656 Jalisco 1 4657 México 1 4651 Mexico City 1 4658 Michoacán de Ocampo 1 4659 Morelos 1 4660 Nayarit 1 4661 Nuevo León 1 4662 Oaxaca 1 4663 Puebla 1 4664 Querétaro 1 4665 Quintana Roo 1 4666 San Luis Potosí 1 4667 Sinaloa 1 4668 Sonora 1 4669 Tabasco 1 4670 Tamaulipas 1 4671 Tlaxcala 1 4672 Veracruz de Ignacio de la Llave 1 4673 Yucatán 1 4674 Zacatecas 1 135 Brazil 0 4750 Acre 1 4751 Alagoas 1 4753 Amapá 1 4752 Amazonas 1 4754 Bahia 1 4755 Ceará 1 4756 Distrito Federal 1 4757 Espírito Santo 1 4758 Goiás 1 4759 Maranhão 1 4762 Mato Grosso 1 4761 Mato Grosso do Sul 1 4760 Minas Gerais 1 4763 Pará 1 4764 Paraíba 1 4765 Paraná 1 4766 Pernambuco 1 4767 Piaui 1 4768 Rio de Janeiro 1 4769 Rio Grande do Norte 1 4772 Rio Grande do Sul 1 4770 Rondônia 1 4771 Roraima 1 4773 Santa Catarina 1 4775 São Paulo 1 4774 Sergipe 1 4776 Tocantins 1 11 Indonesia 0 4709 Aceh 1 4726 Bali 1 4717 Bangka-Belitung Islands 1 4725 Banten 1 4715 Bengkulu 1 4737 Gorontalo 1 4720 Jakarta 1 4713 Jambi 1 4721 West Java 1 4722 Central Java 1 4724 East Java 1 4729 West Kalimantan 1 4731 South Kalimantan 1 4730 Central Kalimantan 1 4732 East Kalimantan 1 4719 North Kalimantan 1 4718 Riau Islands 1 4716 Lampung 1 4739 Maluku 1 4740 North Maluku 1 4727 West Nusa Tenggara 1 4728 East Nusa Tenggara 1 4742 Papua 1 4741 West Papua 1 4712 Riau 1 4738 West Sulawesi 1 4735 South Sulawesi 1 4734 Central Sulawesi 1 4736 Southeast Sulawesi 1 4733 North Sulawesi 1 4711 West Sumatra 1 4714 South Sumatra 1 4710 North Sumatra 1 4723 Yogyakarta 1 Note. aLocation_id for geographic variables comes from the GBD Study 2017 database that creates and stores unique numeric identifiers. bLevel: Level 0 = country. Levels 1 and 2 = subnational regions. Table S2. Subnational regions included in the GBD study 2017
Covariate Definition Source Period Risk factors
in the GBDMale to female sex ratio Sex ratio of the total population (males per 100 females) United Nations, Department of Economic and Social Affairs, Population Division (2017). World Population Prospects: The 2017 Revision, DVD Edition. 2015 Population using solid fuels (%) The percentage of the population that relies on solid fuels as the primary source of domestic energy for cooking and heating World Health Organization. Available from http://apps.who.int/gho/data/view.main.1701?lang=en 2013 Yes Age-standardized prevalence of current tobacco smoking (%) The percentage of the population aged 15 years and over who currently use any tobacco product (smoked and/or smokeless tobacco) on a daily or nondaily basis. Note that most countries collect data about smoking but not smokeless tobacco use, leaving gaps in tobacco use data and preventing global and regional summaries of tobacco use rates. Until data improve, the estimates will reflect the percentage of the population aged 15 years and over who currently smoke. World Health Organization. Available from http://apps.who.int/gho/data/node.imr.SDGTOBACCO?lang=en 2016 Yes Age-standardized diabetes mellitus prevalence (%) Age-standardized diabetes mellitus prevalence (%) both sexes Global Burden of Disease Collaborative Network.Global Burden of Disease Study 2017 (GBD 2017) Results.Seattle, United States: Institute for Health Metrics and Evaluation (IHME), 2018.Available from http://ghdx.healthdata.org/gbd-results-tool. 2017 Yes Population living in urban areas (%) The percentage of the de facto population living in areas classified as urban according to the criteria used by each area or country as of 1 July of the year indicated. World Health Organization. Available from http://apps.who.int/gho/data/node.imr.WHS9_96?lang=en 2010 BMI mean (kg·m−2) BMI mean trends among adults, age-standardized (kg/m2) World Health Organization. Available from http://apps.who.int/gho/data/node.main.BMIANTHROPOMETRY?lang=en 2016 Yes GDP per capita (USD) GDP per capita (current US$) World Bank national accounts data and OECD National Accounts data files. 2014 Table S3. Additional information on the covariates used in the multivariate linear regression analysis at the country level
-
Global Burden of Cataract Blindness The GBD study 2017 provides YLD to quantify the burden of cataract blindness. Age-standardized YLD rates associated with blindness due to cataracts were analyzed. The data were derived from the open-access database of the Global Burden of Disease study 2017
(http://ghdx.healthdata.org/gbd-results-tool ), which contains quantitative data on nonfatal health outcomes in terms of YLDs for a list of 354 GBD causes according to different severity splits in 195 countries[13]. The YLDs were estimated as the product of a prevalence estimate and a disability weight for the health states of each mutually exclusive sequela, adjusted for comorbidity[13]. Disability weights employed numbers on a scale from 0 to 1 that represented the severity of health loss associated with a single given health state. Regarding cataracts (International Classification of Diseases 10th Revision (ICD-10) codes H25-H26 and H28-H28.8), the disability weight was 0.187 (0.124–0.260) for blindness[13]. YLD rates were calculated by dividing the number of YLDs by the relevant population. The GBD study 2017 reference population was used to calculate the age-standardized YLD rate[14]. The following GBD study 2017 data concerning cataract blindness were collected as the outcome variables: (1) national age-standardized YLD rates owing to cataract blindness in 2017 and (2) subnational age-standardized YLD rates owing to cataract blindness in 2017. Because the GBD study data can be downloaded from an open access database, ethics approval and informed consent were not required for this study.Human Development Index The human development index (HDI), as a regional socioeconomic indicator, is a composite measure of health, education, and income, measured by life expectancy at birth, mean years of schooling and gross national income per capita, respectively[15]. A higher HDI value indicates a higher level of socioeconomic development, ranging from 0 to 1. Country-level HDI data were obtained from the Human Development Report 2018 released by the United Nations Development Programme (UNDP) (http://hdr.undp.org/en/data). Subnational-level HDI data were obtained from The Global Data Lab (
https://hdi.globaldatalab.org/areadata/shdi/ ) of the Institute for Management Research, Radboud University. Using the UNDP categorization[15], countries and subnational regions were divided into four socioeconomic groups: the low-HDI group (less than 0.550), medium-HDI group (0.550–0.699), high-HDI group (0.700–0.799) and very-high-HDI group (0.800 or greater).Solar Ultraviolet Radiation Exposure The estimated daily cloud-adjusted ambient solar UVR data were obtained from NASA Goddard Earth Sciences Data and Information Services Center readings from the Ozone Monitoring Instrument (OMI) mounted on the NASA Earth Observing System Auraspacecraft[16]. The OMI is a nadir viewing spectrometer that measures solar reflected and backscattered radiation in the 270–500 nm wavelength range with a spectral resolution of approximately 0.5 nm in the UVR range. The OMI ultraviolet data consider the impact of altitude, ozone, surface albedo, aerosols and cloud coverage to accurately measure the amount of solar UVR that reaches the Earth’s surface[17]. We estimated the UVR for analysis by averaging the daily estimates (in J/m2) in 2015 with an OMI Level 3 surface UV irradiance product, which was provided on a 1° × 1° (longitude × latitude) grid, with each cell covering an area of 110 km (north–south) × 66 km (east–west) according to the World Geodetic System 84 coordinate system. An average daily UVR level was obtained for each country using ArcGIS version 10.2 software (
http://www.esri.com/software/arcgis/index.html ). First, we built a raster layer in the ArcGIS program with UVR data. Second, we built a superimposed polygon vector layer on the basis of the raster layer with a world map of national and subnational borders. Third, we used the zonal statistics tool to quantify the UVR level per country. Subnational UVR data were calculated for limited countries with the corresponding value of the subnational burden of cataract blindness provided by the GBD study 2017 following similar procedures. -
The covariates were selected based on the GBD study 2017 (Supplementary Table S4 available in www.besjournal.com) and previous literature[4, 5, 6]. We further selected covariates if they showed a significant association (P < 0.05) with the burden of cataract blindness in the univariate analysis or if one of the regression coefficients changed by at least 10% after covariates were added to the multivariable-adjusted model. Overall, we controlled for the following potential confounding variables: country-specific male to female sex ratio, proportion of population using solid fuels, age-standardized prevalence of current tobacco smoking, age-standardized diabetes mellitus prevalence, proportion of population living in urban areas, population-mean body mass index (BMI), and GDP per capita at nominal values. Supplementary Table S3 in lists additional information for each confounder. Subnational-level covariates including male to female ratio, age-standardized diabetes mellitus prevalence and GDP per capita at nominal values were measured by region (Supplementary Table S5 available in www.besjournal.com). Other subnational variables were supposed to be homogeneous within each country.
Risk factors Exposure definition Household air pollution from solid fuels Individual exposure to PM2.5 due to the use of solid cooking fuel. Smoking The prevalence of the current use of any smoked tobacco product and the prevalence of former use of any smoked tobacco product. Among current smokers, cigarette equivalents smoked per smoker per day and cumulative pack-years of exposure. Among former smokers, number of years since quitting. High fasting plasma glucose Serum fasting plasma glucose measured in mmol/L. High BMI BMI, measured in kg/m2. Table S4. GBD study 2017 risk factors and accompanying exposure definitions for cataracts
Country Information source Japan Sex male to female ratio Statistics Bureau. JAPAN STATISTICAL YEARBOOK 2018. Geography and Population. Population by Prefecture (1920 to 2016). Available from http://www.stat.go.jp/english/data/nenkan/67nenkan/index.html Age-standardized diabetes mellitus prevalence (%) Global Burden of Disease Collaborative Network.Global Burden of Disease Study 2017 (GBD 2017) Results.Seattle, United States: Institute for Health Metrics and Evaluation (IHME), 2018.Available from http://ghdx.healthdata.org/gbd-results-tool. GDP per capita (USD) The Organisation for Economic Co-operation and Development (OECD). Stats. Regional Statistics. Regional Economy. Regional GDP per Capita. Available from https://stats.oecd.org/ United States Sex male to female ratio United States Census Bureau. American Fact Finder. Annual Estimates of the Resident Population for Selected Age Groups by Sex for the United States, States, Counties, and Puerto Rico Commonwealth and Municipios: April 1, 2010 to July 1, 2017. Available from https://factfinder.census.gov/faces/nav/jsf/pages/download_center.xhtml#none Age-standardized diabetes mellitus prevalence (%) Global Burden of Disease Collaborative Network.Global Burden of Disease Study 2017 (GBD 2017) Results.Seattle, United States: Institute for Health Metrics and Evaluation (IHME), 2018.Available from http://ghdx.healthdata.org/gbd-results-tool. GDP per capita (USD) The Organisation for Economic Co-operation and Development (OECD). Stats. Regional Statistics. Regional Economy. Regional GDP per Capita. Available from https://stats.oecd.org/. Sweden Sex male to female ratio European statistics. Population on 1 January by age, sex and NUTS 2 region (demo_r_d2jan). Eurostat Data Explorer. Available from https://ec.europa.eu/eurostat/web/regions/data/database Age-standardized diabetes mellitus prevalence (%) Global Burden of Disease Collaborative Network.Global Burden of Disease Study 2017 (GBD 2017) Results.Seattle, United States: Institute for Health Metrics and Evaluation (IHME), 2018.Available from http://ghdx.healthdata.org/gbd-results-tool. GDP per capita (USD) 2014 GDP per capita: Twenty-one regions below half of the EU average. European statistics. News releases 2016. Archived from https://ec.europa.eu/eurostat/documents/2995521/7192292/1-26022016-AP-EN.pdf/602b34e8-abba-439e-b555-4c3cb1dbbe6e United Kingdom Sex male to female ratio European statistics. Population on 1 January by age, sex and NUTS 2 region (demo_r_d2jan). Eurostat Data Explorer. Available from https://ec.europa.eu/eurostat/web/regions/data/database. Age-standardized diabetes mellitus prevalence (%) Global Burden of Disease Collaborative Network.Global Burden of Disease Study 2017 (GBD 2017) Results.Seattle, United States: Institute for Health Metrics and Evaluation (IHME), 2018.Available from http://ghdx.healthdata.org/gbd-results-tool. GDP per capita (USD) 2014 GDP per capita: Twenty-one regions below half of the EU average. European statistics. News releases 2016. Archived from https://ec.europa.eu/eurostat/documents/2995521/7192292/1-26022016-AP-EN.pdf/602b34e8-abba-439e-b555-4c3cb1dbbe6e. Mexico Sex male to female ratio The Organisation for Economic Co-operation and Development (OECD). Stats. Regional Statistics. Regional Demography. Sex Ratio, Total Population (% population males over females). Available from https://stats.oecd.org/. Age-standardized diabetes mellitus prevalence (%) Global Burden of Disease Collaborative Network.Global Burden of Disease Study 2017 (GBD 2017) Results.Seattle, United States: Institute for Health Metrics and Evaluation (IHME), 2018.Available from http://ghdx.healthdata.org/gbd-results-tool. GDP per capita (USD) Instituto Nacional De Estadística y Geografía (INEGI). Estadística - Producto interno bruto por entidad federativa, base 2013 Información. Available from https://www.inegi.org.mx/sistemas/bie/?idserPadre=10200070#D10200070. Brazil Sex male to female ratio The Organisation for Economic Co-operation and Development (OECD). Stats. Regional Statistics. Regional Demography. Sex Ratio, Total Population (% population males over females). Available from https://stats.oecd.org/. Age-standardized diabetes mellitus prevalence (%) Global Burden of Disease Collaborative Network.Global Burden of Disease Study 2017 (GBD 2017) Results.Seattle, United States: Institute for Health Metrics and Evaluation (IHME), 2018.Available from http://ghdx.healthdata.org/gbd-results-tool. GDP per capita (USD) IBGE: Instituto Brasileiro de Geografia e Estatística. Economic Statistics. Regional Accounts 2014: five states account for nearly two thirds of Brazilian GDP. Available from https://agenciadenoticias.ibge.gov.br/en/agencia-press-room/2185-news-agency/releases-en/10156-regional-accounts-2014-five-states-account-for-nearly-two-thirds-of-brazilian-gdp. Indonesia Sex male to female ratio 2010 Population Census Data - Statistics Indonesia. Population by Age Group, Urban/Rural, and Sex in Provinces of Indonesia. Available from https://sp2010.bps.go.id/ Age-standardized diabetes mellitus prevalence (%) Global Burden of Disease Collaborative Network.Global Burden of Disease Study 2017 (GBD 2017) Results.Seattle, United States: Institute for Health Metrics and Evaluation (IHME), 2018.Available from http://ghdx.healthdata.org/gbd-results-tool. GDP per capita (USD) Statistics Indonesia. Statistical Yearbook of Indonesia 2015. Available from https://www.bps.go.id/publication/2015/08/12/5933145e1d037f5148a67bac/statistik-indonesia-2015.html. Table S5. Information sources for subnational-level data per country
-
Data are presented as the mean ± standard deviation (SD) or median (interquartile) for continuous variables and as frequency or percentage for categorical variables. Linear regression models were used to evaluate the associations between HDI, UVR exposure, and cataract age-standardized YLD rate owing to blindness using country-level data and subnational-level data in three steps. First, we examined conditions of normality and log-transformed the outcome measures if the normality assumption was violated. Second, we built an adjusted model depending on the inclusion of covariates. Third, interaction and stratified analyses were conducted according to UVR exposure (high UVR and low UVR), HDI status (low HDI, medium HDI, high HDI, and very high HDI), and the burden of cataract-related blindness. All analyses were performed with the statistical software packages R (
http://www.R-project.org , The R Foundation) and EmpowerStats (http://www.empowerstats.com , X&Y Solutions, Inc., Boston, MA). A two-sided significance level of 0.05 was used to evaluate statistical significance. -
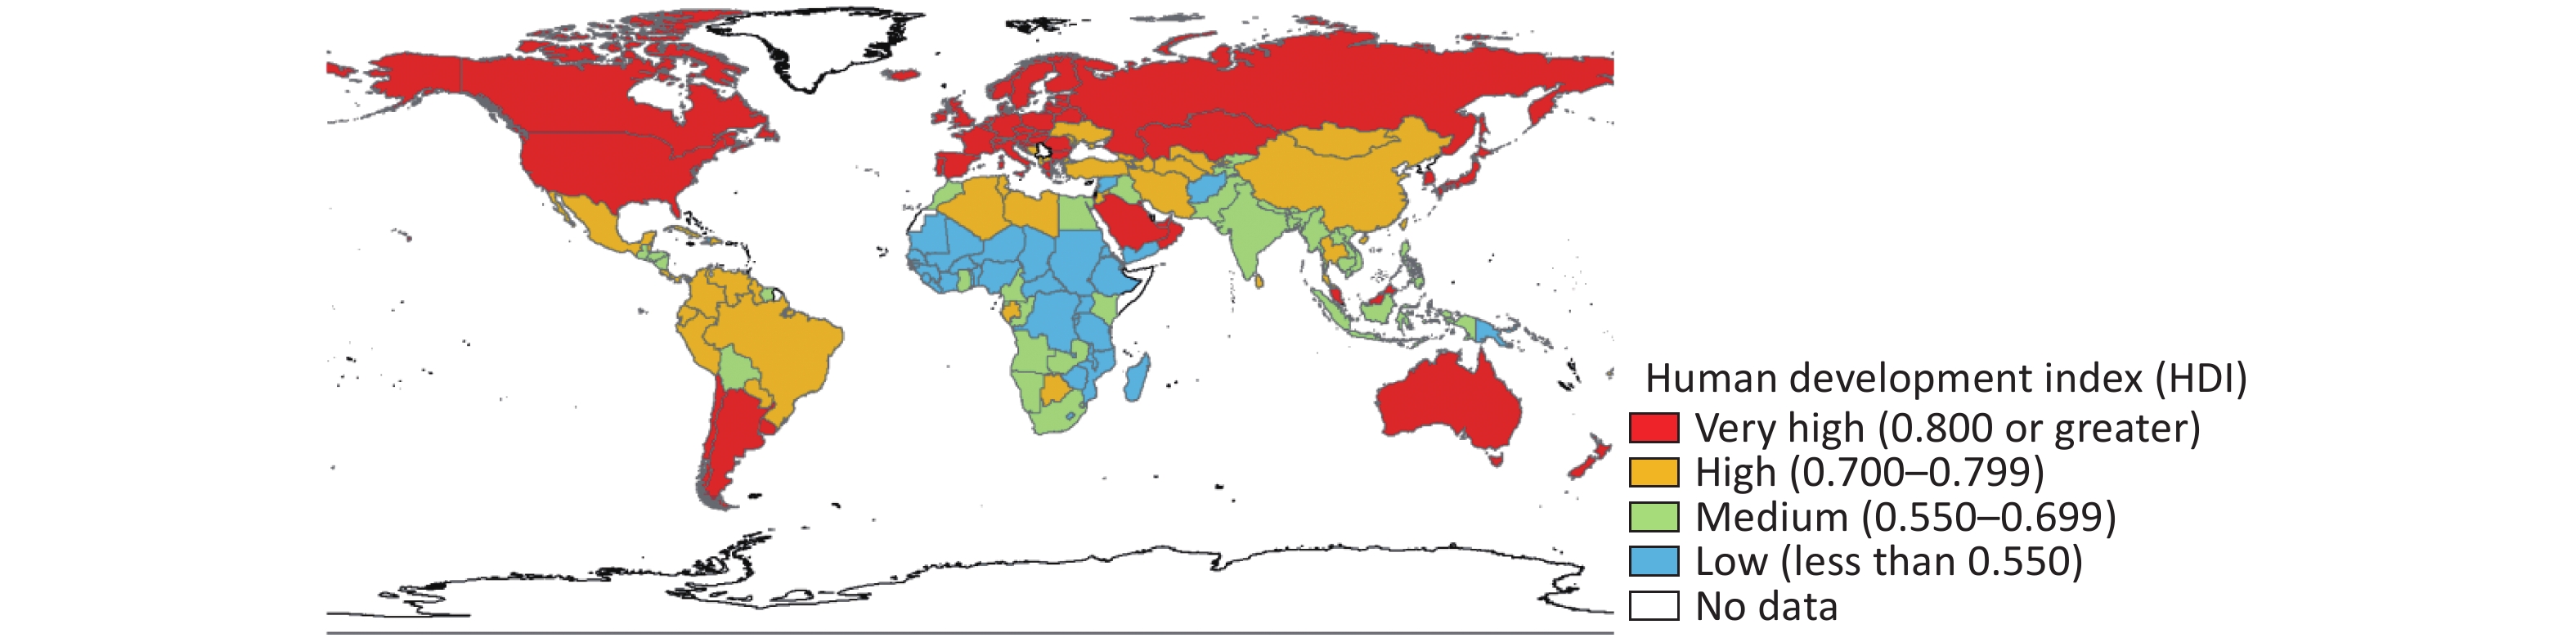
The GBD study 2017 was based on a geographical hierarchy that included 195 countries and territories, of which 185 countries were also included in the Human Development Report. Both HDI and age-standardized YLD rates in 2017 were available for 185 countries (Table 1, Supplementary Table S1), covering 94.87% of all countries and territories worldwide (Supplementary Figure S1 available in www.besjournal.com), including 38 very-high-HDI, 39 high-HDI, 51 medium-HDI and 57 low-HDI countries. The global distribution of country-specific age-standardized YLD rates owing to blindness in 2017 was unequal (Supplementary Figure S2 available in www.besjournal.com). The geometric means of age-standardized YLD rates owing to blindness in each HDI group ranked from low to very high HDI, were as follows: 77.98, 45.47, 19.51, and 10.48. The subnational estimation of age-standardized YLD rates owing to blindness in the GBD study 2017 included 206 subnational regions belonging to seven countries: Japan, the United States, Sweden, the United Kingdom, Mexico, Brazil, and Indonesia (Supplementary Table S5). Of these subnational regions, 22 were in the medium-HDI group, 63 were in the high-HDI group, and 121 were in the very-high-HDI group, and the corresponding geometric mean of age-standardized YLD rates owing to blindness were 122.28, 51.28, and 4.64, respectively. Additional characteristics of the covariates in this study, stratified by the HDI of included countries and subnational regions, are shown in Table 1 and Supplementary Table S6 (available in www.besjournal.com). The mean country-specific daily UVR levels ranged from 732.19 to 4876.66 J·m−2·day−1 (Supplementary Figure S3 available in www.besjournal.com). The mean daily UVR exposure doses declined from 3,696.64 (low HDI), 3,529.58 (medium HDI), 3,133.49 (high HDI), to 1,858.61 J·m−2·day−1 (very high HDI) with the increase in HDI at the country level, and the trend was also observed at the subnational level, with a range from 4,430.78 (medium HDI) and 3,835.03 (high HDI) to 1,731.55 J·m−2·day−1 (very high HDI).
Characteristics Total HDI categoriesd Low HDI Medium HDI High HDI Very high HDI Countries na (%) 185 38 (20.54) 39 (21.08) 51 (27.57) 57 (30.81) Blindness age-standardized YLD rate per 100,000 populationb 25.59 ± 3.39 77.98 ± 1.80 45.47 ± 2.65 19.51 ± 3.07 10.48 ± 2.64 Mean UVR exposure (J·m−2·day−1)c 2939.86 ± 1143.85 3696.64 ± 453.50 3529.58 ± 657.50 3133.49 ± 1097.47 1858.61 ± 969.23 Male to female sex ratio 102.00 ± 22.09 99.56 ± 2.64 100.25 ± 5.64 99.45 ± 5.98 107.11 ± 38.81 Population using solid fuels (%) 34.91 ± 34.73 81.26 ± 22.64 52.72 ± 27.82 18.82 ± 19.04 6.23 ± 4.93 Age-standardized prevalence of current tobacco smoking (%) 21.40 ± 8.77 13.76 ± 5.84 22.44 ± 8.72 22.18 ± 7.45 25.09 ± 8.60 Age-standardized diabetes mellitus prevalence (%) 7.99 ± 3.08 6.99 ± 2.41 8.82 ± 3.74 8.81 ± 3.64 7.37 ± 1.96 Population living in urban areas (%) 55.35 ± 22.99 33.67 ± 14.73 42.89 ± 14.66 56.77 ± 19.61 77.06 ± 14.01 BMI mean (kg·m−2) 25.69 ± 2.19 23.41 ± 1.55 24.94 ± 2.39 26.93 ± 1.69 26.61 ± 1.27 GDP per capita (USD)e 5466.43 839.17 2842.94 6492.05 28671.35 Note. aFor which data are available. bGeometric mean ± SD. cMean ± SD (all such values). dCategorized as follows: < 0.550 (low HDI); 0.550–0.699 (medium HDI); 0.700–0.799 (high HDI); > 0.800 (very high HDI). eMedian. Table 1. Characteristics of included countries

Figure S1. Global map of the HDI in countries included in the GBD study 2017. HDI, human development index; GBD, Global Burden of Disease
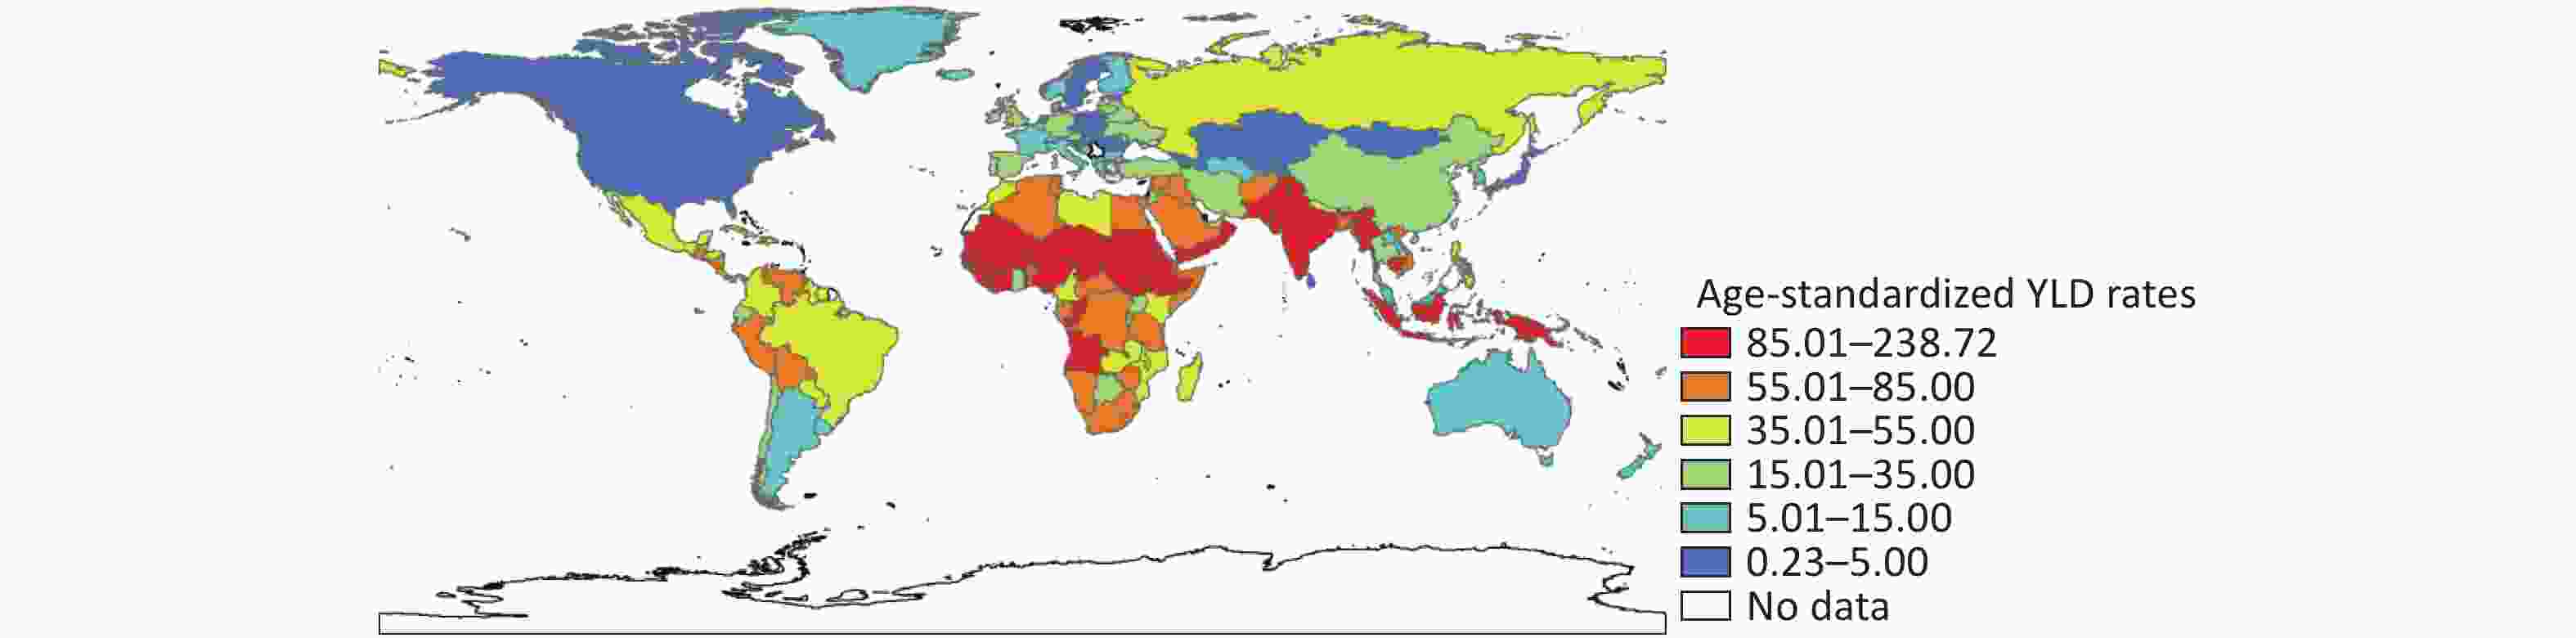
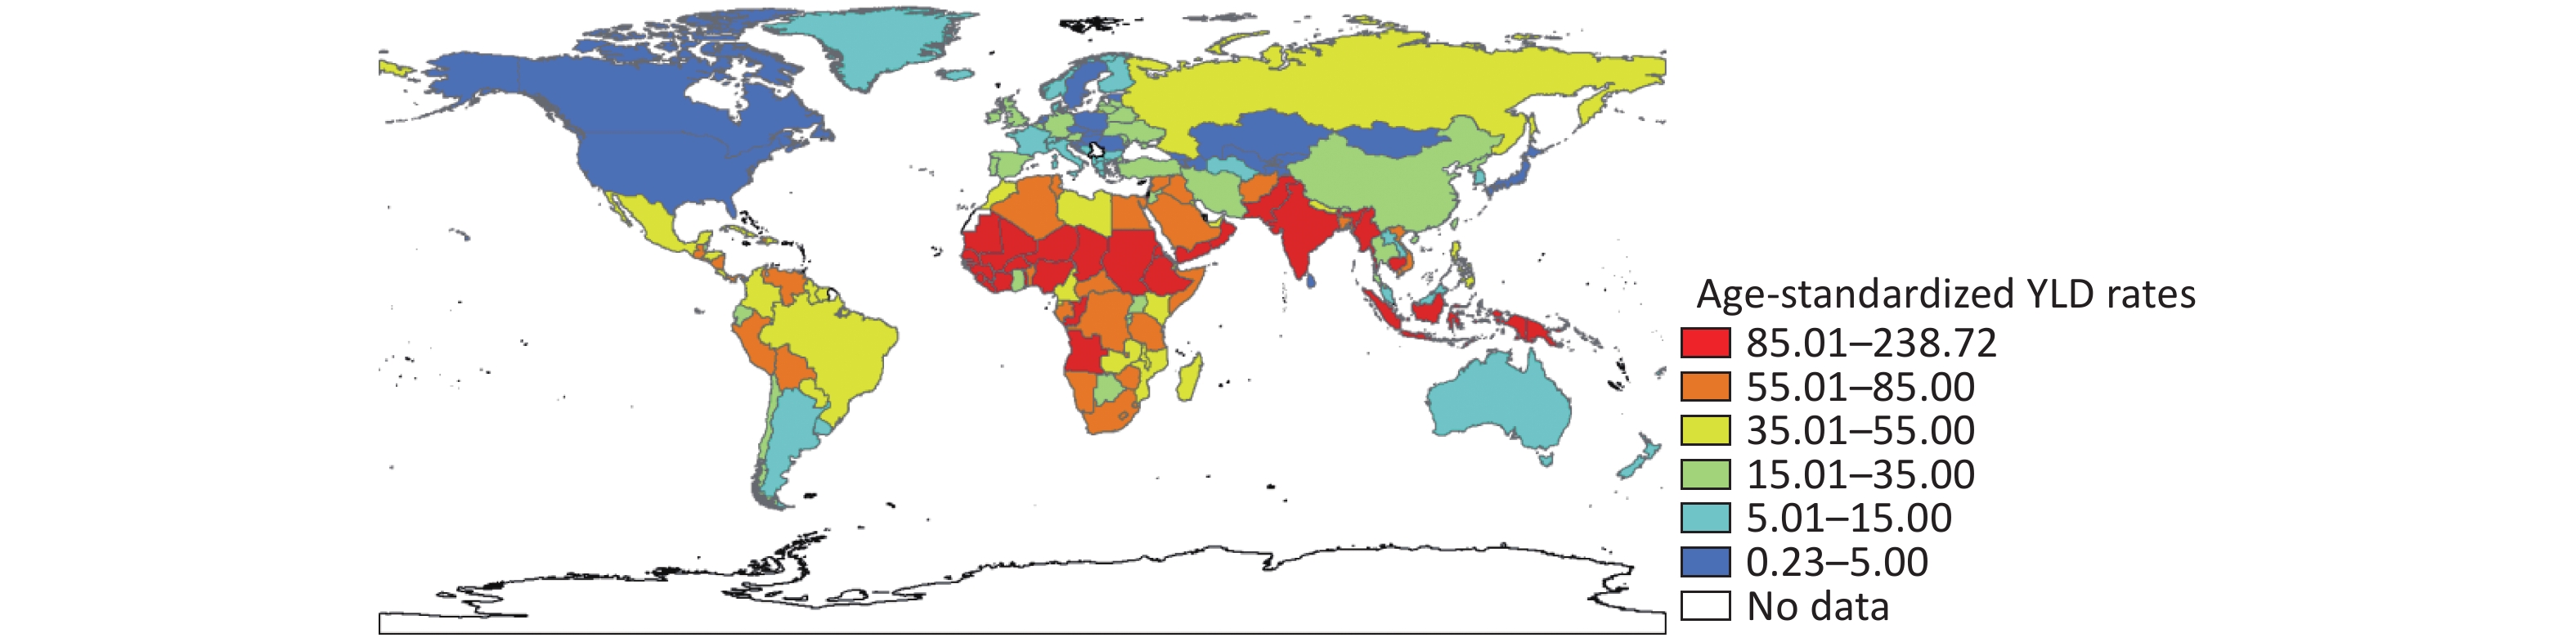
Figure S2. Global map of health burden of cataract-related blindness with age-standardized YLD rates in 2017. YLD, year lived with disability
Characteristics Total HDId Medium HDI High HDI Very high HDI Subnational regions na (%) 206 22 63 121 Blindness age-standardized YLD rate per 100,000 population b 13.71 ± 4.33 122.28 ± 1.26 51.28 ± 1.57 4.64 ± 2.13 Mean UVR exposure (J·m−2·day−1) c 2,660.06 ± 1,231.88 4,430.78 ± 282.59 3,825.03 ± 511.14 1,731.55 ± 535.56 Sex male to female ratio 97.42 ± 4.71 102.73 ± 5.16 98.42 ± 4.25 95.94 ± 4.01 Population using solid fuels (%) 12.17 ± 12.48 37.91 ± 5.12 15.83 ± 12.73 5.58 ± 2.34 Age-standardized prevalence of current tobacco smoking (%) 22.71 ± 8.27 38.35 ± 5.39 19.34 ± 10.36 21.63 ± 2.05 Age-standardized diabetes mellitus prevalence (%) 7.00 ± 2.70 9.96 ± 1.25 7.98 ± 3.26 5.96 ± 1.87 Population living in urban areas (%) 77.98 ± 13.23 51.17 ± 5.95 74.73 ± 13.09 84.55 ± 4.86 BMI mean (kg·m−2) 24.29 ± 4.77 23.32 ± 1.04 21.21 ± 6.36 26.08 ± 3.07 GDP per capita (USD) e 33,960.50 2713.26 11,731.00 40,380.00 Note. aFor which data are available. bGeometric mean ± SD. cMean ± SD (all such values). dCategorized as follows: 0.550–0.699 (medium HDI); 0.700–0.799 (high HDI); > 0.800 (very high HDI). eMedian. Table S6. Characteristics of included subnational regions
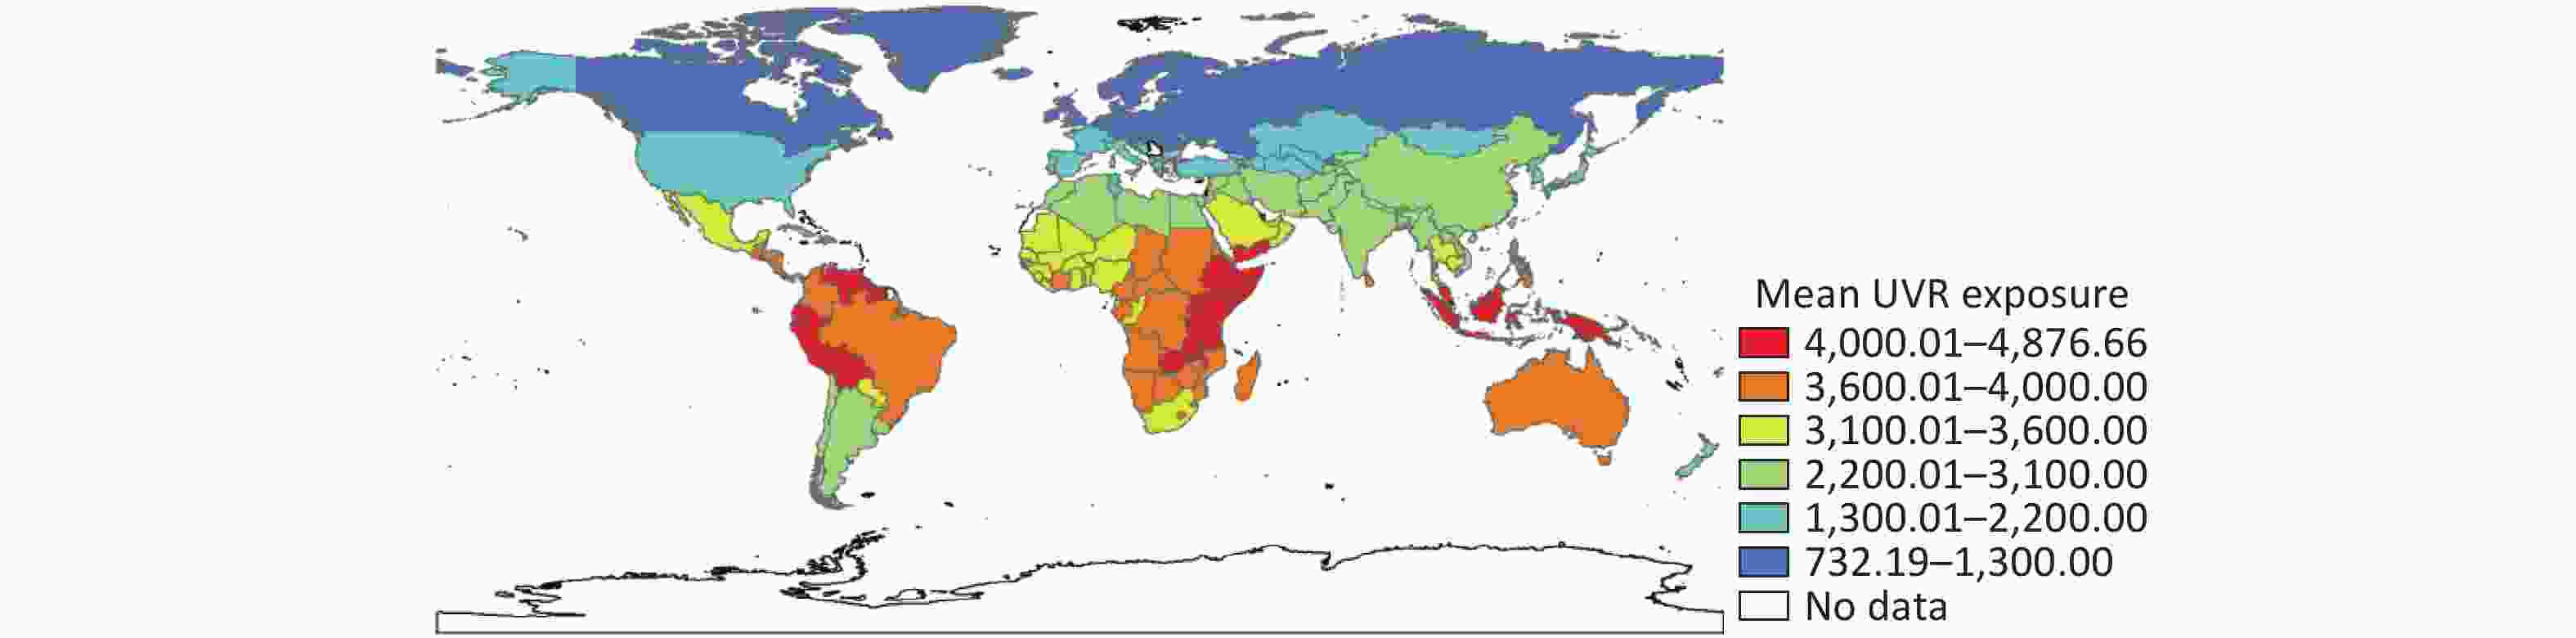
Figure S3. Global map of UVR levels in 2015. UVR, ultraviolet radiation
National and subnational age-standardized YLD rates were log-transformed because of violations of the assumption of normality. In univariate analyses, population using solid fuels, current tobacco smoking prevalence, urbanization, BMI and GDP were significantly associated with the age-standardized YLD rate (P < 0.001) at the country level, and all covariates were significantly associated with the age-standardized YLD rate (P < 0.001) at the subnational level (Supplementary Table S7 available in www.besjournal.com). Urbanization and population using solid fuels were excluded due to collinear relationships in the subnational analysis.
Variables Countries Subnational regions Regression coefficient a
(95% CI)P value Regression coefficient a
(95% CI)P value Male to female sex ratio 1.01 (1.00, 1.01) 0.103 1.15 (1.10, 1.19) < 0.001 Population using solid fuels (%) 1.02 (1.01, 1.02) < 0.001 1.09 (1.08, 1.11) < 0.001 Age-standardized prevalence of current tobacco smoking (%) 0.95 (0.93, 0.97) < 0.001 1.06 (1.04, 1.08) < 0.001 Age-standardized diabetes mellitus prevalence (%) 0.98 (0.93, 1.04) 0.493 1.33 (1.25, 1.42) < 0.001 Population living in urban areas (%) 0.98 (0.98, 0.99) < 0.001 0.92 (0.91, 0.93) < 0.001 BMI mean (kg·m−2) 0.80 (0.75, 0.87) < 0.001 0.88 (0.85, 0.92) < 0.001 GDP per capita per 1000 (USD) 0.98 (0.97, 0.99) < 0.001 0.97 (0.96, 0.97) < 0.001 Note. aAntilog values. Outcome measures were log-transformed in the analysis. Table S7. Univariate association between covariates and cataract blindness age-standardized YLD rate in countries
Linear regression analysis showed that HDI was negatively associated with cataract age-standardized YLD rate owing to blindness in the crude model. In multivariable analyses, a consistent reverse association between HDI and the burden of cataract-related blindness among countries was retained in the adjusted model (Table 2). The adjusted model was adjusted for male to female sex ratio, GDP, population using solid fuels, age-standardized prevalence of current tobacco smoking, age-standardized diabetes mellitus prevalence, population living in urban areas and BMI mean. Very-high-HDI countries had an 84% lower age-standardized YLD rate [95% confidence interval (CI): 60%–93%, P < 0.001] compared to low-HDI countries. For high-HDI countries, the proportion was 76% (95% CI: 53%–88%, P < 0.001), and for medium-HDI countries, the proportion was 48% (95% CI: 15%–68%, P = 0.010; P for trend < 0.001) (Table 2). Although there was a lack of low-HDI subnational regions, the association between HDI and the burden of cataract-related blindness in subnational-level analyses had a similar trend, but a lower magnitude than that in the country-level analyses.
Variables Crude model Adjusted modelc Regression coefficienta (95% CI) P value Regression coefficienta (95% CI) P value Countries HDI per 0.01 0.95 (0.94, 0.96) < 0.001 0.93 (0.91, 0.96) < 0.001 HDI categoriesb Low HDI 1.00 (reference) 1.00 (reference) Medium HDI 0.58 (0.38, 0.89) 0.014 0.52 (0.32, 0.85) 0.010 High HDI 0.25 (0.17, 0.37) < 0.001 0.24 (0.12, 0.47) < 0.001 Very high HDI 0.13 (0.09, 0.20) < 0.001 0.16 (0.07, 0.40) < 0.001 P value for trend < 0.001 < 0.001 Subnational regions HDI per 0.01 0.87 (0.86, 0.87) < 0.001 0.96 (0.94, 0.98) < 0.001 HDI categoriesb Medium HDI 1.00 (reference) 1.00 (reference) High HDI 0.42 (0.31, 0.57) < 0.001 0.93 (0.70, 1.25) 0.637 Very high HDI 0.04 (0.03, 0.05) < 0.001 0.62 (0.40, 0.97) 0.039 P value for trend < 0.001 0.021 Note. HDI, human development index. aAntilog values. Outcome measures were log-transformed in the analysis. bCategorized as follows: < 0.550 (low HDI); 0.550–0.699 (medium HDI); 0.700–0.799 (high HDI); > 0.800 (very high HDI). cAdjusted for male to female sex ratio, GDP, population using solid fuels, age-standardized prevalence of current tobacco smoking, age-standardized diabetes mellitus prevalence, population living in urban areas and BMI mean. Table 2. Multivariate linear regression model analysis of the relationship between HDI and cataract age-standardized YLD rates owing to blindness
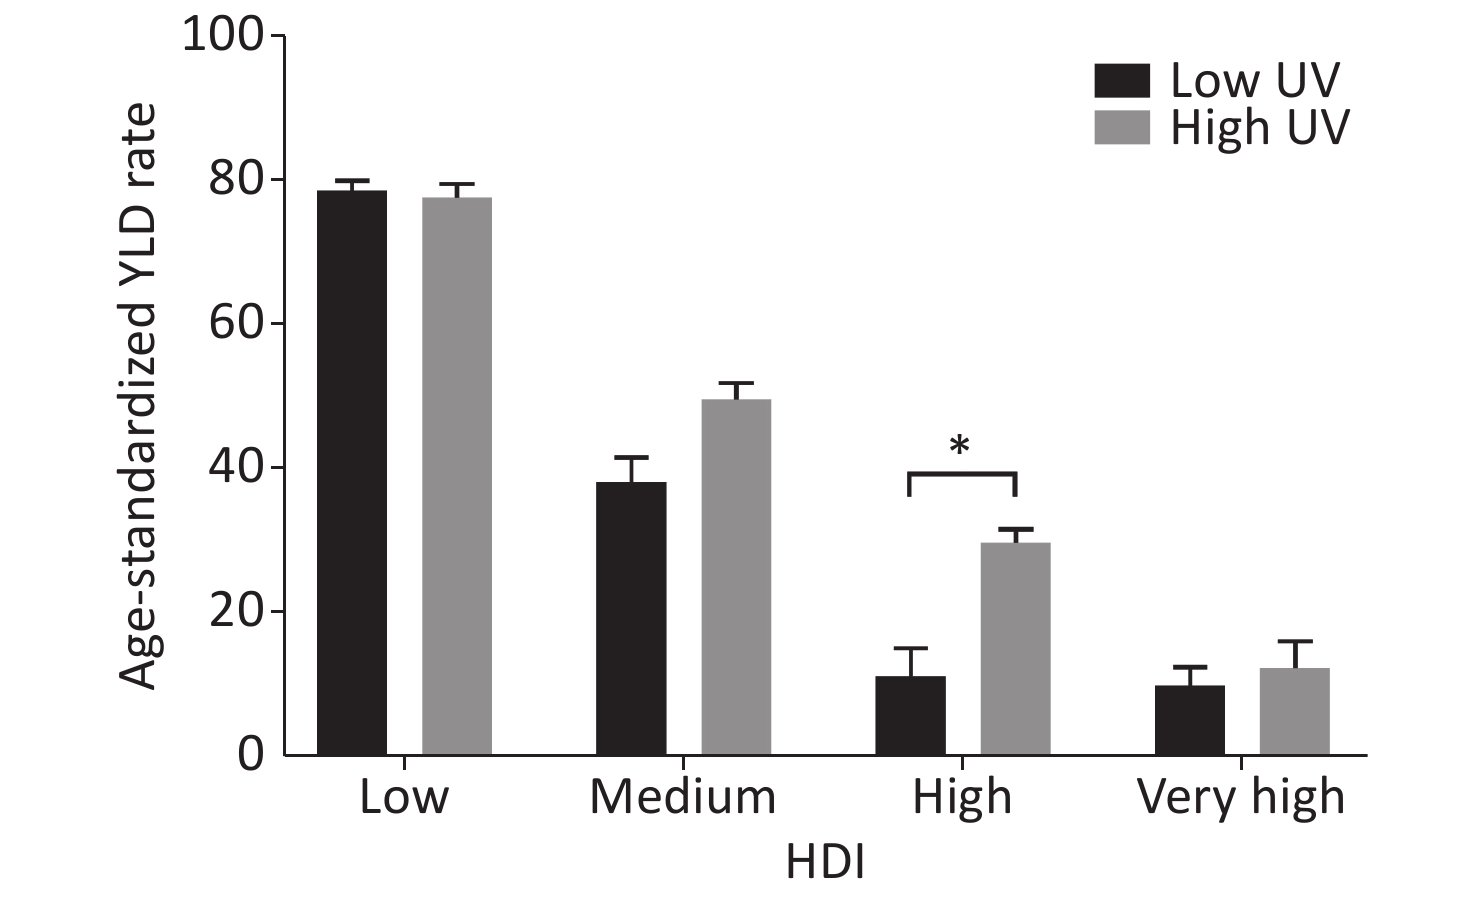
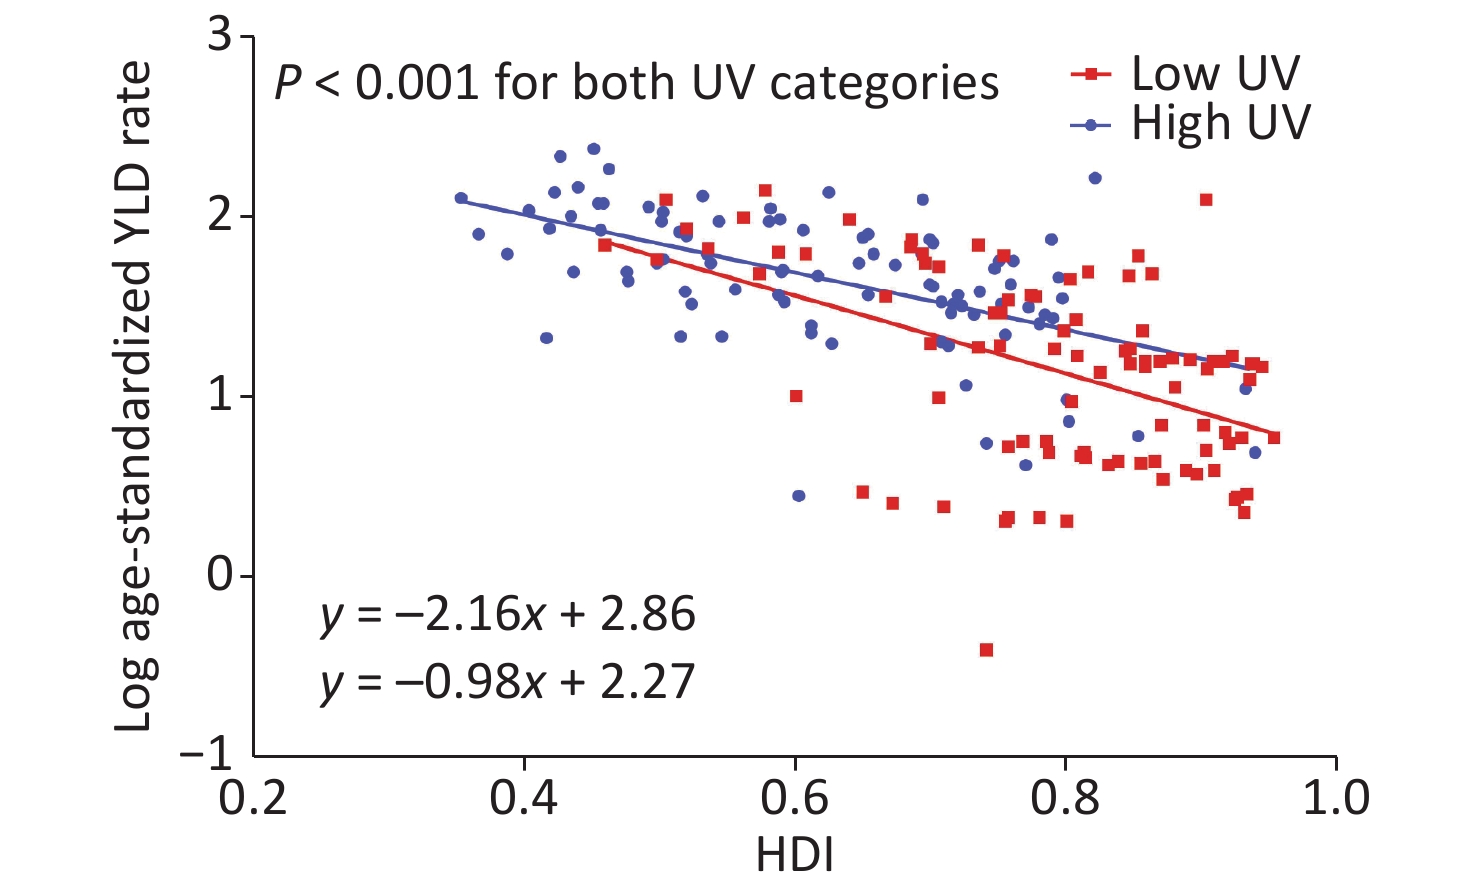
To assess potential effect modification by UVR exposure, we stratified the analysis by the median value of countries’ UVR exposure (high UVR > 3251.68 and low UVR ≤ 3251.68). The age-standardized YLD rate declined with increasing HDI levels in both UVR groups, and only countries with high HDIs in different UVR categories had significant differences (P < 0.05) (Figure 1). The mean UVR exposure of the low-UVR group decreased by the order of 2947.84 (low HDI), 2796.09 (medium HDI), 2073.29 (high HDI) and 1621.24 (very high HDI). Equivalent figures for the high-UVR group were 3810.10, 3940.34, 4004.37, and 3876.17, respectively. As shown in Figure 2 and Supplementary Figure S4 (available in www.besjournal.com), adjusted linear regression analysis indicated that the age-standardized YLD rate owing to cataract blindness was negatively correlated with HDI in both UVR categories in countries and subnational regions (P < 0.001). Table 3 presents the association of HDI with the cataract age-standardized YLD rate owing to blindness modified by UVR exposure in countries. UVR exposure was an effect modifier of HDI and the burden of cataract-related blindness in the adjusted model (P value for interaction = 0.047).

Figure 1. Geometric mean of age-standardized YLD rate owing to cataract blindness across categories of socioeconomic status expressed as HDI at the country level. *P < 0.05
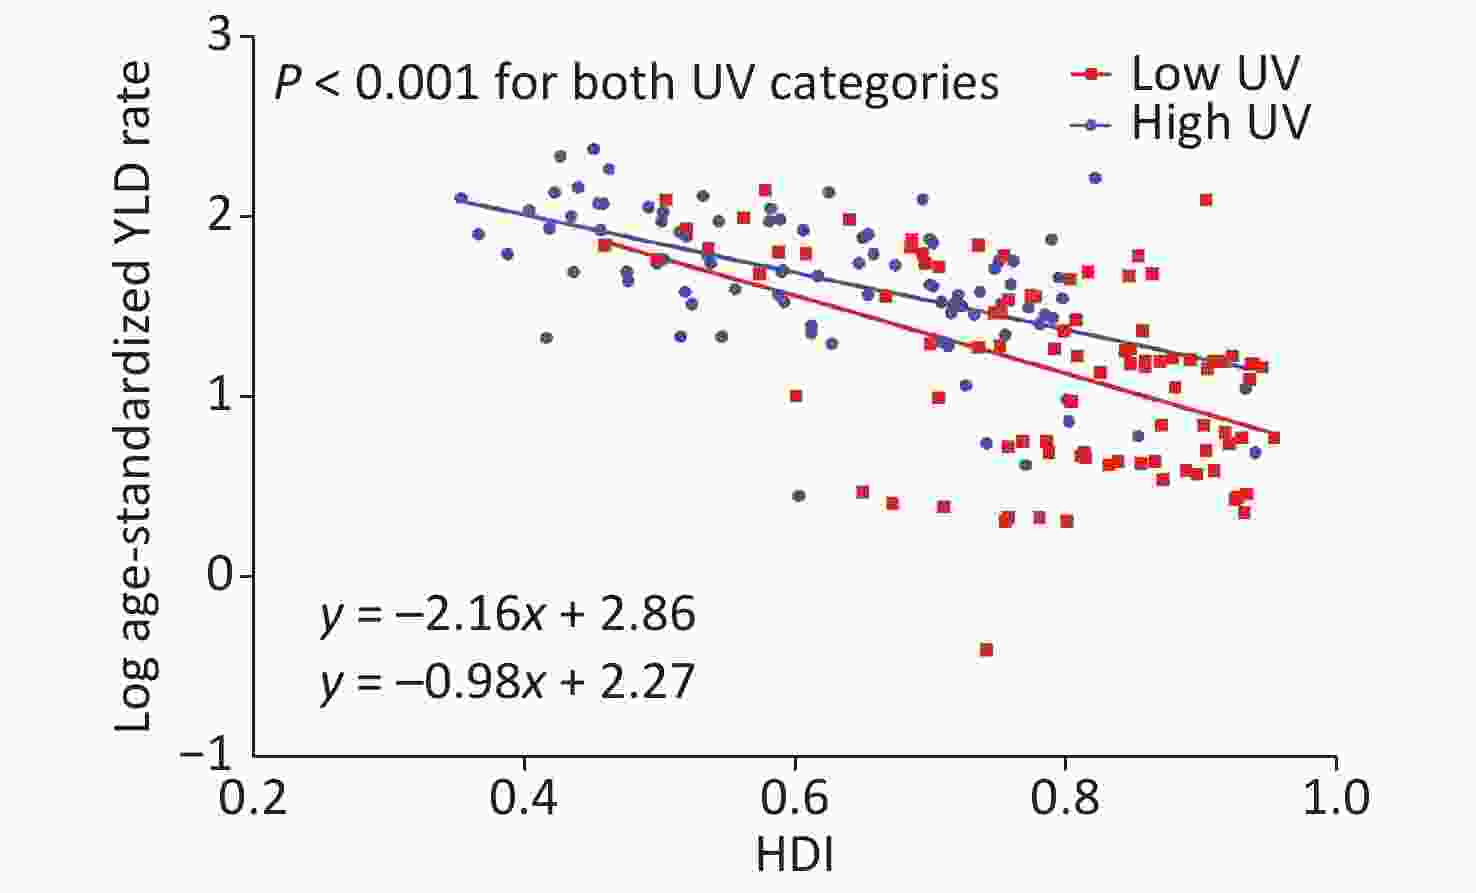
Figure 2. Relationship between HDI and log age-standardized YLD rate owing to cataract blindness for both UVR categories at the country level after adjusting for all covariates. The lines represent fitted lines. HDI, human development index. YLD, year lived with disability. UVR, ultraviolet radiation.
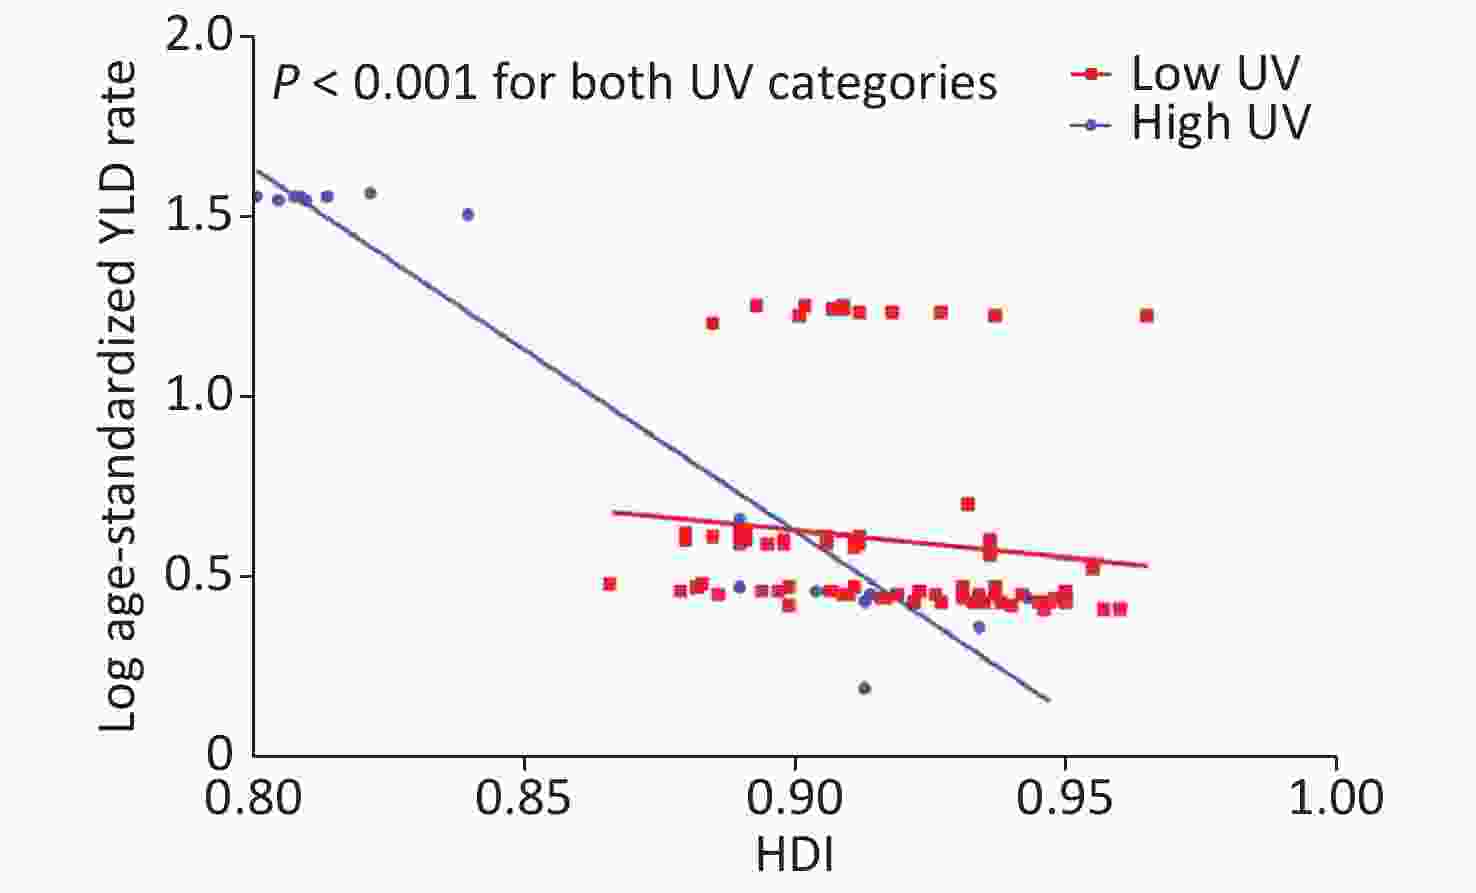
Figure S4. Relationship between HDI and log age-standardized YLD rate owing to blindness for both UVR categories at the subnational level after adjusting for all covariates. HDI, human development index; YLD, year lived with disability; UVR, ultraviolet radiation
Variables Countries na (%) Mean UVR exposure
J·m−2·day−1Crude model Adjusted modeld Regression coefficientb
(95% CI)P value Regression coefficientb
(95% CI)P value High UVR 92 HDI categoriesc Low HDI 33 (35.87) 3810.10 1.00 (reference) 1.00 (reference) Medium HDI 25 (27.17) 3940.34 0.64 (0.44, 0.94) 0.020 0.62 (0.40, 0.96) 0.036 High HDI 28 (30.43) 4004.37 0.38 (0.27, 0.56) < 0.001 0.39 (0.21, 0.73) 0.005 Very high HDI 6 (6.52) 3876.17 0.16 (0.09, 0.31) < 0.001 0.12 (0.04, 0.36) < 0.001 P for trend < 0.001 0.001 Low UVR 93 HDI categoriesc Low HDI 5 (5.38) 2947.84 1.00 (reference) 1.00 (reference) Medium HDI 14 (15.05) 2796.09 0.49 (0.16, 1.48) 0.210 0.48 (0.15, 1.50) 0.209 High HDI 23 (24.73) 2073.29 0.15 (0.05, 0.42) < 0.001 0.15 (0.04, 0.55) 0.006 Very high HDI 51 (54.84) 1621.24 0.13 (0.05, 0.35) < 0.001 0.14 (0.03, 0.68) 0.016 P for trend < 0.001 0.023 P value for interactione 0.1361 0.047 Note. HDI,human development index. aFor which data are available. bAntilog values. Outcome measures were log-transformed in the analysis. cCategorized as follows: < 0.550 (low HDI); 0.550–0.699 (medium HDI); 0.700–0.799 (high HDI); > 0.800 (very high HDI). dAdjusted for male to female sex ratio, GDP, population using solid fuels, age-standardized prevalence of current tobacco smoking, age-standardized diabetes mellitus prevalence, population living in urban areas and BMI mean. eTest for the interaction between HDI (low HDI, medium HDI, high HDI, and very high HDI) and UVR (high UVR and low UVR). Table 3. Effect of UVR exposure on the cataract age-standardized YLD rate owing to blindness in countries with elevated HDI
-
This study showed that socioeconomic status was inversely correlated with the burden of cataract blindness and revealed that UVR exposure modified the association of socioeconomic status with the health burden of cataract blindness, taking into account differences in the male to female sex ratio, GDP, population using solid fuels, age-standardized prevalence of current tobacco smoking, age-standardized diabetes mellitus prevalence, population living in urban areas and BMI. Countries with higher levels of socioeconomic development were found to have lower cataract-related blindness burdens. When countries were replaced by subnational regions, the trend of the negative correlation of socioeconomic status with the burden of cataract blindness was largely retained but was lower in magnitude.
A previous study estimated the prevalence of and number of people with blindness due to cataracts and found that among 21 GBD study regions, the percentages of blindness caused by cataracts were lower in the high-income regions (< 15%) and higher (> 40%) in South and Southeast Asia and Oceania[2]. Our study showed that the cataract-related blindness burden is more concentrated in countries with lower socioeconomic status. The HDI level was independently associated with the health burden of cataract-related blindness, with lower age-standardized YLD rates in higher HDI countries. A possible explanation is that the HDI level is related to the output and quality of cataract surgery. Cataract surgery is considered one of the most cost-effective health-care interventions, with a cost per DALY saved of US$ 20–40 million, and is performed with increasing frequency in all regions[1]. However, barriers to cataract surgery services still exist in most countries; the most commonly cited barriers are socioeconomic factors, including income, insurance coverage and low government funding[18-20]. A systematic review demonstrated inequalities in cataract surgery rates were found among countries grouped by income and were associated with socioeconomic indicators[21]. Although the global initiative known as ‘VISION 2020: the Right to Sight’ has made many efforts to promote cataract surgery services at a cost that all patients can afford worldwide[1], the cost still represents a significant expenditure, especially for patients of lower socioeconomic levels[20]. In developing countries worldwide, over half of people with cataract blindness do not undergo cataract surgery[22], mainly because of a low willingness to pay for it[23]. In addition, the quality of cataract surgery is still a concern, with poorer outcomes related to low socioeconomic levels[24]; this disparity aggravates between-country disparities in cataract blindness. Using subnational data, our study observed that the HDI was negatively correlated with the burden of cataract-related blindness. When subnational instead of national data were considered, the difference in socioeconomic status between regions within a country decreased, which helped us to observe the impact of socioeconomic status on the burden of cataract blindness at a smaller geographical coverage and at a detailed level. Although limited subnational data were included according to the GBD study, the findings suggest that socioeconomic disparities in the burden of cataract blindness exist not only among countries but also among subnational regions with different development levels.
Studies have shown that UVR exposure is one of the most important factors of cataractogenesis and is related to cataract development by inducing apoptosis and photooxidation[25, 26]. Several findings have demonstrated that the association of UVR exposure with cataracts is dose dependent[27, 28]. More UVR exposure implies an increasing risk of cataracts, leading to more cases of cataract blindness. The increased risk for cataract extraction in subjects exposed to high lifetime ambient total UVR (42.718 KJ·m−2) was confirmed [odds ratio (OR) = 1.53] by comparison with subjects exposed to moderate ambient total UVR (39.887 KJ·m−2)[29]. High UVR exposure causes an increased cataract blindness burden and leads to added national medical expenditures related to socioeconomic level. The costs of environmental measures are often seen as an impediment to economic development. In regard to cataracts, the economic burden attributed to excess UVR is US$4.5 billion in the United States[30]. The increase in economic costs due to high UVR may be unaffordable and present a concern for low- and middle-income countries. Ambient levels of UVR have been increasing and may persist at elevated levels in the future because of continuous stratospheric ozone depletion, and the increase represents an excess cost to address additional cases of cataracts[31]. This serves as a warning that the countries with high UVR exposure and poor economic development must pay particular attention to ensuring protectionin order to reduce the incidence of cataract blindness. At low latitudes, there are a large number of countries that have lower economic conditions and suffer from high UV exposure. It is unrealistic to change the economic situation of these countries in a short time. Therefore, more economical interventions to protect the eyes from UVR exposure, to make the public realize that UVR exposure is harmful to the eyes, and to raise public recognition of UVR exposure. The WHO provides the UV Index (UVI) to guide crowd behavior, increase the population's attention to UVR exposure, and strengthen self-protection. In many countries the UVI is reported along with the weather forecast in newspapers, on TV, and on the radio. The publicity of UVI should be enhanced, and the public should be reminded to take eye protection measures such as wearing hats and sunglasses to avoid high UVR exposure in countries with lower socioeconomic status. Our findings may have significance for public health, given that cataracts are easily treatable[32], and strengthening UVR protection could be an cost-effective intervention for delaying cataract blindness.
Several potential limitations need to be considered. First, the UVR exposure dose derived from the OMI surface UVR product might be overestimated compared to ground-based spectral UVR measurements[33]. The estimated cataract-related blindness burden in the GBD study 2017 may be inadequate due to limited data sources and possible selection bias resulting from the reliance on clinical data records[13]. Second, our study might be subject to ecological fallacy and bias, because the use of aggregate country-level data did not provide information on individuals. Third, the linear regression analysis included subnational-level data of age-standardized YLD rates owing to blindness, UVR exposure, HDI, male to female sex ratio, age-standardized diabetes mellitus prevalence and GDP. The remaining variables, such as population using solid fuels, age-standardized prevalence of current tobacco smoking, population living in urban areas and BMI mean, were not available at the subnational level. We assumed that these variables had a homogeneous distribution throughout each country, which covered important subnational differences. Furthermore, the study was restricted to the locations included in the GBD study 2017, therefore, only 206 subnational regions belonging to seven countries were included. For other countries with large geographic latitude coverage, we were forced to use a single national age-standardized YLD rate to represent the burden of cataract-related blindness without detailed subnational data. The insufficient sample size, especially the lack of low-HDI subnational regions, may cause poor representativeness. Despite these limitations, ecological studies are an effective method to explore associations on a worldwide level, especially based upon openly available data[34].
-
In conclusion, long-term high-UVR exposure amplified the association of poor socioeconomic status with the burden of cataract-related blindness. The findings highlight that in addition to existing efforts toward eliminating cataract blindness, UVR exposure protection interventions, such as wearing glasses, wearing a cap and a reduction of outdoor activity time, must be reinforced in developing regions with high-UVR exposure to achieve the global target proposed by the WHO GAP.
-
The authors declare no conflict of interest.
-
DENG Yan calculated the solar ultraviolet radiation exposure, analyzed the data, and wrote the original article. YANG Dan obtained data on the global burden of cataract blindness and other related data. YU Jia Ming and XU Jing Xian determined the covariates related to cataracts. HUA Hui, CHEN Ren Tong, and WANG Nan performed the covariate calculations, statistical analysis and graphing. OU Feng Rong helped revise the manuscript. LIU Ru Xi and WU Bo performed data processing. LIU Yang designed the experiment. All authors contributed to the writing and editing of the final paper.
Funds:
This research was supported by a grant from the National Natural Science Foundation of China [No. 81673133 and No. 81273034]

 Quick Links
 DownLoad: