


-
Millions of tons of toluene, an important organic solvent, are widely used in the manufacture of adhesives, paints, rubber, and household products annually[1,2]. The control of toluene emissions has become an important concern. Toluene is a major volatile organic compound and one of the major precursors of secondary organic aerosols[3,4]; it is mainly detectable in the atmosphere and at low levels in water and soil as an environmental pollutant[5,6]. The concentration of toluene ranges from 0.44 to 116.13 μg/m3 in the air of the Pearl River Delta[6] in China and from 26.6 to 37,768 ng/L in water samples from the Yangtze River Delta[7]. According to some previous reports, the concentration of toluene ranges from 2.9 to 1,220.0 μg/m3 in indoor air and some microenvironments[8-11]. Therefore, due to toluene-containing waste liquid, the usage of paints and solvents, diesel exhaust, and the abuse of toluene inhalants, toluene exposure in the environment is common, as is chronic, low-concentration inhalation of toluene[4,12-14].
Toluene mainly enters the body through the respiratory tract, gastrointestinal tract, and skin contact and is further distributed rapidly to the brain, liver, and other organs via blood flow[15]. The toxicity of toluene is mainly manifested as central nervous system damage, hearing loss, balance disorders, reproductive toxicity, gastrointestinal tract injury, cardiovascular toxicity, and urinary system injury[16-19]. The effects of toluene on hearing and balance have attracted the attention of researchers for a long time. As early as the 1980s, Biscaldi et al. observed abnormal brain activities and reduced vestibular reflexes in workers exposed to high concentrations of toluene over a short period of time[20]. After that, some researchers studied auditory system impairment caused by combined noise exposure and toluene exposure[21]. Early animal-based studies showed that toluene exposure at concentrations above 1,000 ppm results in permanent hearing loss in rats. Waniusiow et al. found that toluene significantly induced hearing loss in rats and guinea pigs with cytochrome P450 oxidoreductase deficiency[22,23]. However, the mechanism of toluene-induced hearing loss and balance disorders is poorly understood.
Zebrafish have emerged as powerful biological models for hearing loss studies due to their high reproductive capacity, high homology with humans, and transparent embryos[24]. Zebrafish have no outer or middle ear structures but do have a typical vertebrate inner ear structure[25]. In addition, they have a sensory system that is distributed along the lateral line of the fish body, which allows them to detect changes in water flow around their body, maintain balance, and sense low-frequency vibrations[26,27]. These characteristics facilitate the control of experimental conditions and help to explore the ototoxicity of chemicals and drugs. In this study, we employed zebrafish as a model to investigate the acute toxicity of toluene, including changes in locomotion performance, inner ear and lateral line hair cell structure, and hair cell-related gene expression levels, for the purpose of understanding the potential influence of toluene on the development of the ear and lateral line system in aquatic animals.
-
Wild-type AB strain zebrafish were raised according to the methods described by Westerfield[28]. Zebrafish embryos were incubated in a dish, and larvae (14 d post fertilization, dpf) were housed in a recirculating tank system on a 14 h/10 h light/dark cycle. Water quality was maintained at 28.5 °C (pH 7.2–7.6; salinity 0.03%–0.04%). All procedures in this study were approved by the Key Laboratory of Zebrafish Modeling and Drug Screening for Human Diseases Institute, Southern Medical University (Guangzhou, China).
-
Thirty embryos [< 1 h post fertilization (hpf)] were exposed to toluene (0, 1, 2, or 4 mmol/L; Sigma-Aldrich, St. Louis, MO, USA) in zebrafish medium (3.50 g/L NaCl, 0.05 g/L KCl, 0.05 g/L NaHCO3, and 0.10 g/L CaCl2), with three replicates. To maintain the toluene concentration, embryos were incubated in 25 cm2 airtight flasks (ten embryos per flask) with air exchange once a day. Abnormal and dead zebrafish embryos/larvae were monitored, while hatched larvae were counted at 48 and 72 hpf. As described earlier, the morphological characteristics of the larvae were checked with a microscope to identify the abnormal fish[29]. The rates of malformation, death, and hatching were evaluated every 24 h by the ratio of counted numbers/total exposed numbers × 100, and the assessment stopped at 120 hpf. Embryos prepared for qPCR were collected at 72 hpf, immediately frozen in liquid nitrogen, and stored at −80 °C until RNA extraction.
-
The locomotion activities of larvae were monitored and recorded by a ViewPoint Zebrabox behavior testing system (ViewPoint Life Sciences, Lyon, France) as described by Chen et al.[30]. Larvae at 6 dpf (12 larvae per treatment) with no obvious abnormal phenotypes were transferred to a 96-well plate (1 fish per well) and incubated at 28 °C for 30 min before locomotion behavior assessment. The spontaneous movements of larvae were observed over a period of 20 min. Three independent experiments were performed.
-
The fluorescent labeling of zebrafish hair cells was performed following a previously established method[31, 32]. Three dpf larvae were first euthanized by 0.5 mmol/L tricaine (TCI, Tokyo, Japan) and then fluorescently labeled in an embryo medium containing 1 μmol/L YO-PRO-1 (Invitrogen, Carlsbad, CA, USA) for 1 h with ten larvae per tube to quantify the anatomic damage to zebrafish lateral line hair cells. After fixation in 2% paraformaldehyde for 1 h at room temperature (25 ℃) and storage overnight in phosphate-buffered saline at 4 °C, larvae were mounted in 4%–6% methylcellulose (TCI) and identified with a fluorescence stereomicroscope (Olympus Corporation, Tokyo, Japan). The relative fluorescence levels of each group were manually measured using ImageJ software[33]. Three independent experiments were performed.
-
Larvae were collected at 72 hpf, and total RNA was isolated using a RNAiso Plus kit (TaKaRa, Dalian, China) and transcribed to cDNA with a PrimeScript RT reagent kit with gDNA Eraser (Transgen Biotech, Beijing, China). RNA quality and quantity were checked with a Nanodrop-2000 (ThermoFisher Scientific, MA, USA). Relative levels of gene expression were measured by qPCR and were normalized to gapdh expression. qPCR was performed on a Lightcycle 96 (Roche, Basel, Switzerland) using a SYBR Green polymerase chain reaction core reagent kit (Transgen Biotech, Beijing, China) according to the manufacturer's instructions. The primers used for the gene amplification are shown in Table 1. To ensure the consistency of the results, the biological tests were performed at least in triplicate, using a total of ≥ 30 embryos or larvae per group.
Name Full name Primer type Primer sequence (5′–3′) cd164l2 CD164 sialomucin-like 2 forward AGCACCTATGAAACTATTGA reverse TTTGGTTGAACTATCCCT chrna9 cholinergic receptor, nicotinic, alpha 9 forward GGAGTCGGCTACCTTCAC reverse CACCTTGGCAACCTTCTT gapdh glyceraldehyde-3-phosphate dehydrogenase forward TCTGACAGTCCGTCTTGAGAAA reverse ACAAAGTGATCGTTGAGAGCAA myo6b myosin VIb forward TTGCGCAGAGATGCTACCAC reverse CAGCTCAGCGTACTTCCACT myo15ab myosin XVAb forward CGCCTGCTCTACATTCTC reverse GTAAACACTCCTGCCACC otofb otoferlin b forward TCCAGGCTTAGACCAAA reverse GAGGAGCGATGCTTATT pcsk5a proprotein convertase subtilisin/kexin type 5a forward GACGGCACTGTTTATCGC reverse GTCCTCCTGTTCATCTCCTA slc17a8 solute carrier family 17, member 8 forward AACTAGCGGCTAACAGGGTG reverse AAGCGGAGGAGCCCATTTAC tekt3 tektin 3 forward ACCATCTCCGAAACACCT reverse ATCCGTGAACTTTGACCAG tmc2a transmembrane channel-like 2a forward ACCACAGTGGGAGTAGAGT reverse AGCACCAGCAATAGTTCA Table 1. Primers for q-PCR
-
Locomotion data are presented as the mean ± standard error. qPCR data are shown as the mean ± standard deviation. After the homogeneity of variance tests, measurement data were analyzed using one-way analysis of variance with Bonferroni’s multiple comparisons correction (equal variances assumed) and Dunnett's T3 multiple comparisons (equal variances were not assumed) using SPSS 20.0 software. A P value of < 0.05 was considered statistically significant.
-
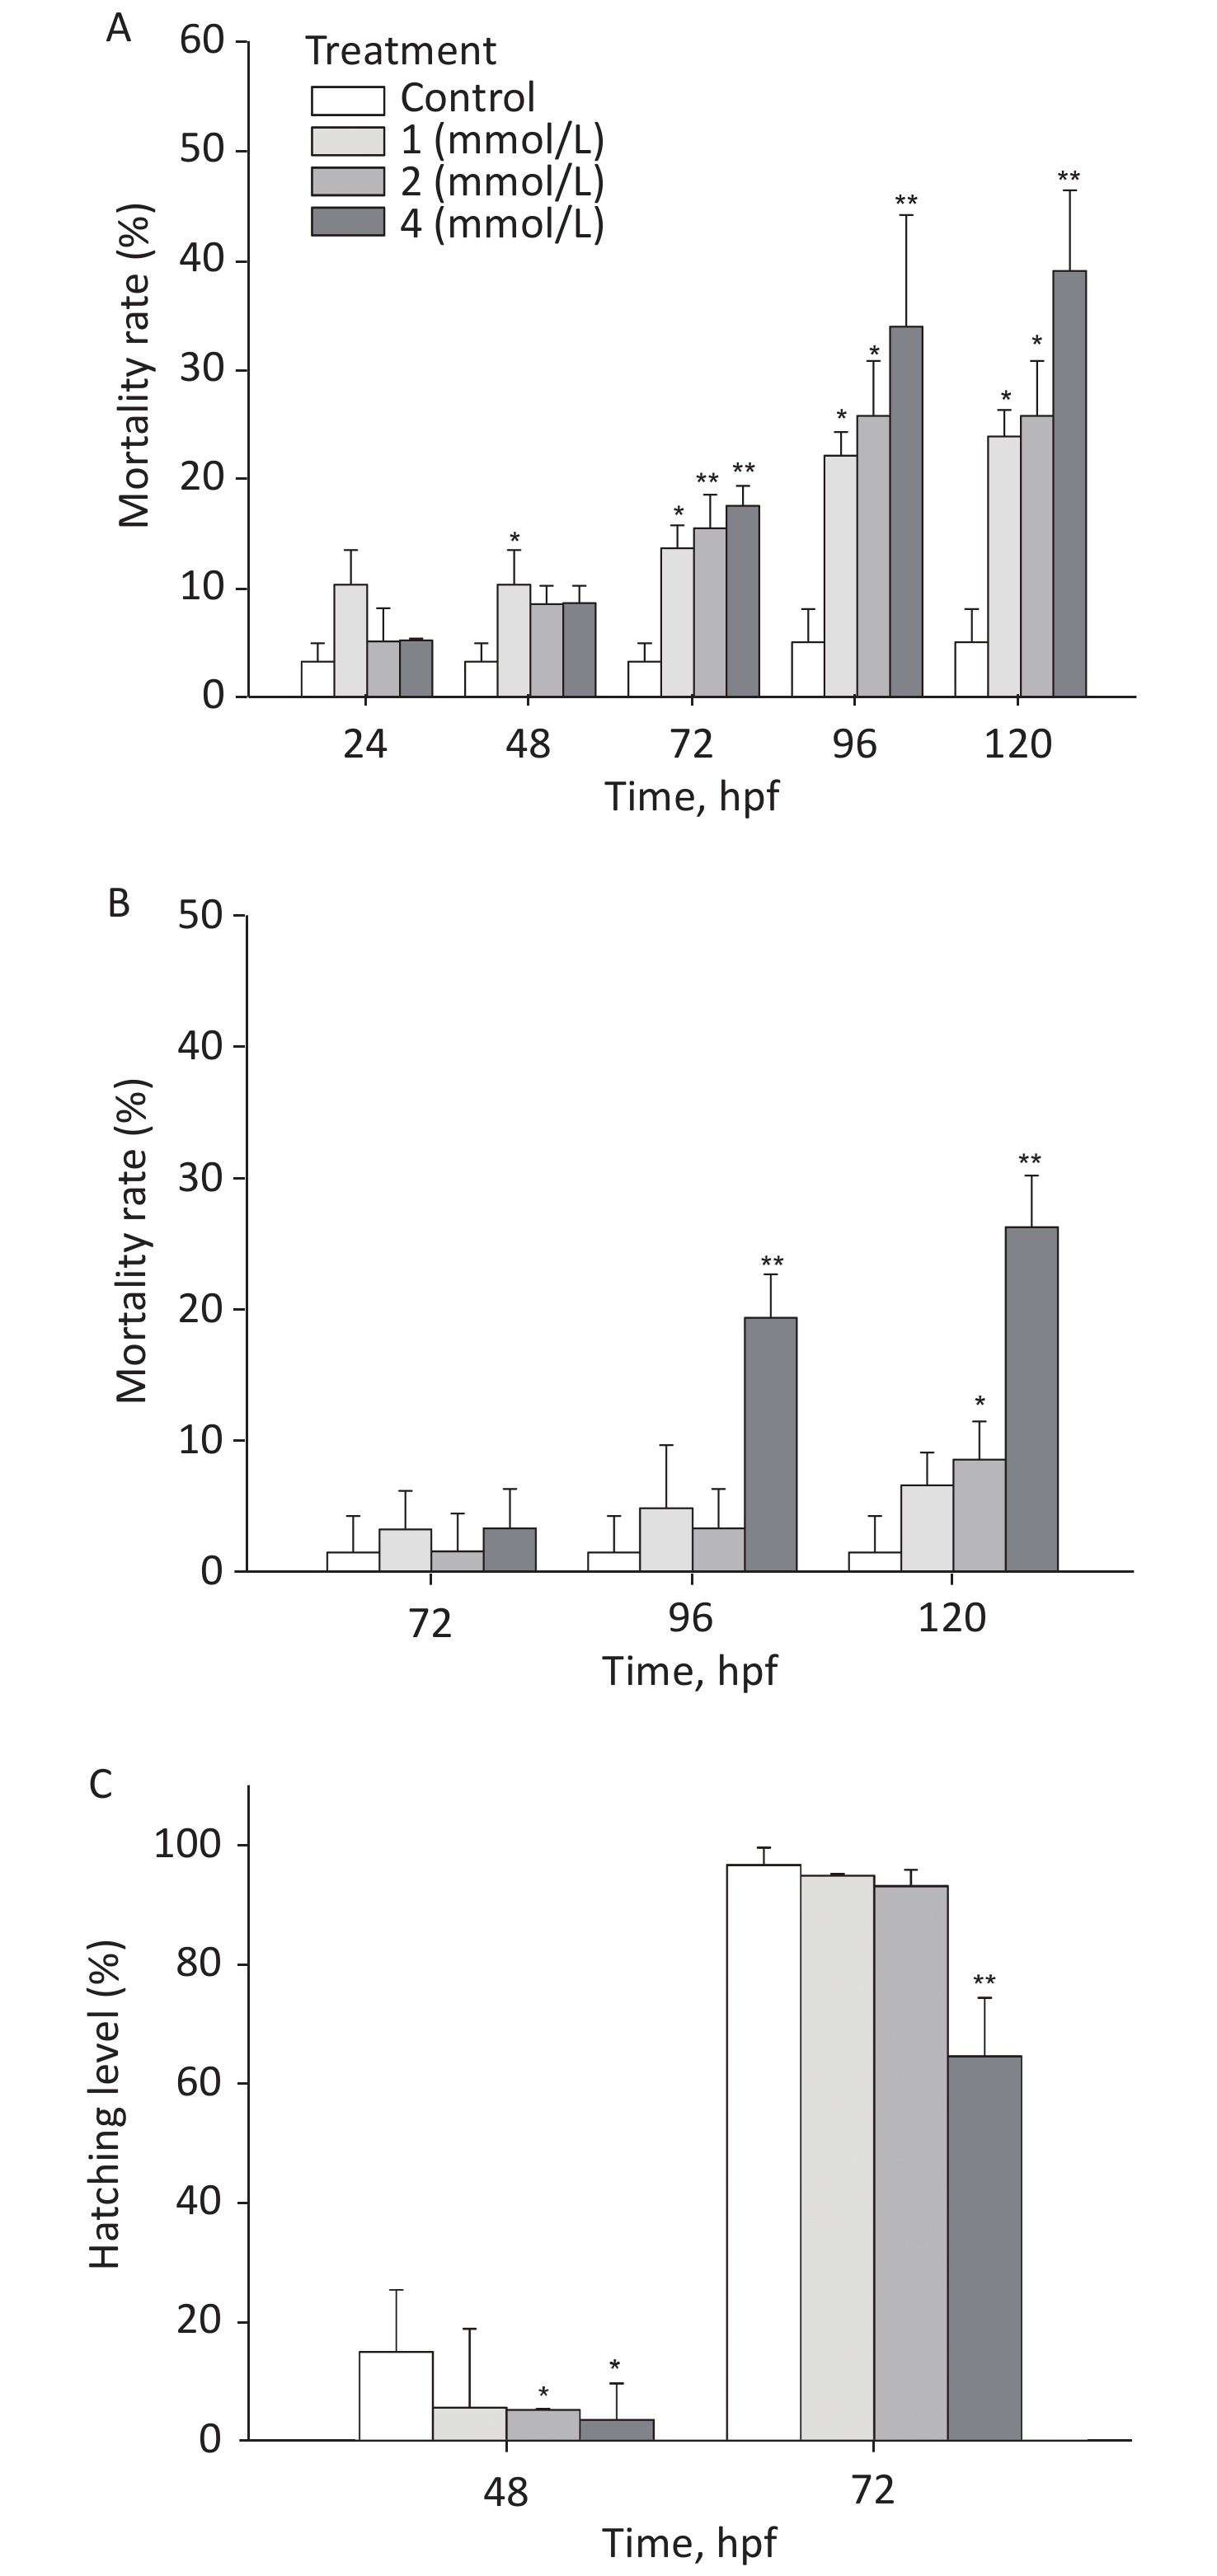
After exposure to toluene, the mortality rate of zebrafish embryos/larvae increased in a concentration- and time-dependent manner (Figure 1A). At 120 hpf, the mortality rate of the group exposed to 4 mmol/L toluene was 39.03%, and the mortality rate of the 1 mmol/L toluene group was also more than 20%; these rates were significantly different from the mortality rate of the control group (5.1%, P < 0.05). Toluene exposure induced slight malformations (mainly pericardium edema) in larvae (Figure 1B). At 96 hpf, malformations were observed in approximately 20% of zebrafish exposed to 4 mmol/L toluene. In addition, the zebrafish embryo hatching level was inhibited by toluene exposure at high concentrations, and at 72 hpf, the hatching level of the 4 mmol/L group was only 64.57% (Figure 1C).
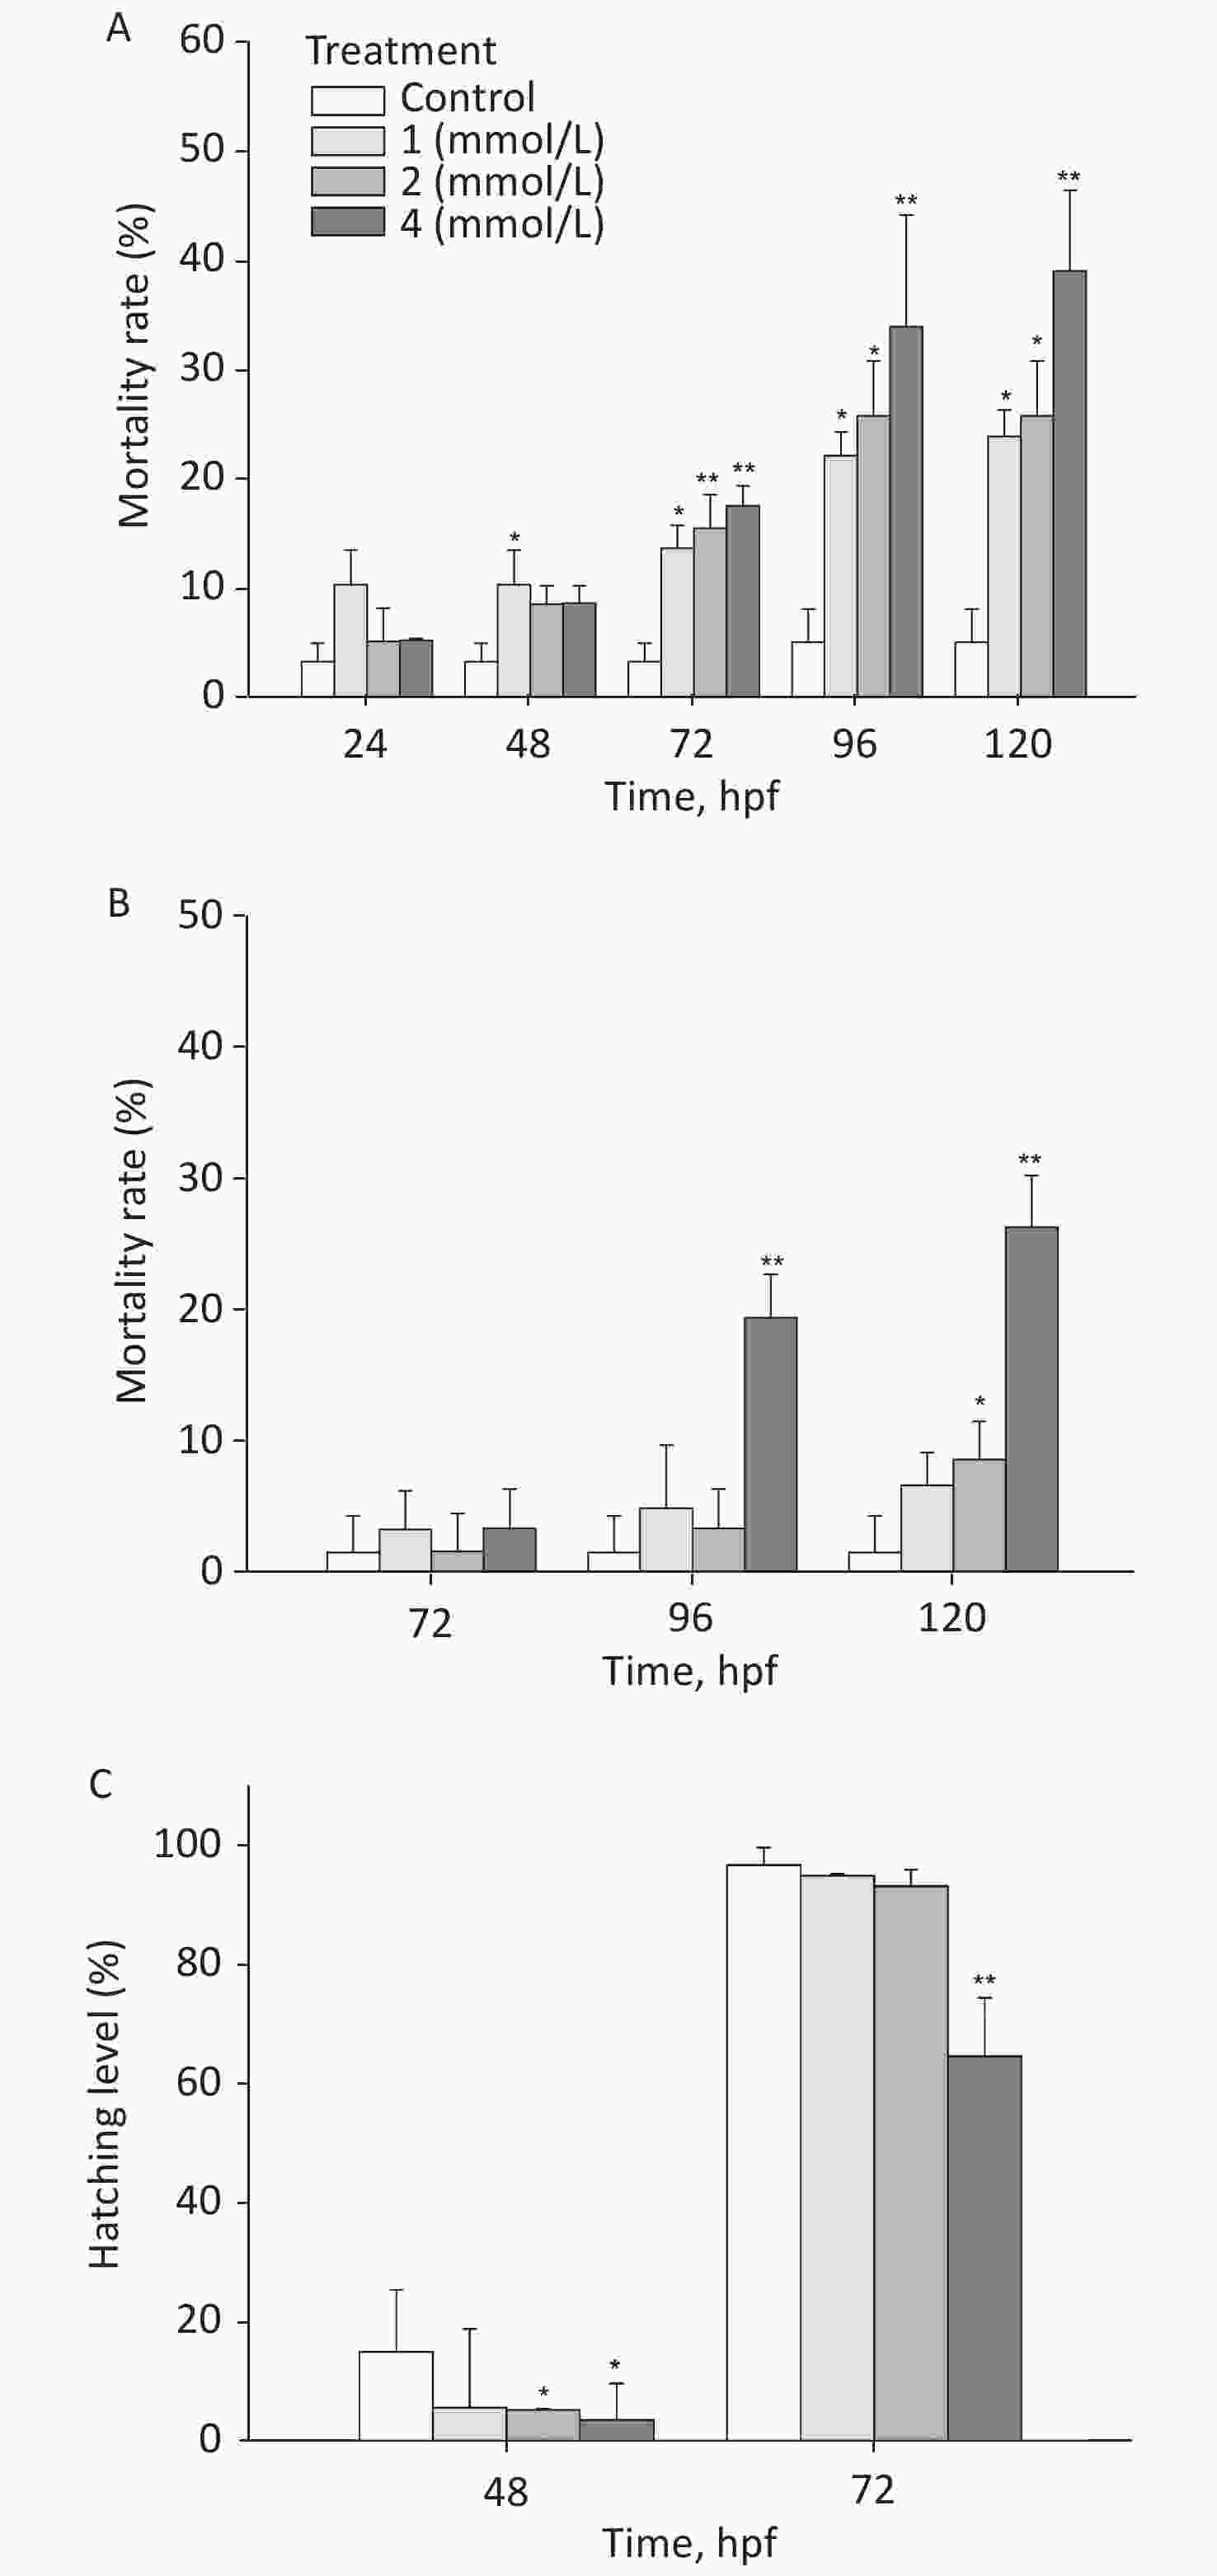
Figure 1. The mortality (A), malformation rate (B), and hatching level (C) influenced by toluene at each time point. Data are expressed as the mean ± SD of three replicates, *P < 0.05 and **P < 0.01, compared with the control group.
-
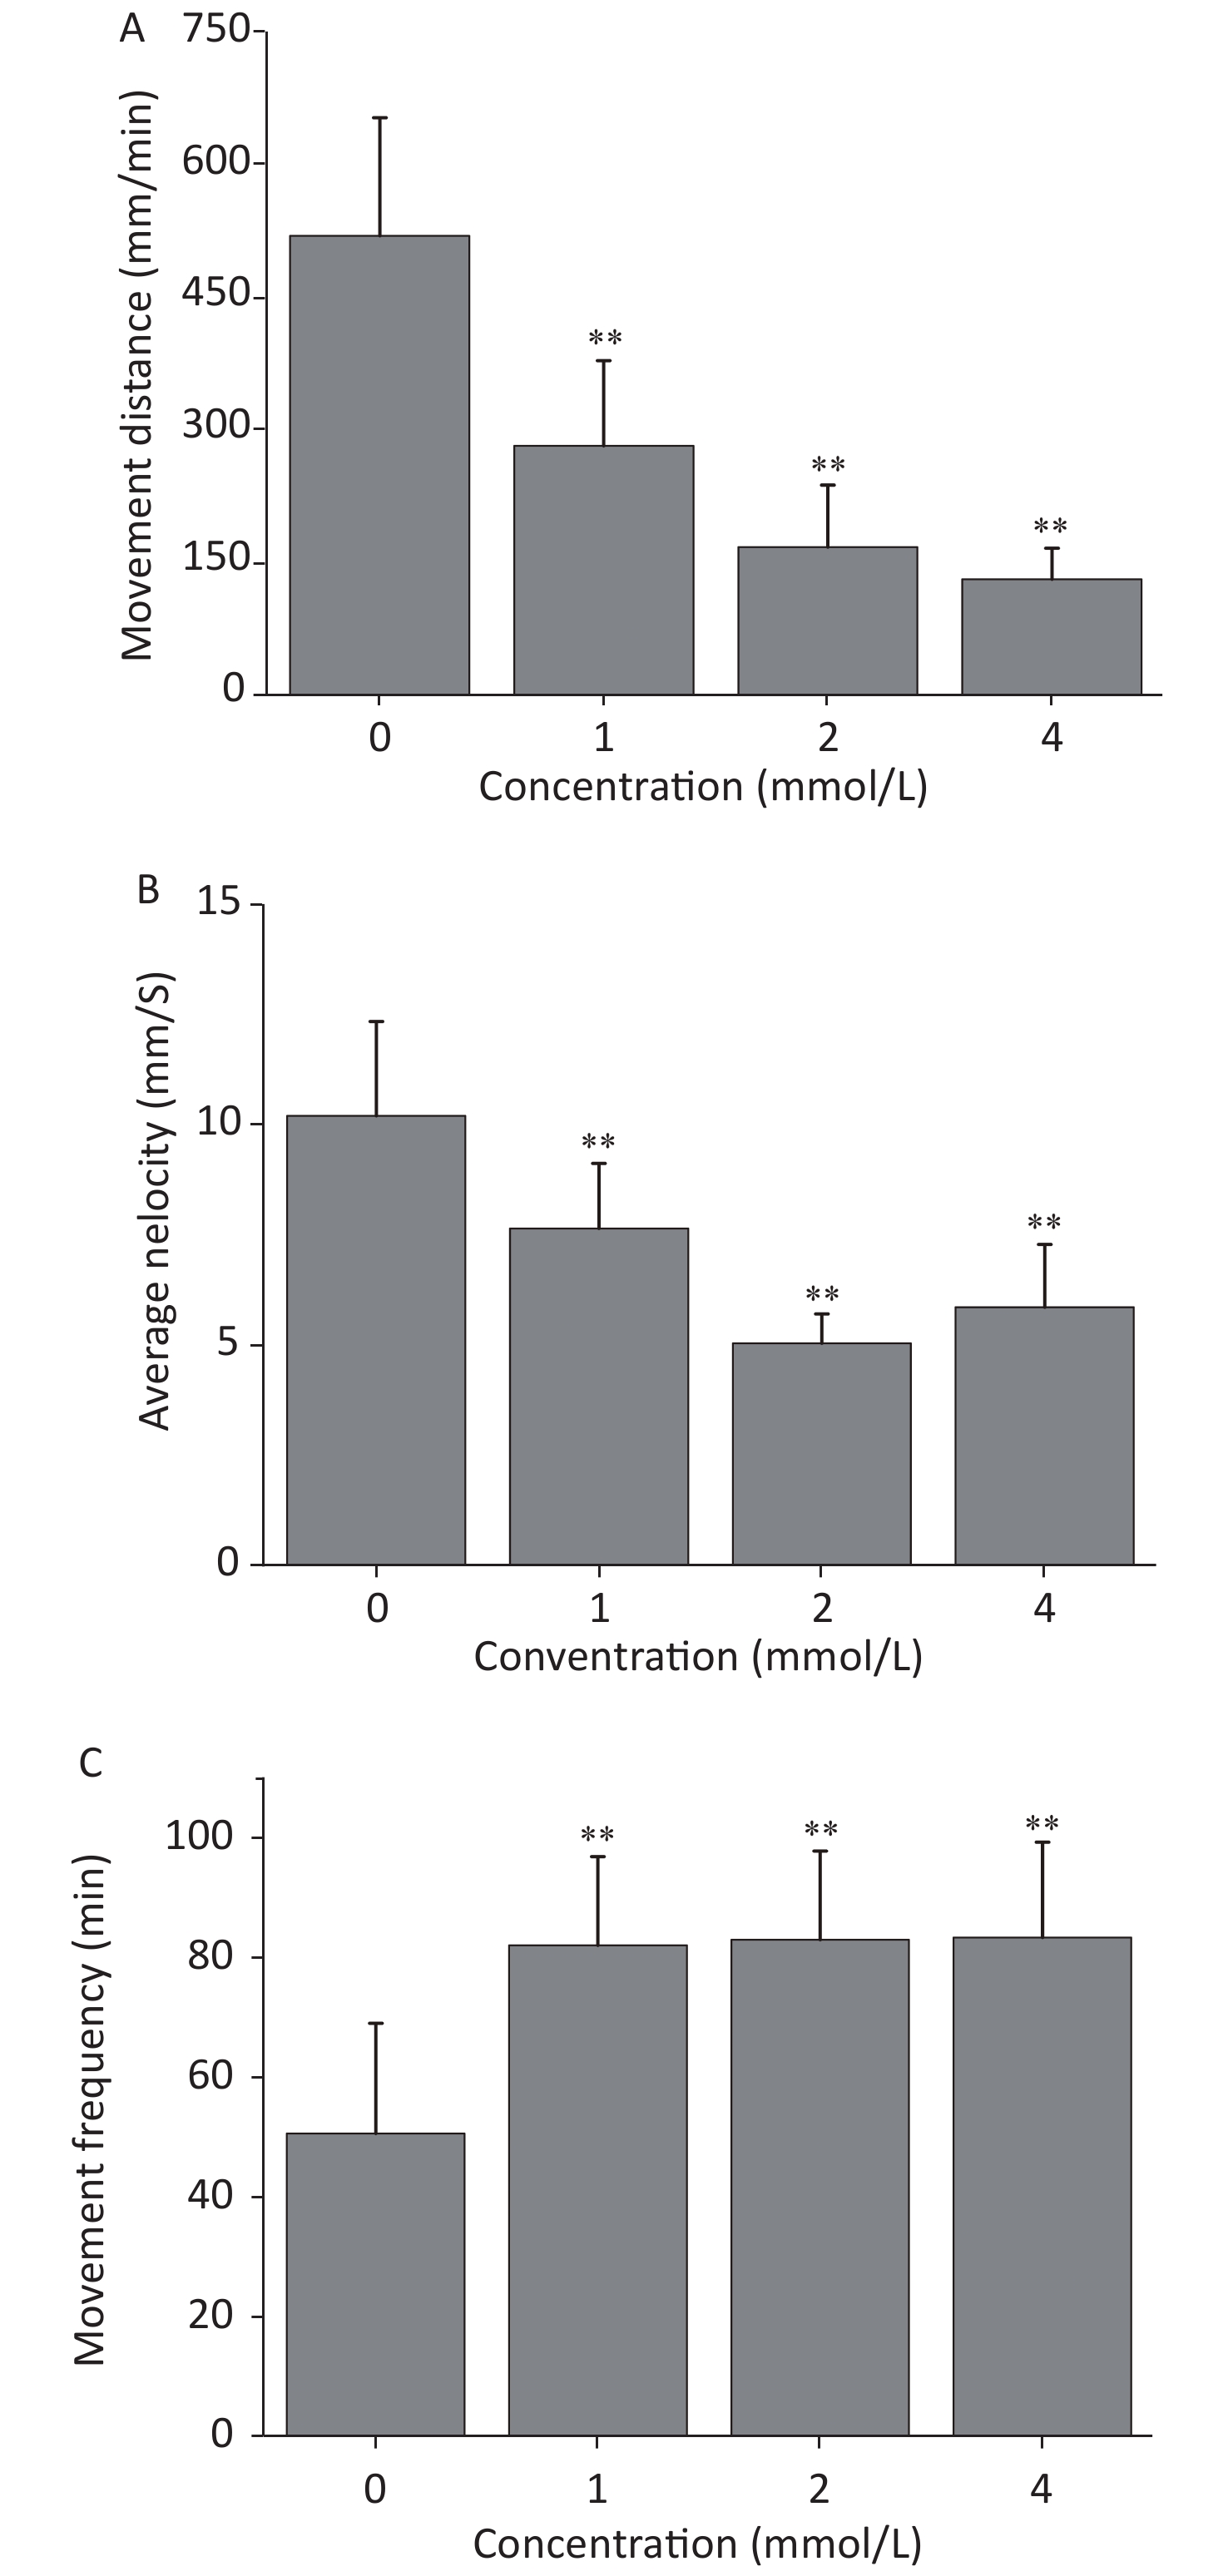
The locomotion performance of 6 dpf larvae was analyzed. As shown in Figsure 2A & B, toluene exposure had inhibitory effects on the distance travelled and average swimming velocity of zebrafish larvae in a concentration-dependent manner, both of which were significantly different from the control condition (P < 0.01). The distance travelled of the 4 mmol/L toluene group was only 131.7 mm/min, and the swimming velocity was inhibited to 66.56% of the control. In addition, toluene slightly increased the frequency of movements (Figure 2B & C).

Figure 2. Locomotion behaviors, including distance travelled (A), average velocity (B), and movement frequency (C), were evaluated after toluene exposure. Data are expressed as the mean ± SD of three replicates, *P < 0.05 and **P < 0.01, compared with the control group.
-
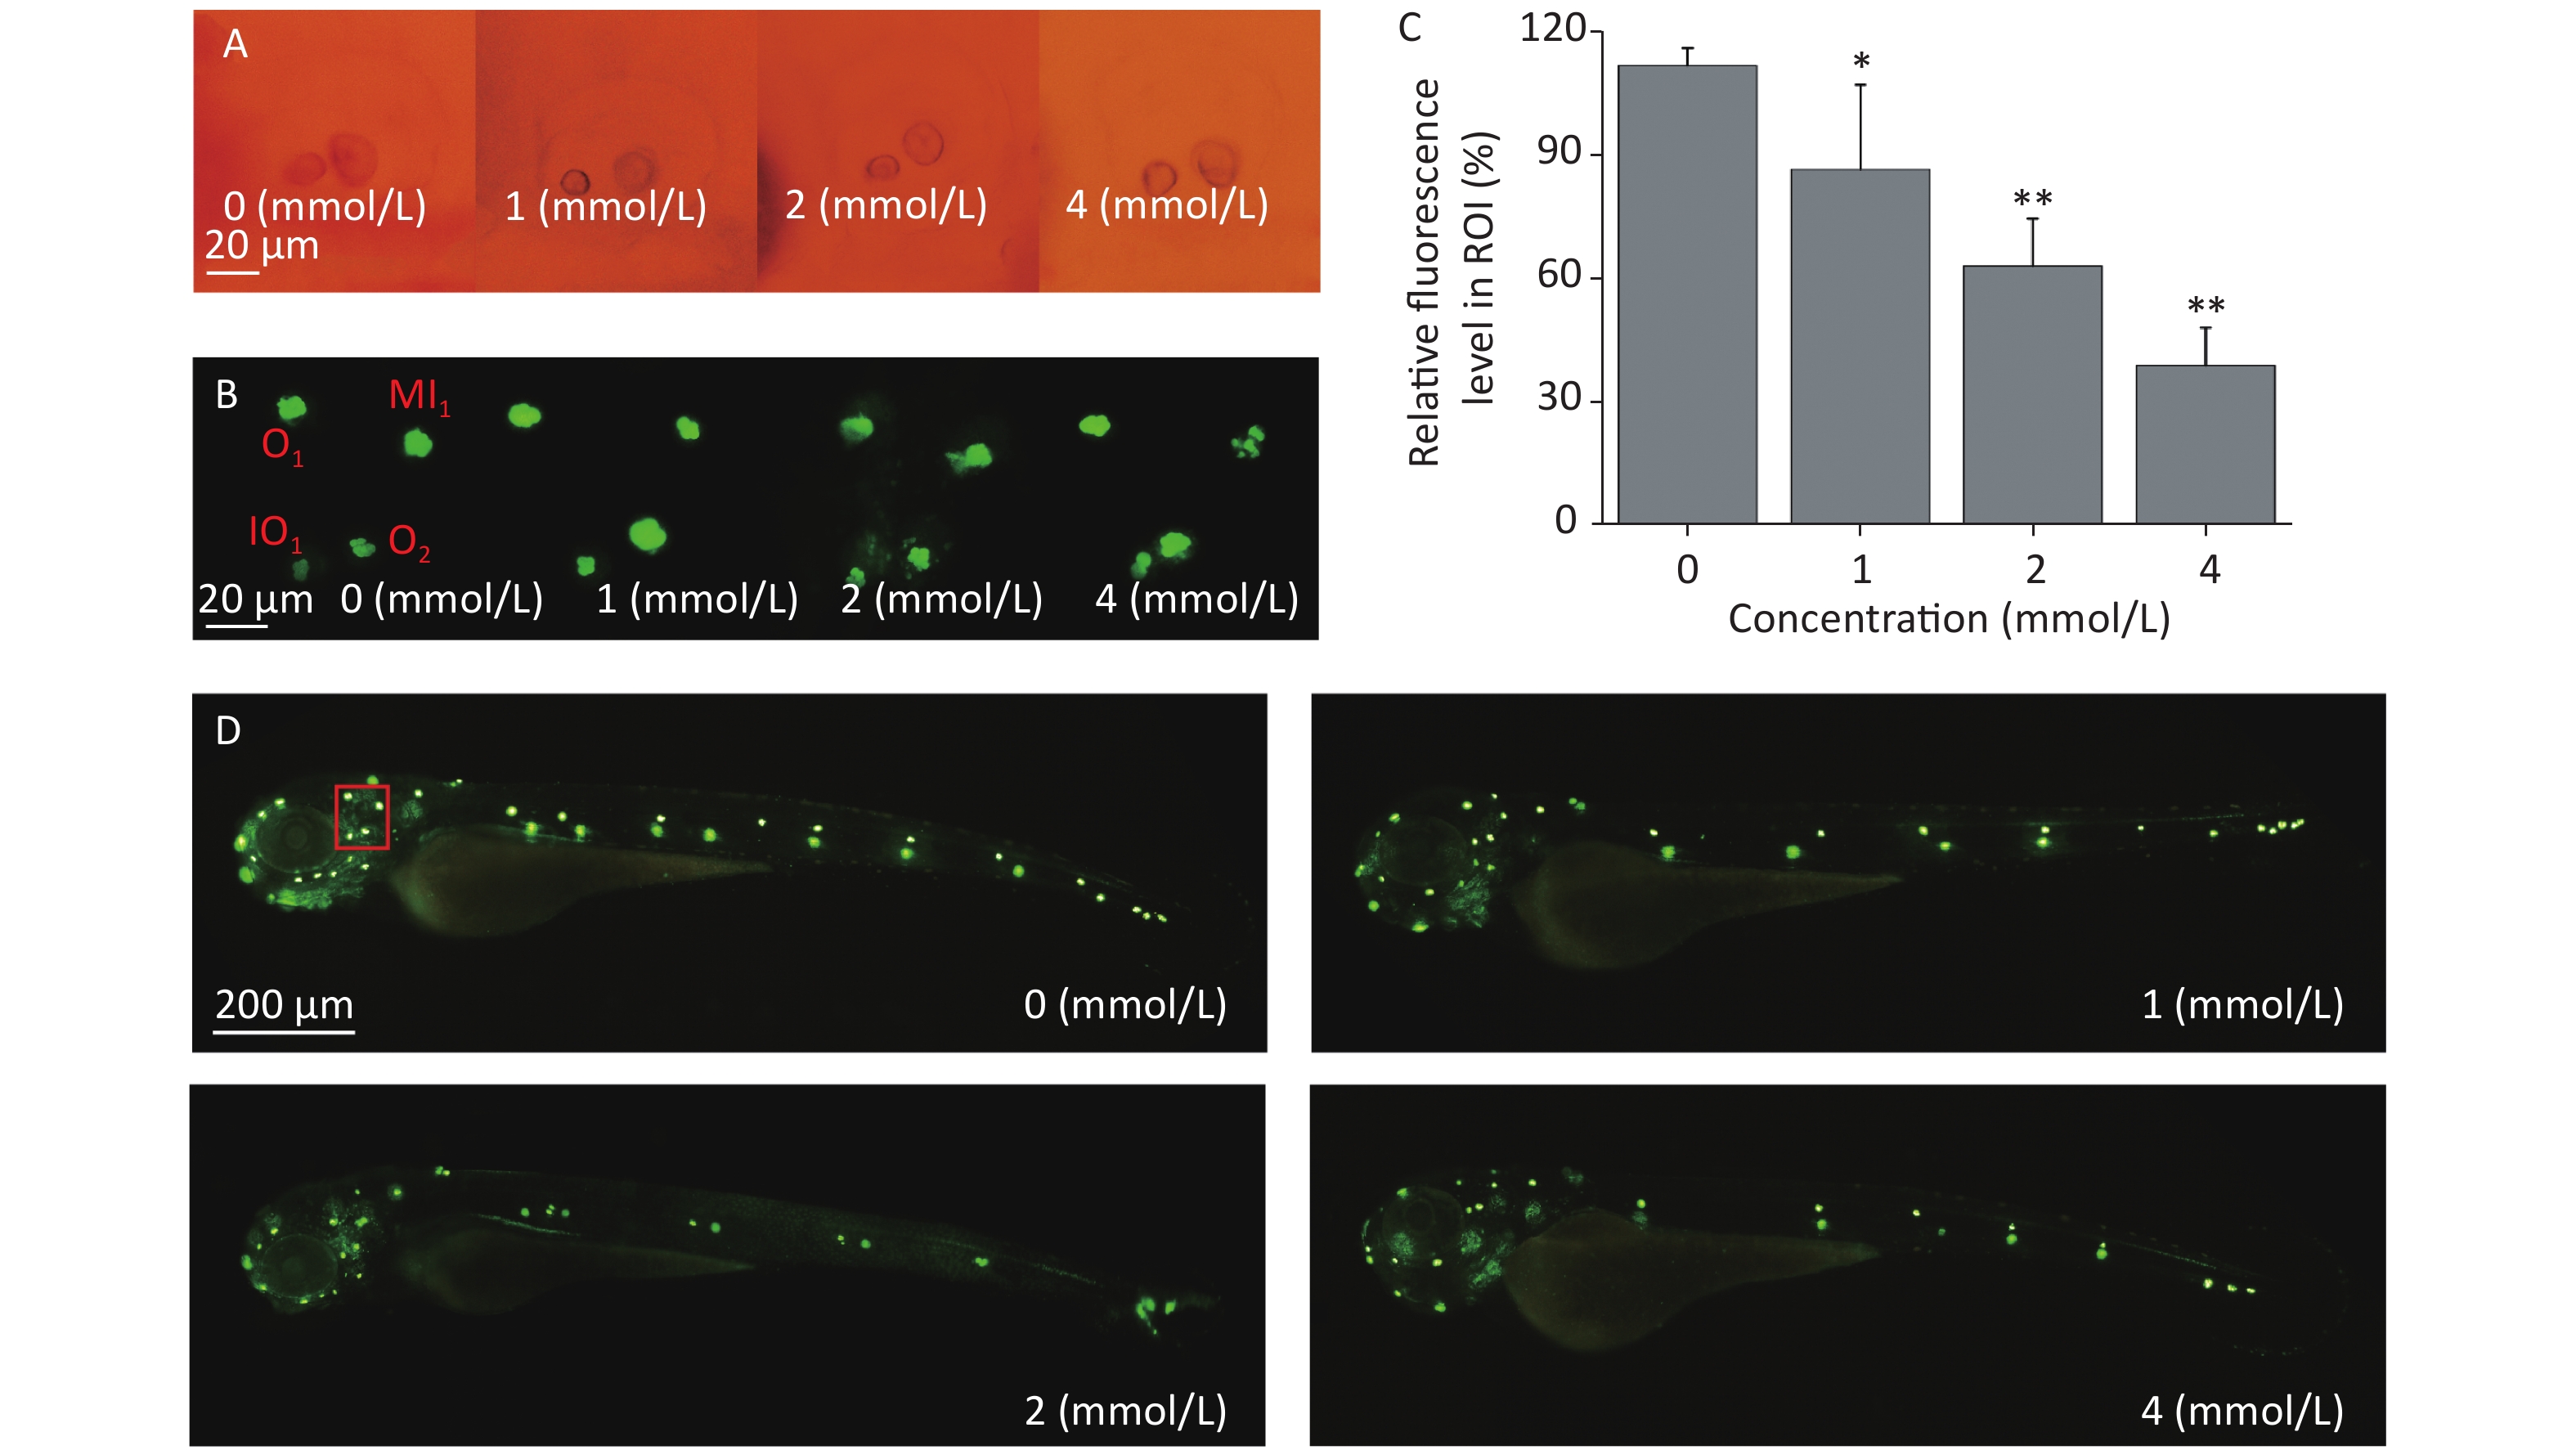
Zebrafish larvae possess sensory hair cells not only in the inner ear but also in the lateral line neuromasts, and the functions of sensory hair cells are related to hearing and maintaining body balance[34]. These functions are highly conserved among different species. Sensory hair cells are easily stained by some fluorescent dyes, such as Yo-Pro-1, and the morphology, quantity, and arrangement of the hair cells can be observed directly under a fluorescence microscope; therefore, hair cell loss can be evaluated. There were no obvious morphological alterations in the development of the inner ears of the zebrafish larvae under the tested concentrations when observed by light microscopy (Figure 3A). After Yo-Pro-1 staining, neuromasts were evenly distributed along the lateral line in the control group, while the fluorescence intensity of some neuromasts declined after toluene exposure in a concentration-dependent manner (Figure 3C&D), which indicated that toluene exposure impaired zebrafish hair cells and affected the formation of neuromasts. The developmental state of neuromast hair cells around the otoliths of zebrafish was further observed. Middle line (MI1), otic (O1 and O2), and infraorbital (IO4) neuromasts were used as the observation points. As shown in Figure 3B, the growth of hair cells in the MI1 area was gradually inhibited as the toluene concentration increased, while other neuromasts were not altered (Figure 3B).
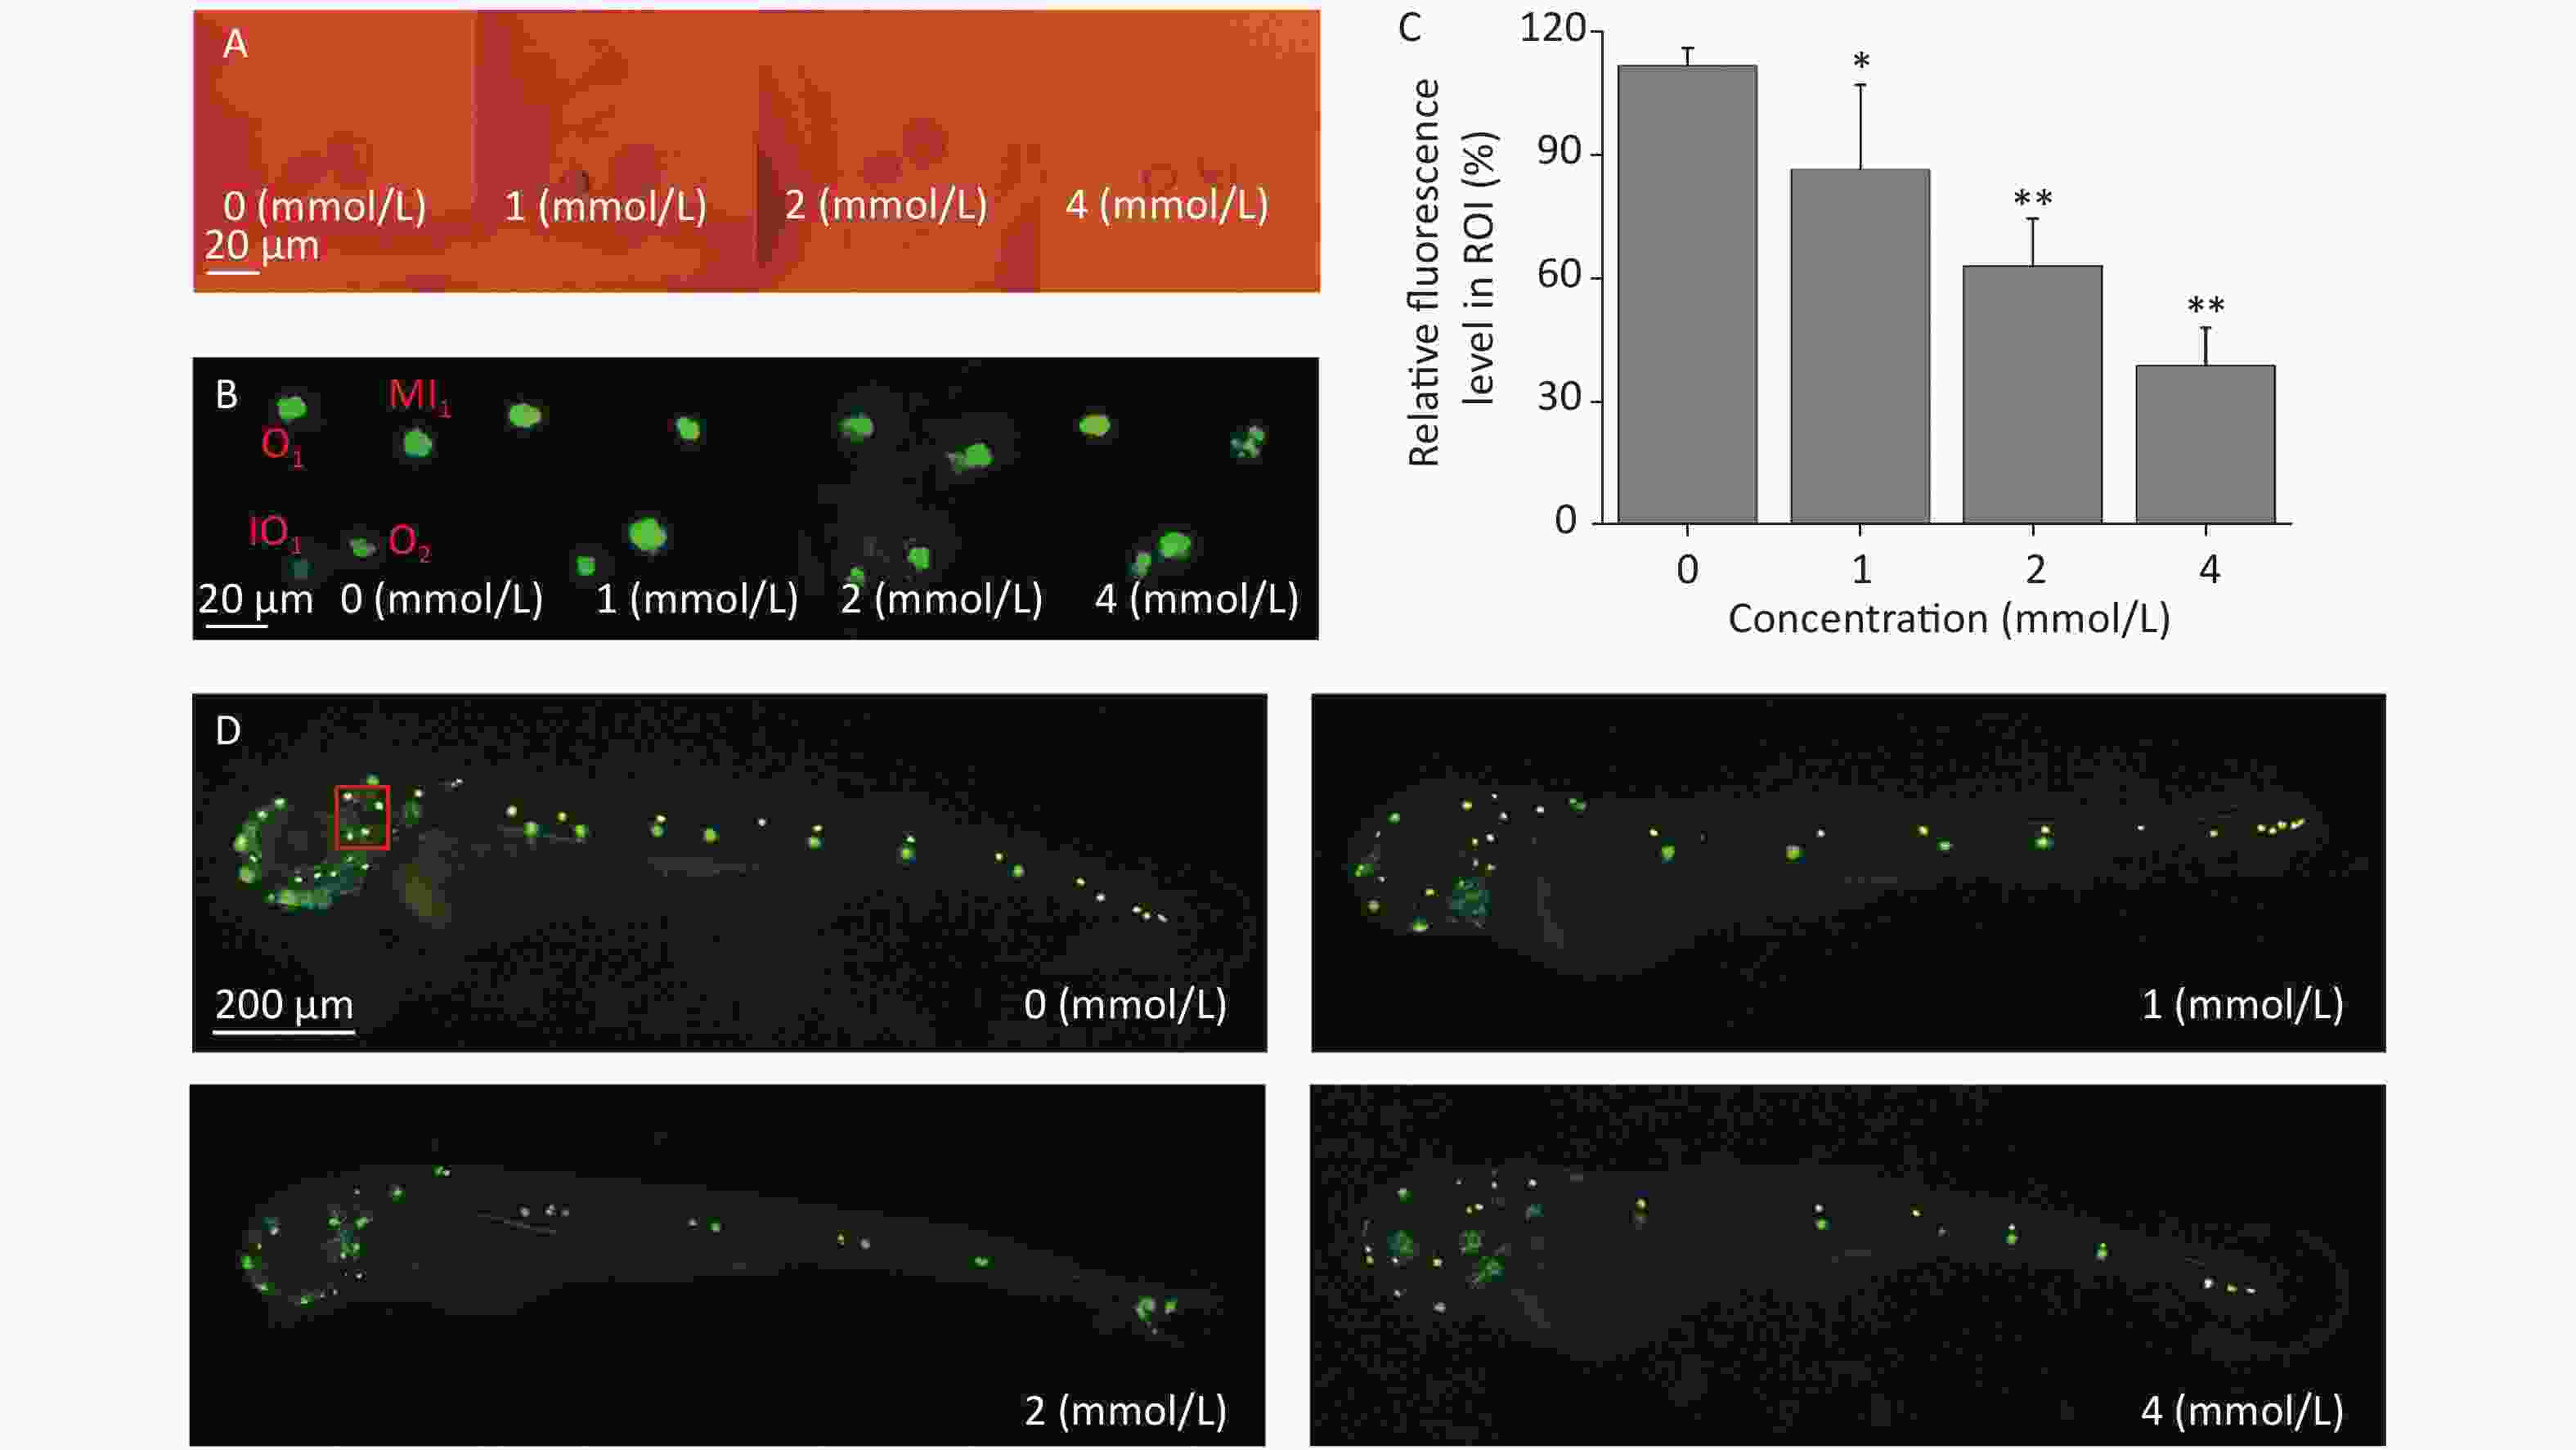
Figure 3. The inner ear structure of 3 d post fertilization larvae was observed under a light microscope (A). Three dpf larvae were stained with Yo-Pro-1 for 1 h. The green fluorescence spots indicate stained neuromasts. Representative stained larvae of the control group and each toluene exposure group are presented (B, D). The red box indicates the area presented in Figure 3B. Fluorescence areas were calculated using ImageJ software (C, three replicates), *P < 0.05 and **P < 0.01, and compared with the control group. MI1, middle line; O1, otic 1; O2, otic 2; and IO4, infraorbital 4.
-
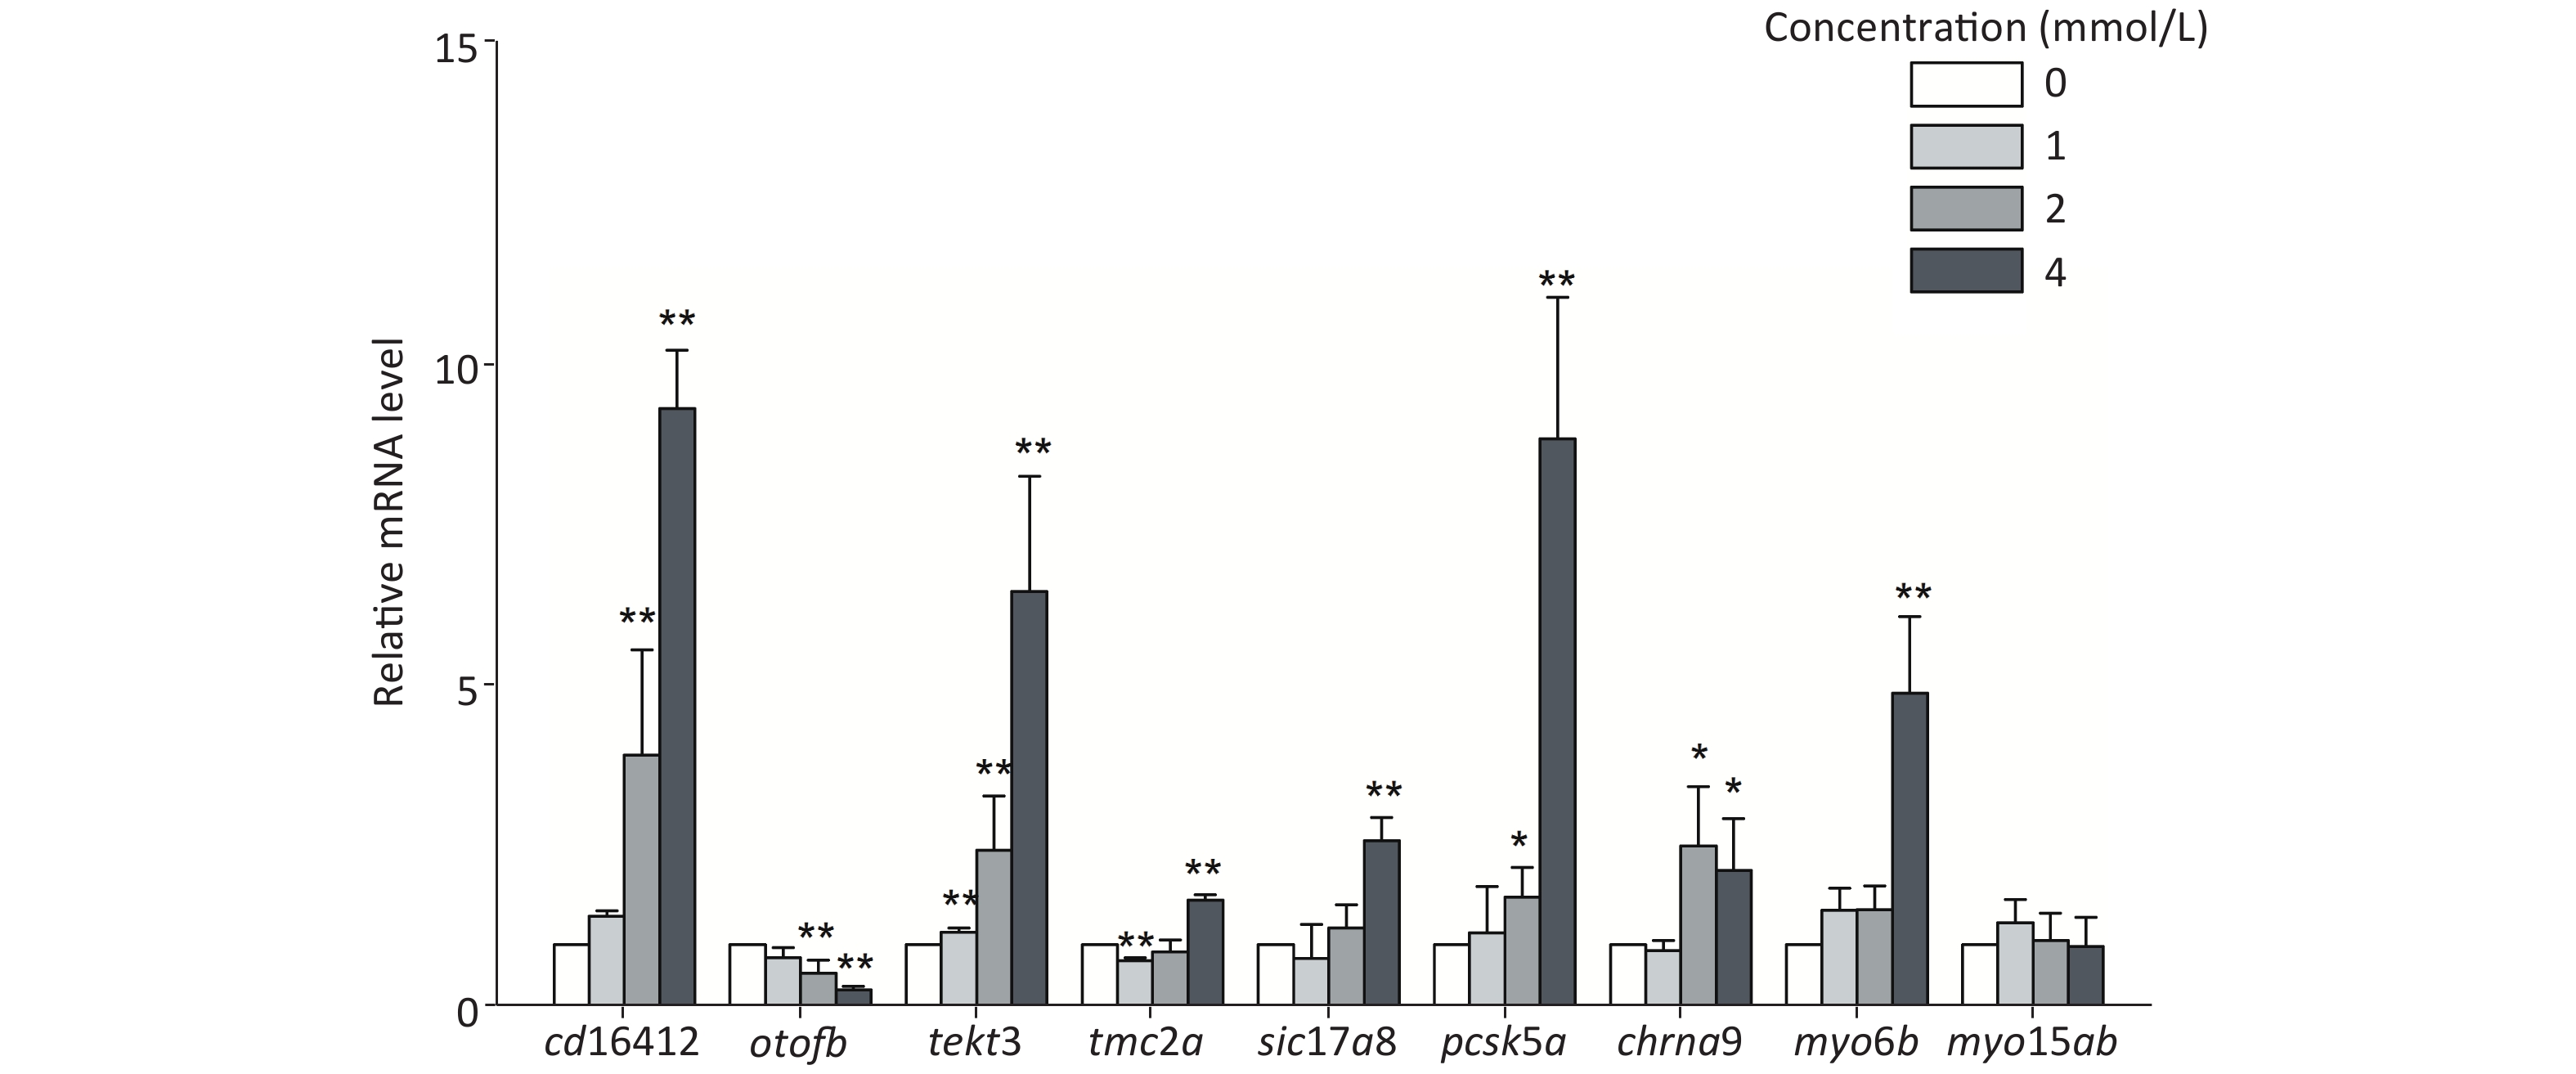
In this study, several auditory-related genes that have high homology with human and known functions were selected to measure the mRNA expression level under toluene exposure. The expression levels of cd164l2, tekt3, and pcsk5a were upregulated with increasing toluene concentration. The mRNA expression levels of cd164l2, tekt3, and pcsk5a in the highest concentration group were increased 9.30, 6.47, and 8.82 times, respectively, compared with those of the control group. The mRNA expression level of otofb gradually decreased, and was only 0.31 times that of the control at the highest concentration (4 mmol/L). Except for myo15ab, the other tested genes showed different degrees of expression disorder, mainly showing an upward trend in expression (Figure 4).
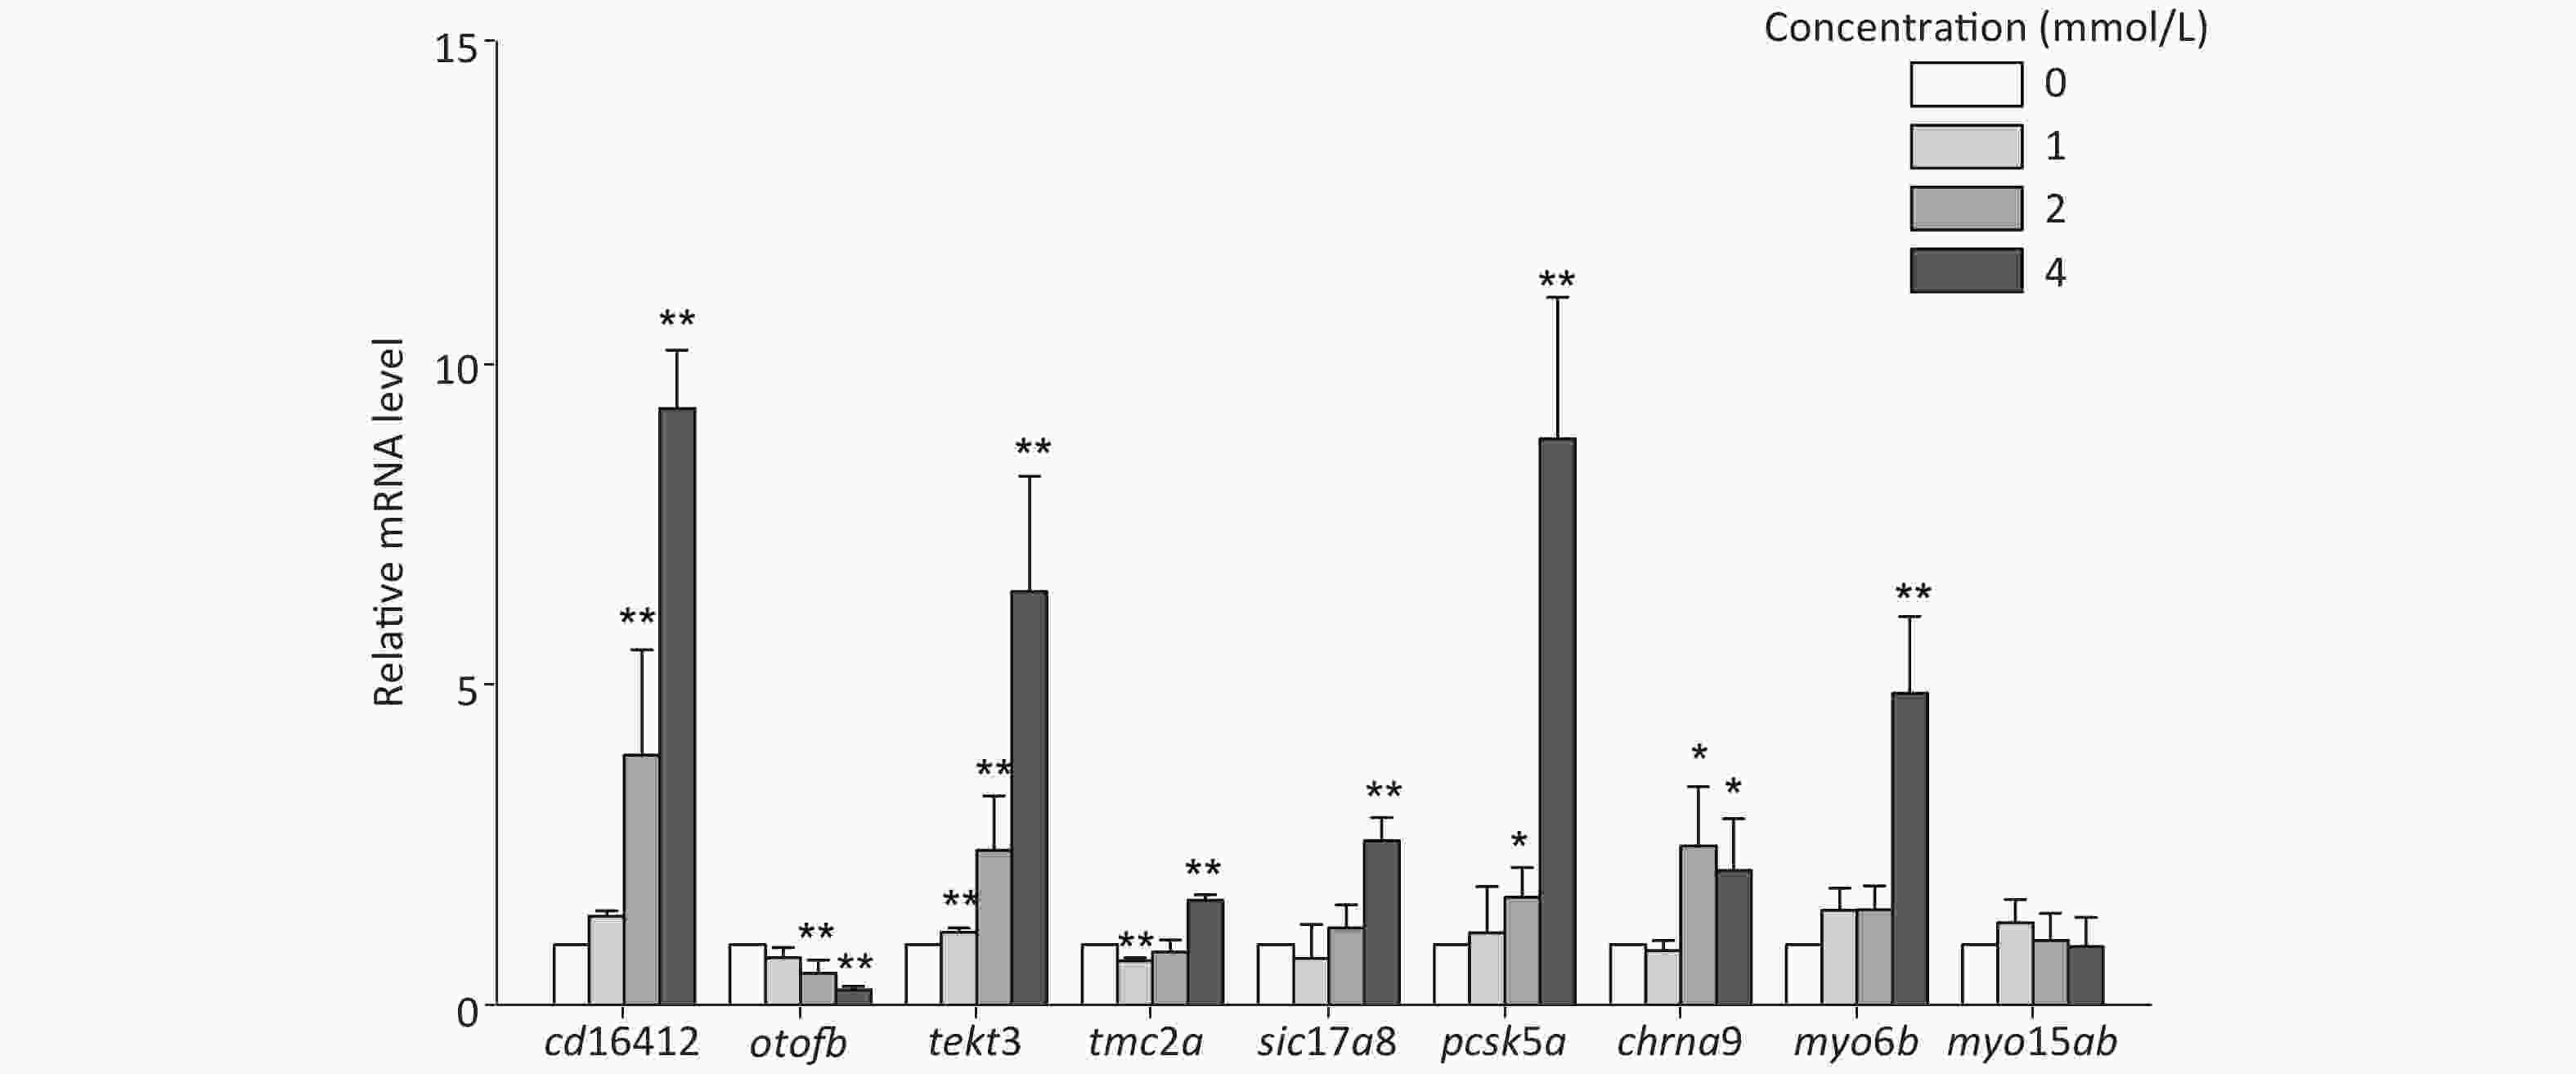
Figure 4. The mRNA expression level of hair cell development-related genes in 3 d post fertilization zebrafish was observed after toluene exposure. Data were acquired by qPCR and are expressed as the mean ± S.D. of three replicates, *P < 0.05, **P < 0.01, compared with the control group.
-
Toluene has become a common environmental pollutant due to many human activities. In addition to its toxic effects on the central nervous system, the ototoxicity of toluene has also been of serious concern, and has been observed in some animal models, such as mouse, rat, and guinea pig models, as well as in human populations[35-39]. However, few reports have addressed whether toluene has ototoxicity in aquatic organisms. To the best of our knowledge, this study is the first to use zebrafish as a model for exploring toluene-induced ototoxicity, in which the relevant tissue structures and the levels of expression of critical genes involved in inner ear and lateral neuromast development were analyzed.
The acute toxicity of toluene in fish species has been demonstrated in some previous studies. Korn et al. discussed the median tolerance limit (TLm) of toluene in pink salmon, in which the 96 h TLm ranged from 6.41 to 8.09 mg/L under different temperatures[40]. Some reports demonstrated the LC50 of toluene as 6.2–6.7 mg/L for 2- to 3-month-old sablefish (exposure time: 24–96 h), 21 mg/L for medaka embryos, and 55–72 mg/L for fathead minnow embryos[41-43]. Mizell et al. reported the LC50 of toluene as 0.1 mg/L for dechorionated zebrafish embryos[44]. In our study, toluene did not induce a strong lethal effect on zebrafish embryos/larvae at the tested concentrations, and the teratogenic effect was slightly increased, as the chorion of fish eggs provide a protective barrier between the embryos and the environment. However, it delayed the embryo hatching time, which was consistent with the effect of toluene on other experimental animals[45,46]. The results of the behavioral analysis showed that the distance travelled and the average swimming velocity of the 6 dpf larvae decreased as the toluene concentration increased. However, the movement frequency of the tested groups increased, which may have been caused by the neurotoxicity of toluene[47]. Several studies have reported that toluene can interfere with the function of several neurotransmitter receptors, resulting in an excitation effect in vitro[48,49]. Recently, Yavari et al.[47] reported that toluene can prominently induce cortical excitability and affect neuroplasticity under acute exposure to 200 ppm for 10 min in healthy humans by modulating NMDA receptor activity, as well as cortical glutamatergic and cholinergic neurotransmission. To understand the behavioral alterations caused by either neurotoxicity or damage to balance function, we observed the morphological characteristics of the inner ear and lateral line of zebrafish larvae. Although no obvious developmental malformations of larval inner ears were found under light microscopy, YO-Pro-1 staining showed that toluene notably inhibited the formation of hair cells in zebrafish lateral line neuromasts and in the MI1 area. The latter was located in the middle zebrafish lateral line neuromast[50]. This feature is similar to the ototoxicity of aminoglycoside antibiotics[38]. These results indicated that toluene may interfere with zebrafish locomotion behavior by affecting the formation of zebrafish lateral line neuromasts, while the increase in the frequency of larval movements may have been caused by toluene-induced excitation of the central nervous system, as suggested by previous studies[47,48].
Through thiouracil tagging in zebrafish, Erickson and Nicolson detected changes in the mRNA expression levels of sensory hair cells in 3 dpf zebrafish larvae[51]. In this study, genes with a remarkable alteration in expression levels at 3 dpf were selected to study the changes after toluene exposure. The results showed that there was a concentration-dependent increase in the mRNA expression levels of cd164l2, tekt3, and pcsk5a; however, the expression level of otofb was inhibited. Except for myo15ab, the other tested genes showed different degrees of expression disorder. Slc17a8, tmc2, otofb, myo6b, myo15ab, and chrna9 were highly correlated with zebrafish hearing, mechanical stimulation, iron ion transport, and other functions. Cd164l2 is involved in membrane formation, pcsk5a and otofb play an important role in zebrafish auditory and balance functions, and tekt3 is mainly involved in cilium assembly[52]. Studies have shown that unlike mammalian hair cells, zebrafish lateral line hair cells have the ability to regenerate after damage, which is similar to the regeneration ability of hair cells in birds[53,54]. After toluene exposure, tekt3, pcsk5a, and other genes involved in the formation of lateral line hair cells showed an upregulation trend in expression, which indicated that toluene likely induced hair cell regeneration by damaging the growth/formation of lateral line hair cells, which decreased the distance travelled and the velocity of zebrafish larvae. Chrna9, myo6b, and myo15ab are involved in the development of the inner ear of zebrafish[55], but no obvious changes in their expression levels were observed in this study. Meanwhile, no obvious changes in inner ear structure were found in the morphological observations, which indicated that the targets of toluene toxicity may be more associated with the development of the lateral line system than with the inner ear.
The molecular mechanism of toluene ototoxicity is not fully understood, and there are no relevant reports, to our knowledge, in aquatic models. In this preliminary study, the effects of toluene on the development of inner ear and lateral line neuromasts of zebrafish larvae and the related mechanism are presented. The results of this study were consistent with those observed in rats and other mammals. In addition, toluene affects a variety of auditory-related genes, interferes with the normal proliferation process of hair cells, especially in lateral line neuromasts, and further disorders sensing and balancing functions in aquatic animals. Additional insights into this mechanism must be revealed in future studies.
Funds:
This study was funded by the Natural Science Foundation of Guangdong Province [grant number 2011B050700001]
&These authors contributed equally to this work.
 Quick Links
 DownLoad: