


-
Tuberculosis (TB), caused by Mycobacterium tuberculosis, is a major infectious disease that seriously endangers human health[1–4]. In 2020, the World Health Organization (WHO) reported a global incidence rate of 130 per 100,000 people[1]. China has made substantial progress in tackling the TB epidemic; nevertheless, it still has the third largest number of cases worldwide, with a TB incidence rate of 58 per 100,000 people[1]. A study using interferon-γ release assays (IGRAs) showed that the prevalence of latent TB infection in China was 18.8%[5], whereas the prevalence of prior pulmonary TB (PTB), as assessed by chest X-ray (CXR), was as high as 24.2% in residents aged 50 years and above[6]. TB may cause persistent health impairment even after standard therapy; therefore, the end of a TB course is unlikely to represent the end of its impact on health[2].
Infertility, with a prevalence of 9%–25% in the general population, is a global public health concern that has been increasing every year[7–9]. Fallopian tubal obstruction is a common cause, accounting for 20%–30% of infertility cases[10]. Genital TB (GTB) is a common form of extrapulmonary TB secondary to hematogenous spread from foci in the lungs and is an important cause of infertility in women. The fallopian tubes are the most commonly affected sites, followed by the endometrium and ovaries[11, 12]. GTB has no specific clinical symptoms and is difficult to diagnose, and infertility may be the only symptom of the disease[11, 13]. The pregnancy outcome of GTB patients may be improved after anti-TB treatment[14].
In vitro fertilization and embryo transfer (IVF-ET) is widely used as infertility treatment, through which more than 5 million infants have been born worldwide[15]. Following the WHO recommendation of integrating TB screening and investigating reproductive health services in TB-prevalent regions, routine CXR examination is performed before IVF-ET in China to screen for active TB[16]. Lesions indicative of prior PTB, such as upper lung (calcified) nodule(s), fibrotic scars, and/or pleural thickening, are commonly found on CXR examinations[17]; nonetheless, many patients do not recall clinical symptoms of PTB, and no anti-TB therapy has been provided. There has been no literature report on whether untreated prior PTB on CXR would affect pregnancy outcome after IVF-ET. Also, it remains controversial whether preventive anti-TB treatment is required before IVF-ET for those with untreated prior or 'spontaneously healed' PTB.
Therefore, we performed a retrospective analysis of a large cohort of infertile women receiving IVF-ET to determine whether untreated prior PTB diagnosed by CXR could affect pregnancy outcomes.
-
This was a retrospective cohort study of patients who had undergone IVF-ET for infertility from January 1 to December 31, 2017, at Peking University Third Hospital, a tertiary referral hospital in Beijing, China. A total of 15,036 patients who had received IVF-ET cycles in the hospital’s reproductive center were screened. All patients had received CXR examinations before IVF-ET at the Peking University Third Hospital or other hospitals. To ensure consistency in CXR quality, we selected 14,254 patients (95.0%) whose CXR examinations were conducted in the aforementioned hospital. Based on the CXR results, patients were grouped into the prior PTB [1,487/14,254 (10.4%)] and non-PTB [12,767/14,254 (89.6%)] groups (Figure 1). Patients with active TB were excluded. Moreover, in the prior PTB group, 248 patients with a history of anti-TB therapy were excluded, and 1,239 untreated patients were enrolled for analysis. Additionally, 1,013 (81.8%) of 1,239 patients in the untreated prior PTB group and 9,673 (75.8%) of 12,767 in the non-PTB group had received endometrial biopsy before IVF-ET cycles, and no endometrial TB was detected. The remaining patients had not received an endometrial biopsy because of regular menstruation and normal B-mode ultrasound findings.
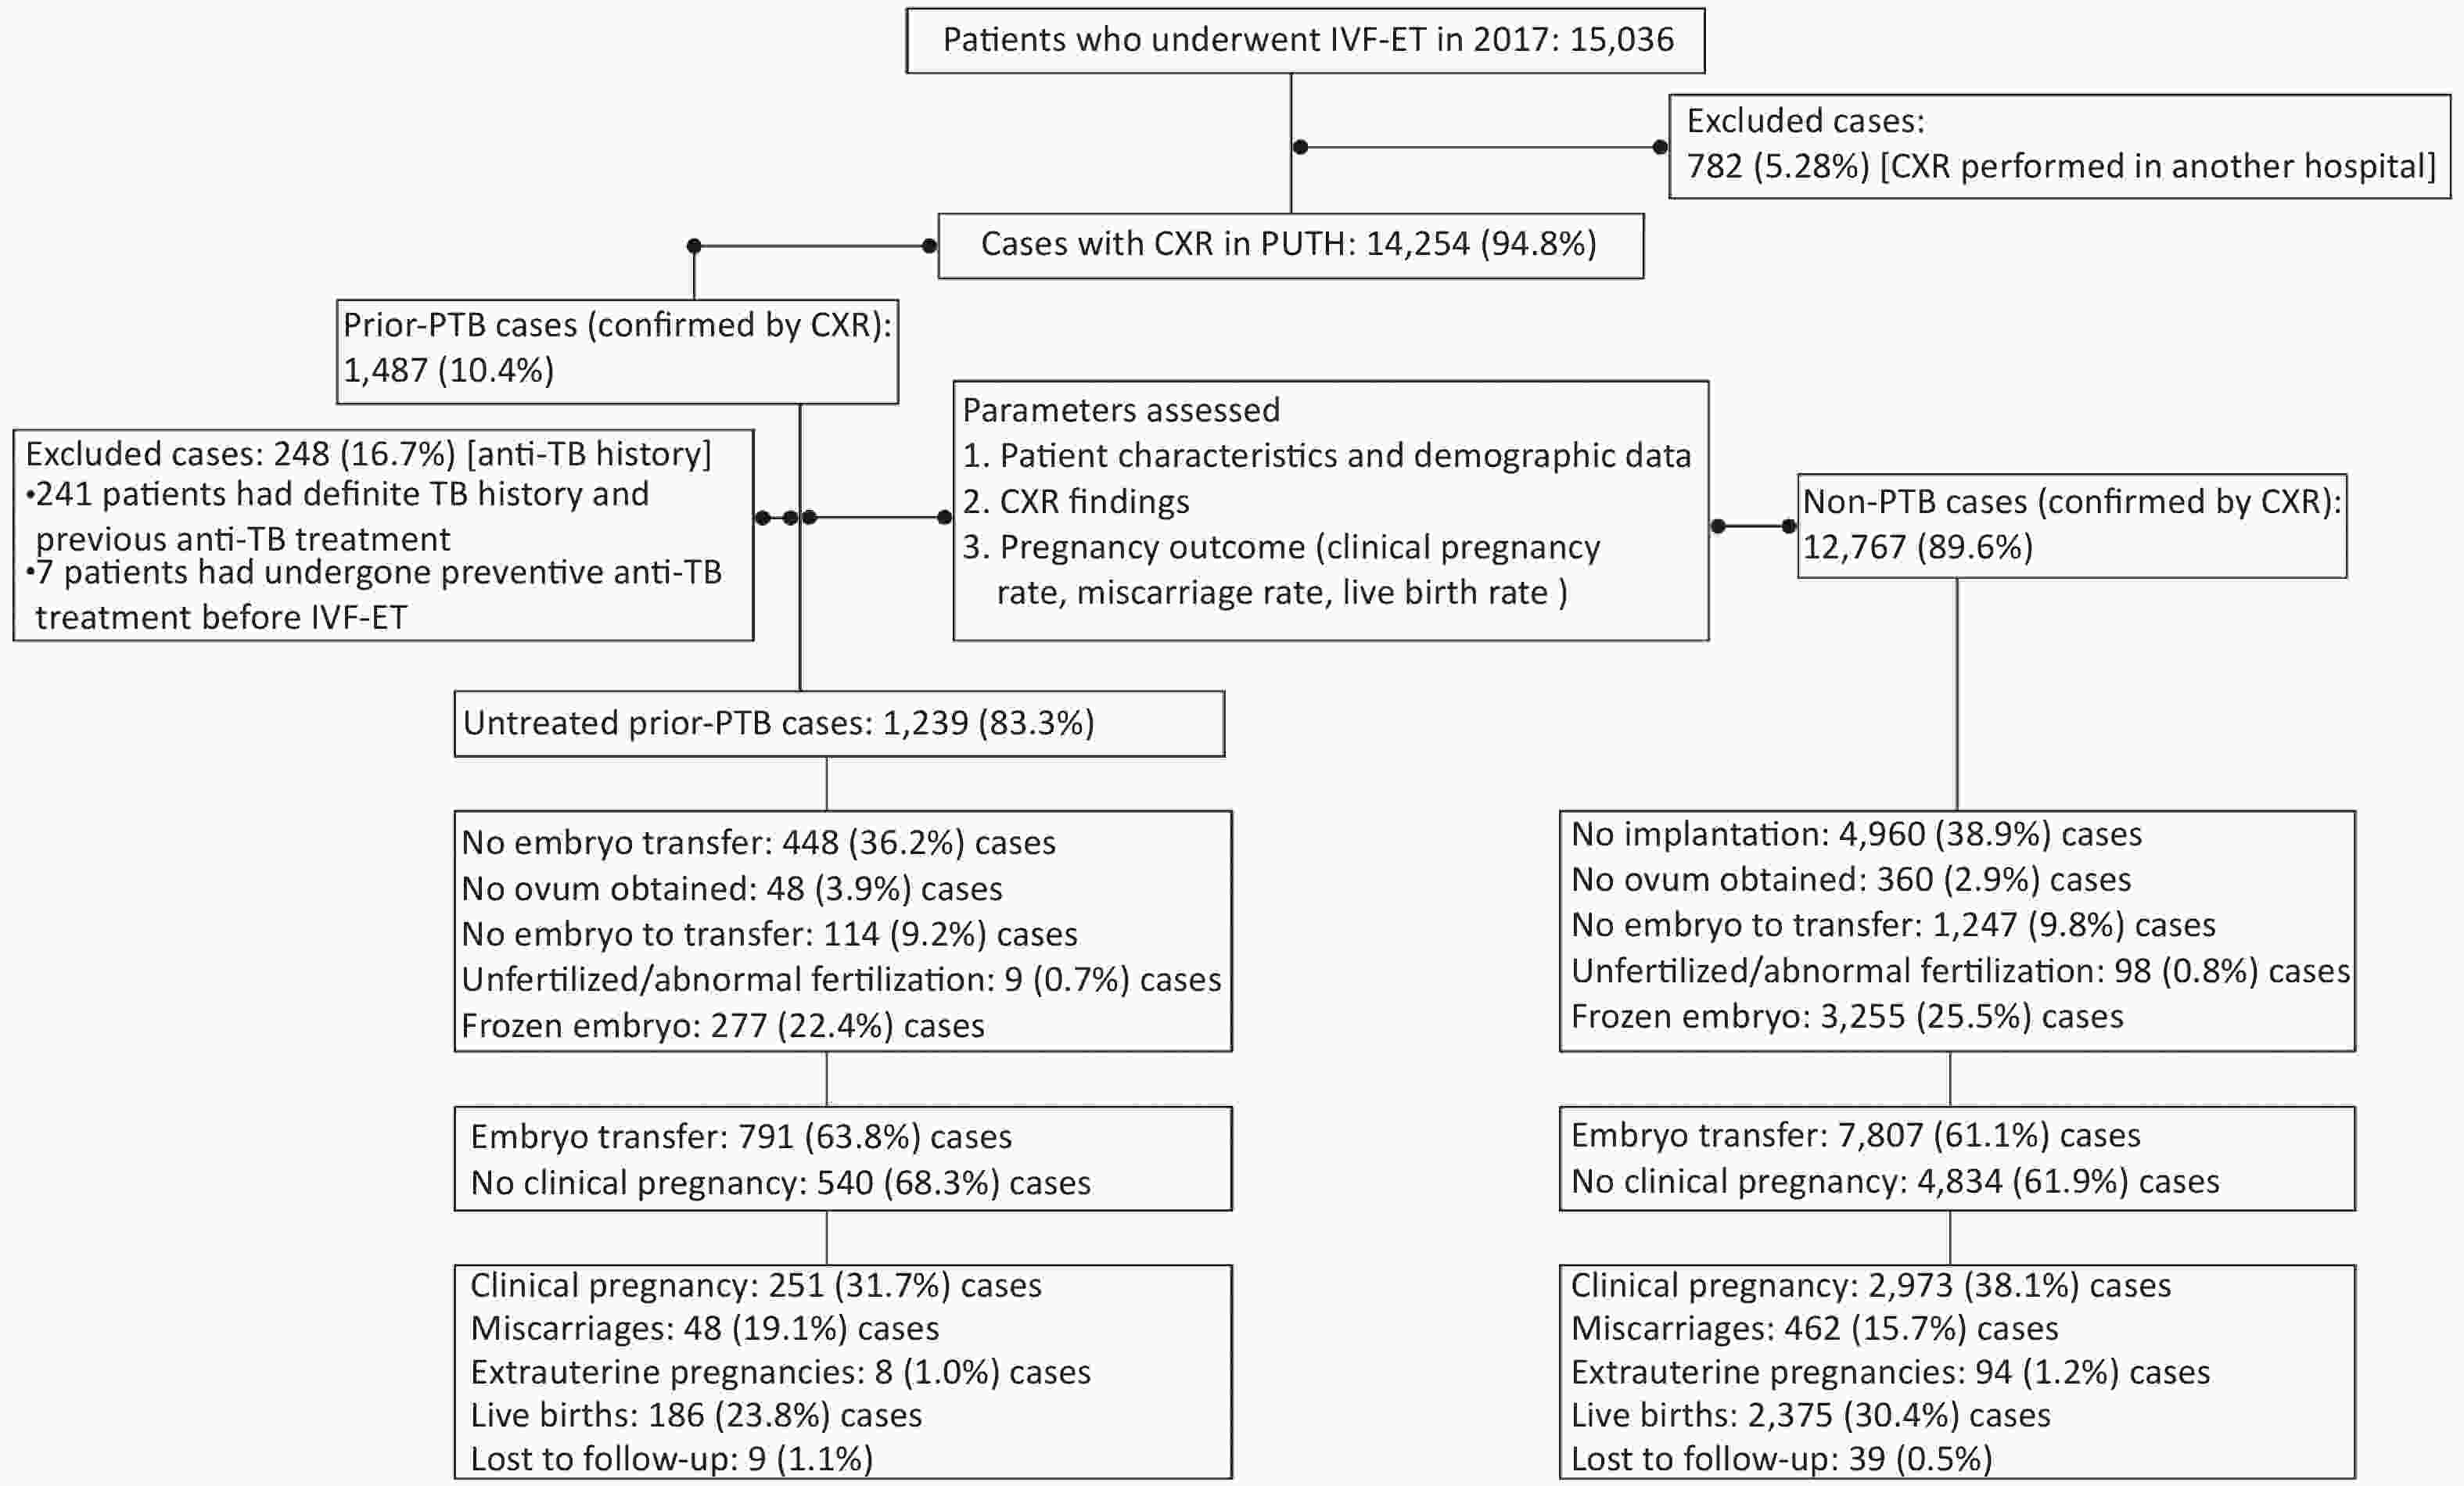
Figure 1. Flow of protocol and outcome. IVF-ET, in vitro fertilization and embryo transfer; CXR, chest X-ray; PTB, pulmonary tuberculosis; PUTH, Peking University Third Hospital
Prior PTB was defined as the presence of radiological signs indicative of old or inactive PTB[6, 17, 18], including upper lung discrete linear or reticular fibrotic scars, sclerotic or calcified foci, and pleural thickening with or without calcification of hilar or mediastinal lymph nodes. A distinct TB history was not necessary for this definition. Patients with sarcoidosis, other granulomatous diseases, infections, tumors, or occupation-related lung diseases were excluded. A TB specialist was consulted for CXR evaluation, and a chest radiologist and a respiratory specialist confirmed all CXR results.
From the case registration research database, detailed information on infertile patients who had undergone IVF-ET in the reproductive center was obtained, including age, body mass index (BMI), infertility years, infertility causes, and baseline hormone levels, such as follicle-stimulating hormone (FSH), luteinizing hormone (LH), estradiol (E2), progesterone (P), and anti-Müllerian hormone on the second day of the menstrual cycle. Furthermore, controlled ovarian hyperstimulation (COH) protocol, follicles after oocyte promotion, and endometrial thickness and pattern on the day of human chorionic gonadotropin (HCG) administration were recorded. A special team was assigned to follow the pregnancy outcomes.
This retrospective analysis was performed in accordance with The Code of Ethics of the World Medical Association (Declaration of Helsinki) and was approved by the Ethics Committee of Peking University Third Hospital [approval number: (2019)327-02; approval date: June 14, 2019]. The need for informed consent was waived.
-
According to the WHO manual for the standardized investigation and diagnosis of infertile couples, the causes of infertility were classified as male causes, female fallopian tubal ovulation, polycystic ovary syndrome, and endocrine disorders. Some patients had two or more causes of infertility. Unexplained infertility (UI) was considered after common causes were excluded[19]. The cause of infertility was recorded and classified for each patient.
-
All patients underwent a standardized COH protocol, oocyte retrieval, fertilization, and embryo transfer[20]. In short, the COH protocol was performed as described previously[20]. The four sex hormones (FSH, LH, E2, and P) and antral follicle numbers were examined on the second and third days of the menstrual cycle. All embryos were transferred on the third day after oocyte pickup. From the day of embryo transfer (ET), vaginal progesterone (8% Crinone vaginal gel, Merck-Serono, Switzerland) was used daily to provide routine luteal support to maintain lutein function until the 10th week of pregnancy. Serum HCG was detected on day 14 after transplantation; if the pregnancy was confirmed, HCG was detected again on day 21 after transplantation, and the pregnancy sac and fetal heartbeat were examined using ultrasound on days 30 and 37, respectively, after transplantation.
-
The primary outcome was the live birth rate. Live birth was defined as the delivery of a living fetus (or living fetuses) beyond 28 weeks’ gestation (calculated as live birth per embryo transfer). The secondary outcomes were clinical pregnancy and miscarriage rates. Clinical pregnancy was defined as fetal cardiac activity at 30 days after the ET procedure, detected through sonography (calculated as clinical pregnancy per embryo transfer). Miscarriage was defined as pregnancy loss before 28 weeks’ gestation (calculated among women who became pregnant).
-
The sample size was calculated based on the sample size requirement of multivariate logistic regression. According to the number of events per variable in the multivariate logistic regression model[21], 10 events were required for each variable in the logistic regression model. We explored the effect of untreated prior PTB on pregnancy outcomes after adjustment for age, BMI, endometrial thickness, number of good-quality embryos per cycle, COH protocol, and infertility causes; and among these, the COH protocol and infertility causes were divided into several dummy variables. There were 19 variables (including the dummy variables) in the logistic regression model, and at least 190 live birth events were required. The live birth rate in our study center ranged from 30% to 35%[20], and therefore, 633 cases were needed to be included in the study. Taking the statistical power of subgroup analysis and design effect into account, 1,266 cases had to be included in this study.
-
Statistical analysis was performed using SPSS version 23 (IBM Corp., Armonk, NY, USA). Continuous variables are expressed as mean ± standard deviation or as median (interquartile range) and analyzed using independent-sample t-tests or the Mann-Whitney U test, as appropriate. Categorical variables, such as infertility cause and COH protocol, were summarized with numbers and proportions and analyzed using the chi-square test.
Given the complexity of the process of IVF-ET and pregnancy, several factors might affect pregnancy outcomes; hence, multivariate logistic regression was used to assess the effects of exposure factors on the primary and secondary outcomes. Pregnancy outcomes, including the clinical pregnancy, miscarriage, and live birth rates, were the dependent variables in the logistic regression model, whereas age, BMI, COH protocol, endometrial thickness, number of good-quality embryos per cycle, and CXR with or without untreated prior PTB were the independent variables. To explore the different effects of untreated prior PTB on pregnancy outcomes, subgroup analyses were conducted. Based on infertility causes, the patients were divided into nine subgroups, and multivariate logistic regression was also performed in these subgroup analyses. Adjusted odds ratios (ORs), 95% confidence intervals (CIs), and P-values were reported. A two-tailed P-value of < 0.05 was considered statistically significant.
-
A total of 14,254 women (mean age, 33.1 years; range, 20–50 years) who were referred to the reproductive center between January 1 and December 31, 2017, were enrolled in this study (Figure 1 and Supplementary Figure S1 available in www.besjournal.com). Based on CXR findings, 1,487 (10.4%) had signs of prior PTB and were assigned to the prior PTB group, whereas 12,767 (89.6%) were assigned to the non-PTB group. In the prior PTB group, 248 (16.7%) were excluded because of a history of anti-TB therapy, and the remaining 1,239 (83.3%) patients without such a history were assigned to the untreated prior PTB group. One patient in the untreated PTB group had a fever at 12 weeks of pregnancy and was confirmed to have acute miliary TB. Pregnancy was terminated due to spontaneous abortion.
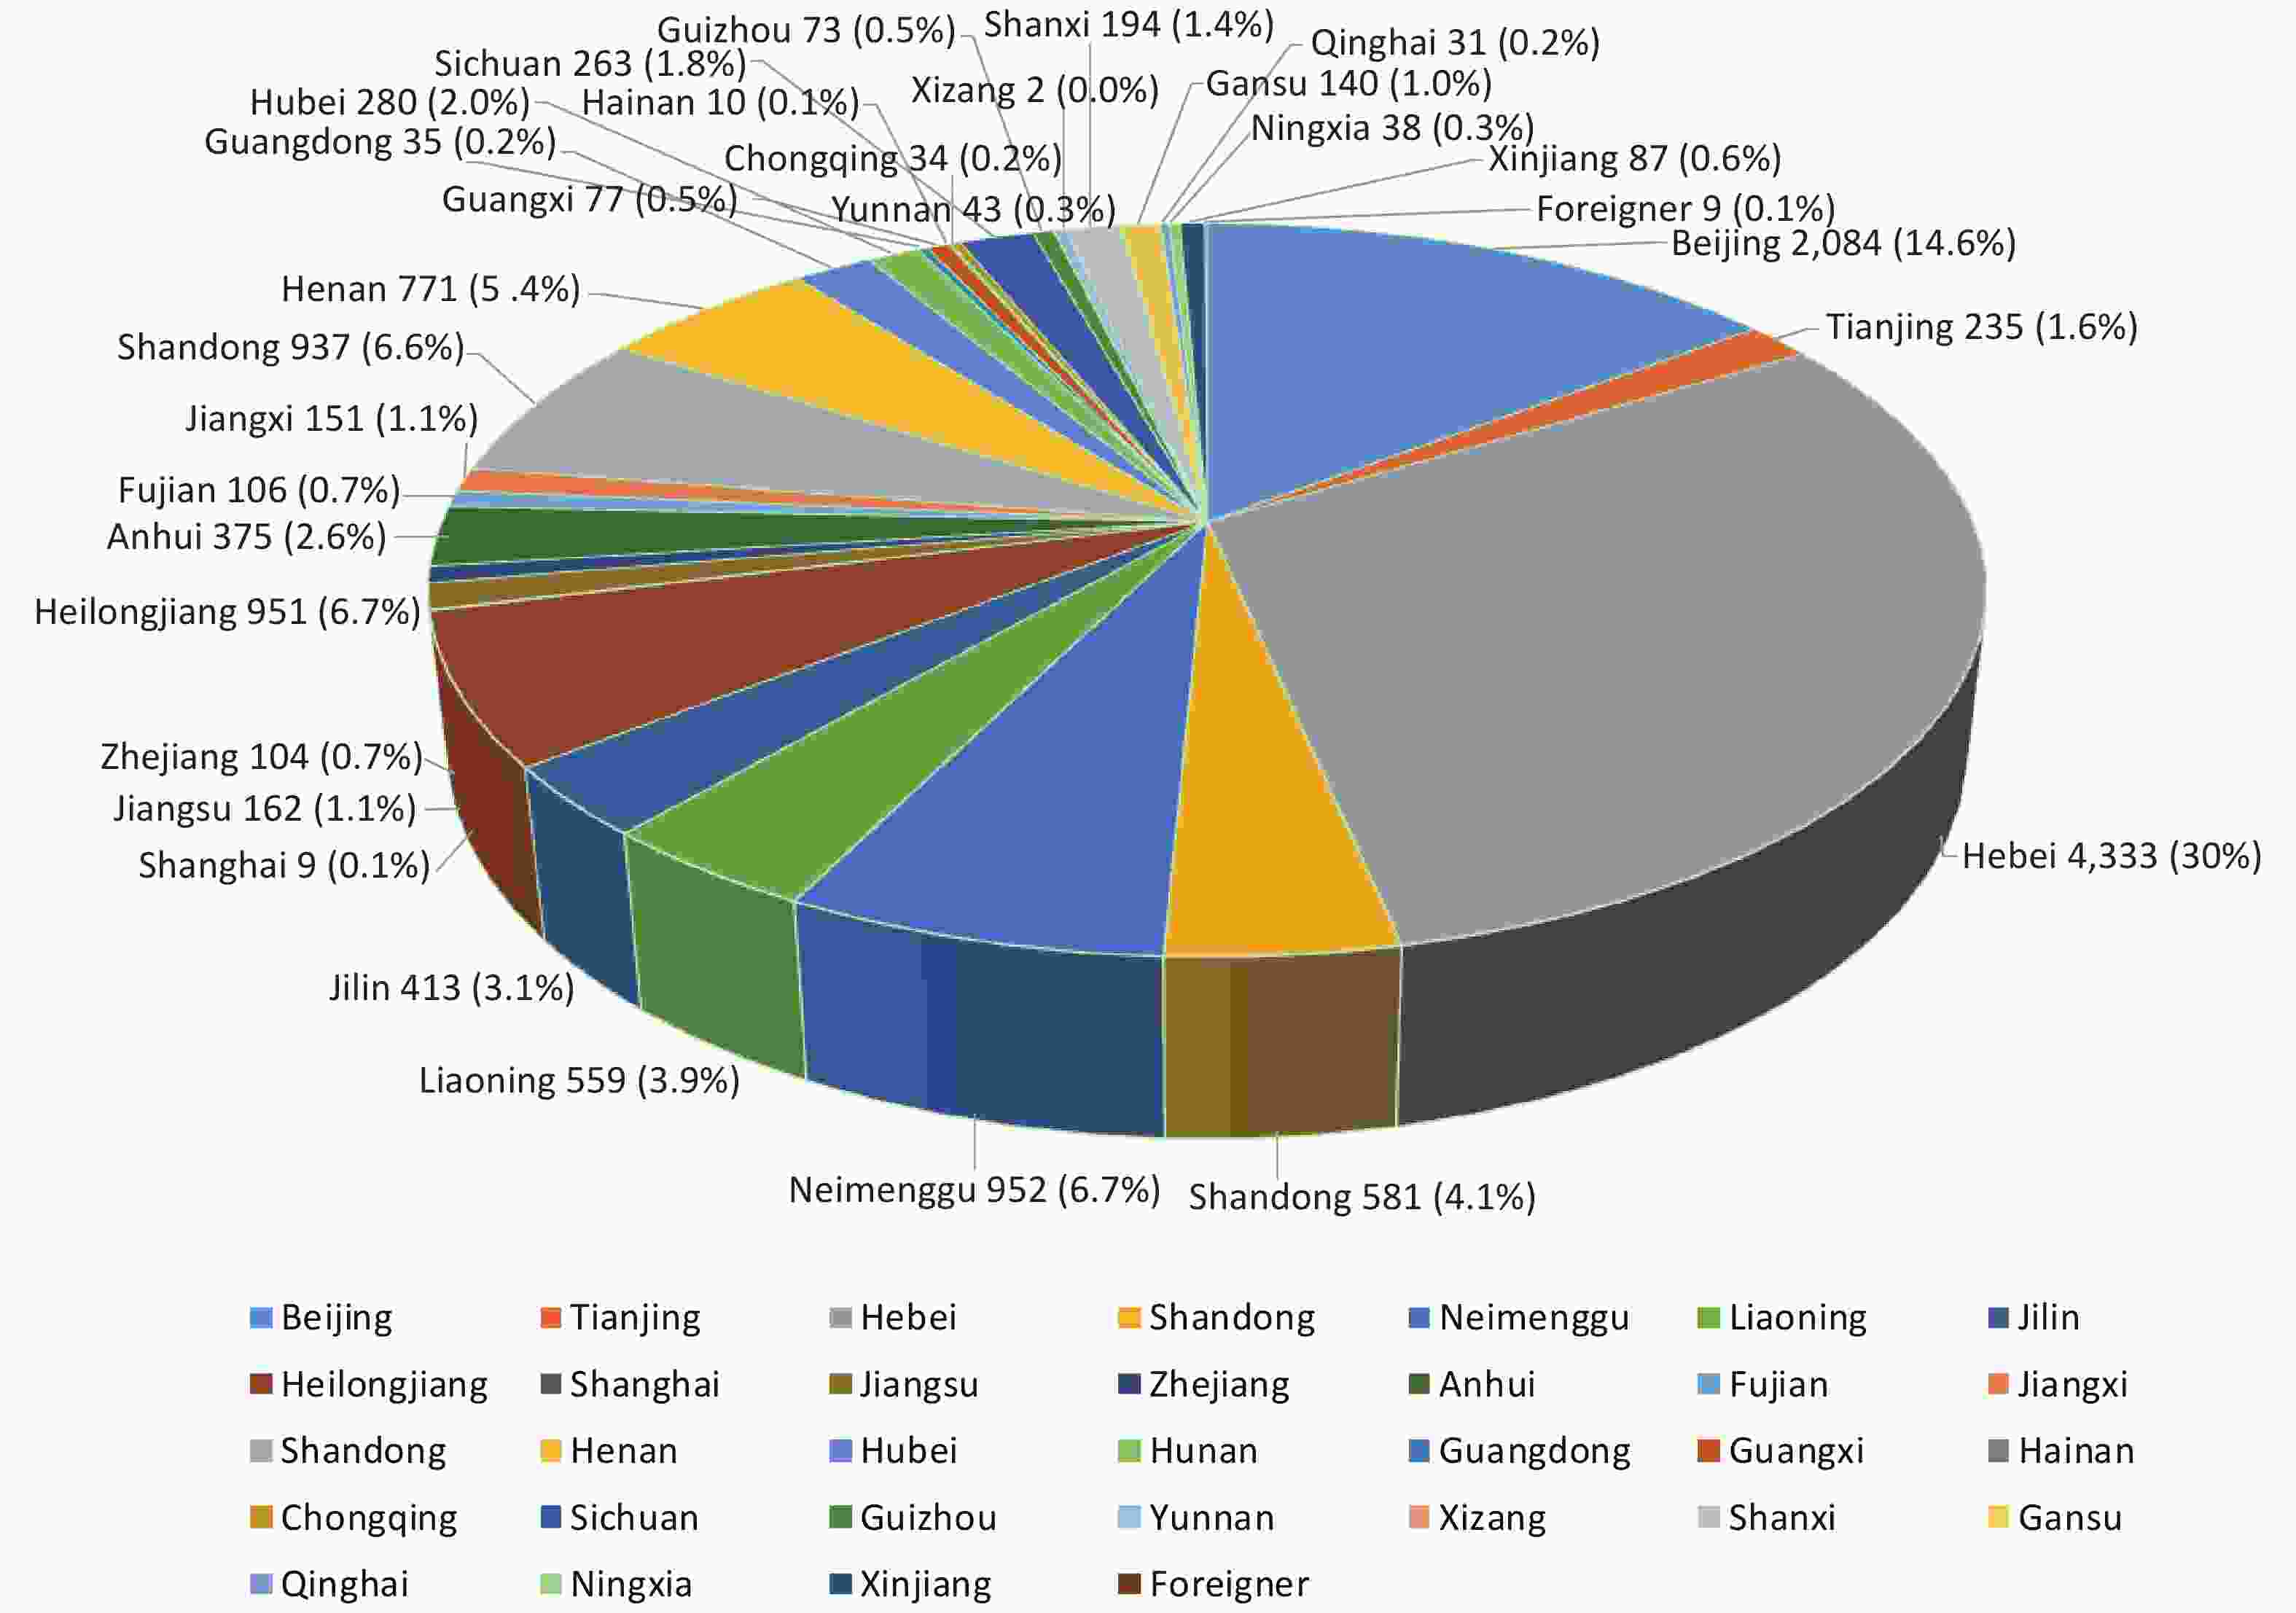
Figure S1. Patients' residence (n = 14,254)
We compared the baseline characteristics of patients in the untreated prior PTB (n = 1,239) and non-PTB (n = 12,767) groups who had received COH (Supplementary Table S1 available in www.besjournal.com). We also compared patients in the untreated prior PTB (n = 791) and non-PTB (n = 7,807) groups who had received ET (Table 1). The results of the comparative analysis for these two groups were similar (Table 1 and Supplementary Table S1). Patients in the untreated prior PTB group were older (34.8 ± 5.0 vs. 33.0 ± 5.0 years), had longer infertile periods (4.6 ± 4.0 vs. 4.3 ± 3.7), and had lower BMI values (22.6 ± 3.5 vs. 23.1 ± 3.8) than those in the non-PTB group (all P < 0.05; Table 1). Tubal factors were the most common cause of infertility in both groups, and the proportion of tubal factors as an infertility cause was higher in the untreated prior PTB group than in the non-PTB group. The untreated prior PTB group had lower numbers of total follicles (10.1 ± 5.4 vs. 11.1 ± 5.5), retrieved oocytes (9.3 ± 4.9 vs. 10.0 ± 5.2), and good-quality embryos per cycle compared with the non-PTB group [3.0 (1.0, 5.0) vs. 3.0 (2.0, 6.0); all P < 0.05; Table 1].
Characteristics Untreated Prior-PTB Group (n = 1,239) Non-PTB Group (n = 12,767) P Value Age (years) 34.4 ± 5.2 32.9 ± 5.1 < 0.001* Body mass index, kg/m2 22.5 ± 3.6 22.9 ± 3.7 < 0.001* Duration of infertility (years) 4.8 ± 4.1 4.2 ± 3.7 < 0.001* Causes of infertility, no. (%) 0.005* Female factors Fallopian tube factor 345 (23.2) 2,312 (18.1) PCOS 133 (10.8) 1,391 (10.9) Endometriosis 18 (1.5) 179 (1.4) Mixed female factors 178 (14.4) 1,542 (12.1) Other female factors 46 (3.7) 590 (4.6) Male factors Oligospermia/asthenospermia 131 (10.6) 1,549 (12.1) Other male factors 62 (5.0) 2,312 (18.1) Mixed female and male factors 281 (22.7) 2,778 (21.8) Unexplained infertility 131 (10.6) 1,570 (12.3) COH protocol < 0.01* Ultralong GnRH agonist 125 (10.1) 1,433 (11.2) Short GnRH agonist 47 (3.8) 417 (3.3) GnRH antagonist 633 (51.1) 6,730 (52.7) Microsimulation cycle 82 (6.6) 512 (4.0) Long GnRH agonist 339 (27.4) 3,498 (27.4) Natural or other 13 (1.0) 177 (1.4) Basic hormone FSH, mIU/mL 6.3 (4.6–8.3) 6.2 (4.6–7.9) 0.024* LH, mIU/mL 3.2 (2.0–4.9) 3.3 (2.0–5.0) 0.197 E2, pg/mL 156.0 (117.0–200.0) 158.0 (119.0–203.0) 0.440 P, nmol/L 1.0 (0.8–1.4) 1.1 (0.8–1.5) 0.289 AMH, ng/mL 2.2 (1.0–4.2) 2.4 (1.1–4.5) 0.051 Total sinus follicles 10.7 ± 6.0 11.8 ± 5.9 < 0.001* No. of retrieved oocytes 11.0 ± 7.4 12.2 ± 8.2 < 0.001* Note. Mixed female factors, mixed with two or more female infertile factors. Mixed female and male factors, mixed with two or more infertile factors of both sexes.
Abbreviations: PTB, pulmonary tuberculosis; BMI, body mass index; PCOS, polycystic ovary syndrome; COH, controlled ovarian hyperstimulation; FSH, follicle-stimulating hormone; LH, luteinizing hormone; E2, estradiol; P, prolactin; AMH, anti-Müllerian hormone.
*P < 0.05.Table S1. Characteristics of the total infertile patients at baseline
Characteristics Untreated prior-PTB group (n = 791) Non-PTB group (n = 7,807) P value Age (years) 34.8 ± 5.0 33.0 ± 5.0 < 0.001a BMI, kg/m2 22.6 ± 3.5 23.1 ± 3.8 < 0.001a Duration of infertility (years) 4.6 ± 4.0 4.3 ± 3.7 0.017a Causes of infertility, no. (%) 0.081 Female factors Fallopian tube factor 185 (23.4) 1,582 (20.3) PCOS 60 (9.8) 799 (10.3) Endometriosis 10 (1.3) 108 (1.4) Mixed female factors 113 (14.3) 906 (11.6) Other female factors 20 (2.5) 241 (3.1) Male factors Oligospermia/asthenospermia 92 (11.6) 1,023 (13.1) Other male factors 39 (4.9) 512 (6.6) Mixed female and male factors 170 (21.5) 1,682 (21.5) Unexplained infertility 84 (10.6) 954 (12.2) COH protocol 0.034a Ultralong GnRH agonist 85 (10.7) 939 (12.0) Short GnRH agonist 31 (3.9) 251 (3.2) GnRH antagonist 404 (51.1) 4,119 (52.8) Microsimulation cycle 39 (4.9) 227 (2.9) Long GnRH agonist 228 (28.8) 2,225 (28.5) Natural or other 4 (0.5) 46 (0.6) Baseline hormone FSH, mIU/mL 6.3 (4.6–8.2) 6.3 (4.7–7.9) 0.328 LH, mIU/mL 3.1 (1.9–4.6) 3.2 (2.0–4.7) 0.191 E2, pg/mL 156.0 (119.0–202.0) 158.0 (120.0–203.0) 0.582 P, nmol/L 1.0 (0.8–1.4) 1.1 (0.8–1.5) 0.040a AMH, ng/mL 2.1 (1.1–3.5) 2.2 (1.1–3.9) 0.143 No. of total sinus follicles 10.1 ± 5.4 11.1 ± 5.5 < 0.001a No. of retrieved oocytes 9.3 ± 4.9 10.0 ± 5.2 < 0.001a Endometrial thickness (mm) 10.78 ± 1.71 10.74 ± 1.75 0.534 Endometrial pattern 0.095 A 702 (88.7) 6,721 (86.1) A–B 3 (0.4) 34 (0.4) B 77 (9.7) 991 (12.7) C 0 (0.0) 2 (0.0) No. of good-quality embryos per cycleb 3.0 (1.0, 5.0) 3.0 (2.0, 6.0) < 0.001a No. of embryos transferred < 0.001a 1 154 (19.6) 1,161 (15.0) 2 630 (80.4) 6,593 (85.0) Note. Mixed female factors, mixed with two or more female infertile factors. Mixed female and male factors, mixed with two or more factors of infertility of both sexes.
ET, embryo transfer; BMI, body mass index; PTB, pulmonary tuberculosis; PCOS, polycystic ovary syndrome; COH, controlled ovarian hyperstimulation; GnRH, gonadotropin-releasing hormone; FSH, follicle-stimulating hormone; LH, luteinising hormone; E2, oestradiol; P, prolactin; AMH, anti-Müllerian hormone.
aP < 0.05.
bEmbryos were evaluated on the third day after fertilization. All good-quality embryos were developed from two pronuclei zygotes and met the following criteria: (1) more than five blastomeres; (2) size difference of less than 20%; and (3) fragmentation of less than 50%.
Data on BMI, endometrial thickness, endometrial pattern, and number of embryos transferred were missing for 80 cases, 1,418 cases, 68 cases, and 60 cases, respectively, in the general research population.Table 1. Characteristics of infertile patients who underwent ET cycles
-
The clinical pregnancy rate was significantly lower in the untreated prior PTB group than in the non-PTB group (31.7% vs. 38.1%, P < 0.001). The miscarriage rate was slightly higher in the prior PTB group than in the non-PTB group; however, the difference was not significant (19.1% and 15.5%, P = 0.135). Additionally, the live birth rate was significantly lower in the untreated prior PTB group than in the non-PTB group (23.8% vs. 30.6%, P < 0.001; Table 2).
Pregnancy outcomes Untreated prior-PTB group Non-PTB group P value Clinical pregnancy ratea 31.7% (251/791) 38.1% (2,973/7,807) < 0.001d Miscarriage rateb 19.1% (48/251) 15.5% (462/2,973) 0.135 Live birth ratec 23.8% (186/782) 30.6% (2,375/7,768) < 0.001d Note. PTB, pulmonary tuberculosis.
aClinical pregnancy rate was defined as clinical pregnancy per embryo transfer.
bMiscarriage rate was defined as miscarriages per clinical pregnancy.
cLive birth rate was defined as live birth per embryo transfer.
dP < 0.05.Table 2. Pregnancy outcomes in the untreated prior-PTB and non-PTB groups
-
The results indicated that age, BMI, COH protocol, endometrial thickness, and number of good-quality embryos per cycle had significant effects on the clinical pregnancy, miscarriage, and live birth rates (Supplementary Table S2 available in www.besjournal.com). After adjustment for these factors, the results indicated that untreated prior PTB was an independent risk factor for decreased live birth rate (OR, 0.80; 95% CI, 0.66–0.98; P = 0.028) in infertile patients (Table 3 and Supplementary Table S2). Patients with untreated prior PTB tended to have fewer clinical pregnancies and more miscarriages than non-PTB patients; nonetheless, the differences were not statistically significant (P = 0.119 and 0.214, respectively; Table 3 and Supplementary Table S2).
Outcomes Variables OR (95% CI) P value Clinical pregnancy (n = 8,593) Untreated prior-PTB vs. non-PTB group 0.87 (0.72–1.04) 0.119 Age < 0.001* 31–35 years vs. ≤ 30 years 0.96 (0.86–1.08) 0.492 36–40 years vs. ≤ 30 years 0.59 (0.51–0.69) < 0.001* 41–45 years vs. ≤ 30 years 0.25 (0.19–0.32) < 0.000* ≥ 46 years vs. ≤ 30 years 0.08 (0.02–0.25) < 0.001* BMI 0.99 (0.98–1.00) 0.161 Endometrial thickness 1.08 (1.05–1.12) < 0.001* No. of good-quality embryos per cycle 1.10 (1.08–1.12) < 0.001* COH protocol < 0.001* Ultralong GnRH agonist vs. natural 1.32 (0.50–3.47) 0.578 Long GnRH agonist vs. natural 0.86 (0.32–2.35) 0.773 Short GnRH agonist vs. natural 0.82 (0.31–2.14) 0.684 GnRH antagonist vs. natural 1.10 (0.40–3.01) 0.852 Microsimulation cycle vs. natural 1.18 (0.45–3.08) 0.743 Infertile causes 0.177 Unexplained infertility vs. PCOS 1.23 (0.99–1.54) 0.068 Mixed female factors vs. PCOS 0.91 (0.72–1.15) 0.441 Mixed female and male factors vs. PCOS 1.04 (0.85–1.28) 0.715 Oligospermia/asthenospermia vs. PCOS 1.13 (0.91–1.40) 0.283 Other male factors vs. PCOS 0.95 (0.68–1.33) 0.763 Other female factors vs. PCOS 1.01 (0.78–1.31) 0.944 Fallopian tube factor vs. PCOS 1.13 (0.92–1.38) 0.263 Endometriosis 0.95 (0.60–1.50) 0.826 Miscarriage (n = 3,222) Untreated prior-PTB vs non-PTB group 1.26 (0.87–1.83) 0.214 Age < 0.001* 31–35 years vs. ≤ 30 years 1.07 (0.83–1.39) 0.596 36–40 years vs. ≤ 30 years 2.38 (1.76–3.21) < 0.001* 41–45 years vs. ≤ 30 years 5.36 (3.22–8.93) < 0.001* ≥ 46 years vs. ≤ 30 years − 0.999 BMI 1.03 (1.00–1.06) 0.048 Endometrial thickness 0.92 (0.87–0.99) 0.019* No. of good-quality embryos per cycle 0.98 (0.95–1.02) 0.365 COH Protocol 0.315 Ultralong GnRH agonist vs. natural 0.27 (0.05–1.41) 0.119 Long GnRH agonist vs. natural 0.45 (0.08–2.56) 0.370 Short GnRH agonist vs. natural 0.29 (0.06–1.50) 0.139 GnRH antagonist vs. natural 0.20 (0.03–1.21) 0.080 Microsimulation cycle vs. natural 0.29 (0.06–1.52) 0.144 Infertile causes 0.237 Unexplained infertility vs. PCOS 1.31 (0.81–2.10) 0.269 Mixed female factors vs. PCOS 1.47 (0.90–2.42) 0.128 Mixed female and male factors vs. PCOS 0.99 (0.63–1.55) 0.958 Oligospermia/asthenospermia vs. PCOS 1.05 (0.65–1.71) 0.831 Other male factors vs. PCOS 1.62 (0.83–3.15) 0.156 Other female factors vs. PCOS 1.21 (0.67–2.18) 0.523 Fallopian tube factor vs. PCOS 0.96 (0.61–1.52) 0.865 Endometriosis 1.84 (0.76–4.49) 0.178 Live birth (n = 8,545) Untreated prior-PTB vs. non-PTB group 0.80 (0.66–0.98) 0.028* Age < 0.001* 31–35 years vs. ≤ 30 years 0.95 (0.84–1.07) 0.413 36–40 years vs. ≤ 30 years 0.50 (0.43–0.59) < 0.001* 41–45 years vs. ≤ 30 years 0.17 (0.12–0.23) < 0.001* ≥ 46 years vs. ≤ 30 years − 0.997 BMI 0.98 (0.97–1.00) 0.009* Endometrial thickness 1.11 (1.08–1.15) < 0.001* No. of good-quality embryos per cycle 1.09 (1.07–1.11) < 0.001* COH Protocol < 0.001* Ultralong GnRH agonist vs. natural 2.05 (0.59–7.15) 0.262 Long GnRH agonist vs. natural 1.16 (0.32–4.18) 0.826 Short GnRH agonist vs. natural 1.32 (0.38–4.57) 0.664 GnRH antagonist vs. natural 1.93 (0.53–6.97) 0.319 Microsimulation cycle vs. natural 1.87 (0.54–6.51) 0.324 Infertile causes 0.073 Unexplained infertility vs. PCOS 1.20 (0.95–1.53) 0.131 Mixed female factors vs. PCOS 0.86 (0.67–1.11) 0.250 Mixed female and male factors vs. PCOS 1.08 (0.86–1.35) 0.522 Oligospermia/asthenospermia vs. PCOS 1.15 (0.91–1.46) 0.237 Other male factors vs. PCOS 0.88 (0.61–1.28) 0.505 Other female factors vs. PCOS 1.01 (0.77–1.34) 0.924 Fallopian tube factor vs. PCOS 1.17 (0.93–1.46) 0.180 Endometriosis 0.93 (0.57–1.52) 0.768 Note. Abbreviations: PTB, pulmonary tuberculosis; BMI, body mass index; PCOS, polycystic ovary syndrome; COH, controlled ovarian hyperstimulation; PCOS, polycystic ovary syndrome.
*P < 0.05.Table S2. Multivariate logistic regression analyses for pregnancy outcomes
Variable Clinical pregnancy rate (n = 8,598) Miscarriage rate (n = 3,222) Live birth rate (n = 8,545) OR (95% CI) P value OR (95% CI) P value OR (95% CI) P value Untreated prior PTB vs. non-PTB 0.87 (0.72–1.04) 0.119 1.26 (0.87–1.83) 0.214 0.80 (0.66–0.98) 0.028a Note. Factors were adjusted for age, BMI, infertile causes, controlled ovarian hyperstimulation protocol, endometrial thickness, and number of good-quality embryos per cycle.
OR, odds ratio; CI, confidence interval; PTB, pulmonary tuberculosis; BMI, body mass index.
aP < 0.05.Table 3. Multivariable logistic regression analyses for pregnancy outcomes
-
In the UI subgroup, untreated prior PTB was shown to be a risk factor for increased miscarriage (OR, 4.19; 95% CI, 1.69–10.39; P = 0.002) and decreased live birth (OR, 0.45; 95% CI, 0.24–0.83; P = 0.011) rates (Table 4).
Different infertile populations Clinical pregnancy rate Miscarriage rate Live birth rate n OR P value n OR P value n OR P value General research population 7,167 0.87 (0.72, 1.04) 0.119 2,703 1.26 (0.87, 1.83) 0.214 7,124 0.80 (0.66, 0.98) 0.028a Fallopian tube factor 1,459 0.75 (0.52, 1.08) 0.124 595 1.14 (0.51, 2.53) 0.753 1,445 0.68 (0.46, 1.02) 0.059 PCOS 697 1.04 (0.55, 1.94) 0.912 205 1.38 (0.36, 5.27) 0.637 693 0.81 (0.39, 1.70) 0.576 Endometriosis 101 1.10 (0.17, 6.94) 0.923 37 – 0.999 101 1.90 (0.27, 13.46) 0.520 Oligospermia/asthenospermia 1,008 0.61 (0.36, 1.01) 0.054 421 1.43 (0.43, 4.77) 0.561 1,001 0.62 (0.36, 1.08) 0.092 Unexplained infertility 915 0.73 (0.44, 1.22) 0.229 381 4.19 (1.69, 10.39) 0.002a 911 0.45 (0.24, 0.83) 0.011a Mixed female factors 779 1.13 (0.66, 1.92) 0.667 250 0.36 (0.09, 1.44) 0.148 774 1.42 (0.81, 2.51) 0.224 Mixed female and male factors 1,522 1.03 (0.70, 1.53) 0.874 548 0.99 (0.41, 2.40) 0.981 1,516 1.09 (0.71, 1.67) 0.682 Other female factors 221 2.02 (0.65, 6.24) 0.224 77 4.52 (0.62, 33.25) 0.138 219 0.75 (0.20, 2.77) 0.661 Other male factors 465 0.86 (0.38, 1.93) 0.708 189 1.28 (0.23, 6.95) 0.778 464 0.83 (0.35, 1.97) 0.680 Note. Factors were adjusted for age, BMI, and controlled ovarian hyperstimulation protocol. OR, odds ratio; PTB, pulmonary tuberculosis; BMI, body mass index. PCOS, polycystic ovary syndrome; aP < 0.05.
Data on BMI, endometrial thickness, endometrial pattern, and number of embryos transferred were missing for 80, 1,418, 68, and 60 cases, respectively, in the general research population.Table 4. Correlation analysis between untreated prior PTB revealed by chest X-ray and pregnancy outcomes in different infertile populations
-
In this large study sample involving more than 10,000 infertile patients receiving IVF-ET, the clinical pregnancy and live birth rates after IVF-ET were significantly lower in patients with untreated prior PTB on CXR than in those without signs of prior PTB. Additionally, untreated prior PTB was an independent risk factor for decreased live birth rate.
In this study, the prevalence of prior PTB diagnosed by CXR in women with infertility (age, 20–50 years) was 10.4% (1,487/14,254), which was higher than that reported in a general population of a similar age[22]. A report of CXR screening of 13,110 applicants living abroad showed that the prevalence of prior PTB was 2.9% among those aged 15 years and above, 1.6% for aged 35–45 years, and 13.3% for aged 60 years and above[22]. The prevalence of TB varies according to regional distributions, ages, and occupations[23–25]. Our results here indicated that infertile patients had a higher prevalence of prior PTB, and 83.3% of those with prior PTB denied having a history of TB and/or anti-TB therapy.
Age, BMI, COH protocol, endometrial thickness, number of good-quality embryos per cycle, and untreated prior PTB were significantly associated with pregnancy outcomes in the logistic regression model. It is worth noting that untreated prior PTB was an independent risk factor for decreased live birth rate after adjustment for the abovementioned variables. This is an important finding of our study, and we believe that GTB may be present in some of these patients. TB is an important cause of infertility, and previous studies reported that approximately 10%–20% of TB patients had GTB[11, 13, 26]. GTB is rare in developed countries but common in developing countries[27, 28]. A retrospective analysis of infertility causes in our hospital in 1998 showed that tubal blockage due to GTB accounted for 28.4% of infertility patients[28]. GTB in women is a chronic disease with mild symptoms and most commonly involves the fallopian tubes, causing tubal adhesion or obstruction, thereby leading to infertility. GTB may also have endometrial involvement, resulting in poor endometrial receptivity and difficult implantation. Additionally, ovarian involvement of GTB may lead to ovarian dysfunction, thus hampering fertilization. GTB diagnosis is generally established by surgery, such as laparoscopic or hysteroscopic biopsy, based on microbiological or histopathological features of the disease. In this study, 1,013 (81.8%) of 1,239 patients in the untreated prior PTB group and 9,673 (75.8%) of 12,767 patients in the non-PTB group had received endometrial biopsy before IVF-ET cycles, and endometrial tuberculosis was excluded. However, laparoscopy and hysteroscopy are not widely available because of their invasive nature; thus, the Chinese infertility guidelines do not routinely recommend these procedures[29]. Therefore, in our retrospective analysis, the presence of GTB in patients with prior PTB was unclear, which is a limitation of this study. Furthermore, TB-specific cellular immunity may be persistent after spontaneous cure in untreated TB[30, 31], and it is unknown how this would affect pregnancy outcomes.
It is notable that our cohort had 1,038 UI patients (84 in the untreated prior PTB group and 954 in the non-PTB group), which accounted for 12.1% of the total 8,598 infertility infertile patients (791 in the untreated prior PTB group and 7,807 in the non-PTB group; Table 1). Regression analysis showed that untreated prior PTB was an independent factor for pregnancy outcomes in UI patients and would lead to increased miscarriage and decreased live birth rates. This important finding suggests that TB is an important risk factor for UI, which accounts for 10%–30% of the causes in infertile patients, even after carefully evaluating and screening known infertility causes[19]. TB may be an important cause that could be misdiagnosed as UI in some patients, especially in those with unobstructed fallopian tubes, for which anti-TB therapy may help improve pregnancy outcomes[32, 33].
Our study has several limitations. First, this was a single-center study; however, as the largest reproductive center in China, we performed more than 10,000 IVF-ET cycles annually with patients from all over the country. Therefore, the population in this study was representative. Second, because of the retrospective design of this study, we could not match the two groups for all potentially important variables that might be related to pregnancy outcomes. Nevertheless, after adjustment for these variables, the results indicated that untreated prior PTB was an independent risk factor for decreased live birth rate. Third, some other demographic or sociological factors, such as education and economic status, may also affect pregnancy outcomes, but we did not have all these data available. Further prospective studies are required to confirm our present findings. Meanwhile, we also performed a prospective cohort study (NCT04443283) to compare pregnancy outcome differences between IGRA positive and negative groups.
In conclusion, our study revealed a high prevalence of prior PTB among infertile patients in China and showed that untreated PTB was associated with adverse pregnancy outcomes after IVF-ET, especially in UI patients.
The funding bodies had no role in designing the study, collecting, analyzing, and interpreting the data, writing the report, and deciding to submit the article for publication.
-
All authors declare no conflict of interest.
-
We are indebted to the patients who participated in this study.
Funds:
This work was supported by the National Natural Science Foundation [No. 81400041 and No. 81871212]; the National Natural Science Foundation of China Youth Fund Project [No. 81400038]; and cohort study project of the Peking University Third Hospital [Y70545-04]
&These authors contributed equally to this work.
 Quick Links
 DownLoad: