


-
Testicular germ cell tumors (TGCTs) are rare cancers but account for most of the testicular cancers. It is the most common cancer in men ages 15 to 39 years[1]. The incidence of testicular cancer has increased steadily over the past two decades[2]. White men were at highest risk for TGCT in 2005–2009, with an annual incidence of 6.6 per 100,000 men, compared to only 1.4 per 100,000 in black men, 1.9 per 100,000 in Asians/Pacific Islanders, and 4.7 per 100,000 in Hispanic men on average annually[3].
Due to treatment advantages over the last 40 years, the 5-year survival rates now exceeds 90%[4,5]. There is evidence that the testicular cancer survival rate differs by race/ethnicity[5,6,7,8, 9, 10]. Black men have a poorer survival rate relative to white men[7, 8], as well as lower survival for Hispanic white males[6, 8] and Asian males[10]. Although previous studies have considered other factors related to TGCT survival rate and race/ethnicity such as disease stage, distribution, and socioeconomic status (SES), histology type has not yet been thoroughly assessed. Until a regional study in California of young patients aged under 39. The histology type seminoma and nonseminoma were considered as an affecting factor in the relationship of race and TGCT survival, however, no racial/ethic differences in the histological distribution of cancer were observed[9]. We expanded the geographical scope and calculated the survival rate according to factors such as SEER histo A stage, race/ethnicity, age at diagnosis, diagnosis year, marital status, histologic type, surgery, socioeconomic status, etc., and evaluated the effects of various factors on the post-diagnosis mortality of TGCT. For the first time, the difference in the ethnicity of histology are reported, prodiving a step toward the theoretical basis for the future development of cancer screening.
Our study explored histology type and racial disparities in their relation to TGCTs survival using the Surveillance Epidemiology and End Results (SEER) data, spanning a period of 24 years (1992–2015). The objective of the study is to assess racial differences in mortality among men diagnosed with TGCTs, while accounting for clinical and socioeconomic factors. We also examined differences in temporal survival trends in the United States.
-
We used the SEER-18 database, managed by the US National Cancer Institute. It contains information from 18 population-based cancer registries: San Francisco-Oakland, Connecticut, Metropolitan Detroit, Hawaii, Iowa, New Mexico, Seattle (Puget Sound), Utah, Metropolitan Atlanta, Alaska, San Jose-Monterey, Los Angeles, Rural Georgia, Greater Georgia, Greater California (excluding San Francisco, Los Angeles, San Jose), Kentucky, Louisiana and New Jersey. The SEER database compiled information related to sociodemographic and clinical information, including race, histologic type, tumor characteristics, disease stage at diagnosis and treatment.
-
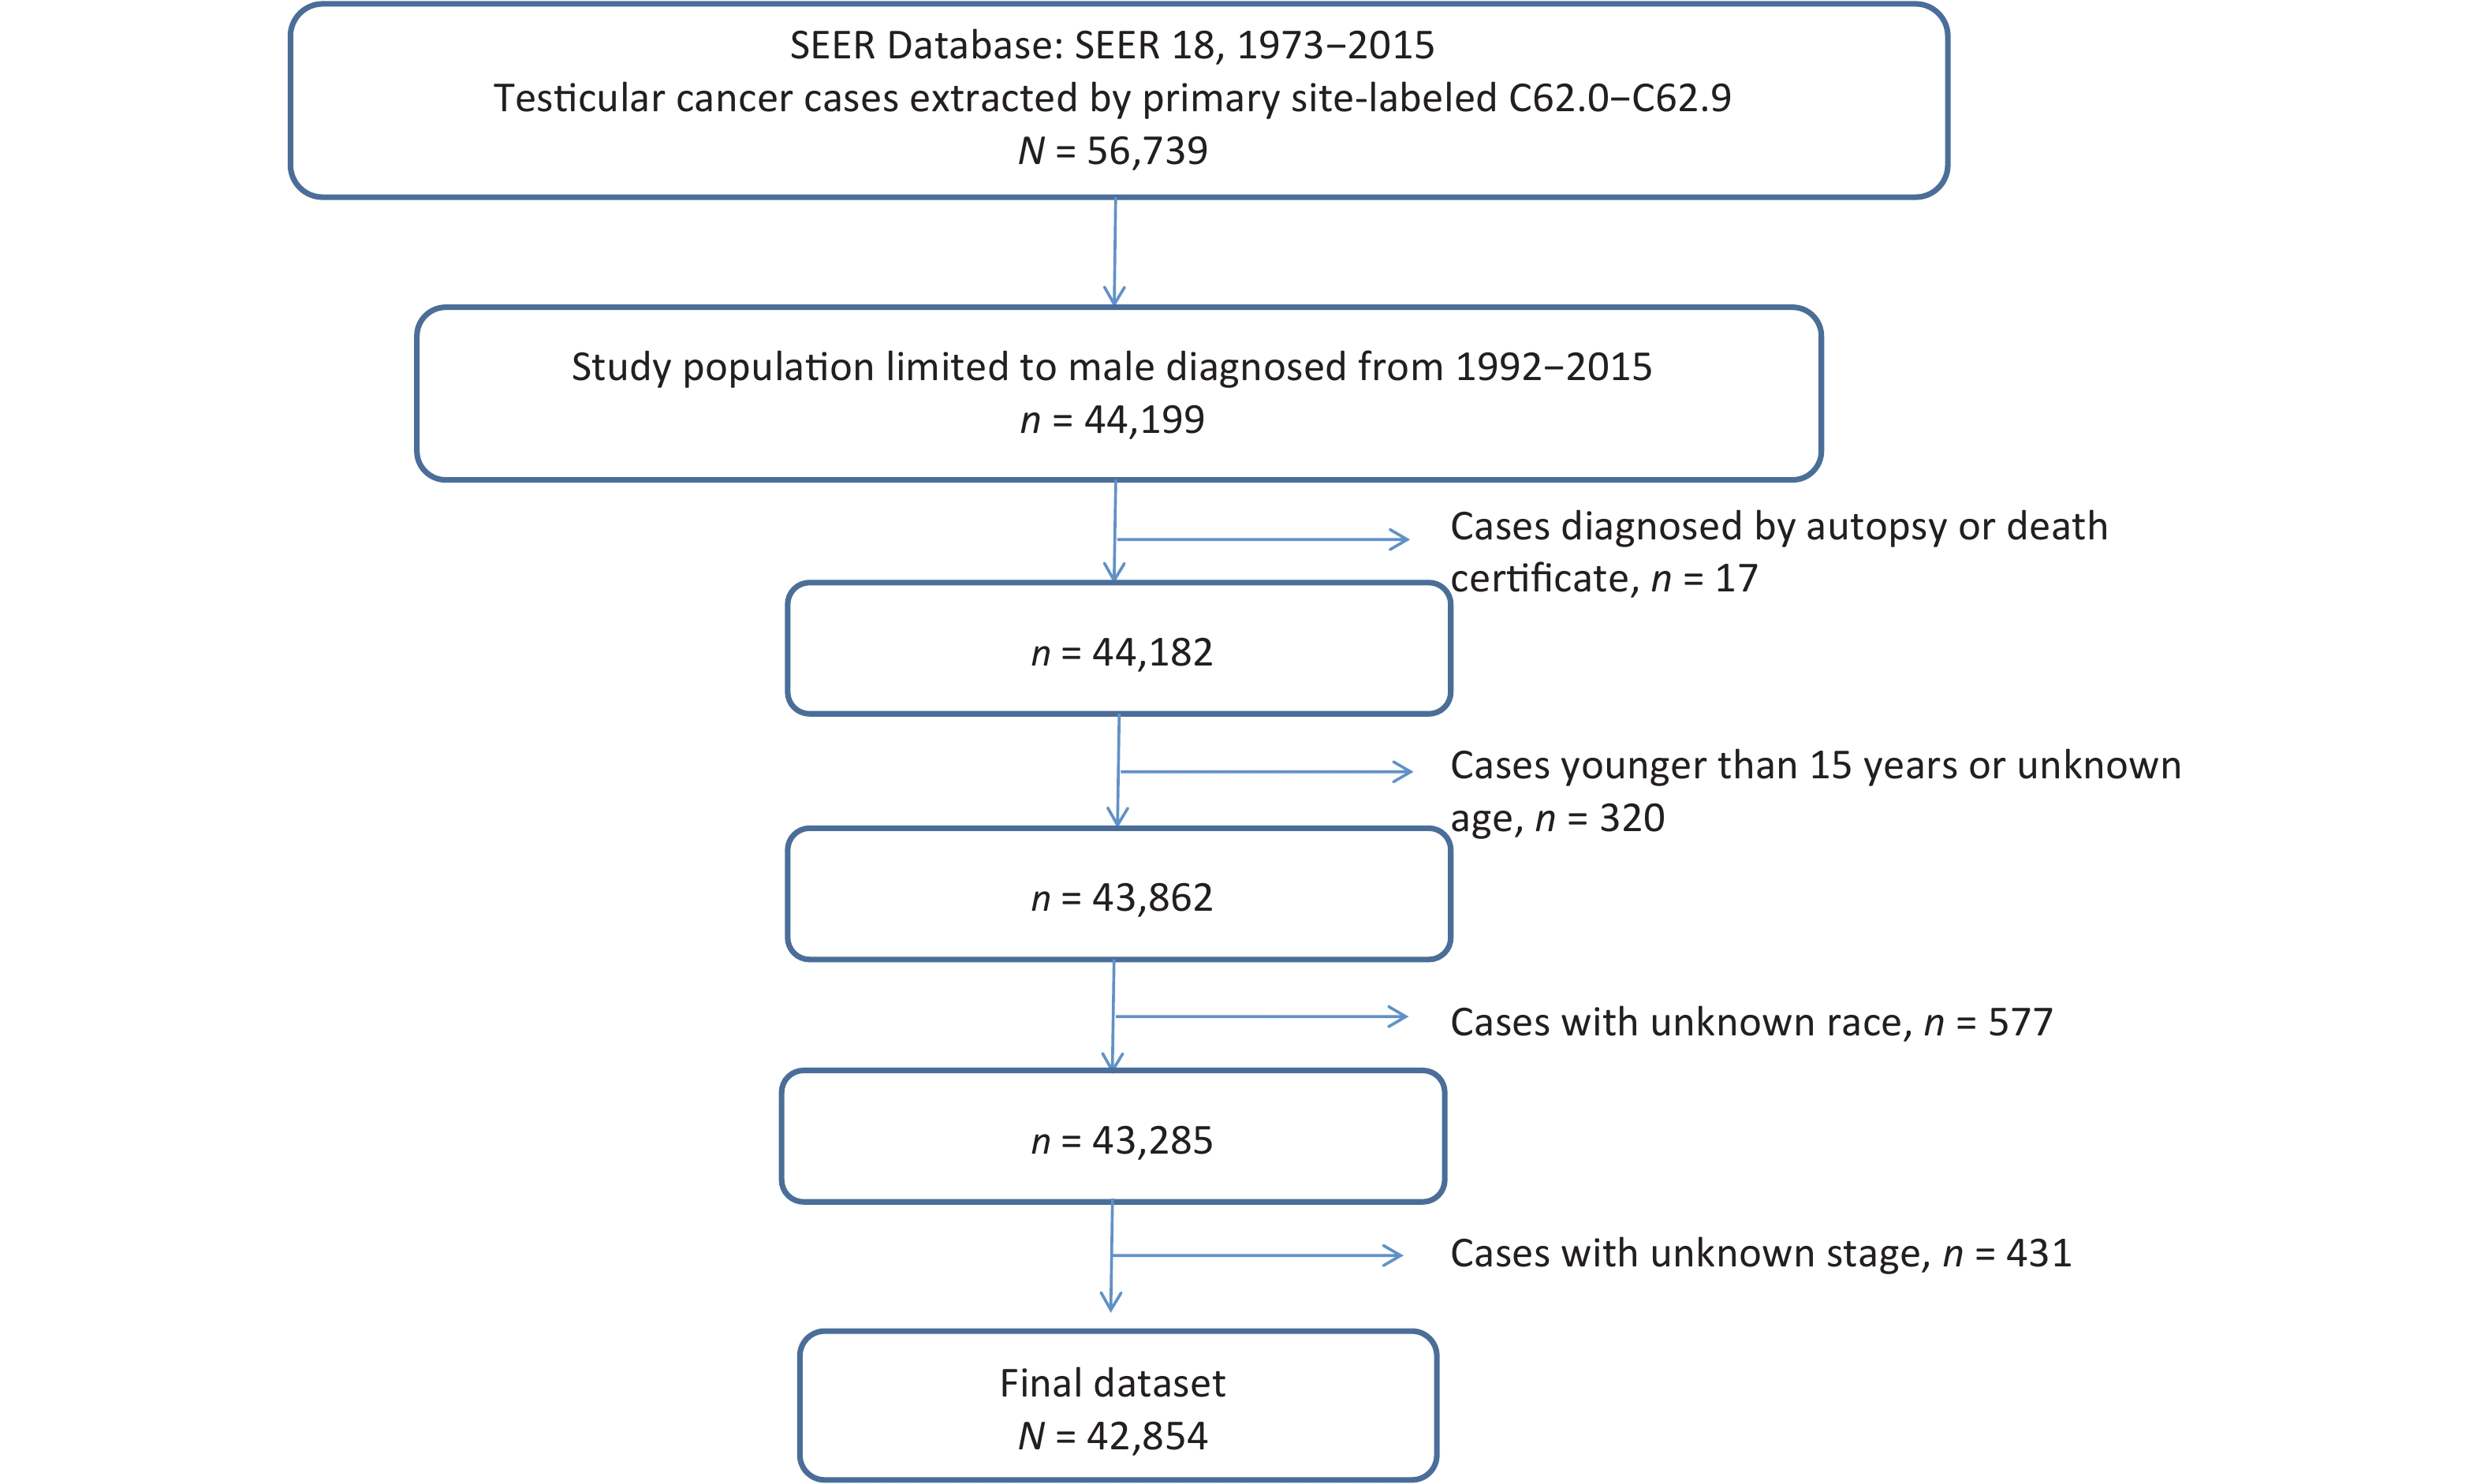
Men diagnosed with TGCTs were identified using the International Classification of Diseases for Oncology, third edition (ICD-O-3) morphology codes 9060 through 9065, 9070 through 9072, 9080 through 9085, and 9100 through 9102. Patients were included if they were 15 years old, with TGCT in any stages, and with seminoma or nonseminoma histologic subtype (Figure 1). Patients with unknown race/ethnicity were not included in the current study. Further exclusions included having an unknown histological tumor stage (n = 431), autopsy-diagnosed and death certification only patients (n = 17). The final analytic dataset included 42,854 assessable patients.
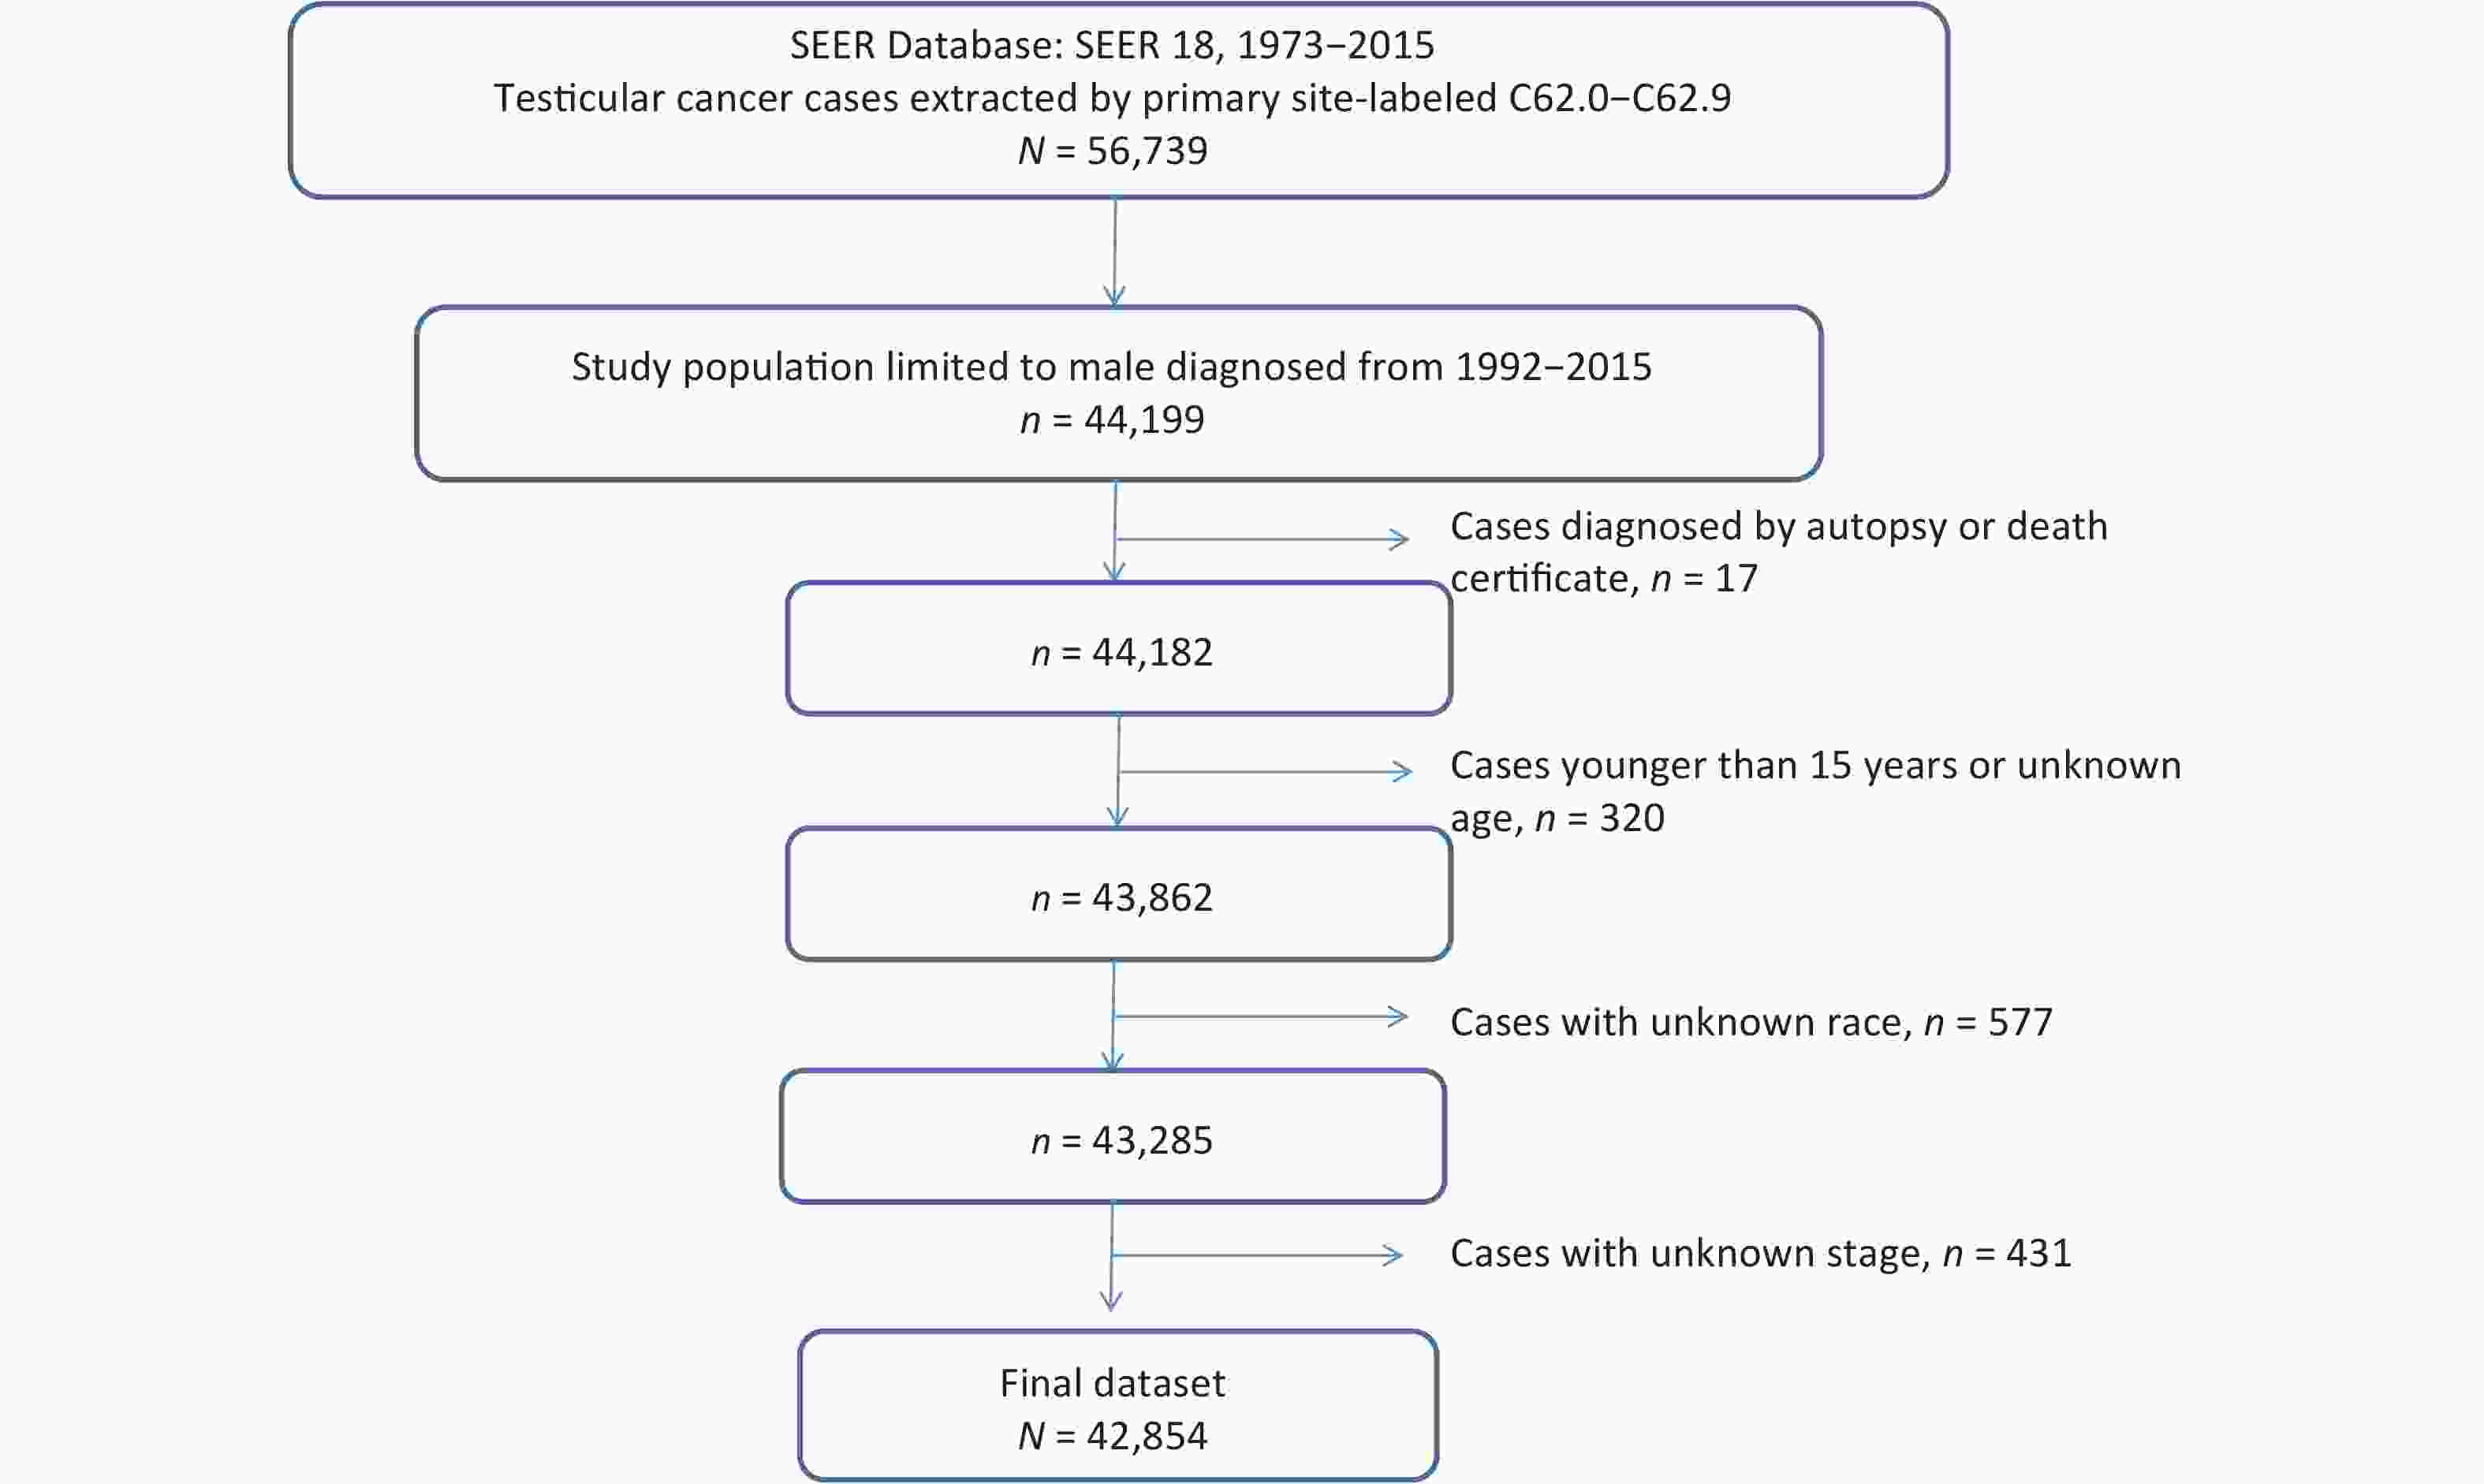
Figure 1. Screening of study population.
-
For the evaluation of race/ethnicity-specific disparities in TGCTs epidemiology, we used the expanded race/ethnicity categories available in SEER: non-Hispanic white (hereafter referred to as NH-white), non-Hispanic black (black), white Hispanic (Hispanic), and Asian/Pacific Islanders or American Indian/Alaskan Natives (others). Age was divided into tertiles (≤ 29 years vs. 30–39 years vs. > 39 years). Year of diagnosis was divided into quartiles (1992–1997 vs. 1998–2003 vs. 2004–2009 vs. 2010–2014). Marital status was grouped into single (never married), married (including common law), and other (Divorced, Separated, Unmarried or Domestic Partner, Widowed, Unknown). TGCTs histology was grouped into two categories defined by ICD-O-3 codes. Groups consisted of seminoma tumors (ICD-O-3 codes 9060-9064) and nonseminoma tumors (ICD-O-3 codes 9065, 9070-9102). The more detailed American Joint Committee on Cancer staging criteria were not available in the SEER database for TGCTs diagnosed before 2004, so SEER histological A stage categories were used: local, regional, metastatic, and unknown/unspecified. Since 1998, reliable information regarding retroperitoneal lymph node dissection at TGCTs diagnosis was available. No data were available regarding chemotherapy or treatment for relapse. County level household income and level of education were used since individual level data are not available in SEER.
-
All analyses were conducted using SPSS software version 25 (SPSS Inc. Chicago, Illinois). Frequencies and column percent by seminoma and nonseminoma subtypes were determined for each covariates. Survival was calculated from the date of diagnosis to date of death from any cause. For models of testicular cancer–specific survival, individuals who died of other or unknown causes were censored at the time of death. We obtained 3-year relative cumulative survival estimates with the survival session query of the software SEER*Stat version 8.3.5, which define the relative survival as the ratio of the proportion of observed survivors (all causes of death) in a cohort of cancer patients to the proportion of expected survivors in a comparable cohort of cancer-free individuals.
We used Cox proportional hazards regression to estimate hazards ratios (HRs) and 95% confidence intervals (CIs) to evaluate the influence of race on mortality after TGCT diagnosis.
-
A total of 42,854 patients with TGCTs were identified and included for the final analyses. The median age of the cohort was 33 years (IQR, 27–42 years). Over two-thirds of patients were white (n = 31,280, 73.0%) while 2.6% (n = 1,128) were black, 19.9% (n = 8,509) Hispanic and 4.5% (n = 1,937) other. Over 60% of patients were diagnosed after the year 2004. Considering all subjects, men were almost evenly distributed in three age categories, with a slightly higher proportion diagnosed at ages 15–29 and slightly less at age 40 and up. Almost half were single (never married), and another half were married (including common law). More than two-thirds of male were diagnosed with SEER histological A stage of local, and more than half (58.2%) of the cases were seminoma TGCT. Surgery was performed on 97% patients. More than one-third (41.5%) of patients had a median family income of less than $5,000. 91.8% of the cases were alive during the surveillance period.
The age at diagnosis differed significantly by race (Table 1). Most Hispanic patients (53.9%) were younger than 30 years, but NH-white or black patients were elder than 30 years old or older when they were diagnosed. More than half of Hispanic (55.7%) and black (55.4%) patients were single compare to almost a half (49.0%) of NH-white patients who were married. Black men more likely to be diagnosed at later stages, had higher percentages of regional or distant metastasis, had more seminoma cancers, had fewer nonseminomas, and had less surgeries performed compared to other races. Hispanic men were diagnosed at earlier ages, and lower household incomes compared to other races. Compared to NH-white men and men of other races, Hispanic men had more nonseminoma cancers and fewer seminomas. There was little variation across the different racial groups according to SES. Compared to NH-white men, black and Hispanic men lived in counties with slightly lower median household income.
Variables Whole cohort (%)
(N = 42,854)Race/Ethnicity White (%)
(n = 31,280)Black (%)
(n = 1,128)Hispanic (%)
(n = 8,509)Others (%)
(n = 1,937)SEER histo A stage* Localized 70.0 71.9 61.7 64.3 69.3 Regional 18.5 18.2 22.2 19.4 17.3 Distant spread 11.5 9.9 16.1 16.3 13.4 Age at Diagnosis (year) 15–29 36.0 31.1 29.2 53.9 41.0 30–39 33.7 34.3 37.3 31.1 33.5 > 39 30.2 34.5 33.5 15.0 25.5 Period of Diagnosis 1992–1997 12.9 14.2 10.9 8.6 12.9 1998–2003 23.9 25.4 24.8 19.1 20.2 2004–2009 30.4 30.3 29.2 31.5 27.9 2010–2015 32.8 30.1 35.1 40.8 39.0 Marital status Single 44.5 40.5 55.4 55.7 53.1 Married 45.4 49.0 31.8 35.6 38.8 Other 10.1 10.6 12.8 8.6 8.1 Histologic type Seminoma 58.2 60.2 65.0 49.6 58.9 Nonseminoma 41.8 39.8 35.0 50.4 41.1 Surgery Yes 97.6 98.0 95.1 96.7 97.1 No 2.4 2.0 4.9 3.3 2.9 Income ($) ≤ 5,000 41.5 37.1 53.5 58.1 32.4 5,000–7,500 48.2 51.7 41.5 34.8 55.1 > 7,500 10.2 11.2 5.0 7.1 12.5 Vital status Alive 91.8 92.2 86.3 91.5 91.3 Deceased 8.2 7.8 13.7 8.5 8.7 Note. *SEER histological A stage categories. Some of the results do not add up to 100% due to rounding. Table 1. Characteristics of the SEER study population, overall and separately by race/ethnicity
-
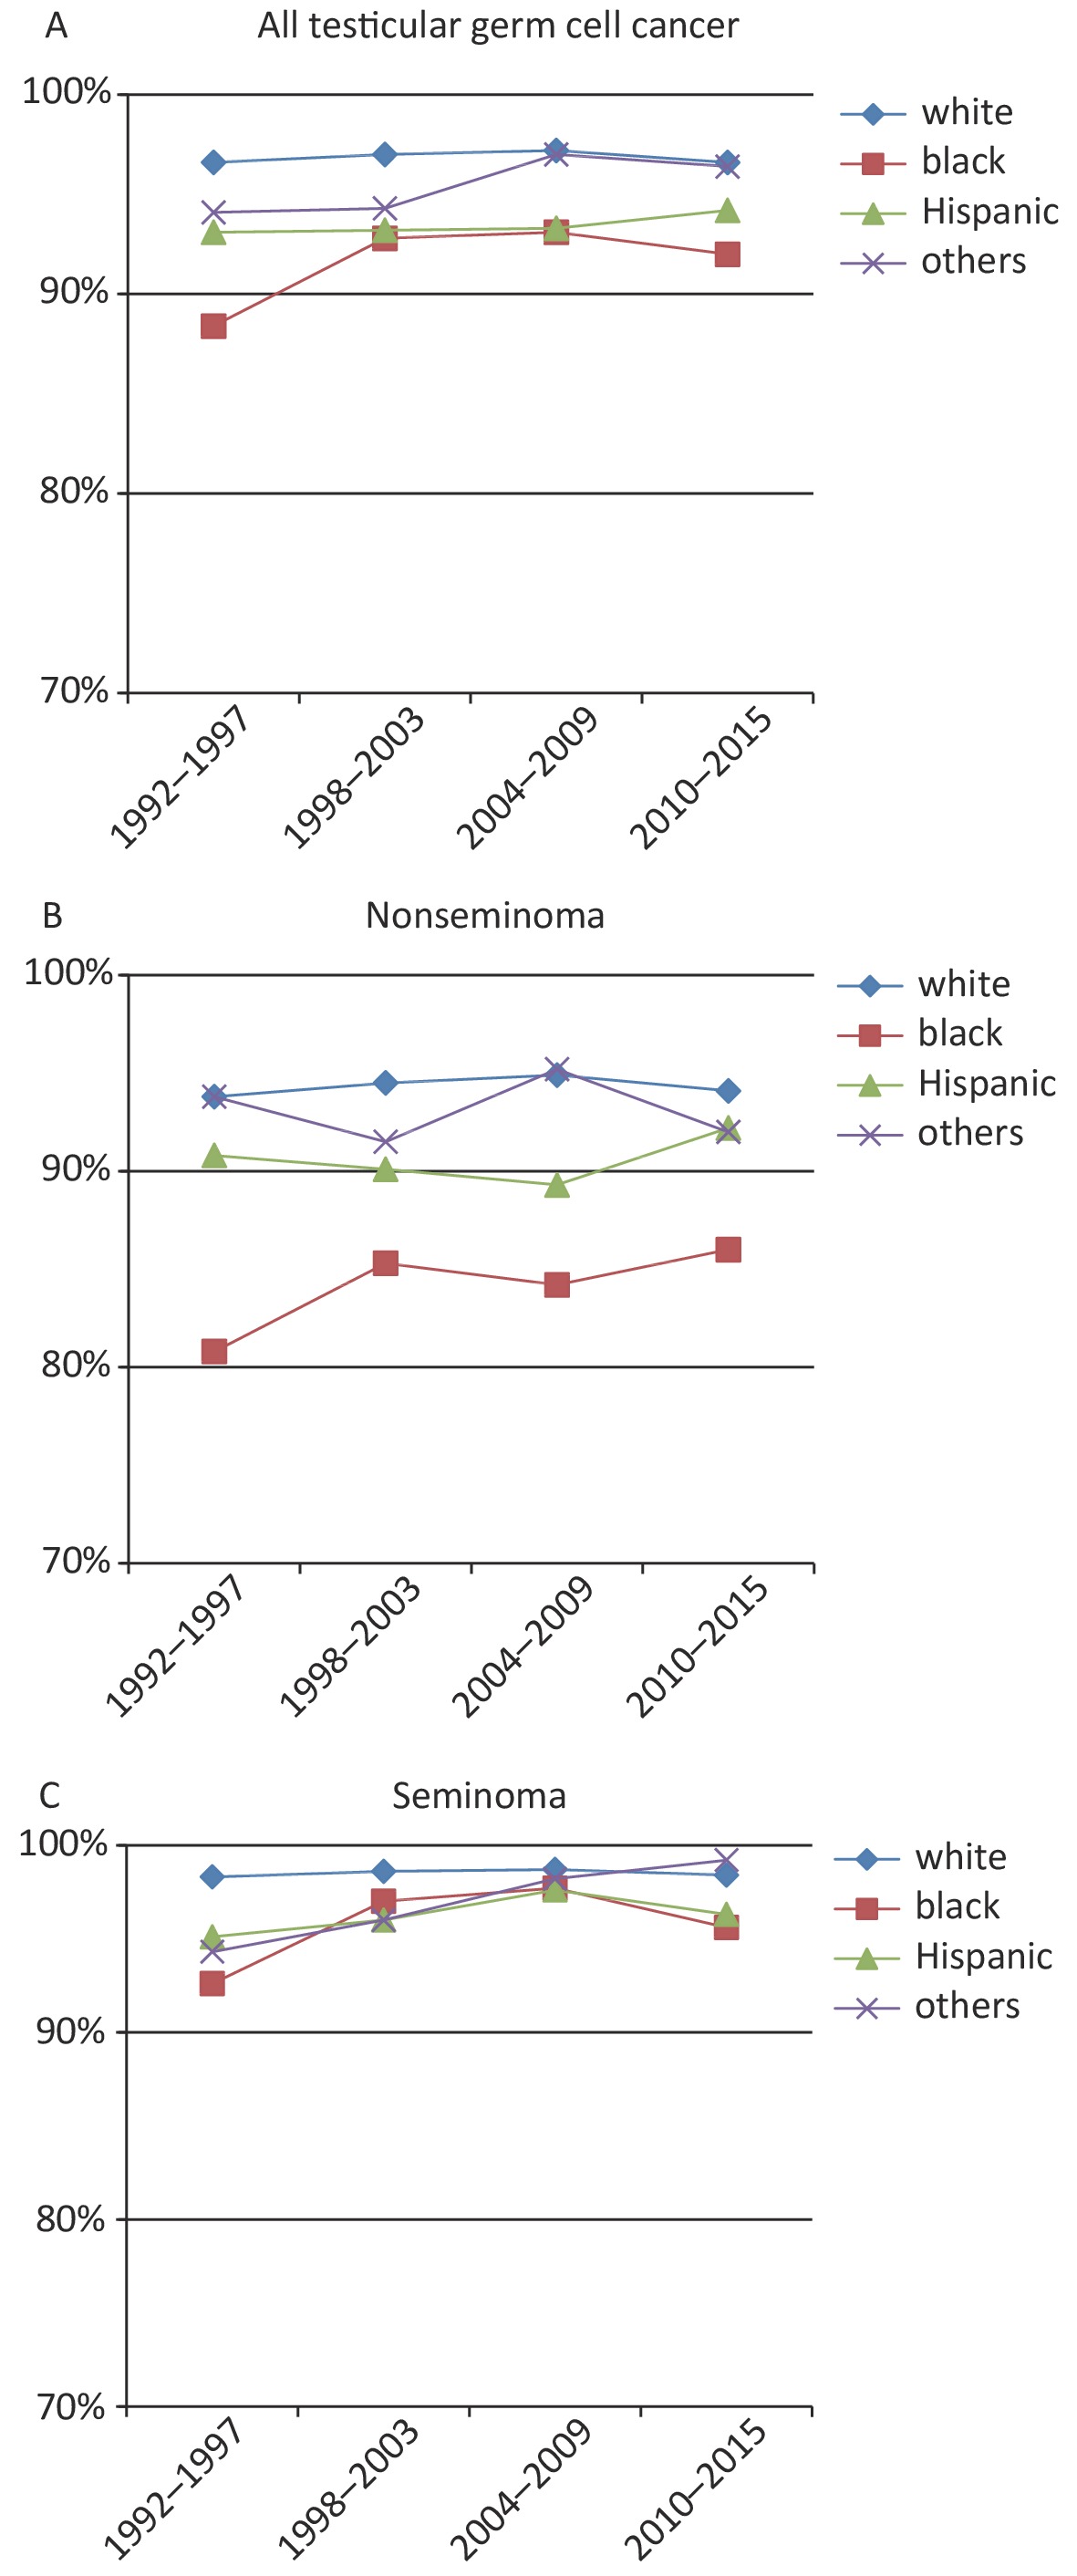
Three-year relative survival was calculated for successive intervals for patients with all TGCTs, and calculated for seminoma and nonseminoma subtypes by race (Figure 2). In general, all TGCT and both two subgroups had improved survival rates over the study period.
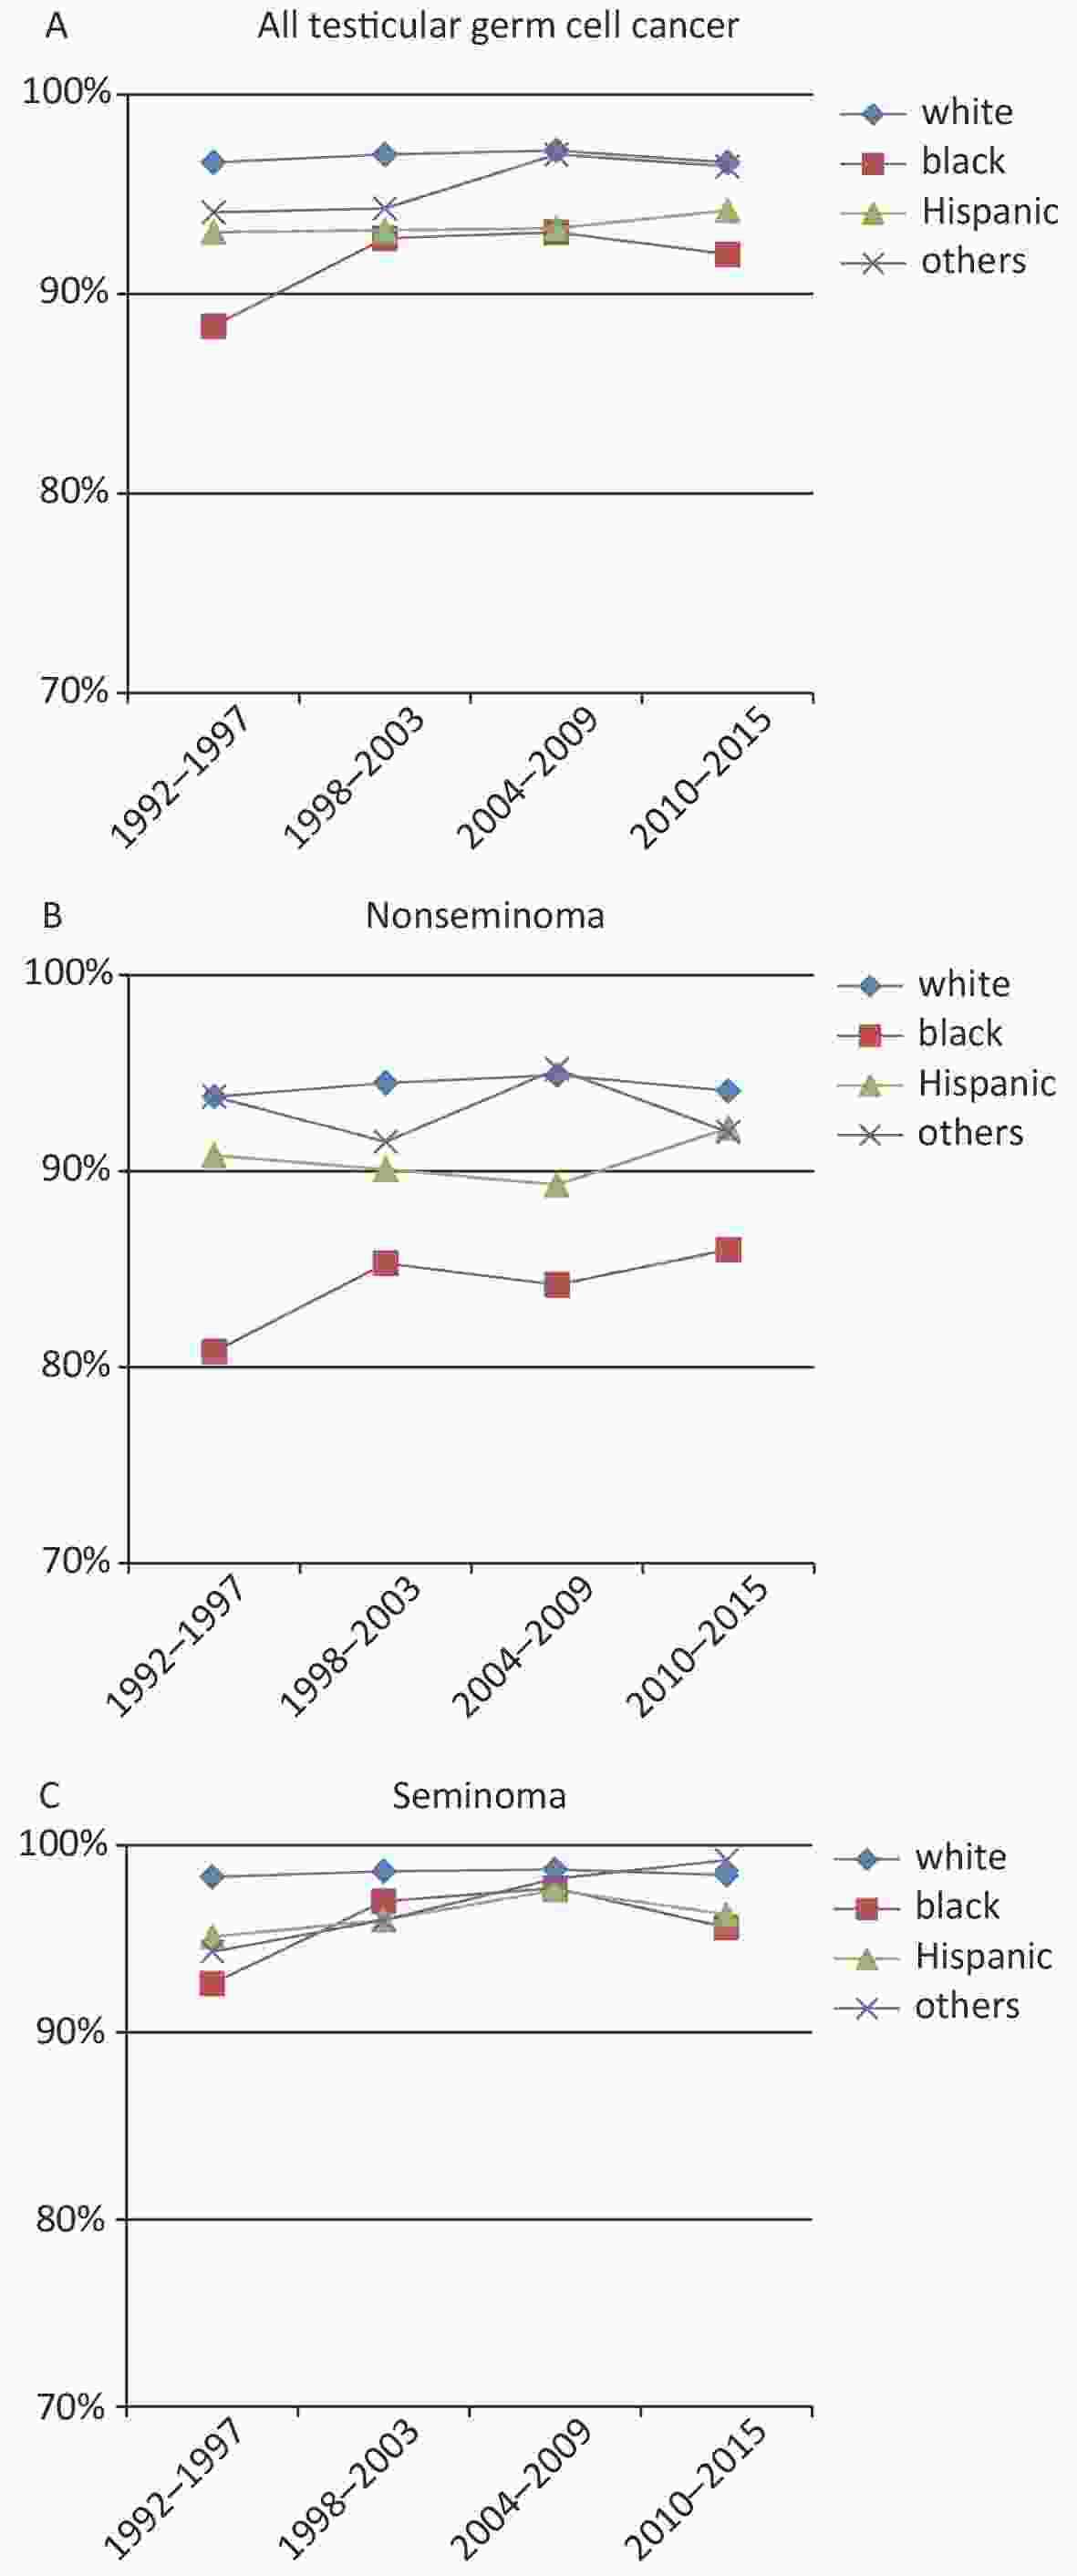
Figure 2. Relative survival rates by race/ethnicity for TGCT cases in different groups. (A) Relative survival rates of all TGCT cases by race/ethnicity (1992–2015); (B) among nonseminoma TGCT cases by race/ethnicity; (C) among seminoma TGCT cases by race/ethnicity.
Overall (Figure 2A), the 3-year survival rate for patients with TGCT was highest among NH-whites (97.0%, 95% CI: 96.7%–97.2%) and lowest among blacks (91.7%, 95% CI: 89.5%–93.5%). From 1992 to 1997, the 3-year survival rate was 96.6% (95% CI: 95.9%–97.1%) for white patients and 88.4% (95% CI: 80.7%–93.2%) for black patients. Compared with NH-whites, whose 3-year survival rates were consistently on high level, Hispanic, black and other TGCT patients has increased survival rates, especially in blacks.
The most significant increase in TGCT survival rate occurred in blacks with nonseminoma TGCT. The 3-year survival rate for this subgroup increased from 80% for patients diagnosed during 1992 through 1997 to 86% for those diagnosed in 2010 through 2015 in the SEER 18 areas (Figure 2B). The survival rate of nonseminoma TGCT patients was high for other races and no significant improvement was observed. A more modest increase in survival was observed for blacks with seminoma TGCT (Figure 2C), which rose from 93% to 96% over the same period. The 3-year survival rate of all TGCTs, especially the nonseminoma subtype was lower in blacks comparing to other races.
-
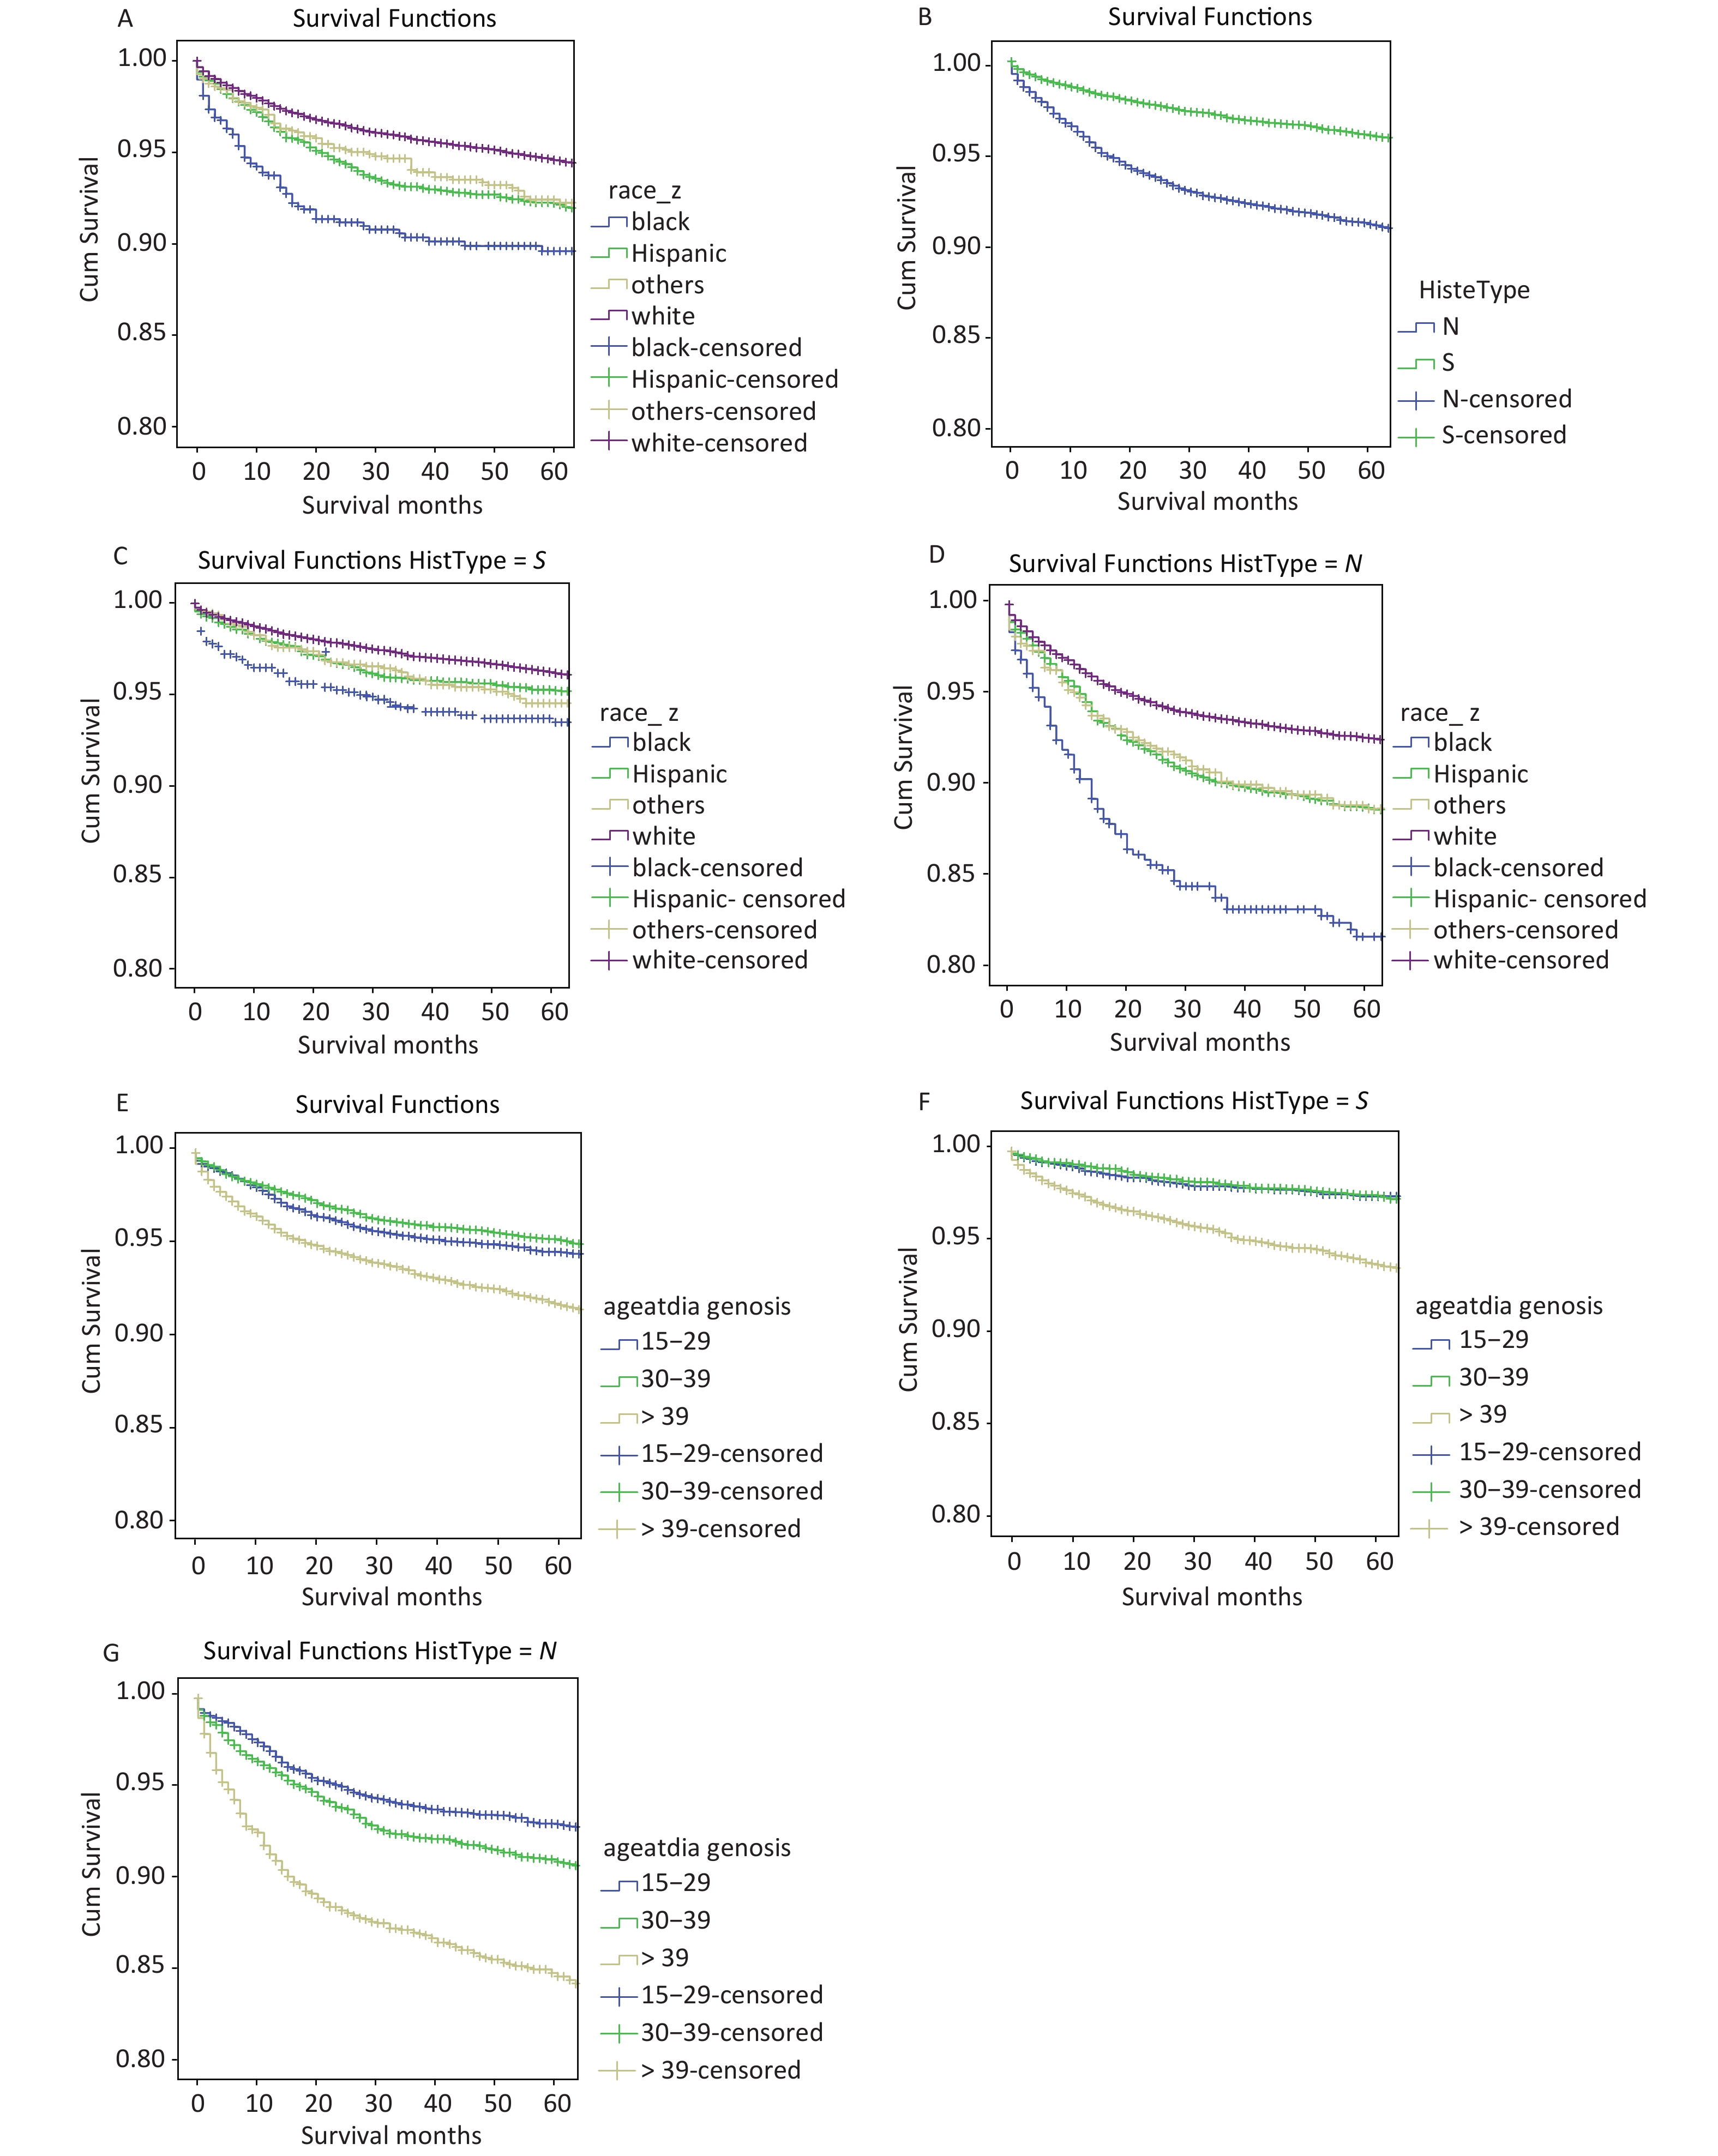
OS among different races and histologic subtypes, OS of TCGTs diagnosis during 2004 to 2015 were used for the current disparities. Racial differences were note in OS. For all TGCTs, Kaplan-Meier survival curve of NH-white patients demonstrated the highest OS compared with Hispanic whites and other races, whereas, blacks demonstrated the lowest survival to compare with other races (Figure 3A). The hazard ratio for death (overall mortality) was 2.00 (P < 0.001) blacks compared to NH whites. The hazard ratio for others for death was 1.23 (P = 0.009) compared to NH whites, a difference which is not statistically significant. It is clear that OS of nonseminoma patients is significantly worse than seminoma patients (Figure 3B) with a hazard ratio at 1.54 (P < 0.001).
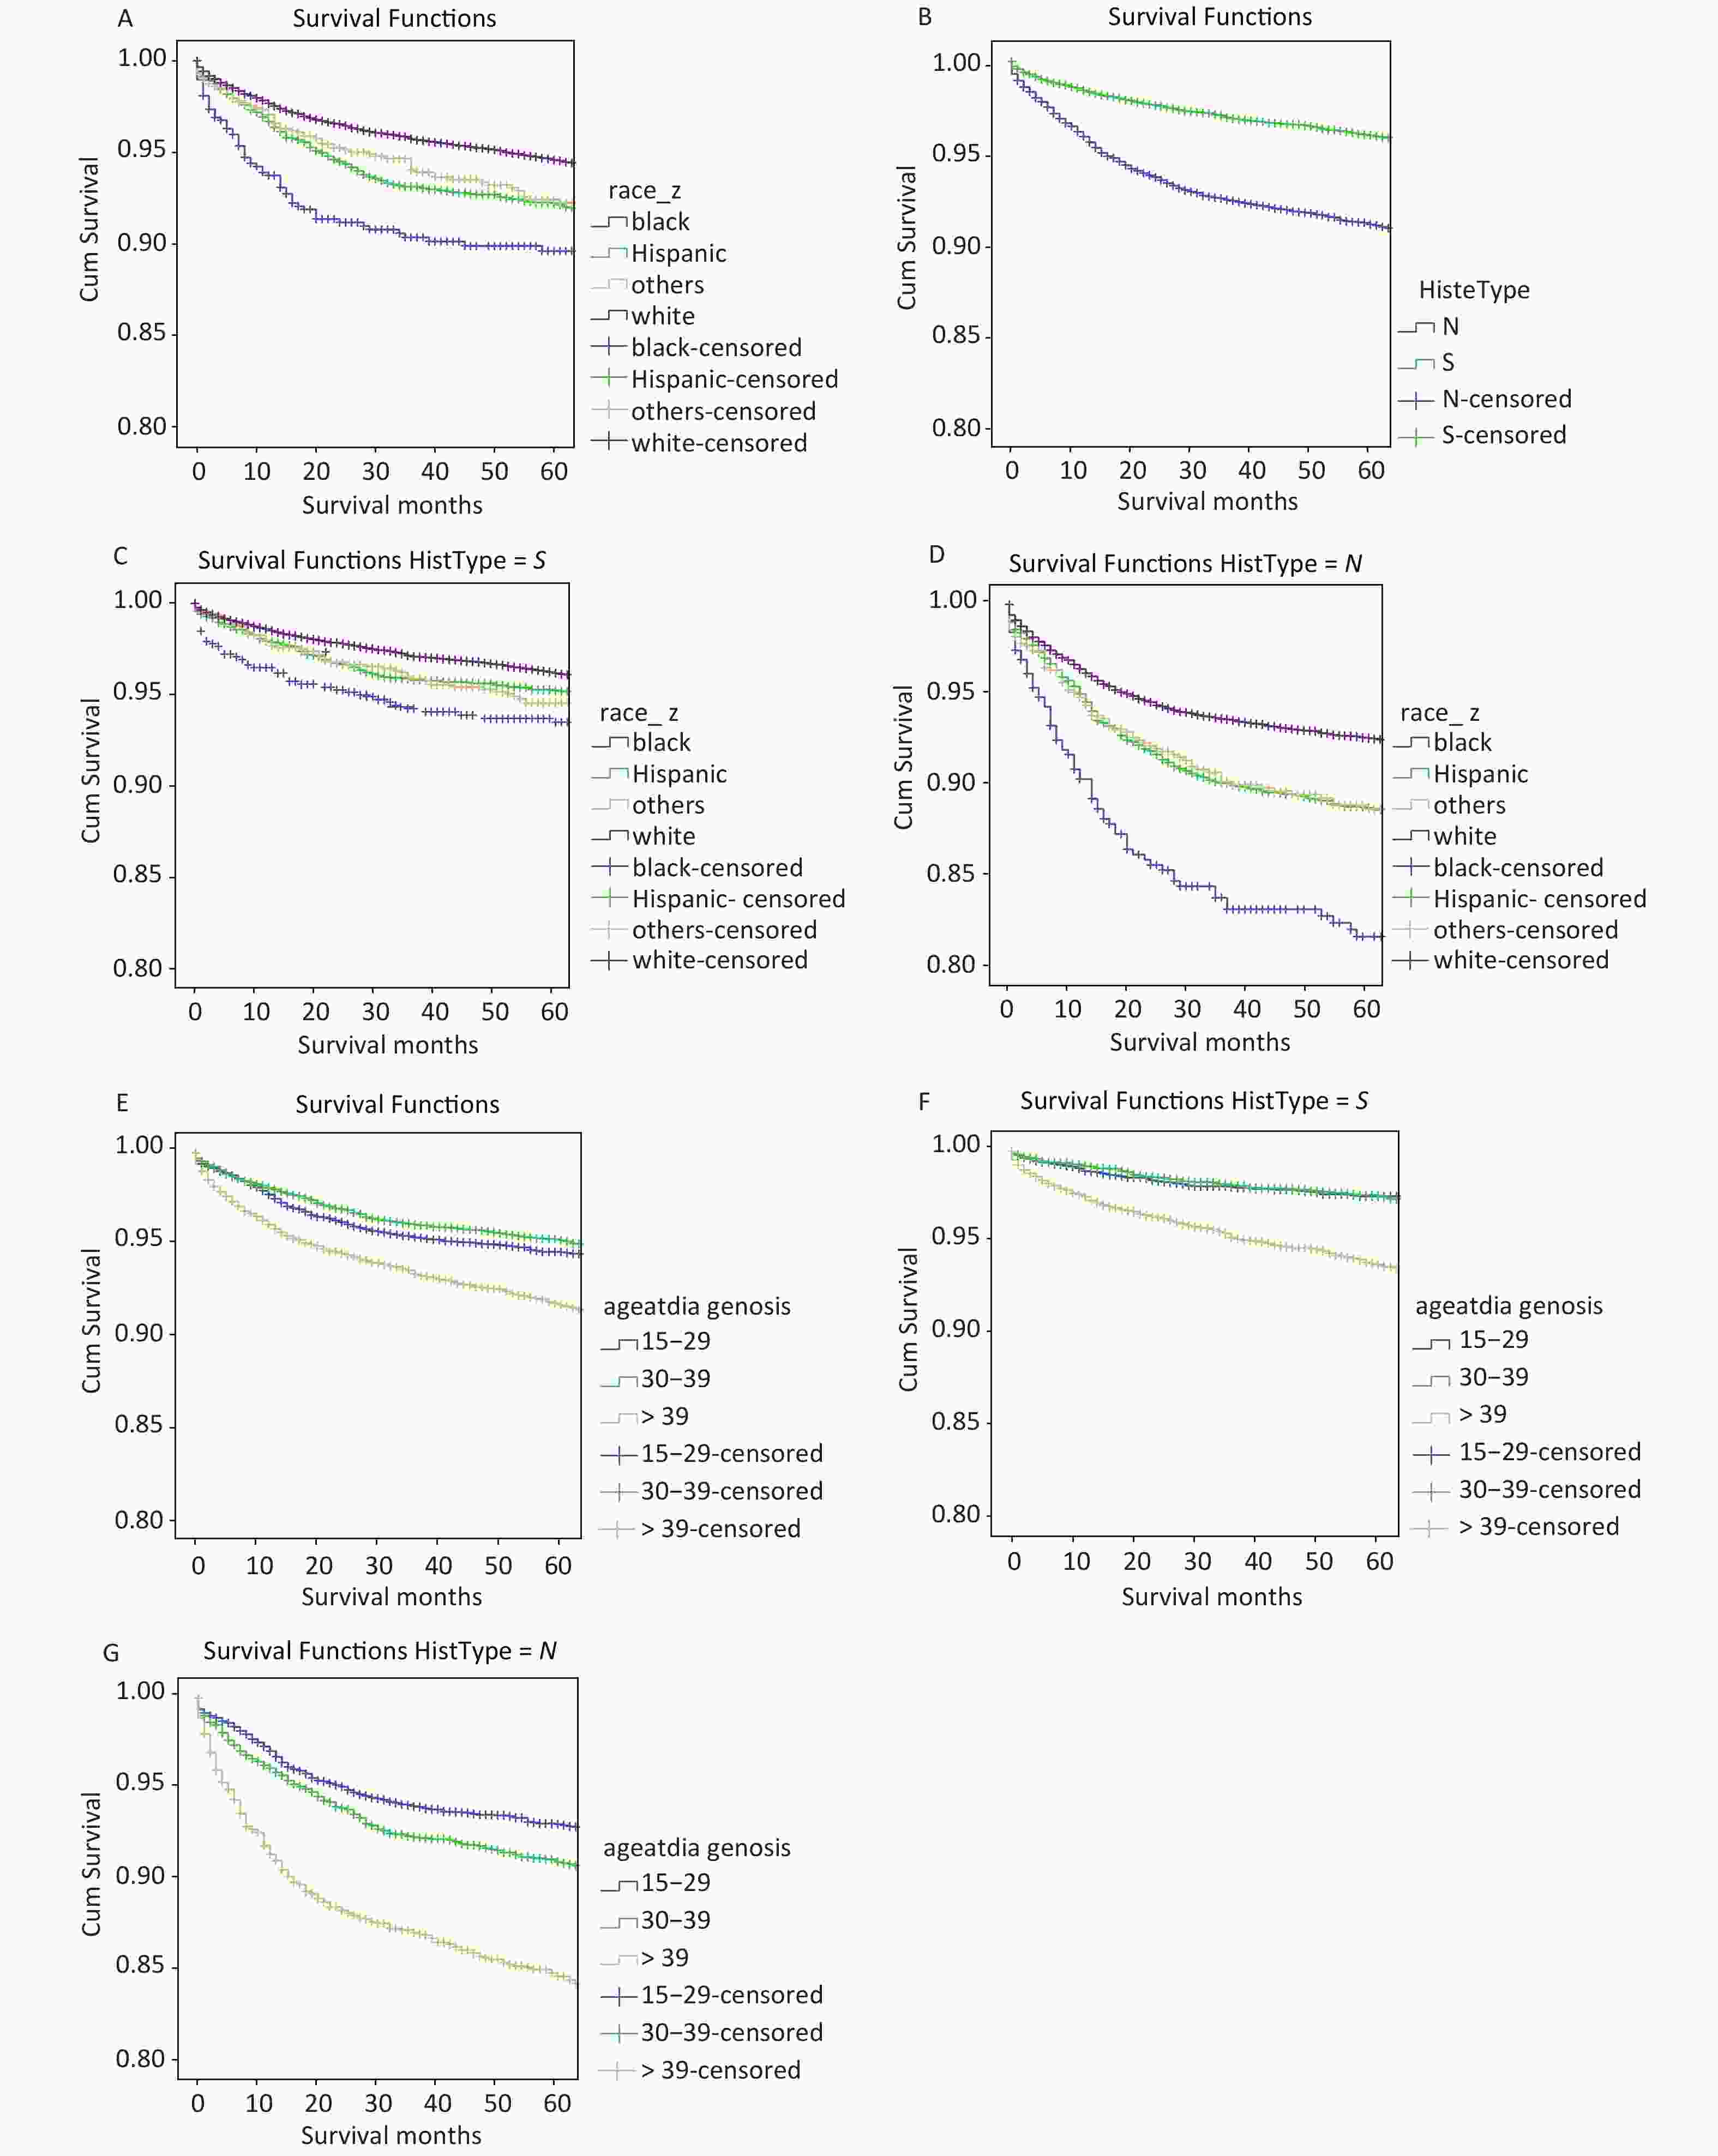
Figure 3. OS rate in different guoups. (A) OS rate by race/ethnicity (NH-which, black, Hispanic, and others) among all TCGT cases; (B) OS rates by histological subtype; (C) OS rates by race/ethnicity among cases with seminoma; (D) OS rates by race/ethnicity among cases with non-seminoma; (E) OS rate by age of diagnosis (15–29, 30–39, > 39) among all TCGT cases; (F) OS rate by age of diagnosis among cases with seminoma; (G) OS rate by age of diagnosis among cases with non-seminoma.
For seminoma, there were no racial differences in OS among NH whites, Hispanics or others (Figure 3C). Only blacks had lower OS to compare with NH-whites, with the hazard ratio for death of 1.43 (P < 0.001). For nonseminoma, both Hispanics and others demonstrated lower OS rates to compare to NH-whites (Figure 3D). Lowest survival for blacks compared to NH whites with the hazard ratio of 1.66 (P < 0.001), which was significantly different from Hispanics and other race/ethnic groups.
In addition, we found that the age of diagnosis also has a very important influence on OS both for all TCGTs and for cases with seminoma or nonseminoma. For all TGCTs, Kaplan-Meler survival curve of > 39 patients demonstrated the lowest OS compared with other age group (Figure 3E). The hazard ratio for death was 2.07 (P < 0.001) of > 39 compared to 15–29. For seminoma, > 39 have lower OS rates to compared with 15–29 and 30–39, the risk ratio in the > 39 age group was 2.44 (P < 0.001) (Figure 3F). For nonseminoma, The hazard ratio for death was 3.53 (P < 0.001) of > 39 compared to 15–29 (Figure 3G).
-
Black race, older age, single marital status, lower income and later stage at diagnosis were identified to be independent mediators of higher mortality rates by using the Cox proportional hazards model (Table 2). And we considered using SEER histo A stage or AJCC stage alone for cox regression analyses (Table 3). Comparing Tables 2 and 3, it can be seen that the trend is basically the same, but metastasis in the SEER histology A-stage category in Table 3 has a greater risk. The Cox proportional model demonstrated that the most significant quantitative predictor of death was stage at the time of diagnosis, with more advanced stages having higher mortality rates compared to less advanced stages. Age at diagnosis was also significantly associated with mortality in this model. Patients > 39 years age at diagnosis was shown to be worst mortality rates.
Variables All TGCTs Seminoma Nonseminoma HR 95% CI HR 95% CI HR 95% CI SEER histo A stage* Localized Ref − Ref − Ref − Regional 1.74 1.59–1.91 1.78 1.57–2.01 1.66 1.43–1.92 Metastasis 7.47 6.93–8.05 5.40 4.78–6.08 8.09 7.24–9.05 Race/Ethnicity NH-white Ref − Ref − Ref − Black 1.56 1.33–1.84 1.36 1.08–1.71 1.90 1.51–2.39 Hispanic 1.35 1.24–1.48 1.20 1.05–1.38 1.45 1.29–1.63 Others 1.23 1.05–1.44 1.13 0.90–1.42 1.38 1.11–1.72 Age at Diagnosis (year) 15–29 Ref − Ref − Ref − 30–39 1.49 1.36–1.64 1.68 1.41–2.01 1.63 1.45–1.83 > 39 3.33 3.04–3.64 4.48 3.78–5.30 3.27 2.88–3.72 Period of Diagnosis 1992–1997 Ref − Ref − Ref − 1998–2003 0.96 0.87–1.06 0.93 0.81–1.06 0.98 0.85–1.14 2004–2009 0.91 0.82–1.02 0.83 0.72–0.97 0.97 0.83–1.12 2010–2015 0.91 0.81–1.03 0.90 0.75–1.08 0.90 0.77–1.06 Marital status Single Ref − Ref − Ref − Married 0.56 0.51-0.60 0.51 0.46-0.57 0.63 0.56-0.71 Other 0.96 0.86-1.06 1.00 0.86-1.15 0.91 0.85-1.07 Income ($) ≤ 5,000 Ref − Ref − Ref − 5,000–7,500 0.80 0.75–0.86 0.77 0.70–0.86 0.83 0.76–0.92 > 7,500 0.69 0.61–0.78 0.61 0.51–0.73 0.80 0.68–0.96 Note. *SEER histological A stage categories. Table 2. Cox regression analyses of 5-year seminoma TGCT mortality in 25,000 US patients according to histology and clinical characteristics
Variables Only SEER histo A stage* Only AJCC stage All TGCT Seminoma Nonseminoma All TGCT Seminoma Nonseminoma HR 95% CI HR 95% CI HR 95% CI HR 95% CI HR 95% CI HR 95% CI Derived AJCC Stage Group, 6th ed TNM I − − − − − − Ref − Ref − Ref − TNM II − − − − − − 1.57 1.29–1.91 1.91 1.48–2.49 1.21 0.89–1.64 TNM III − − − − − − 9.10 8.15–10.15 5.84 4.90–6.96 10.14 8.60–11.95 SEER histo A stage Localized Ref − Ref − Ref − − − − − − − Regional 1.84 1.58–2.15 2.09 1.71–2.55 1.49 1.17–1.91 − − − − − − Metastasis 10.91 9.72–12.24 7.19 5.96–8.67 11.39 9.61–13.51 − − − − − − Race/Ethnicity NH-white Ref − Ref − Ref − Ref − Ref − Ref − Black 1.54 1.21–1.96 0.95 0.95–1.95 1.79 1.30–2.48 1.49 1.17–1.90 1.32 0.92–1.89 1.80 1.30–2.49 Hispanic 1.32 1.17–1.50 0.85 0.85–1.31 1.47 1.26–1.71 1.32 1.17–1.50 1.05 0.84–1.31 1.47 1.27–1.71 Others 1.32 1.05–1.66 0.73 0.73–1.60 1.51 1.14–2.02 1.34 1.07–1.69 1.10 0.74–1.63 1.56 1.17–2.07 Age at Diagnosis (year) 15–29 Ref − Ref − Ref − Ref − Ref − Ref − 30–39 1.42 1.23–1.64 1.01 1.01–1.80 1.69 1.43–2.00 1.38 1.20–1.59 1.32 0.98–1.76 1.68 1.42–1.99 > 39 2.95 2.59–3.37 2.75 2.75–4.64 3.31 2.78–3.95 2.95 2.59–3.37 3.61 2.78–4.68 3.40 2.86–4.06 Period of Diagnosis 2004–2009 Ref − Ref − Ref − Ref − Ref − Ref − 2010–2015 1.04 0.93–1.16 0.95 0.95–1.37 0.98 0.85–1.12 1.12 1.00–1.25 1.19 0.99–1.43 1.04 0.91–1.20 Marital status Single Ref − Ref − Ref − Ref − Ref − Ref − Married 0.56 0.50–0.64 0.43 0.43–0.62 0.64 0.54–0.75 0.58 0.51–0.65 0.52 0.43–0.63 0.65 0.55–0.77 Other 0.91 0.77–1.07 0.79 0.79–1.24 0.83 0.66–1.04 0.90 0.77–1.06 1.01 0.80–1.26 0.79 0.63–0.99 Income ($) ≤ 5,000 Ref − Ref − Ref − Ref − Ref − Ref − 5,000–7,500 0.73 0.65–0.81 0.62 0.62–0.86 0.74 0.64–0.85 0.73 0.65–0.81 0.73 0.62–0.86 0.74 0.64–0.85 > 7,500 0.64 0.52–0.79 0.42 0.42–0.80 0.70 0.53–0.92 0.64 0.52–0.79 0.58 0.42–0.80 0.68 0.52–0.89 Note. *SEER histological A stage categories Table 3. Comparison of only SEER histo A stage and only AJCC stage in patients after 2004 using cox regression analyses
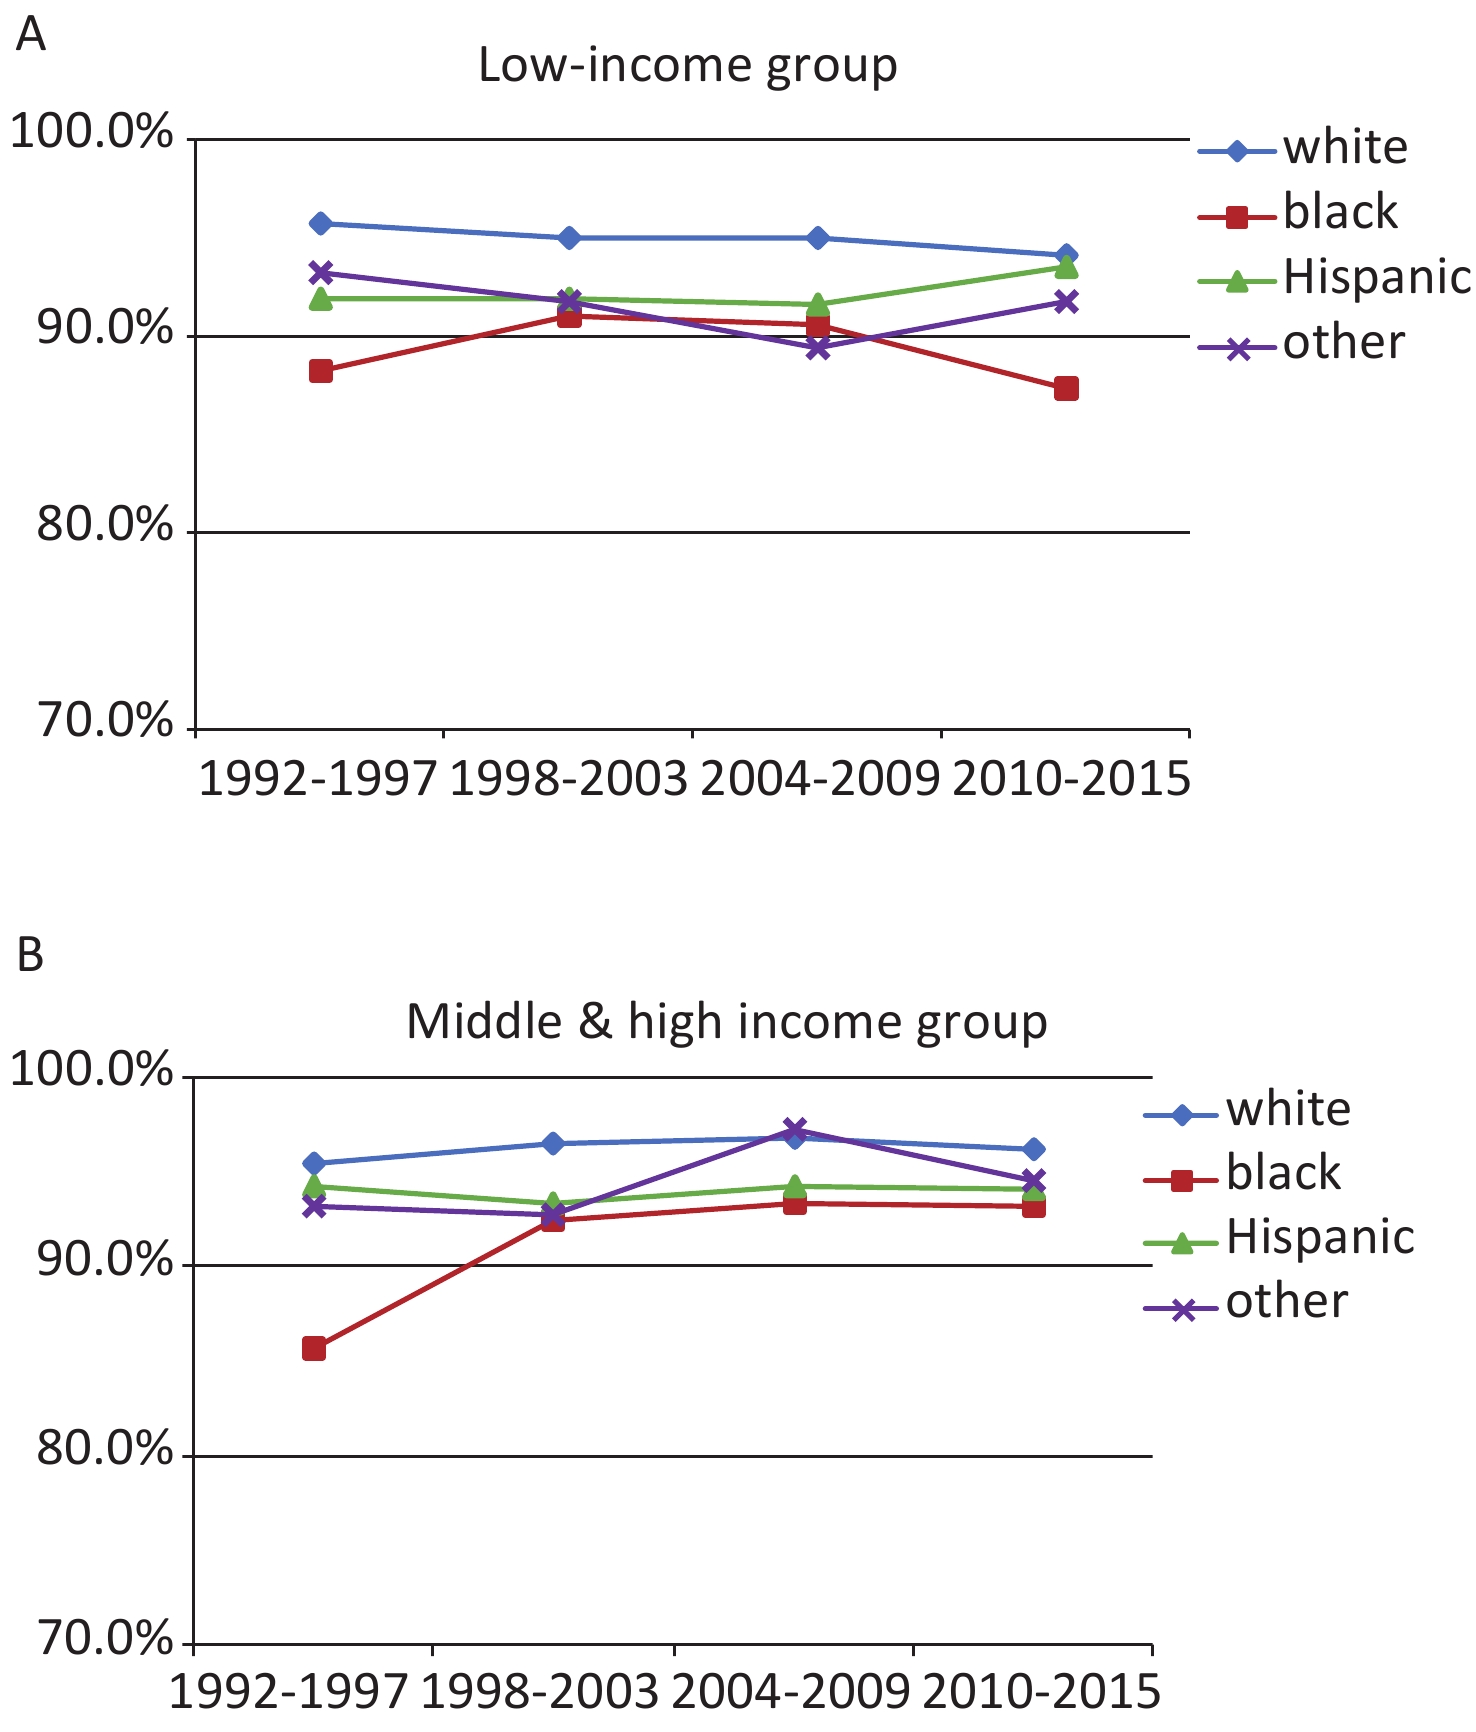
In addition, lower income is also a very important factor. Black low income has worsened in recent years (2010–2015) (Figure 4A). The three-year survival rate of the middle- and high-income situation is stable over 90%, but there is still a gap with white (Figure 4B). Above we all use multivariate analysis.
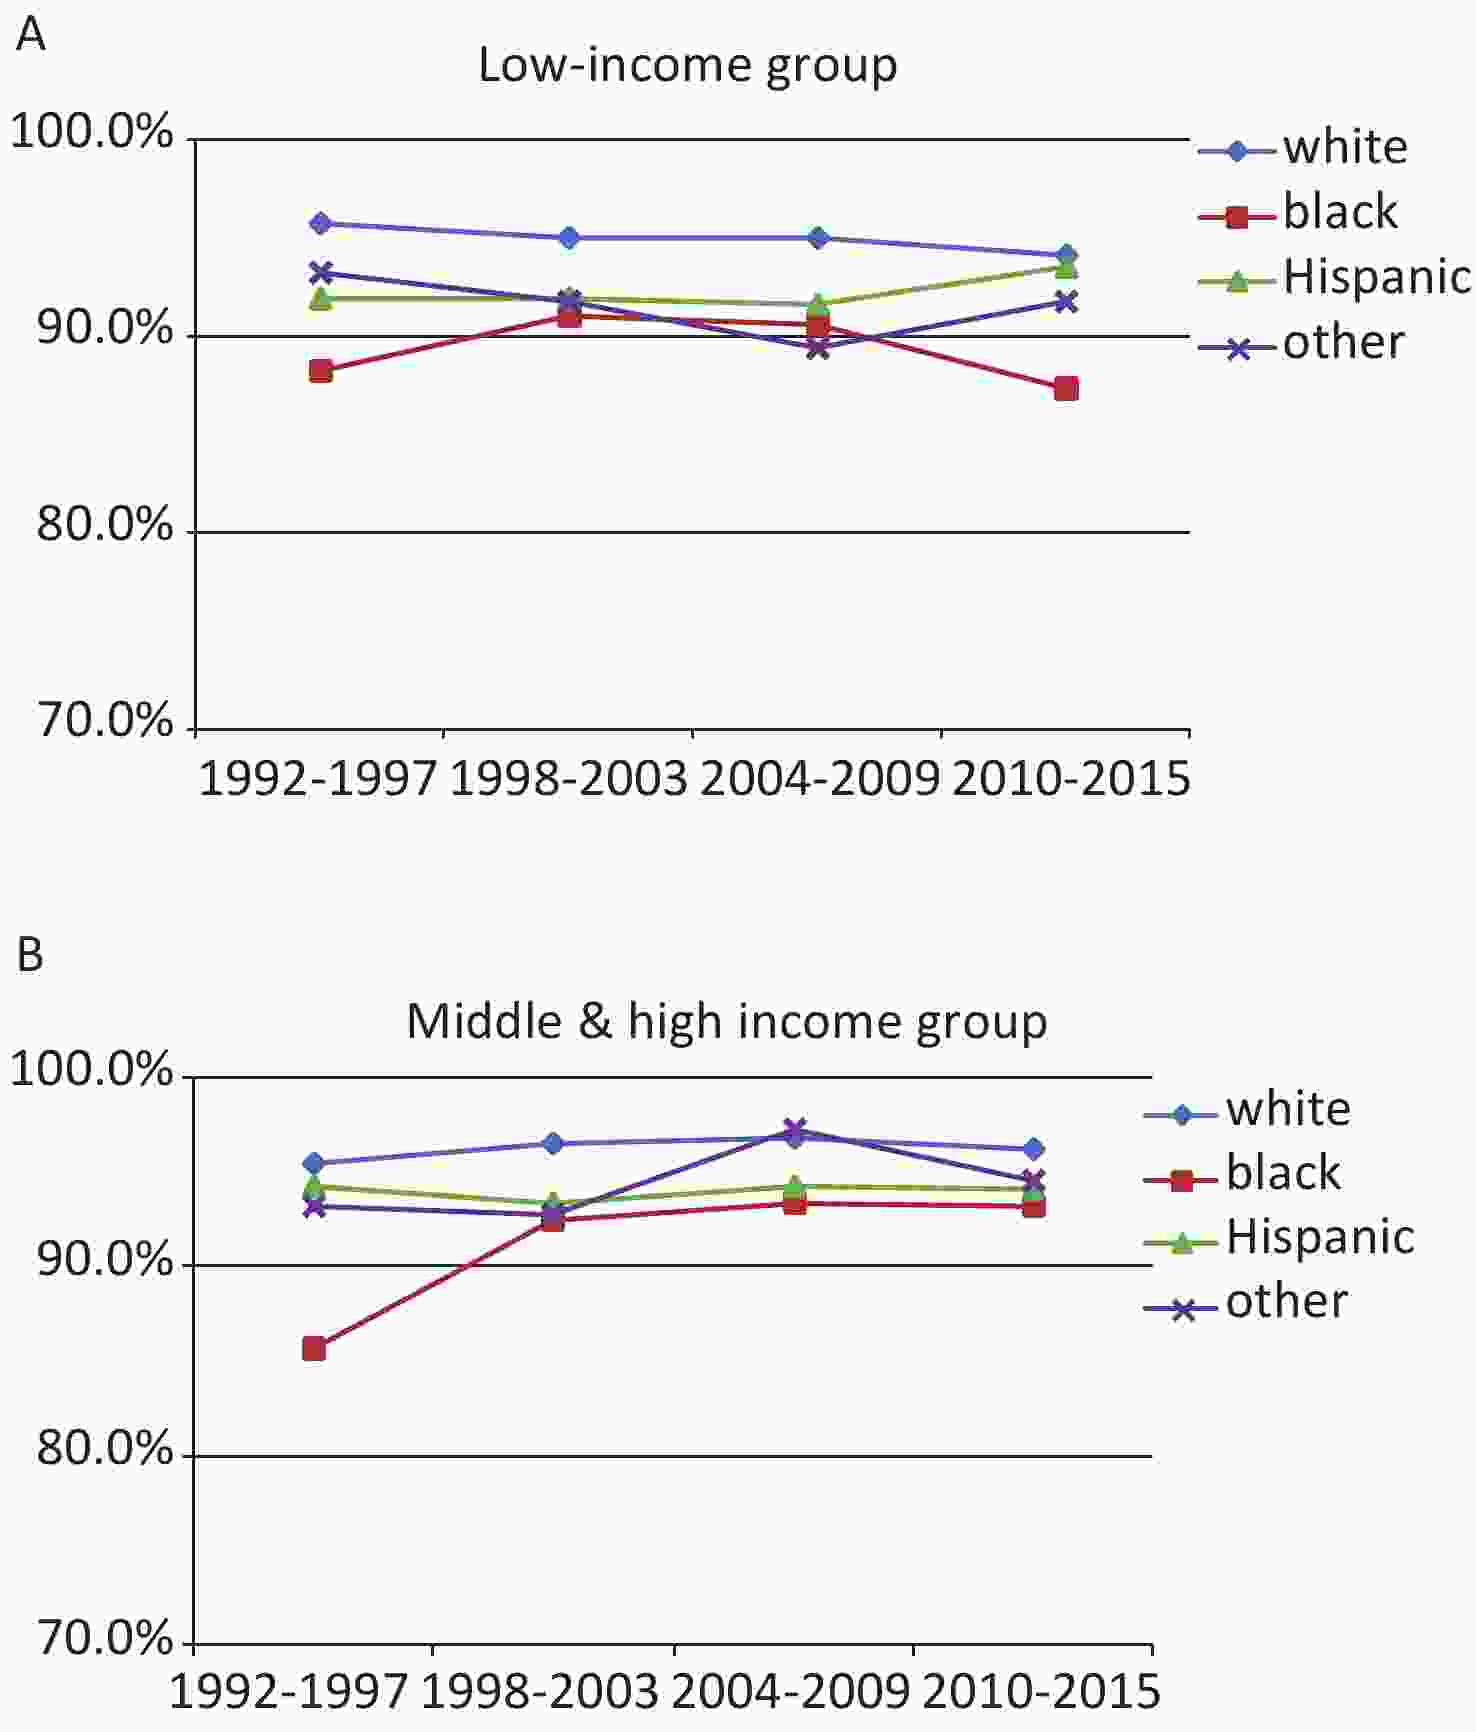
Figure 4. Relative survival rates by race/ethnicity for different income groups cases. (A) Relative survival rates of low income cases by race/ethnicity; (B) among middle & high income cases by race/ethnicity.
After assessment of the mortality in TGCTs with different histology types, we identified that black patients had a statistically significantly higher hazard ratio compared to white patients (HR = 1.56; 95% CI: 1.59–1.91) among overall TGCT cases. However, black patients with the seminoma subtype were not did not have a significantly higher mortality rate comparable with NH-white patients (HR = 1.36; 95% CI: 1.08–1.71). Contrary, black patient with the nonseminoma subtype had a significantly higher mortality rate when compared with NH-white patients (HR = 1.90; 95% CI: 1.51–2.39). In the cohort we can see the obvious difference in the number of people of different races, with the largest number of whites and three times the sum of the other three races. The most localized in whites, the highest proportion of blacks with a diagnosis age of > 39 (Supplementary Table S1, available in www.besjournal.com).
Variables Whole cohort (%)
N = 17,928Race/Ethnicity White (%)
n = 12,444Black (%)
n = 395Hispanic (%)
n = 4,292Others (%)
n = 797SEER histo A stage* Localized 58.4 60.1 51.4 54.2 57.1 Regional 22.3 23.0 19.7 21.1 20.8 Distant spread 19.3 17.0 28.9 24.7 22.1 Age at Diagnosis (year) 15–29 55.8 50.1 48.4 71.9 60.9 30–39 28.0 30.2 30.9 21.9 26.2 > 39 16.2 19.7 20.8 6.2 12.9 Period of Diagnosis 1992–1997 12.3 14.0 11.1 7.9 10.5 1998–2003 22.3 24.0 25.6 17.9 18.4 2004–2009 30.9 30.6 27.8 32.4 28.7 2010–2015 34.5 31.4 35.4 41.8 42.3 Marital status Single 57.0 53.0 62.3 66.3 66.4 Married 34.2 37.6 27.1 26.3 27.2 Other 8.8 9.4 10.6 7.4 6.4 Surgery Yes 97.3 97.7 94.2 96.8 96.1 No 2.7 2.3 5.8 3.2 3.9 Income ($) ≤ 5,000 43.3 38.1 58.2 59.0 33.4 5,000–7,500 47.4 51.6 37.5 34.7 54.0 > 7,500 9.3 10.3 4.3 6.3 12.7 Vital status Alive 90.1 90.8 80.0 89.0 89.1 Deceased 9.9 9.2 20.0 11.0 10.9 Note. *SEER histological A stage categories. Some of the results do not add up to 100% due to rounding. Table S1. Characteristics of the nonseminoma, overall and separately by race/ethnicity
-
While the influence of racial disparities are well-documented on the mortality outcome of multiple cancers[11-15], less is known regarding racial disparities for survival rates of testicular germ cell cancer. This study present the most robust categorization of multiple race/ethnic group with testicular germ cell cancer from the SEER database to date. Several striking features are evident in our results that have received limited attention in previous publications.
OS for testicular germ cell cancer has improved over the past 24 years[16], albeit to varying degrees, and this has resulted in persistent histological type- and race-related survival differences since 1992[17]. Improved survival for all patients likely reflects early diagnostic and therapeutic advances, such as improvements in cellular and molecular screening and diagnostics, staging, targeted therapies, and supportive care[18]. Unequal access to screening advances as well as other biological and nonbiological factors (such as medication adherence, disease biology, and pharmacogenomics) may also potentially underlie survival disparities between race/ethnic groups[19].
These result showed that black men with TGCT have a strikingly poorer survival than NH-white, Hispanic, and other race/ethnic groups. Differences in survival rates among race/ethnic groups vary by histological subtype. Blacks are more likely to develop seminoma TGCTs, but do not have significantly different survival rates compared to other race/ethnic groups. However, statistically different survival rates exist between blacks and whites among those with nonseminoma TGCTs.
The reason for the high mortality rate among black men with nonseminoma cancer is unknown. Various studies over the past two decades have helped shed light on the role of race in the screening, diagnosis, treatment, morbidity, and mortality of testicular germ cell cancer. Black males have a tendency to be diagnosed at a significantly later stages, in comparison with NH-white and Hispanic men who are screened and have disease detected earlier[20,21]. This has potentially to lead to an overall poorer prognosis, thus increasing the likelihood of mortality among minority men. In addition, racial differences in treatment were observed in black males, who received treatment less frequently[22]. Black men tend to have less treatment and differences were still apparent after adjusting for age, stage, and SES. However, other studies have reported this association disappears after also adjusting for accounting for histology. However, our study not only accounted for SES, we also analyzed the hazard ratio of age, stage and histology which all affect mortality rates among those with testicular germ cell cancer.
The most important risk factor for survival is the stage of disease at date of diagnosis. But the stage of disease itself depends on access to the healthcare system, such as insurance, income, etc. And individual factors like education and marital status. For example, most wives are more concerned about their husbands' health than they are themselves.
In our study, Cox regression analysis shows that the poorer survival among blacks with testicular germ cell cancer can be almost entirely explained by the poor survival of nonseminoma histologic types, but not seminoma histologic types. But we found the differences are not significantly among race between using SEER histo A stage or AJCC stage alone, so we did not use AJCC stage. There were no disparities in survival rates among NH-white, Hispanics, and other race/ethnic groups for the seminoma or nonseminoma cancers.
-
This study includes a large number of patients from a population-based setting, and this helped control for biases related to treatment/referral patterns observed in single-institution or smaller consortium-based clinical studies. Moreover, survival trends were calculated over many decades, which allowed for inferences on changes in population-based survival rates over time. In addition, our analysis of survival HRs were adjusted for age, histologic types, stages and treatments. Therefore one can assume significant differences between race/ethnic groups cannot be the result of any of these factors.
There are important limitations to the SEER registry, such as minimal disease-, treatment-, and relapse-specific data. We could not assess socioeconomic determinants, indicators of healthcare access to care, for example, health insurance status and treatment facility, or medication adherence, which are potential contributing factors to the observed survival outcomes.
-
Histological type of testicular germ cell cancer was the most important determinant of the differences in survival rates of testicular cancer by race/ethnic group in the SEER database from 1992–2015 Disparities in social economic status or access to treatment did not appear to explain the differences in survival rate of outcome of testicular cancer among different race/ethnic groups. The etiology behind to explain this finding is unknown and the relative contributions of environmental or genetic influences as they related to cancer incidence in blacks and whites are yet to be determined. Fully understanding the genetic and environmental factors could explain why blacks had higher incidence of seminoma and nonseminona tumors. To date, this is the largest longitudinal analysis of race- and histological type related survival trends in patients with testicular germ cell cancer. Our findings identify a major and persistent public health disparity. More attention should be paid to nonseminoma TGCTs and black patients with testicular germ cell cancer patients because these patients continue to suffer significantly poorer health outcomes in comparison with non-Hispanic whites. Similarly, characteristics that distinguish the unique cancer burden of different histological type of testicular germ cell cancer should be investigated, and interventions aimed at improving awareness of cancer rates, access to care, and quality of treatment for these patients should be implemented. Public health practitioners and primary health care doctors can be regularly trained to improve their working capacity, to raise the awareness of relevant medical personnel about the classification of testicular cancer tissues and to focus on populations at high risk, increased chance of cancer screening and early detection, early detection and effective treatment. This paper comprehensively analyzes the factors such as age, year of diagnosis, nationality, social and economic factors, histological classification and so on, and clarifies the difference of organizational classification, which provides a theoretical basis for future research. It provides a theoretical basis for the development of related research and the formulation of public health policy.
-
WU Jing: Project design, methodology, and writing-original draft and writing-review. JI Yi Bing: Conceptualization and writing-review and editing. TANG Bi Wei: Conceptualization and writing-review and editing. BROWN Matthew: Methodology and writing-review and editing. WANG Bao Hua: Conceptualization and methodology. DU Chen Lei: Conceptualization and writing-review and editing. DU Jian Shu: Conceptualization and writing-review and editing. WANG Xue Mei: Conceptualization and methodology. CAI Li Jun: Methodology, software. WU Guo Yi: Conceptualization, methodology, writing-review and editing, and supervision. ZHOU Yan: Validation, methodology, software, writing-review and editing, and supervision.
-
We declare that we have no conflicts of interest.
Funds:
This work was supported by the National Key Research Program of China [2016YFC1302601]

 Quick Links
 DownLoad: