


-
The diagnosis of human immunodeficiency virus (HIV), hepatitis C virus (HCV), and other infections is achieved by identification of serological and molecular markers in plasma[1-3]. However, serological procedures may effect a residual risk of viral infection persistence, which is related to the pre-seroconversion window period, infection with immunovariant viruses, immunosilent carriage, or occult carriage in infected individuals[4,5]. Under these conditions, nucleic acid testing is the method of choice for the diagnosis of HIV and/or HCV infection. In recent years, with an aim to reduce this risk, considerable attention has been paid to nucleic acid testing methods for the detection of viral nucleic acids (DNA or RNA)[6,7].
Another issue is that traditional diagnosis methods that utilize plasma pose challenges in execution in resource-limited settings as adequate facilities with complex equipment and specialized personnel are required[8]. In contrast, dried blood spot (DBS) samples offer many advantages and are a safe, robust, and convenient method for the collection, transport, and storage of small volumes of samples for the analysis of biomarkers[2]. Additionally, a significant number of studies have shown that nucleic acids (RNA or DNA) and antibodies can be stable in DBS samples for a long time and have demonstrated a wide application of serological and PCR procedures in viral detection using DBSs, such as for HIV, HBV (hepatitis B virus, HBV), and enteroviruses[6,9]. Recently, DBSs, as an alternative sample to plasma or a source for diagnostic testing, have become increasingly popular. DBSs are considered as a viable option and can markedly improve the diagnosis or surveillance of infectious diseases, such as HIV, HBV, and HCV, for individuals living in areas that are difficult to access. Therefore, there is growing interest relating to DBS as an alternative source sample for the nucleic acid detection of HIV, HCV, and Treponema pallidum (TP) infectious diseases. Globally, although advancements have been made with DBS protocols for HIV-1 RNA, HIV-1 DNA, and HCV RNA, further verification is needed[10, 11]. However, in China, there have been few studies regarding HIV-1 RNA, HIV-1 DNA, and HCV RNA testing using DBS, particularly those based on reagents commonly available in China.
Therefore, the present study was undertaken to investigate the performance of the simultaneous detection of HIV-1 RNA, HIV-1 DNA, and HCV RNA using one DBS based on Chinese detection kits. Using plasma as a reference standard, HIV-1 RNA, HIV-1 DNA, and HCV RNA analyses were performed, and a comparative analysis between plasma and DBSs was conducted.
-
For this study, 571 blood samples were collected from injection drug users (IDU) and men who have sex with men (MSM) from Heilongjiang, Jiangxi, and Yunnan province between July 2018 and October 2019.
-
Blood samples were collected by venipuncture into EDTA tubes. DBS specimens were prepared using 70 μL of EDTA whole blood per circle and then blotted onto filter paper (Whatman903, UK). The blood spot was allowed to air dry to be used as a DBS for further testing. After DBS preparation, whole blood samples were centrifuged to obtain plasma samples. Plasma and DBS samples were stored at −20 ℃ prior to processing.
-
Overall, 571 paired plasma-DBS samples were collected then tested as per the study design (Figure 1).
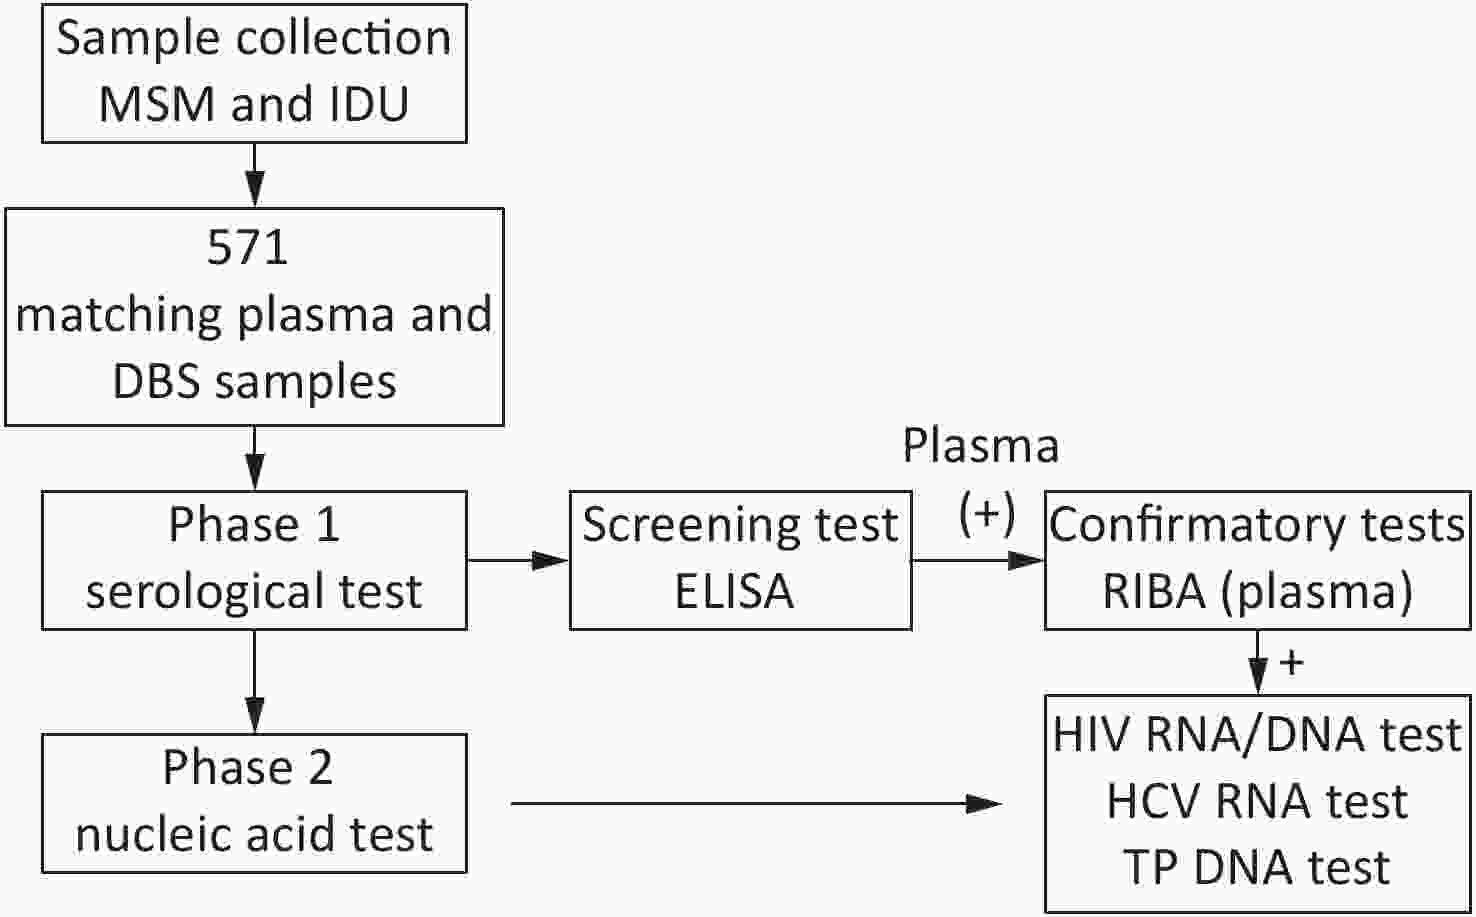
Figure 1. Study design. MSM, men who have sex with men; IDUs, injection drug users; DBS, dried blood spot.
-
For DBS testing, the whole spot was cut out and placed into a 1.5 mL Eppendorf tube. The DBS was then eluted with 500 μL PBS and 0.1% Tween 20 for 4 h at room temperature (18–25 ℃) and DBS eluates was obtained. DBS and plasma samples were tested for anti-HIV, anti-HCV, and anti-TP by ELISA using the Diagnostic Kit for Antibody to Human Immunodeficiency Virus (ELISA) (WANTAI BioPharm, China), the Diagnostic Kit for Antibody to Hepatitis C Virus (ELISA) (WANTAI BioPharm, China), and the Diagnostic Kit for Antibody to Treponema Pallidum (ELISA) (WANTAI BioPharm, China), respectively. All antibody-positive samples in the screening test were further confirmed by the confirmatory recombinant immunobinding assay (RIBA) as follows: Detection Kit for Antibody to HIV (1+2) (RIBA) (WANTAI BioPharm, China); Detection Kit for Antibody to HCV (RIBA) (WANTAI BioPharm, China); and Treponema Pallidum EUROLINE-WB (IgM) (EUROIMMUN, Germany). The assays were performed and interpreted according to the manufacturer’s instructions. Plasma results were used as the reference standard to establish the serological status for HIV, HCV, and TP.
-
Nucleic acid extraction: The matching plasma/DBS samples were subjected to nucleic acid extraction if the serological test in plasma showed an antibody positive for HIV, HCV, and TP. Total nucleic acids were extracted from plasma and DBS samples using the optimized QIAamp DNA Blood Mini Kit (Qiagen, Germany), which is an in-house method used for RNA isolation. The DBS samples were eluted using a protocol for nucleic acid extraction from DBSs optimized by our laboratory. Briefly, four disks were punched out with a 6 mm hole punch and nucleic acid was eluted in a 100 μL volume. For plasma, the nucleic acid from the plasma samples was extracted and then eluted to a volume of 120 μL. For the final elution volume, 20 μL was used for the HIV RNA test, 40 μL was used for the HCV RNA test, and 5 μL was used for the TP DNA test.
HIV RNA/DNA test: HIV-1 RNA viral load (VL) was measured in DBS and plasma samples by RT-PCR with the Diagnostic Kit for Quantification of Human Immunodeficiency Virus 1 Type (HIV-1) RNA (PCR-Fluorescence Probing) (DAAN GENE, China), according to the manufacturer’s directions. The results were considered positive if the PCR amplification curve was observed by RT-PCR.
HIV DNA levels were measured in DBSs tested by RT-PCR with Human Immunodeficiency Virus 1 Type (HIV-1) DNA Testing Kit (Kinghawk, China), following the manufacturer’s instructions. In this study, we compared the results with those obtained using a standard plasma HIV RNA assay.
HCV RNA test: HCV RNA VL was measured in DBS and plasma samples tested by RT-PCR using the Diagnostic Kit for Quantification of Hepatitis C Virus (HCV) RNA (PCR-Fluorescence Probing) (DAAN GENE, China), according to the manufacturer’s instructions. The results were considered positive if the PCR amplification curve was observed by RT-PCR.
TP DNA test: The PCR assay used for TP DNA was based on methods described by Heymans et al.[12], Wang et al.[13], and Orle et al.[14] to optimize the assay by adapting it to the available reagents and laboratory conditions in the present study. (Table 1). PCR amplification was performed in a thermal cycler (CFX 96Bio-rad, USA). The reaction mixture included 2 µL of the template DNA, 2 µL each of 10 µmol/L forward and reverse primers, 2 µL of the TaqMan Probe, 10 µL of the PCR Master Mix, and 2 µL of ddH2O. After a denaturation cycle of 5 min at 95 °C, the amplification profile consisted of 40 cycles of 30 s at 95 °C, 30 s at 55 °C, and 30 s at 72 °C.
Target Sequence (bases) tpn47 Forward 5'-TGCGCGTGTGCGAATGGTGGTC Reverse 5'-CACAGTGCTCAAAAACGCCTGCACG TaqMan probe 5’-FAM-AGTAACACCACGATAATGA
CCTCC-MGB-3’polA Forward 5'-GGTAGAAGGGAGGGCTAGTA Reverse 5'-CTAAGATCTCTATTTTCTATAGGTATGG TaqMan probe 5'-FAM-ACACAGCACTCGTCTTCAACTCC-BHQ-3' Table 1. TP DNA PCR primer and probe sequences
-
The results from plasma samples were used as the standard for assessment of the performance of DBS testing, and the positive and negative coincidence rates were analyzed. log10 copies/mL transformations of VL values measured in DBS samples and in the paired plasma samples were compared. To evaluate the difference between DBSs and plasma, a Bland-Altman bias plot of the bias versus the average value of DBSs and plasma was generated and the correlation analysis was performed using Spearman’s or Pearson’s correlation coefficient.
-
Samples from 38 anti-HIV-positive samples, 293 anti-HCV-positive samples, and 67 anti-TP-positive samples were obtained through serological testing. Among the antibody-positive samples, 32, 103, and 40 diagnostic samples were available for HIV, HCV, and TP nucleic acid tests, respectively.
Samples were divided according to HIV-1 RNA VL level and HCV RNA VL level in plasma, and detection rates were also analyzed according to different HIV-1 RNA VL and HCV RNA VL thresholds for DBSs, as shown in Table 2. For HIV-1 RNA testing, five samples (5/32) were not detectable in DBSs, while measurable levels were present in plasma (four, between 1.44 to 2.99 log10 copies/mL; one, between 3 to 3.99 log10 copies/mL). All 32 samples with detectable. HIV-1 RNA in plasma had detectable HIV-1 DNA in DBSs. There were two samples (2/94) with undetectable HCV RNA in DBSs, while measurable HCV RNA levels were present in plasma (–5 to 5.99 log10 copies/mL). In all samples, plasma HCV RNA was undetectable and DBS also provided concordant results (n = 9).
Items VL in plasma No. of samples DBS-positive Detection rate HIV RNA 1.44 to 2.99 log10 copies/mL 14 10 10/14 3 to 3.99 log10 copies/mL 7 6 6/7 4 to 4.99 log10 copies/mL 7 7 7/7 ≥ 5 log10 copies/mL 4 4 4/4 All 32 27 27/32 HIV DNA 1.44 to 2.99 log10 copies/mL 14 14 14/14 3 to 3.99 log10 copies/mL 7 7 7/7 4 to 4.99 log10 copies/mL 7 7 7/7 ≥ 5 log10 copies/mL 4 4 4/4 All 32 32 32/32 HCV RNA N/A 9 0 9/9 2.28 to 3.99 log10 copies/mL 7 7 7/7 4 to 4.99 log10 copies/mL 9 9 9/9 5 to 5.99 log10 copies/mL 12 10 10/12 6 to 6.99 log10 copies/mL 32 32 32/32 ≥ 7 log10 copies/mL 34 34 34/34 All 103 92 92/103 Note. VL, light chain variable region. Table 2. Concordance analysis of HIV RNA, HIV DNA, and HCV RNA detection results between plasma and DBS among antibody-positive samples
-
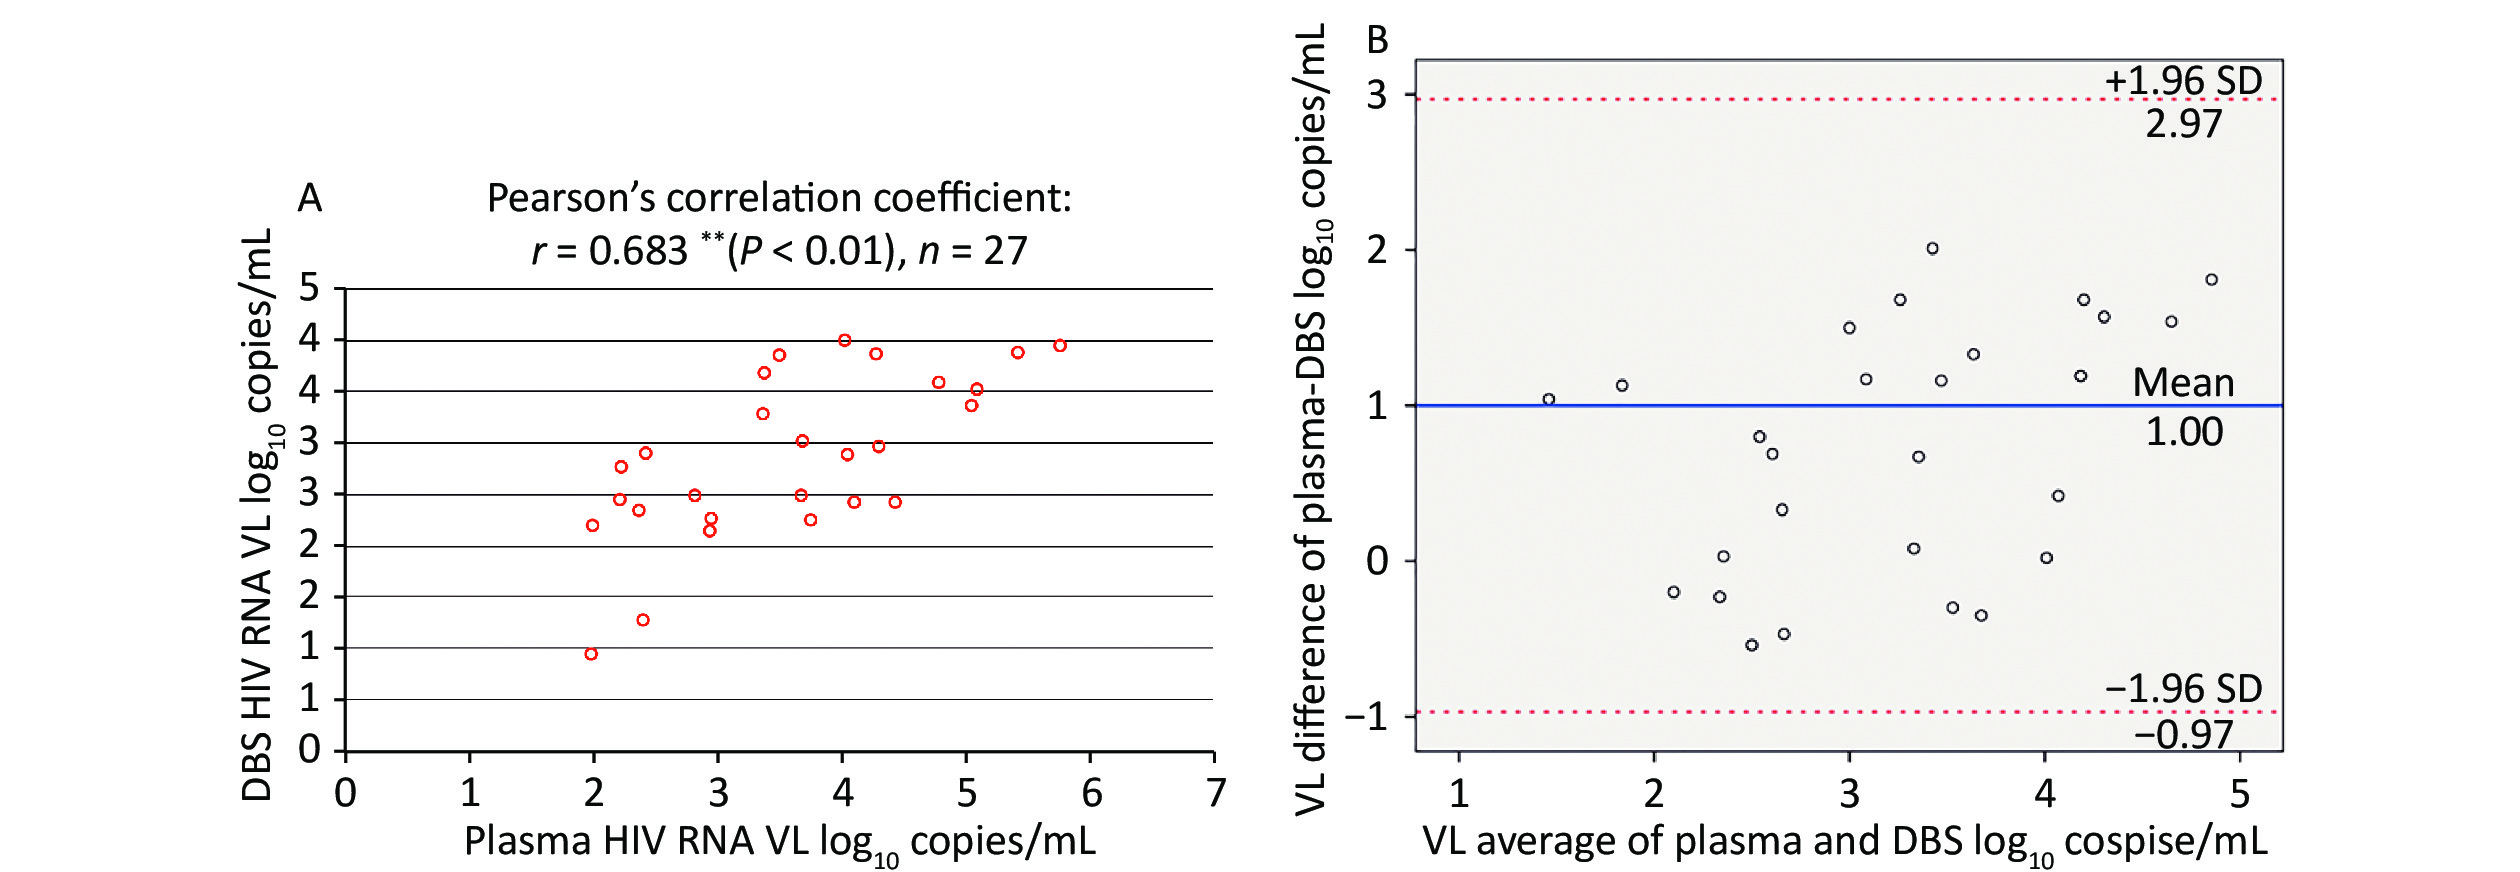
Among paired plasma/DBS samples with detectable HIV-1 RNA, the correlation between the VL determinations from plasma and DBS was assessed using Pearson’s correlation coefficient, as shown in Figure 2A. This demonstrated a moderate, positive correlation (r = 0.683, n = 27), which was statistically significant (P < 0.01).
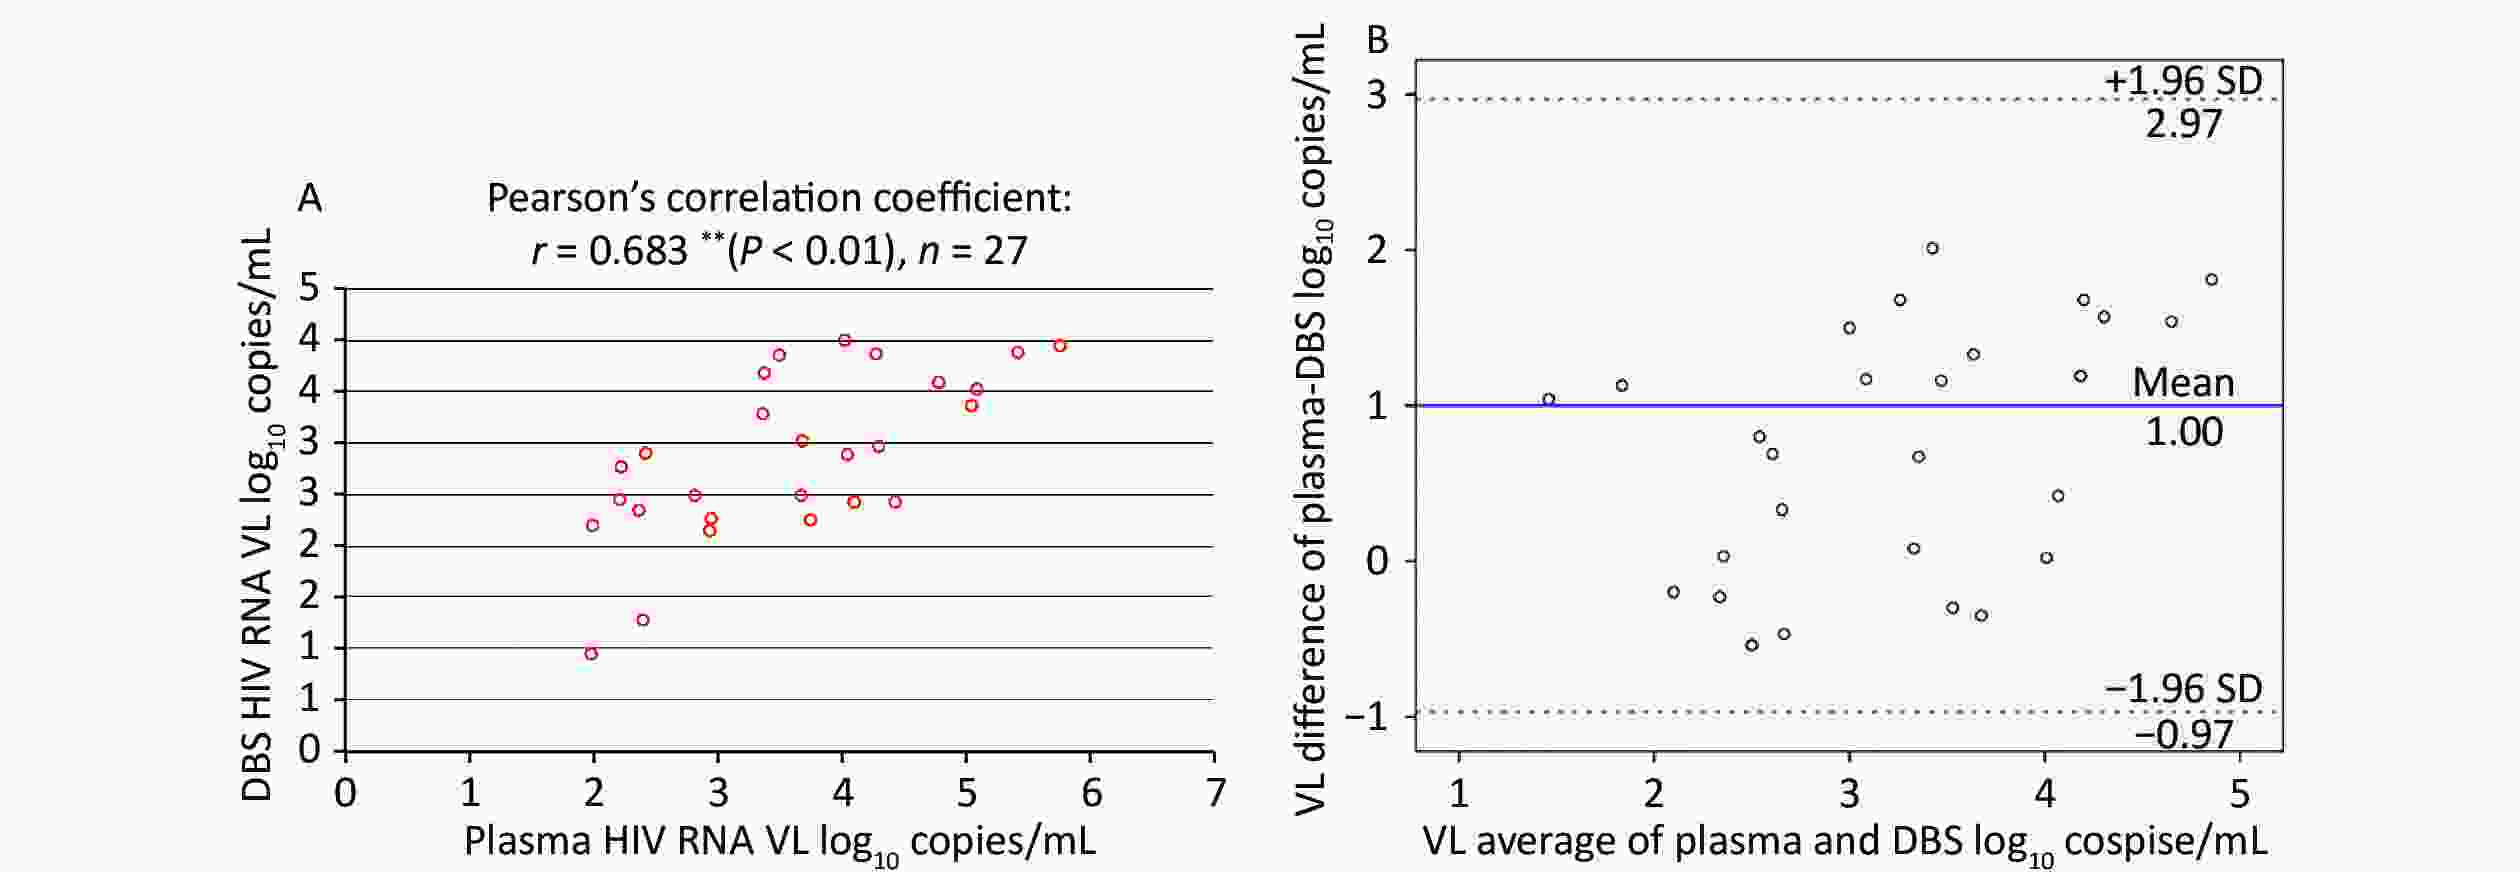
Figure 2. Correlation and Bland-Altman analysis of agreement between HIV RNA VL in paired plasma and DBS samples. (A) Correlation between HIV VL in paired plasma and DBS samples. (B) Bland-Altman analysis of agreement between HIV VL in paired plasma and DBS samples. The red lines represent ± 1.96 standard deviation. The blue lines represent the mean difference. VL, light chain variable region
The Bland-Altman plot in Figure 2B showed that the mean (± SD) difference between HIV-1 RNA in plasma and DBS was 1.00 ± 1.01 log10 copies/mL, and all samples were within the 1.96-SD limits (–0.97 to –2.97 log10 copies/mL) for DBS. Overall, HIV-1 RNA levels obtained from DBS were lower than those in plasma.
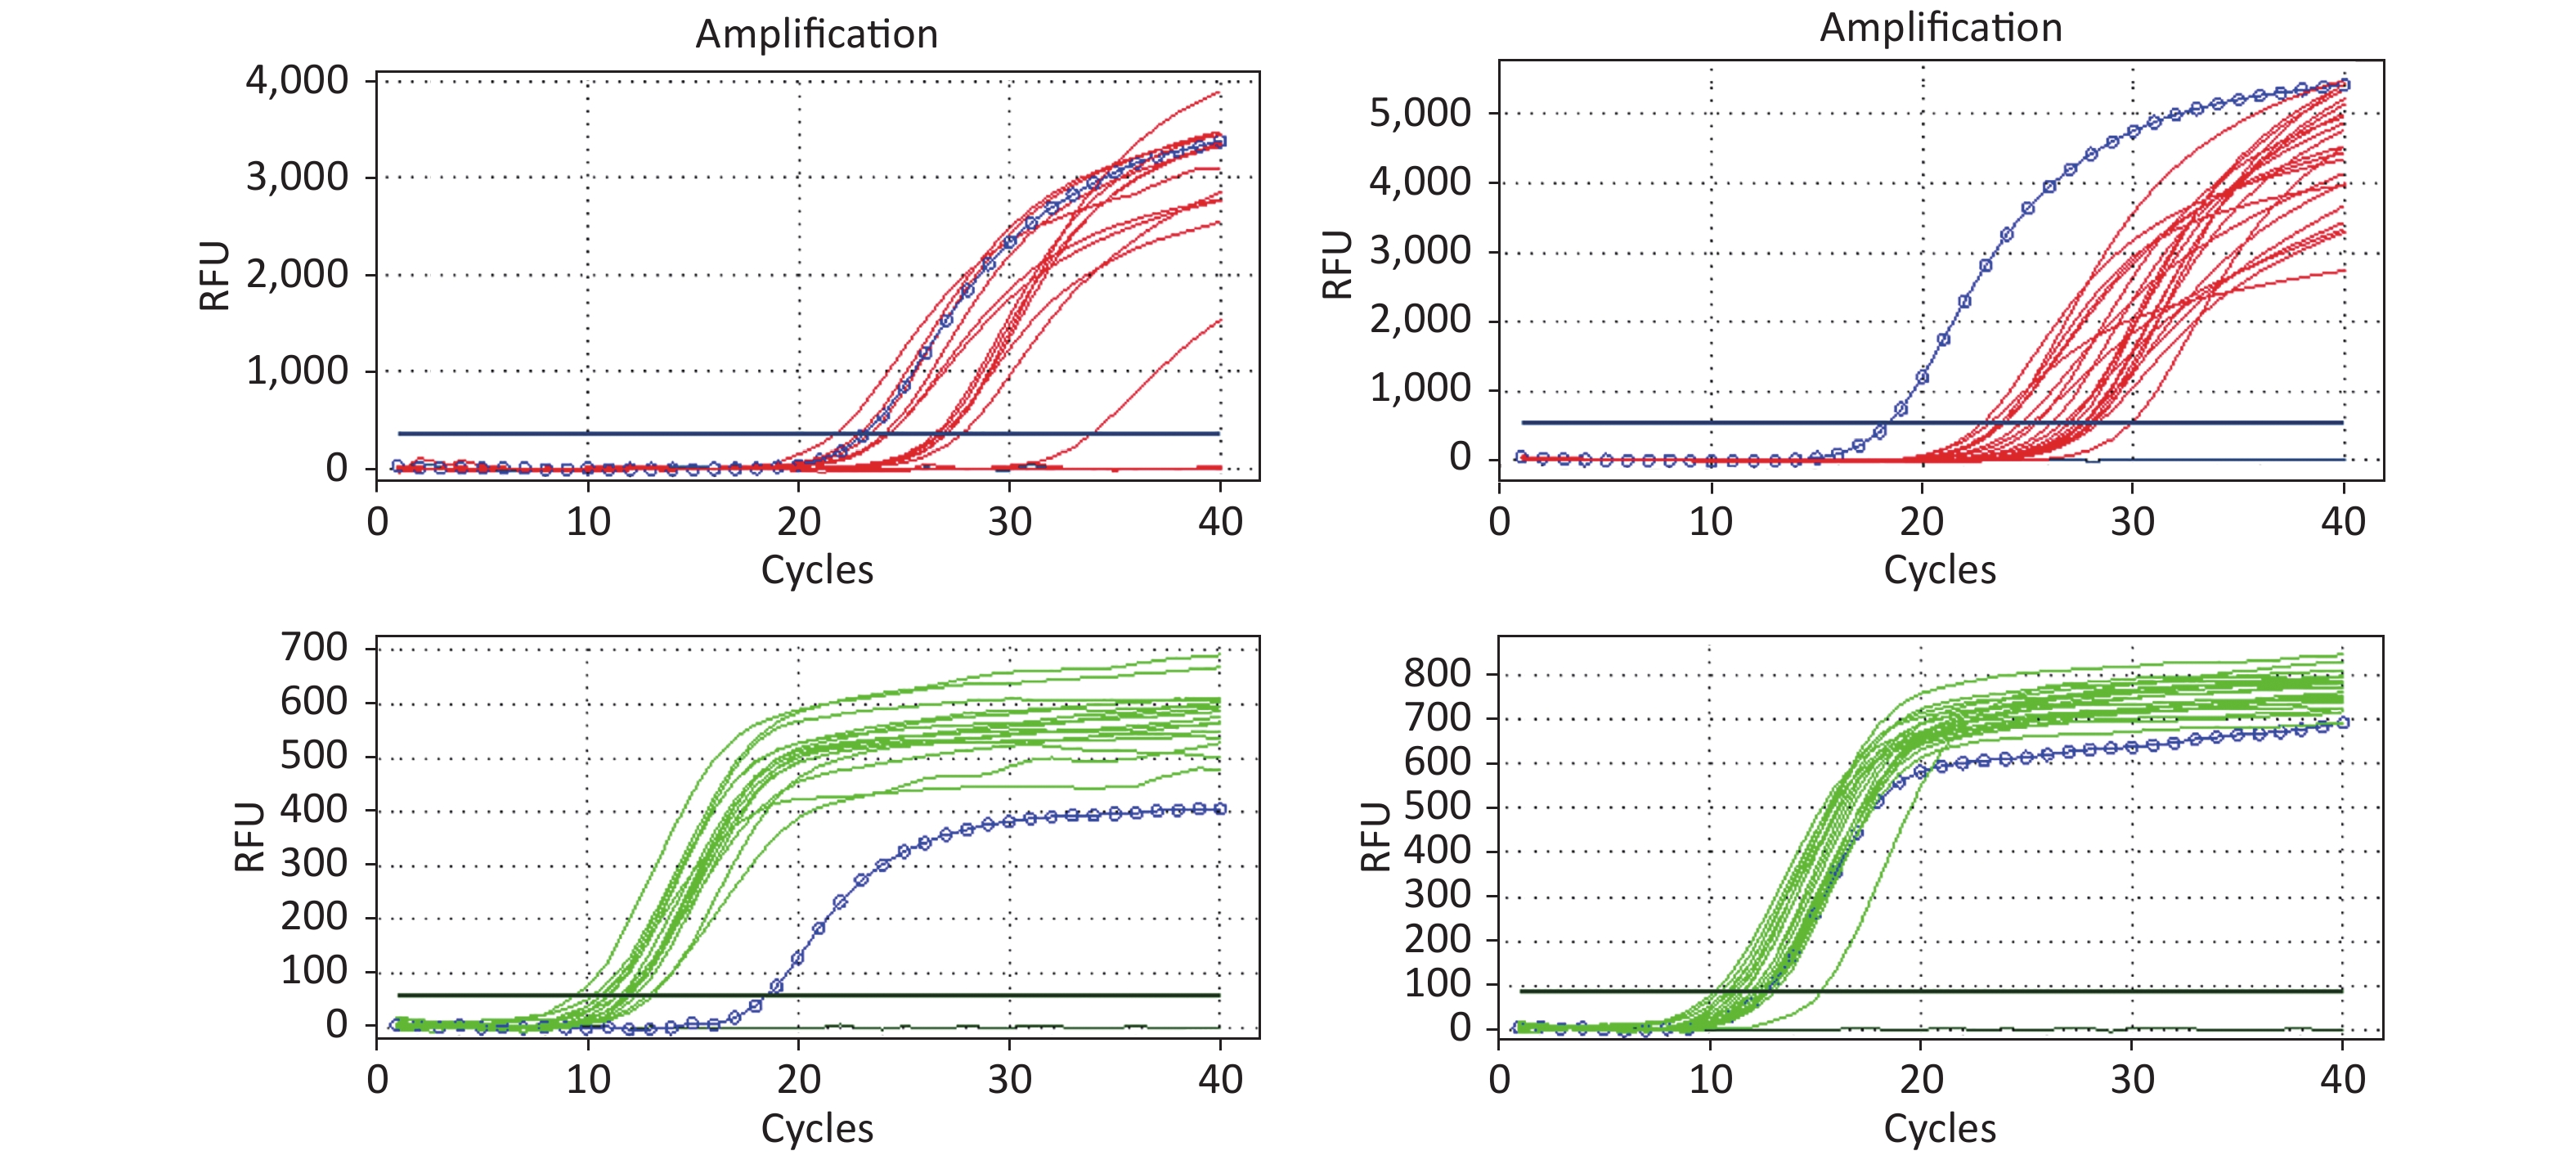
All RT-PCR amplification plots for the HIV-1 DNA test (32) from DBSs are illustrated in Figure 3. All 32 DBS samples for HIV-1 DNA were detectable and the amplification curves of target genes and internal control genes were found to be good.
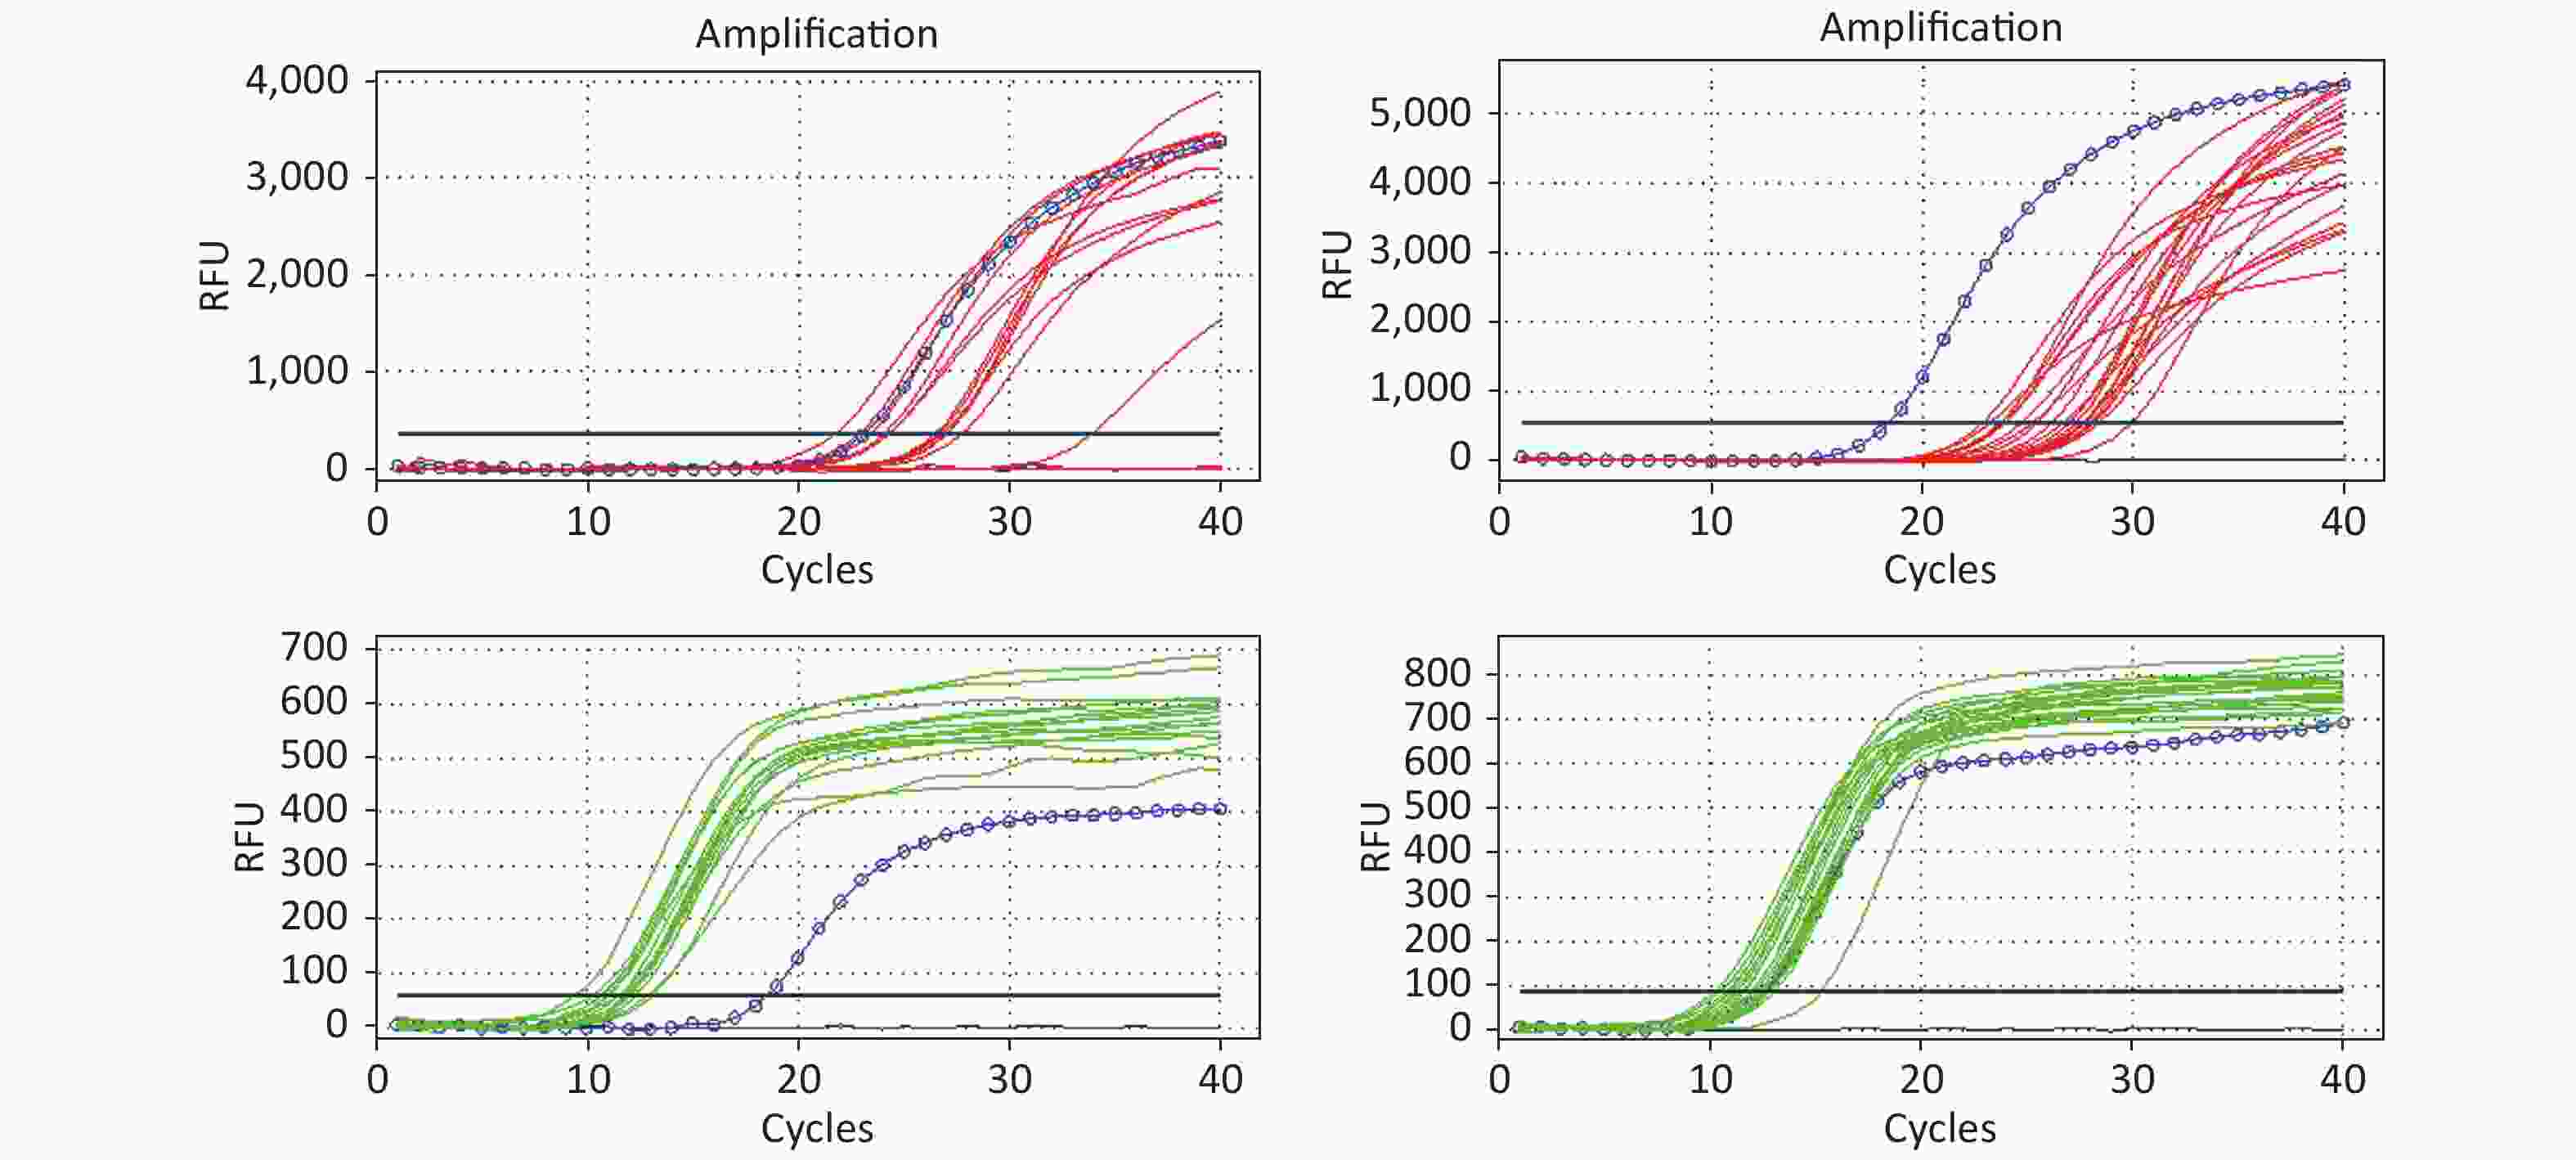
Figure 3. The amplification curve of the target gene and internal control gene in HIV DNA RT-PCR. The figure shows the HIV DNA test results of 32 DBS samples. The red lines represent the amplification curve of the target gene (FAM probe); the green lines represent the amplification curve of the internal control gene (HEX probe); and the blue circle lines represent the amplification curve of the positive control. If HEX Ct ≤ 15.0 and FAM Ct ≥ 28.0, the reported results were positive. Ct represents the threshold cycle
-
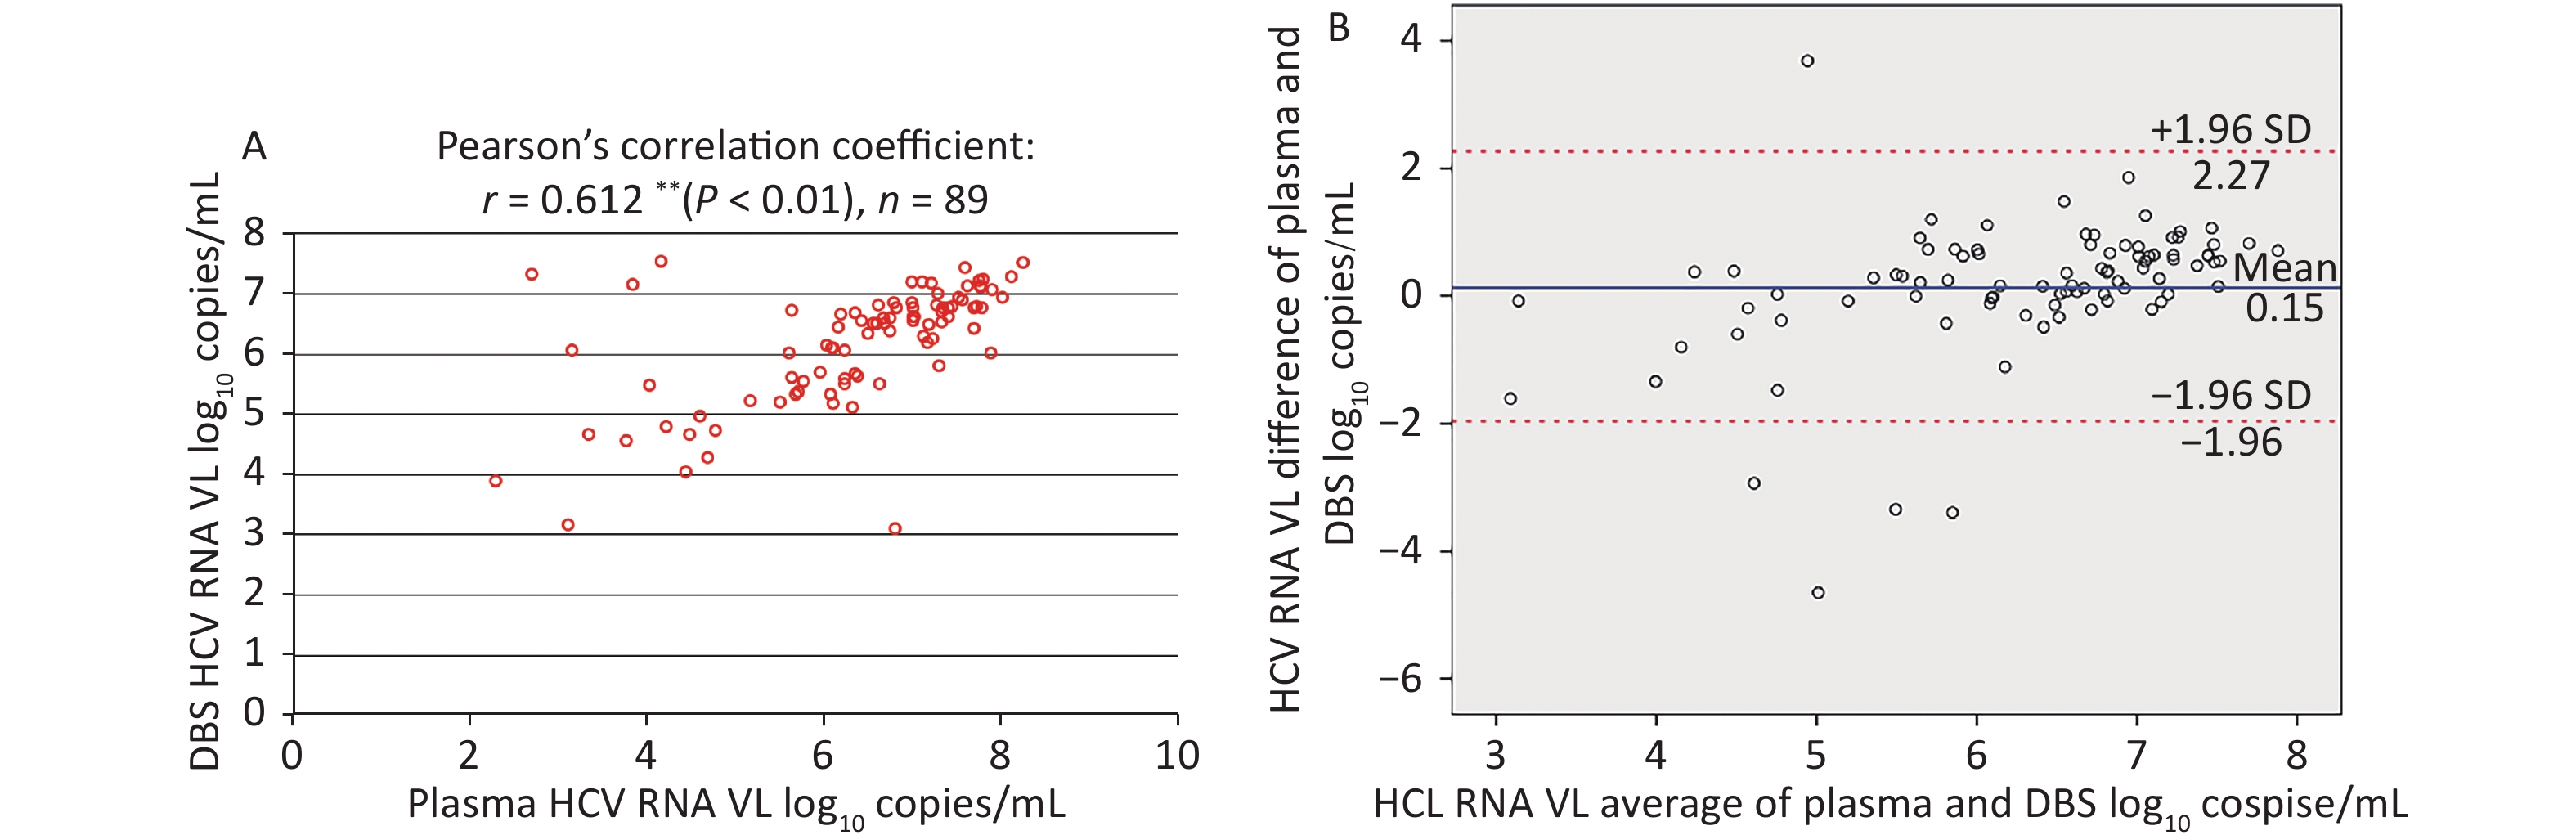
Among plasma-DBS pairs with detectable HCV RNA, the correlation between HCV RNA VL values obtained from plasma and DBS was high (Pearson’s correlation coefficient: r = 0.612 (P < 0.01), n = 89, as shown in Figure 4A.
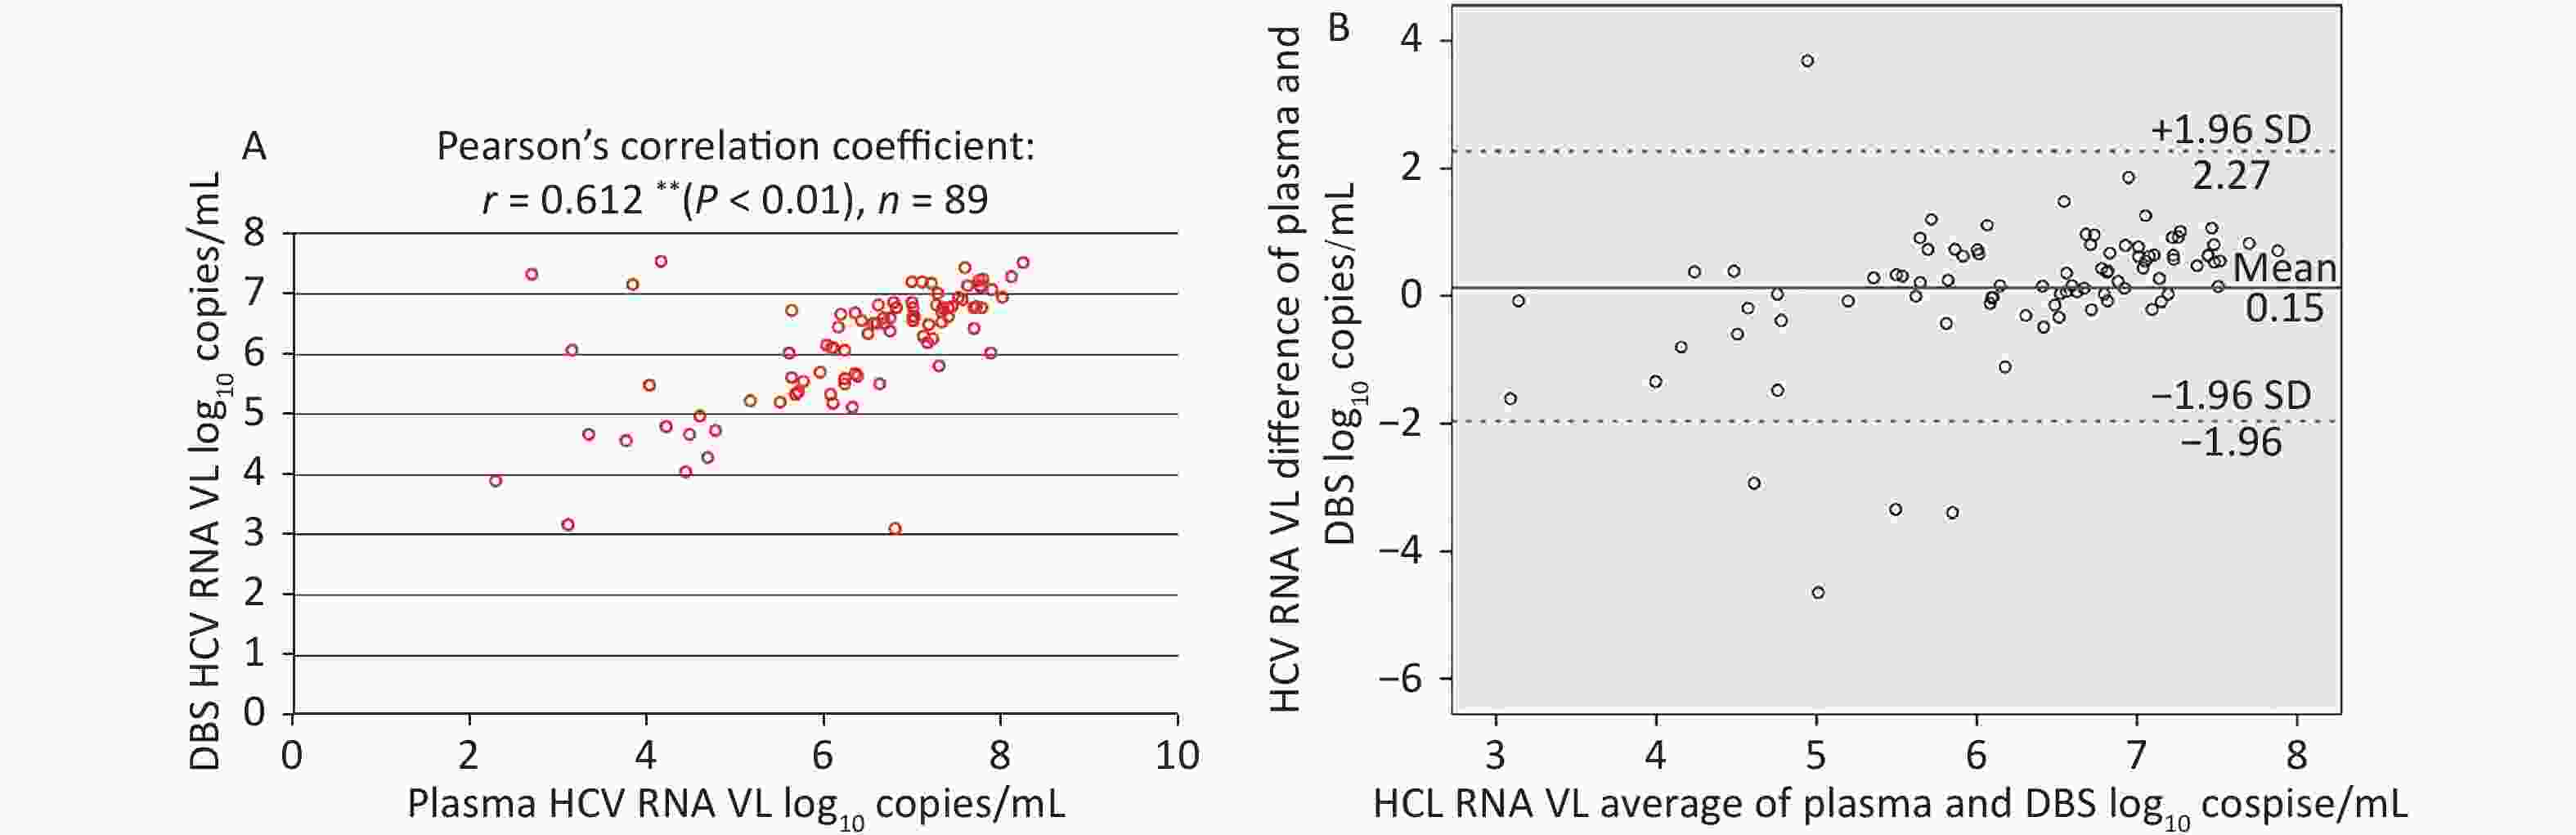
Figure 4. Correlation and Bland-Altman analysis of agreement between HCV RNA VL in paired plasma and DBS samples. (A) Correlation between HCV RNA VL in paired plasma and DBS samples. (B) Bland-Altman analysis of agreement between HCV RNA VL in paired plasma and DBS samples. The red lines represent ± 1.96 standard deviation. The blue lines represent the mean difference. VL, light chain variable region.
The corresponding Bland-Altman plot illustrated the agreement between plasma and DBS in Figure 4B, which indicated that the mean difference (± SD) was 0.15 ± 1.08 log10 copies/mL and 94.38% (84/89) results were within ± 1.96 SD (–1.96 to 2.67 log10 copies/mL). Moreover, HCV RNA levels were, on average, slightly higher in plasma than in DBS.
-
In this study, we attempted to develop a triple nucleic acid test for HIV, HCV, and TP to allow for the simultaneous detection of three infections using one DBS sample. We also evaluated the performance of the TP DNA test in plasma and DBS samples. The tolulized red unheated serum test was performed in anti-TP samples (24/67). All samples were undetectable for TP DNA (24) in plasma and DBS.
Results showed a failure to detect TP DNA in the plasma and DBS. Although TP can spread systemically after infection, the concentration of TP is too low to be detected and the volume of blood in DBSs is generally small (50–100 µL), which complicates the use of DBSs in detection of TP DNA[2, 15].
-
In samples with low HIV-1 RNA levels (1.44 to 3.99 log10 copies/mL), five samples with undetectable HIV RNA were observed in DBSs. Two samples had undetectable HCV RNA in DBSs, while plasma results presented high HCV RNA levels (5 to 5.99 log10 copies/mL). These results are similar to those of other studies and suggest that the lower sensitivity in detection of RNA in DBS may be associated with the low RNA levels in plasma or the degradation of RNA on DBSs[16, 17]. Additionally, this is likely due to differences in sample volume, DBS elution procedure, and RNA extraction method[16]. To date, relevant research regarding DBS samples has been conducted under non-standardized conditions without a universally accepted method and evaluation standard, which are reflected in many aspects of DBS, such as collection, elution, or nucleic acid extraction[18].
In this study, correlation analysis between plasma and DBS was performed for HIV-1 RNA and HCV RNA, respectively. A good correlation was found between plasma and DBS, both in HIV RNA and HCV DNA testing. Similar results have been reported in various studies conducted in different locations worldwide (HIV-1 RNA: ‘r’ range from 0.75 to 0.98; HCV RNA: ‘r’ range from 0.52 to 0.92)[19-23]. However, the ‘r’ value in the present study was slightly lower than those of others (HIV-1 RNA: ‘r’ = 0.683; HCV RNA: ‘r’ = 0.612). A large sample size would provide better and more reliable results[24]. The Bland-Altman analysis showed good agreement between plasma and DBS, for both HIV-1 RNA and HCV DNA testing. HIV-1 RNA VL values between plasma and DBS differed by 1.00 log10 copies/mL on average, and this was 0.15 (< 1) log10 copies/mL for HCV RNA.
HIV-1 DNA is a biomarker of HIV reservoirs and denotes HIV persistence in all infected cells and tissues that participate in pathogenesis; thus, it can be also used as a virologic marker for diagnosis of HIV infection[25]. For HIV-1 DNA testing, the results obtained from DBSs were consistent with those of HIV-1 RNA in plasma samples (Table 2). A comparison between DBS and blood for HIV-1 DNA was not conducted in this study. According to the amplification curve, the results were good and no nonspecific amplification occurred (Figure 3). Our results suggest that DBSs used for HIV-1 DNA RT-PCR tests performed well and that high- and good-quality HIV-1 DNA could be extracted from DBSs. A study by Arredondo et al. suggested that intracellular HIV-1 DNA might be more easily recognized in DBSs compared to that in plasma[26]. However, when DBSs were used for HIV-1 RNA testing, RT-PCR may co-amplify cell-associated HIV RNA and DNA, which may lead to false-positive results[11]. No false-positive results for HIV-1 RNA were observed in the present study.
This study demonstrated that it might be feasible to allow for the simultaneous detection of HIV-1 RNA, HIV-1 DNA, and HCV RNA using one DBS sample. Preliminary studies by our group have shown that DBS can be used to screen for HIV, HCV, and syphilis at the serological level[27]. We hope to establish a DBS screening strategy at the serological and molecular level. Therefore, DBSs may be a potential alternative to plasma for use in the detection and monitoring of HIV, HCV, and syphilis in future.
-
In conclusion, the performance of the simultaneous detection of HIV-1 RNA, HIV-1 DNA, and HCV RNA using one DBS was good and acceptable. Additional studies are needed with larger sample sizes. In future, the development and establishment of a standard protocol for DBSs is required for their application for the detection and surveillance of infectious diseases, especially in resource-limited settings or for people living in areas that are inaccessible or difficult to access.
-
The study was approved by the Ethics Review Committees of the National Center for AIDS/STD Control and Prevention, China CDC (No. X190111551) and was performed in accordance with all relevant guidelines.
The request for the waiver of informed consent was approved by the Ethics Review Committees of the National Center for AIDS/STD Control and Prevention, China CDC (No. X190111551). Research was conducted using unlinked samples for patient anonymization and no patient information was used in this study. Therefore, written inform consent was not obtained from patients.
-
The authors would like to acknowledge the staff members of all participating laboratories.
-
The authors declare that they have no conflict of interest.
Exploration of an Efficient Simultaneous Molecular Detection Method of HIV, HCV, and Syphilis from a Single Dried Blood Spot
doi: 10.3967/bes2021.034
Funds:
This project was supported by the National Science and Technology Major Project of China in the 13th Five-Year [2017ZX10201101-002-003]
- Received Date: 2020-03-30
- Accepted Date: 2020-09-21
-
Key words:
- Dried blood spot (DBS) /
- Correlation /
- Bland-Altman /
- HIV-1 RNA /
- HIV-1 DNA /
- HCV RNA
Abstract:
| Citation: | MA Jie Qiong, XU Qing Qing, HE Lin, HE Xiao Xia, CHEN Kai, WANG Yue Hua, XING Wen Ge, JIANG Yan. Exploration of an Efficient Simultaneous Molecular Detection Method of HIV, HCV, and Syphilis from a Single Dried Blood Spot[J]. Biomedical and Environmental Sciences, 2021, 34(4): 257-264. doi: 10.3967/bes2021.034

|

 Quick Links
 DownLoad: