

-
Motorcycles have been proven to be the main source of maximum emissions of particulate matter. In many countries, it is reported that the major polluting factor of ambient air has to do with emissions from motorcycles, as compared to all modes of transportation[1-5].
Emissions from motor vehicles have changed substantially over the last two decades due to new fuels, engine designs, and improved emission control technology. Studies on the health effects of motor vehicle exhaust are increasingly complicated by the changes in emissions over time. Motorcycle exhaust (ME) is a significant source of air pollution in China and other Asian counties. Exhaust emissions of motorcycles include carbon dioxide, nitrogen oxide, polycyclic aromatic hydrocarbons and ultrafine particles[6, 7]. It is known to contain significant amounts of ultrafine particles (< 0.1 µm) and polycyclic aromatic hydrocarbons, which are attached to the surface of particles[8, 9]. There are convincing evidences that polycyclic aromatic hydrocarbons are significant toxic components of PM2.5, leading to adverse human health risks[1, 5]. Compared to automobile exhaust, although motorcycles have a small displacement, the amount of particulate matter and polycyclic aromatic hydrocarbons emitted are higher than those of the automobile exhaust[1]. As an important source of air pollution, it is necessary to characterize the health risk assessment. In this regard, dose-effect relationship is the keystone of risk assessment. Our results provide basic data for further health risk assessment.
Several studies have documented the relationship between human exposure to ME and adverse respiratory system toxicity[10-14]. However, there is a lack of knowledge regarding the exposure threshold and regulation threshold of particulate matters (PM) in the ME. Therefore, it is necessary to investigate the dose-dependent effects and regulation threshold of motorcycle exhaust particulates (MEPs). Using the no observable adverse effect level (NOAEL) to determine reference doses and reference concentrations has limitations: 1) It is limited to one of the doses in the study and depends on the study design. 2) It does not account for variability in estimate of the dose-response. 3) It does not account for the slope of the dose-response curve. 4) It cannot be applied when there is no NOAEL, except through the application of an uncertainty factor. The European Chemicals Agency and the Scientific Committee of the European Food Safety Authority stated that benchmark dose (BMD) can be used in parallel or as an alternative when there is no reliable NOAEL. Also the World Health Organization’s International Panel for Chemical Safety stated that BMD can be considered as a more sophisticated or robust alternative to NOAEL. Even stronger recommendations have been made by the US National Academy Committee for Acute Exposure Guidance Levels, declaring that BMD should be the preferred approach. The BMD approach was proposed on developmental toxicity and has been accepted and extensively used for quantitative risk assessment in environmental, epidemiological, and general medical fields. Shao et al.[15] used the BMD procedure to estimate the critical concentration of urinary cadmium in a general population exposed to cadmium in China. In addition, Chen et al.[16] applied the BMD to estimate cadmium reference level for hypertension in Chinese population. In literature, there is no study applying the BMD approach for assessment of regulatory threshold of MEPs in epithelial cells.
A new method for analyzing particle aggregate mobility has been recently developed and incorporated in Aerosol Instrument Manager® Software for TSI Model 3,936 and 3,938 series scanning mobility particle sizer (SMPS) spectrometers. Furthermore, this software module could be used for post-processing of collected SMPS data. These methods provide more accurate estimate of number, surface area, and mass distributions of particles such as MEPs[17], submicron particles[18], fine and ultrafine particles in the production chain of ferrochromium and stainless steel[19]. Thus, characterization of the number, surface area, and mass concentration (MC) evaluated from SMPS software module for MEPs is feasible and fast; and the number, surface area, and MC should be used as the dose of effects induced by MEPs in the process of calculating limit of benchmark dose (BMDL) using BMD software.
Compared with the size of other air pollutants, MEPs are finer particles with a diameter within 1 μm[20]. Therefore, the primary exposure route for human being is by inhalation and the airway epithelial cells in the lung are the first recipients of the inhaled particles. The ALI exposure system is becoming a realistic and efficient tool for assessment of lung toxicity and cell-cell interaction following exposure to aerosolized or gaseous form of air pollutants[21]. According to a recent study, it was shown that ALI in vitro inhalation models are promising tools that can aid the further development of in vitro methods in the field of inhalation toxicology[22]. ALI has the advantage of simulating real-life inhalation exposure, which advances the analysis of biological and physiologically relevant effects of inhaled toxicants[23]. It has been applied for in vitro toxicology assessments in airway epithelial cells[24-26]. It also allows researchers to generate and deliver an inhalable complex such as cigarette smoke aerosols[27], ME[17], and volatile organic compounds[28] to a complete bronchial epithelial cell system, thus, more precisely, mimicking the in vivo human exposure scenario. Therefore, using the unique ALI exposure system can simulate real-life inhalation exposure of human airway epithelial cells and BMDL value will be more similar to that of human exposure.
Cell viability assay is the most important biomarkers in determining the effect of cellular response to a toxicant and it plays a fundamental role in all forms of cell culture[29]. Cell Counting Kit-8 (CCK-8) is used for sensitive colorimetric assays, such as determination of cell viability in cell proliferation and cytotoxicity assays, and is a widely exploited approach for measuring cell viability[30-32]. It is marketed as ready-to-use solution, thus making the whole protocol more rapid.
The ability to employ a rapid assessment protocol to obtain an estimate of the dose-dependent effect of MEPs in lung cells would be valuable to aid short-term policy setting and provide a basis for the development of a more detailed and resource-intensive monitoring plans. Therefore, to provide the potential exposure threshold of MEPs in a lung cell model, we employed BEAS-2B cells as human bronchial normal cells and measured CRV of the cells (using CCK-8 assay) induced by the whole ME via ALI exposure system as an effect biomarker. To develop the BMD and BMDL by applying BMD Software, we evaluated the dose-dependent effect of MEPs in BEAS-2B cells through CRV, based on number, surface area, and MC of the MEPs in different dilution ME using SMPS-3938 model as the exposure dose.
-
The sampling exhaust emission was carried out in a two-wheel motorcycle. The vehicle is equipped with a three-way catalytic converter and had run 8,691 kilometers. Gasoline of octane number 92 from China Petroleum Company was used as fuel for the motorcycle. The motorcycle was conditioned at cold starting and idling until all ME samples were collected using Tedlar bag (Beijing Safelab Technology Ltd, China). Four concentrations were included by direct dilution method and the ME was diluted into 1:20, 1:10, 1:5, and 1:2 according the ratio of VME / VClean air. All ME samples were collected for particles characterization analysis, such as number, surface area, and MC, as well as for in vitro experiments via ALI exposure system.
-
Particle number and size distribution were measured using an aerodynamic particle size spectrometer (SMPS-3938, TSI Corporation, USA). The scanning diameter ranged from 18.1 to 947.5 nm. The measurement cycle was 218s and sampling flow was 0.3 L/min. To quantify the number, surface area, and MC of MEPs and clean air, all samples were scanned five times and expressed as total concentration calculated automatically by Aerosol Instrument Manager® Software. Results were expressed as mean ± standard deviation (SD) for the number, surface area, and MC.
-
The human bronchial normal cell line BEAS-2B was obtained from Shanghai Bogoo Biology and cultured in RPMI-1640 supplemented with penicillin (100 U/mL), streptomycin (100 μg/mL), 10% FBS and 2 mmol/L L-glutamine. For exposure experiments, cells were cultured on 24 mm diameter of 6-well Corning Transwell® permeable culture inserts with the pore size of 0.40 μm (Cat.No.3450, Corning, NY, USA). The inserts were neither coated nor treated prior to seeding of the cells. Before seeding the cells, inserts were immersed with 1 mL of media in the inner chamber (apical surface) and 2 mL of media in the outer chamber (basolateral side) for 1 h. After removing the media from the inner chamber, 1 mL cell suspension was added at a density of 4.0 × 10⁵ cells per insert and cultured for 24 h in an incubator (5% CO2, 37 °C and maximal relative humidity).
-
Details of the ALI exposure conditions were described previously[17]. In brief, before the Transwell inserts were transferred into the ALI exposure device (HRH-CES1332, Beijing Huironghe Technology CO., LtD., China), BEAS-2B cells in the inserts were washed thrice with phosphate buffer saline (PBS) and then exposed to either clean air composed of 21% oxygen (O2) and 79% nitrogen (N2) (Beijing Oriental Medical Gas Co., Ltd., China) or ME with different dilution ratios. Controlled by circulating water at 37 °C, the ME or clean air was drawn into exposure wells through upper chambers at a flow rate of 25 mL/min/well for 1 h.
-
In order to determine the cellular viability following exposure to either clean air or ME, Cell Counting Kit-8(CCK-8) (purchased from Dojindo Laboratories, Japan) was used for the BEAS-2B cells. This kit uses 2-(2-methoxy-4-nitrophenyl)-3-(4-nitrophenyl)-5-(2,4-disulfophenyl)-2H-tetrazolium, a monosodium salt (WST-8) that is bioreduced by cellular dehydrogenases to an orange formazan product. The assay was done according to manufacturer’s instruction with minor modification. In brief, 1 mL of WST-8 solution (1 mL CCK-8 solution plus 9 mL of the PBS) was added to each inner chamber loading of the BEAS-2B cells after exposure to either clean air or ME. After 30 min of incubation at 37 °C in a 5% CO2 incubator, the optical density at 450 nm was determined for each well. Results were expressed as cell relative viability percentage (CRV%).
-
BMD and BMDL were performed using the Benchmark Dose Software (BMDS) (Version 2.6.0.1, Build 88, 6/25/2015, Environmental Protection Agency, USA). In this study, we obtained the mean of number concentration (NC), surface area concentration (SAC), and mass concentration (MC) as the dose variable; mean of CRV in BEAS-2B cells as the effect biomarker. We then tested these variables using different models, including the Hill, Linear, Polynomial, and Power model. The confidence interval (CI) level was 95%. Based on Benchmark Dose Technical Guidance, the most fitted model would provide a global goodness-of-fit measure adjudged using P-value. Small P-values indicated that the goodness-of-fit was unlikely to be achieved. Therefore, the model was poorly fitted for the data. When the P-values were higher than 0.05, model fit was considered satisfactory[33]. According to the best -fitted model, BMD or BMDL value was calculated automatically with an Akaike Information Coefficient (AIC) and P-value, which can be seen at the end of the reported text.
-
Data were presented as mean ± SD and differences between groups were determined by one-way ANOVA with post hoc comparisons by the Games-Howell test. Chi-square test was used to analyze the Linear-by-Linear Association. All statistical tests were two-tailed and P-values less than 0.05 were considered significant.
-
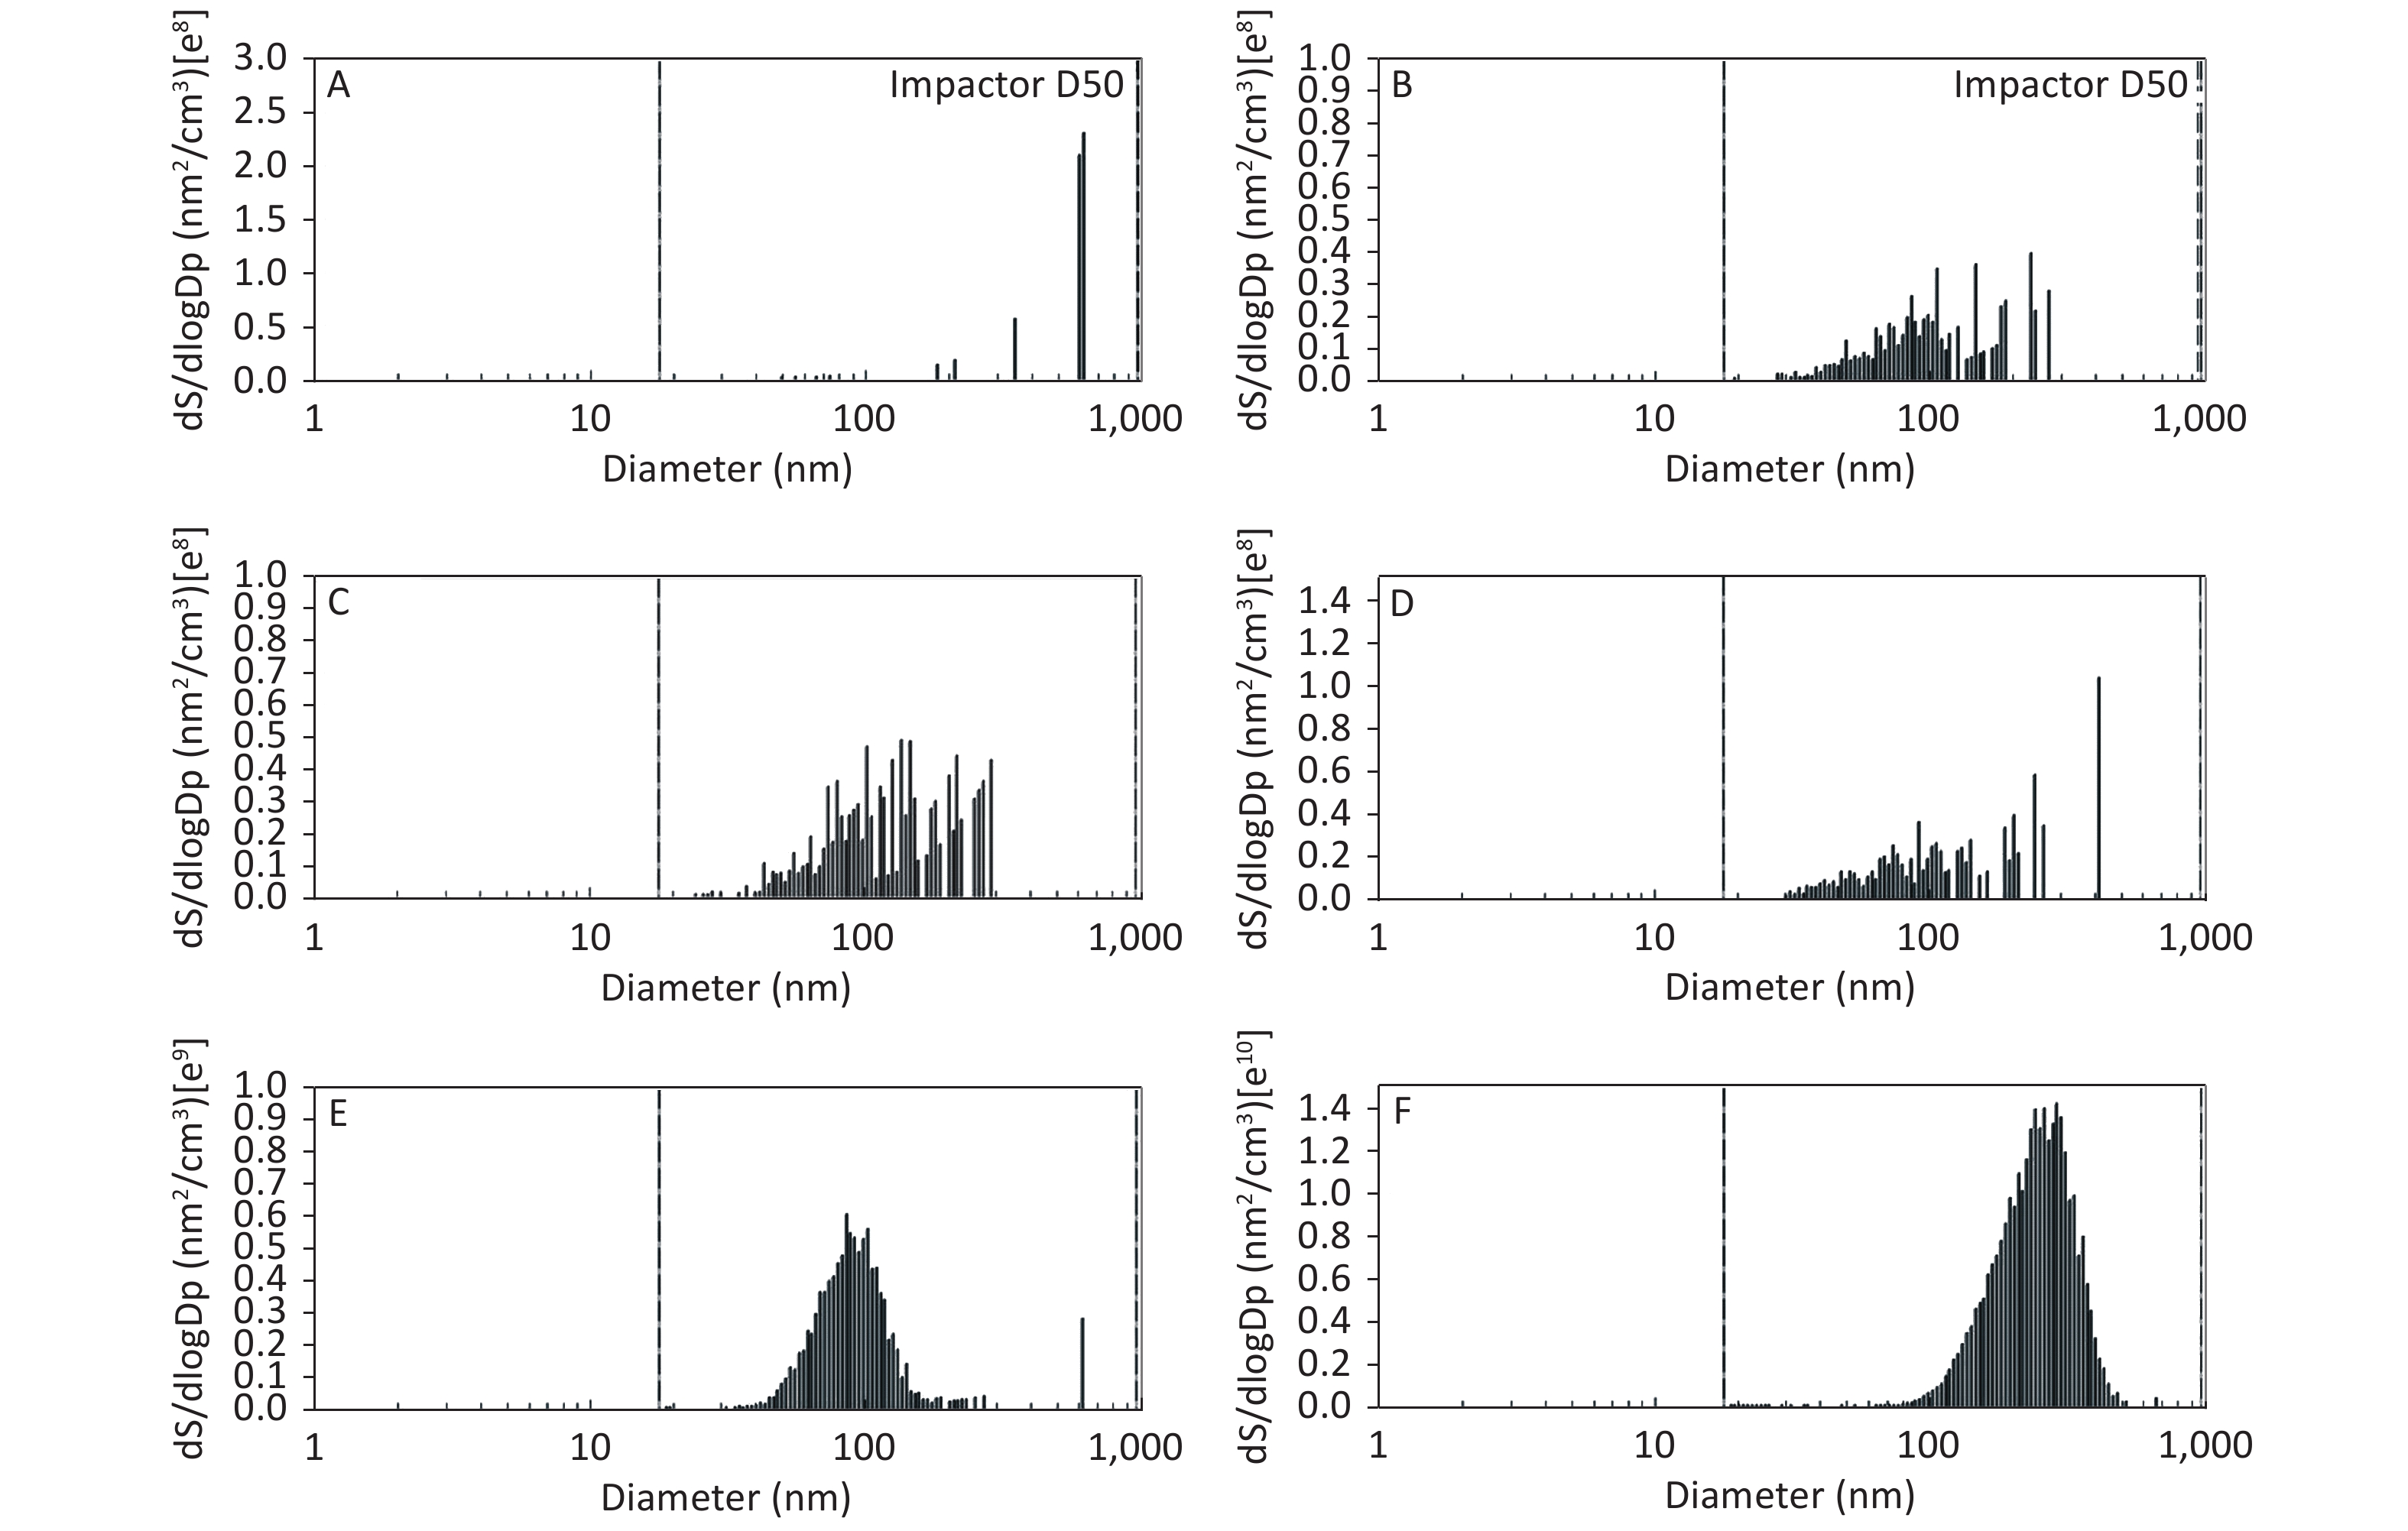
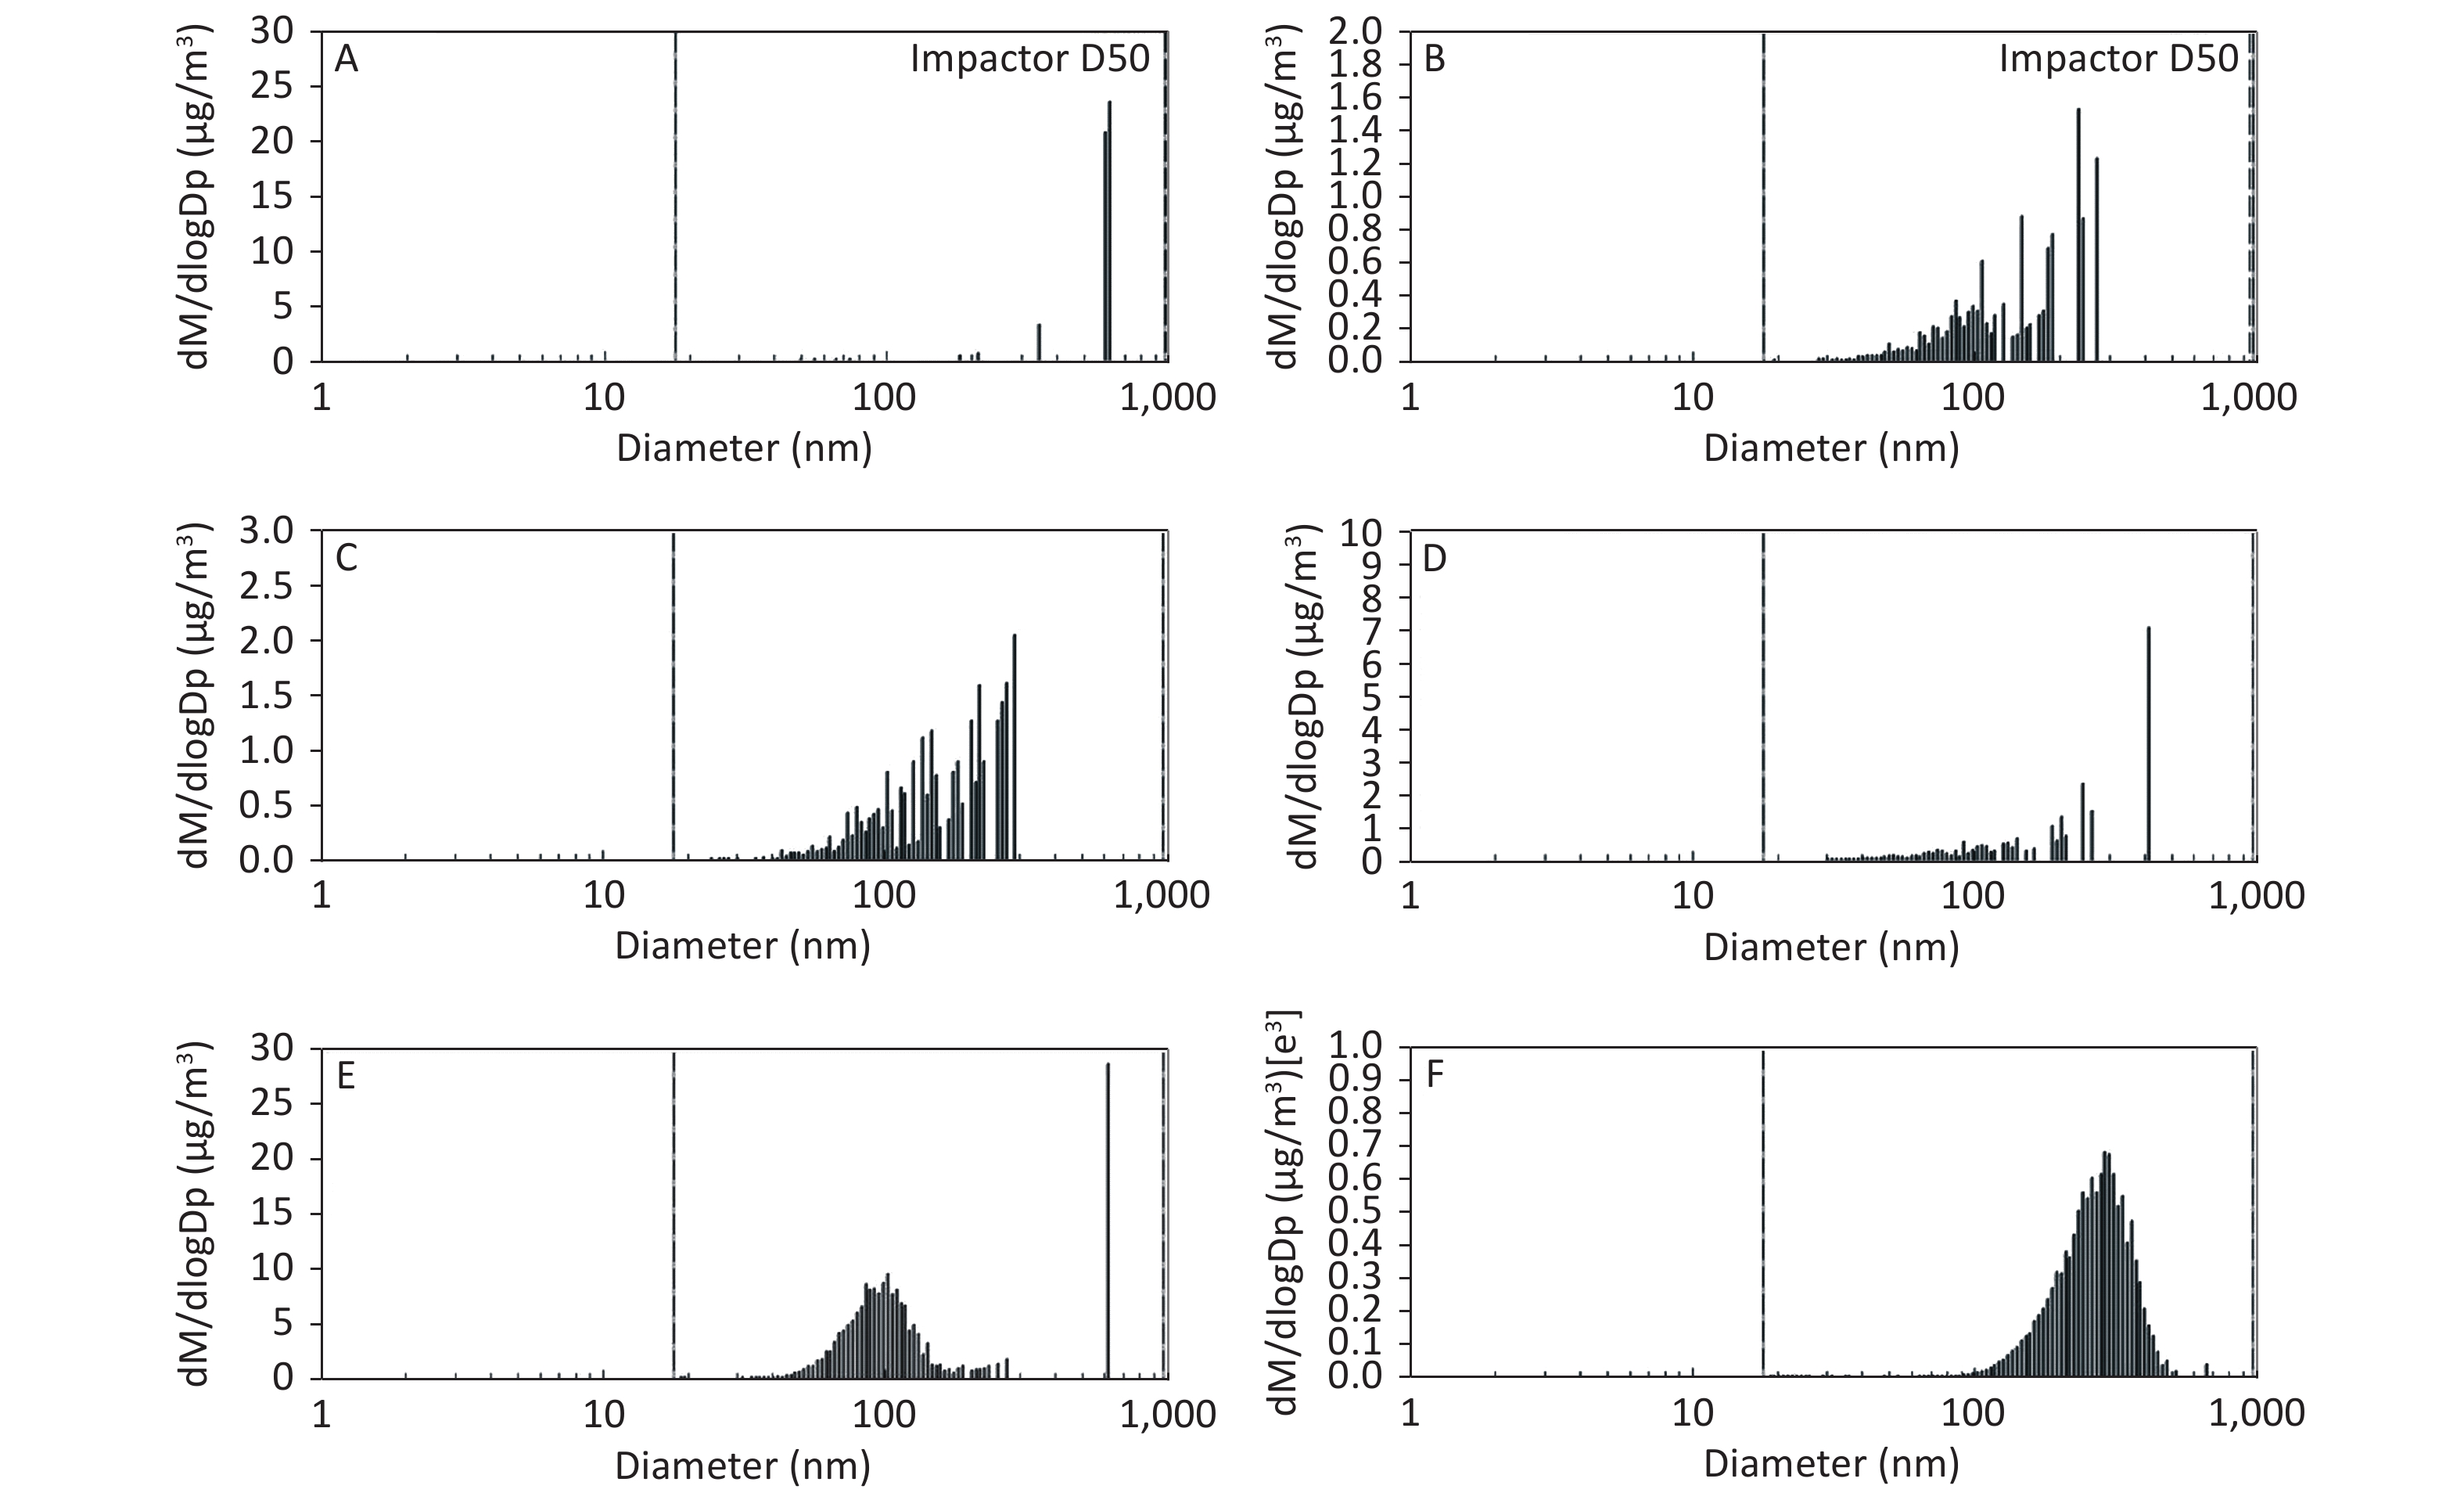
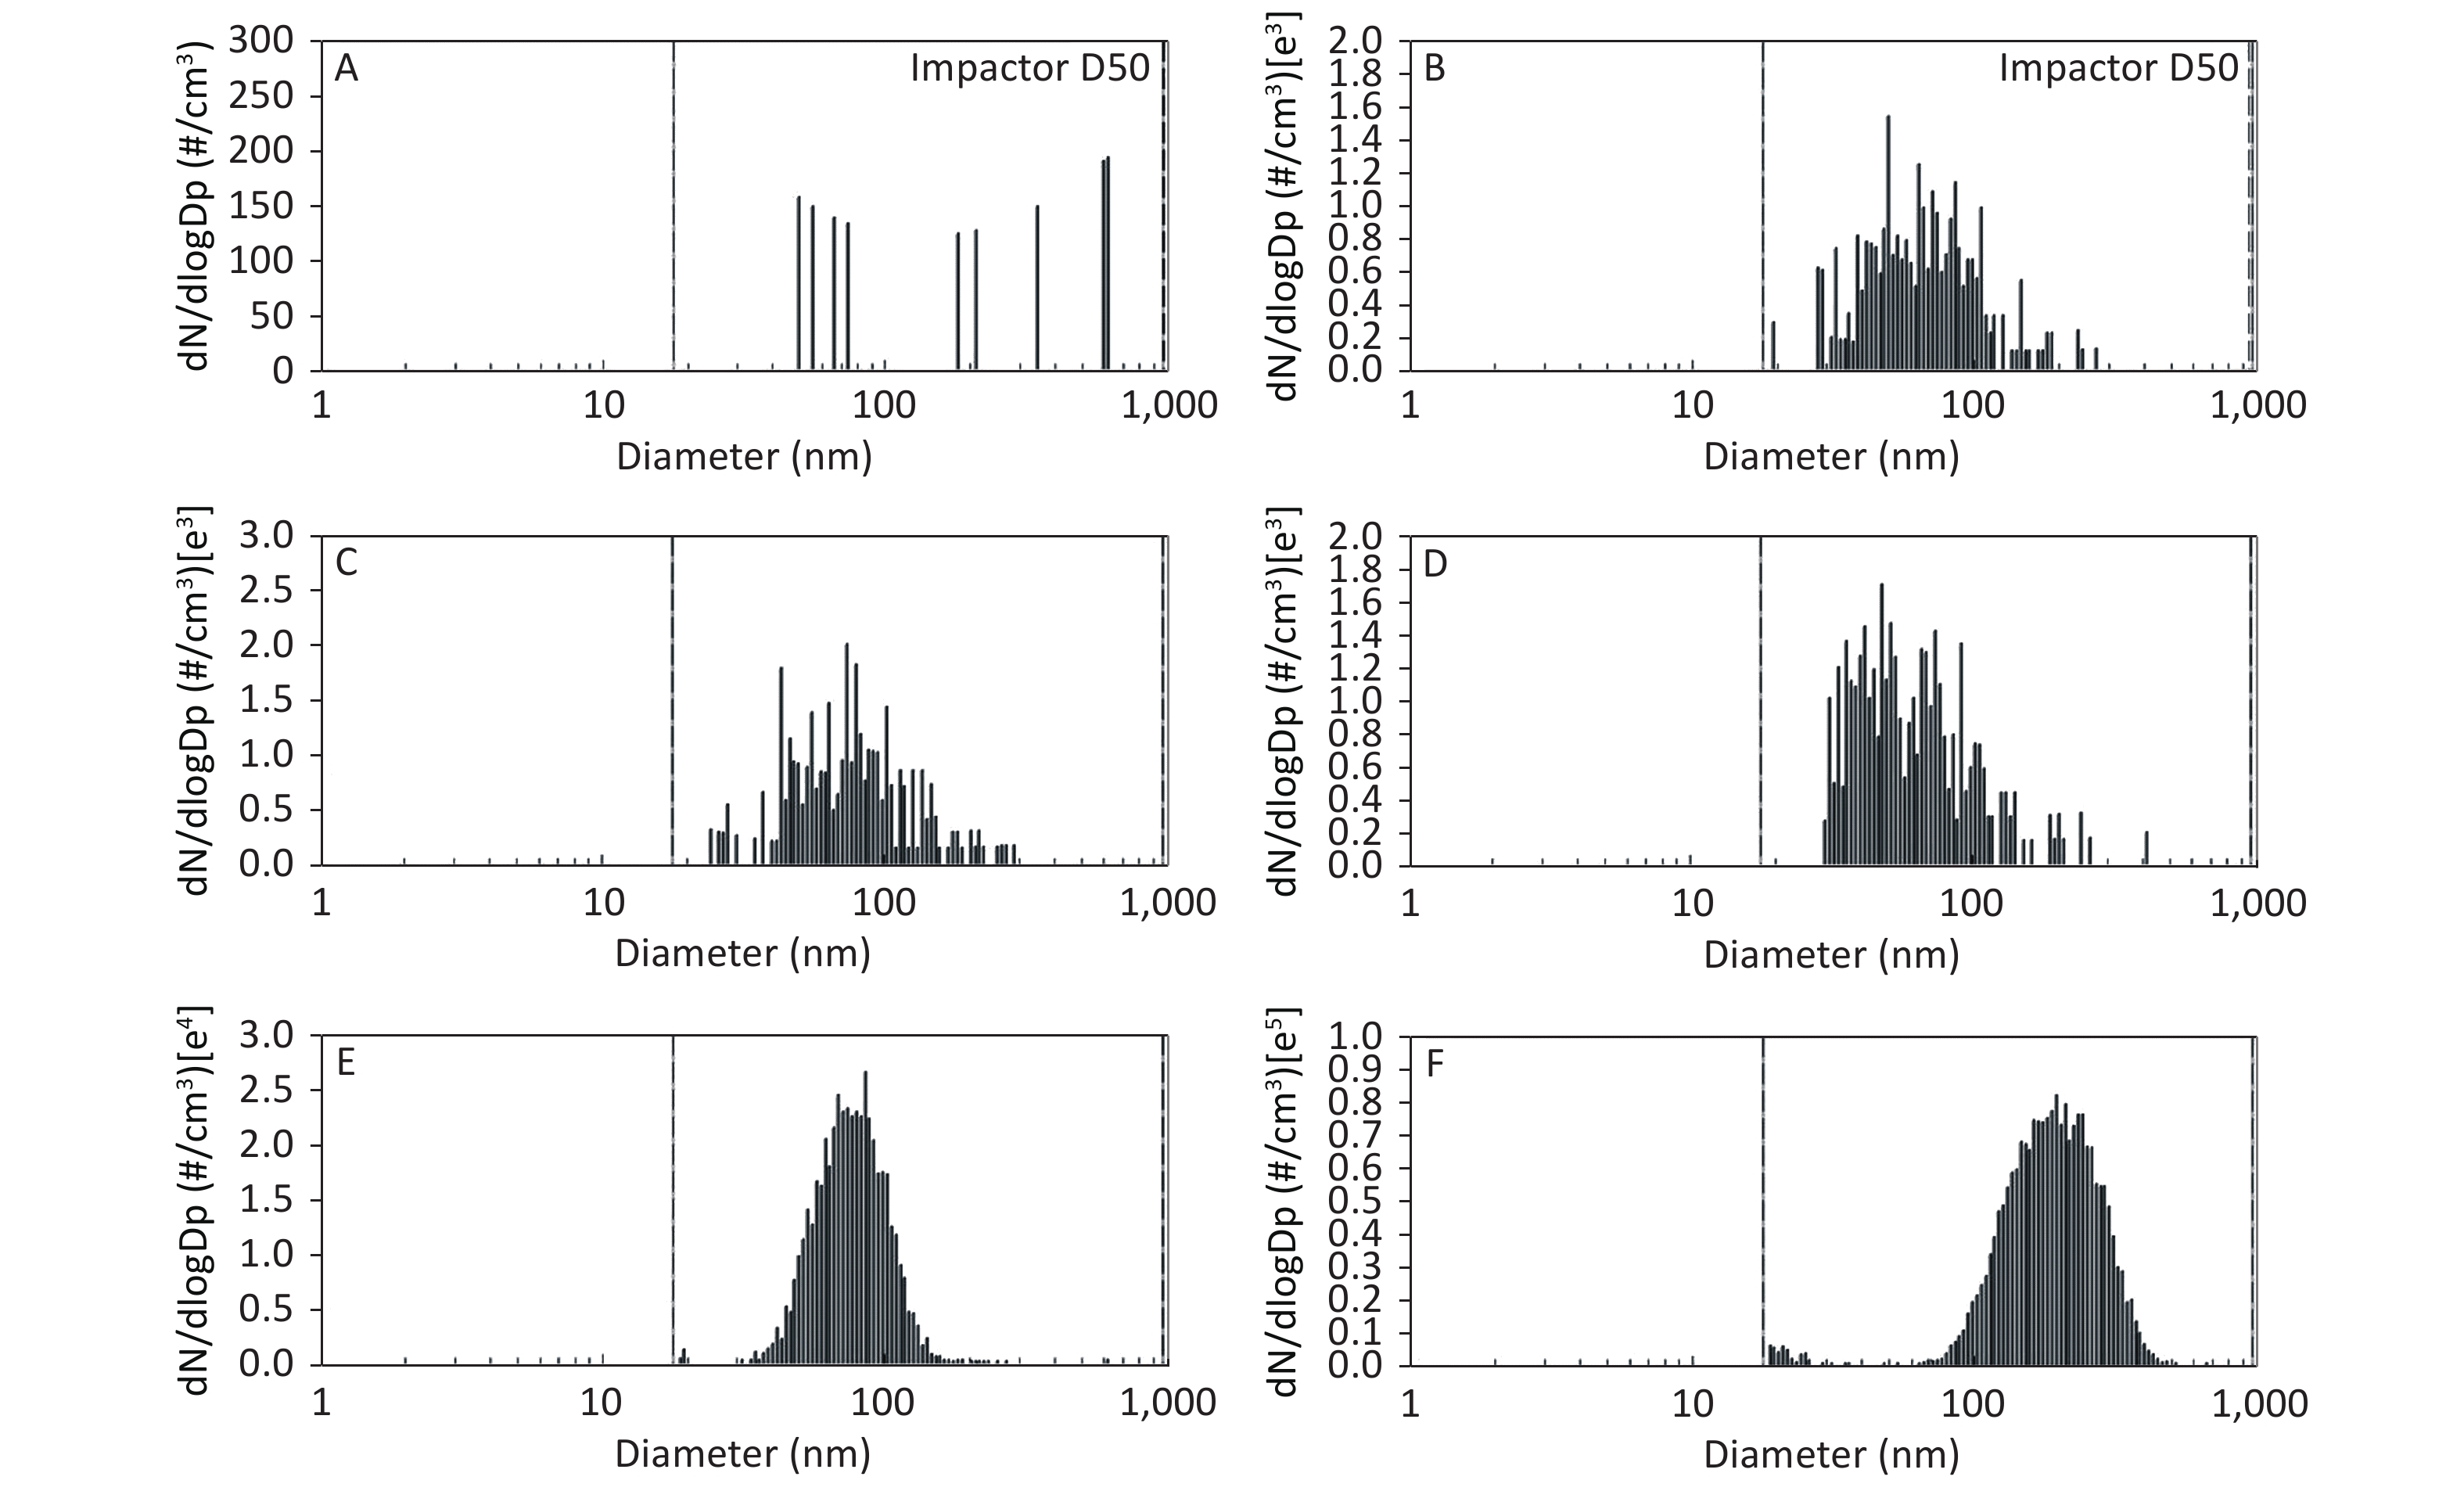
As shown in Figure 1, Figure 2, and Figure 3, the diameter of PM in the ME was less than 1 μm. The peak value occurred at a diameter less than 100 nm for the diluted ME; whereas, the non-dilution ME had a diameter larger than 100 nm.
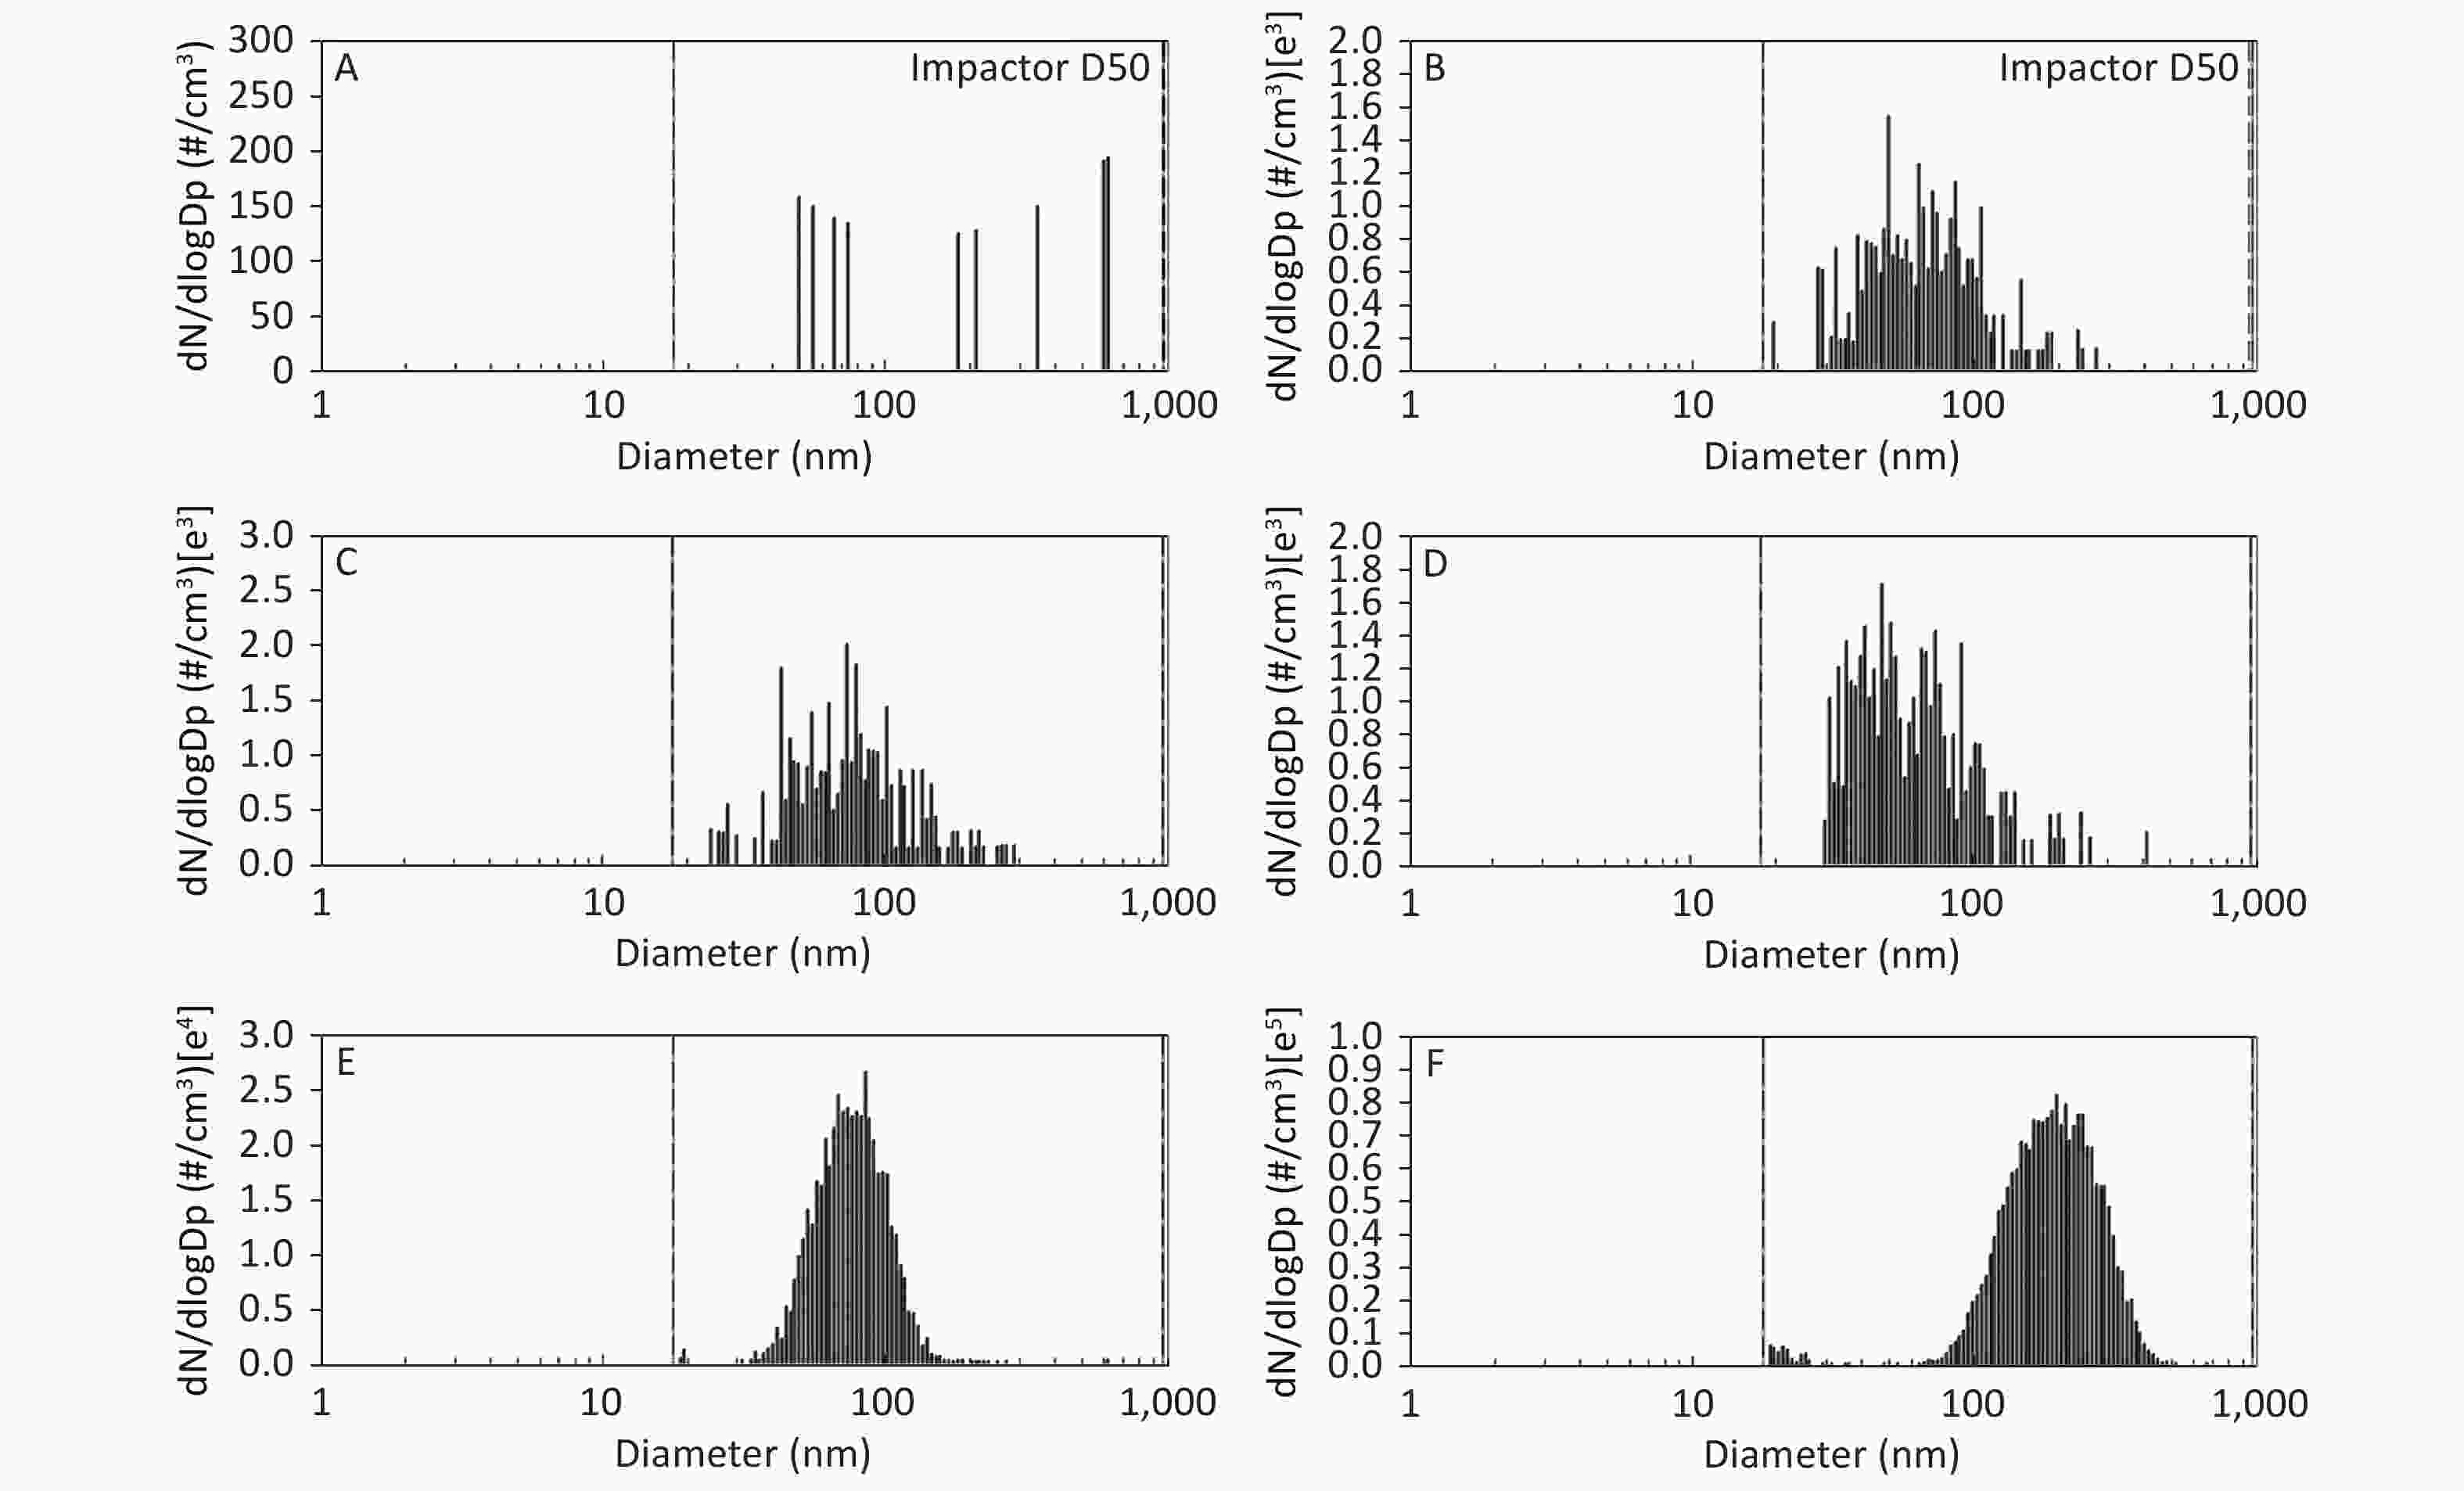
Figure 1. Motorcycle exhausts particle size distribution with respect to number concentration in different diluted ME. The x-axis is the particle size of the particulate matter (nm). The y-axis is the number concentration in all diameters of PM in the ME: (A) Clean air; (B) 1:20 diluted ME; (C) 1:10 diluted ME; (D) 1:5 diluted ME; (E) 1:2 diluted ME; and (F) Non-diluted ME.
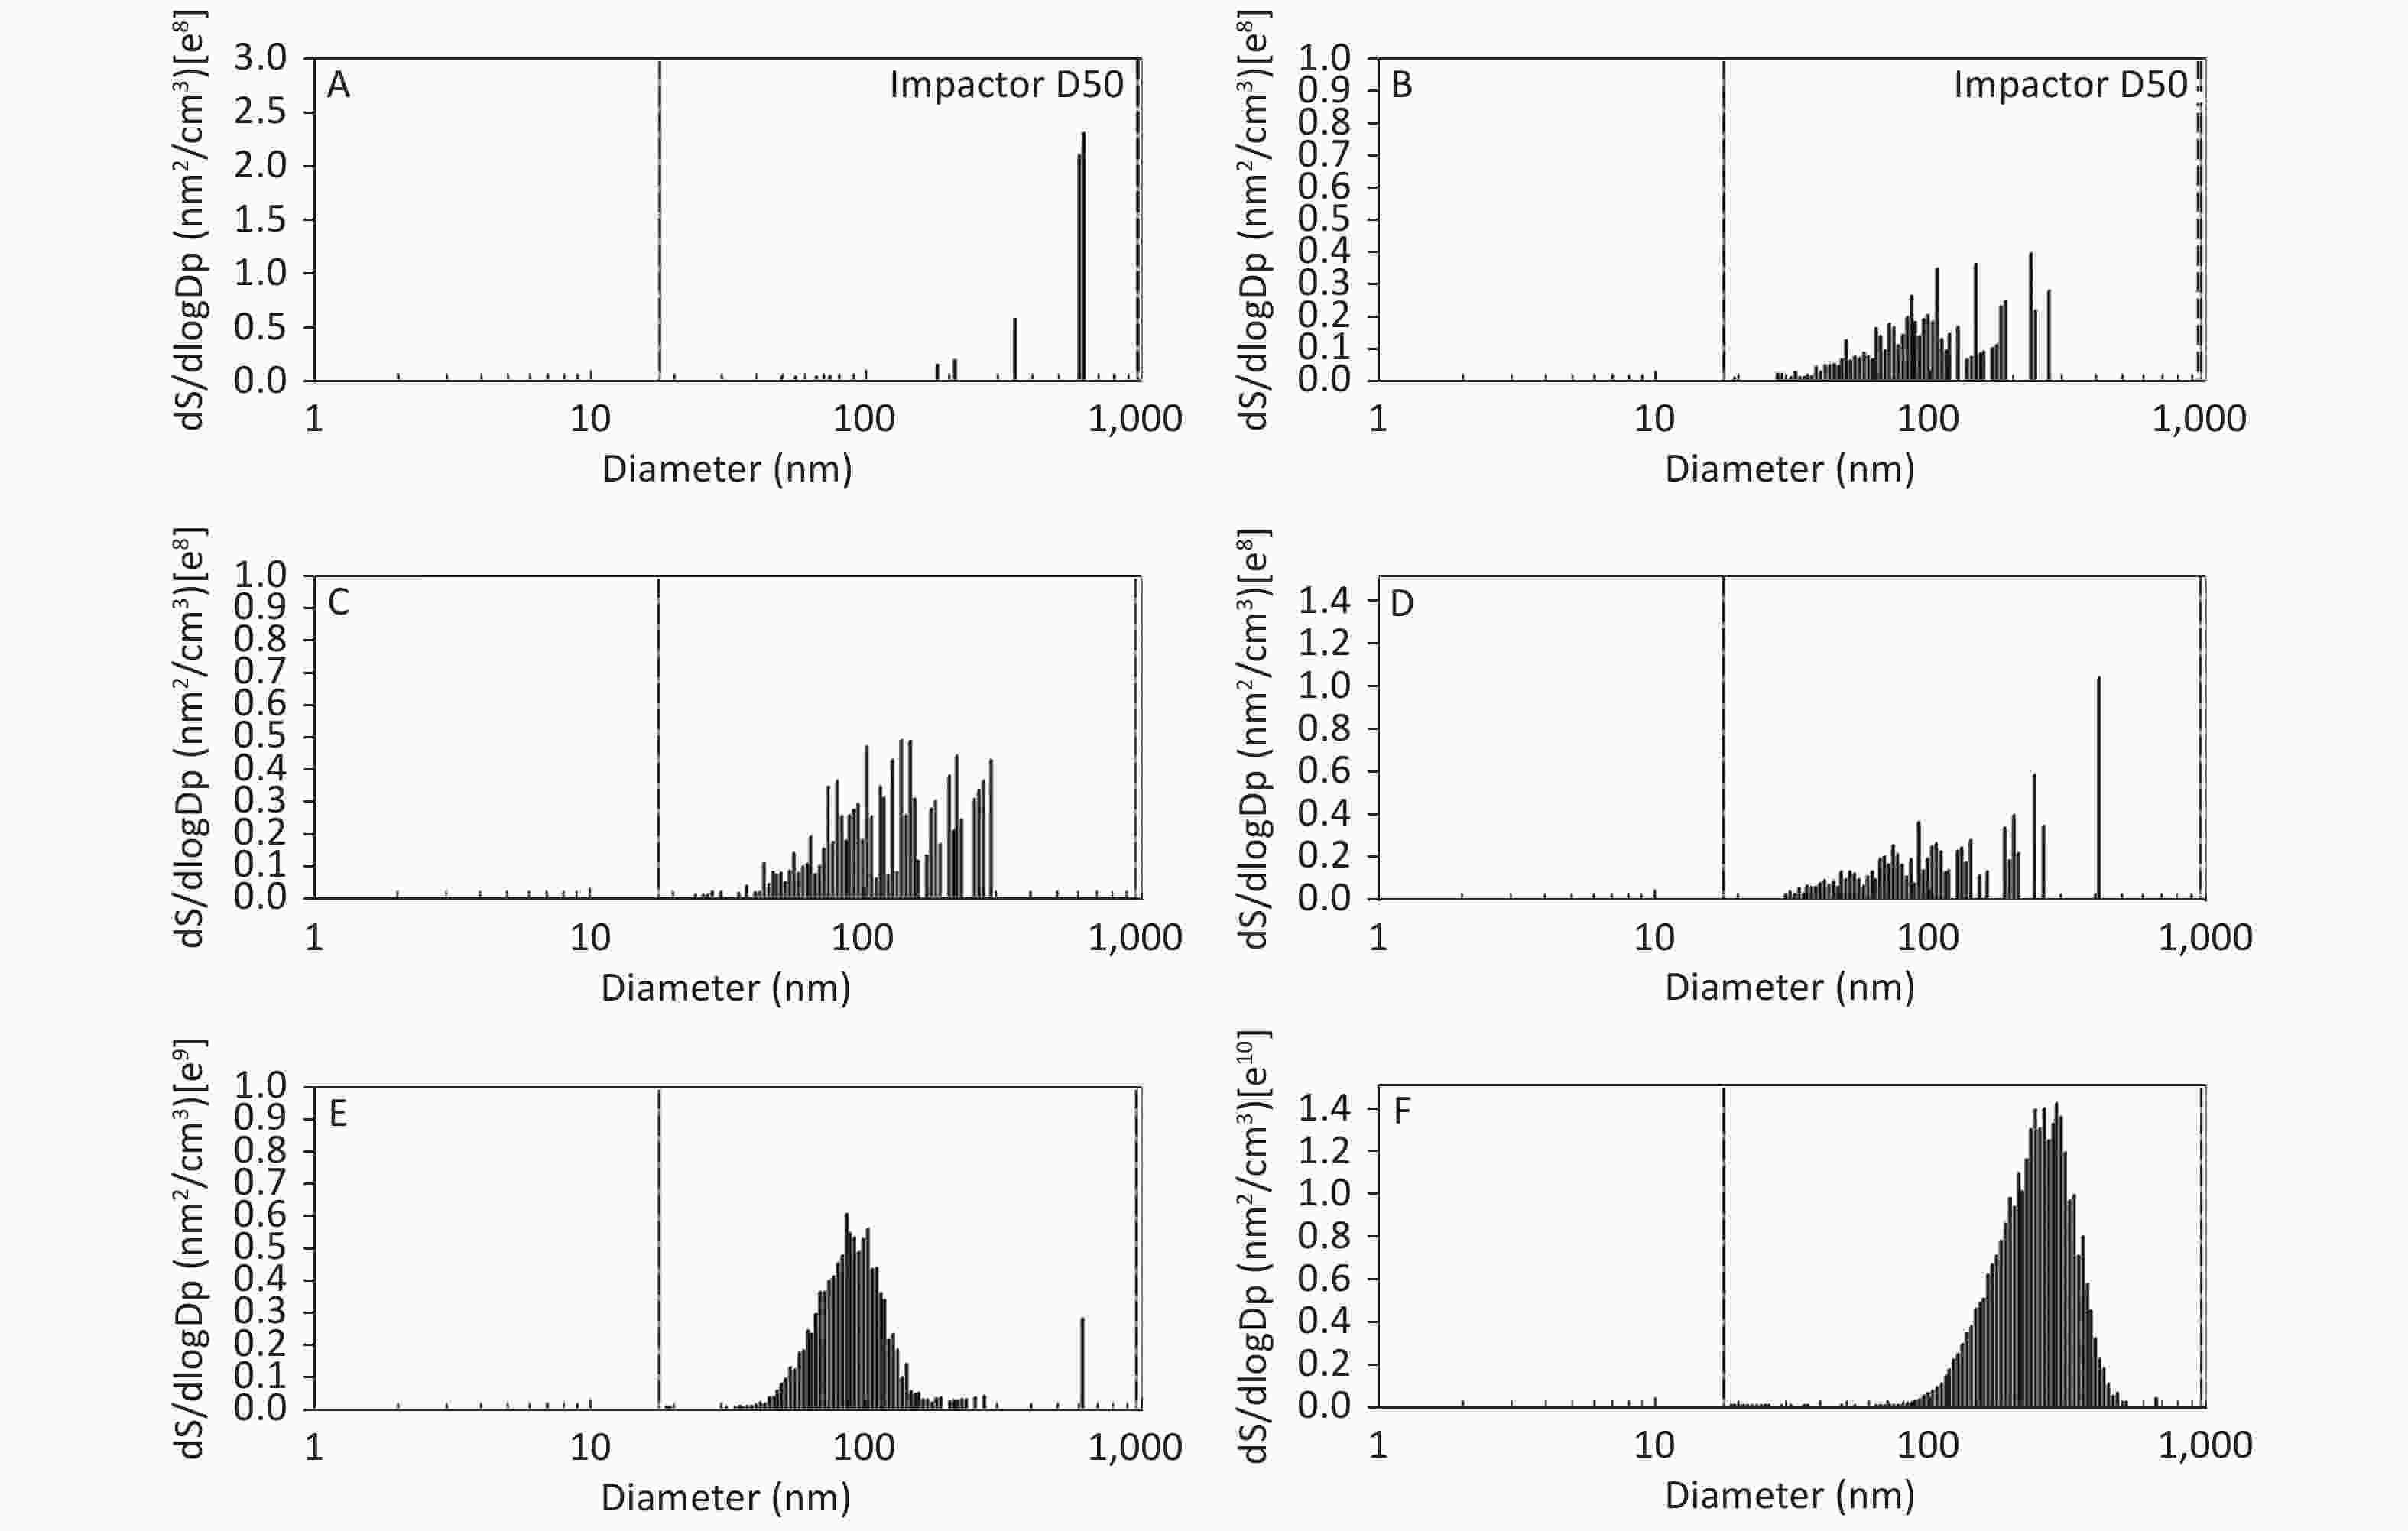
Figure 2. Motorcycle exhausts particle size distribution with respect to surface area concentration in different dilution ME. The x-axis is the particle size of the particulate matter (nm). The y-axis is the surface area concentration in all diameters of PM in the ME: (A) Clean air; (B) 1:20 diluted ME; (C) 1:10 diluted ME; (D) 1:5 diluted ME; (E) 1:2 diluted ME; and (F) Non-diluted ME.
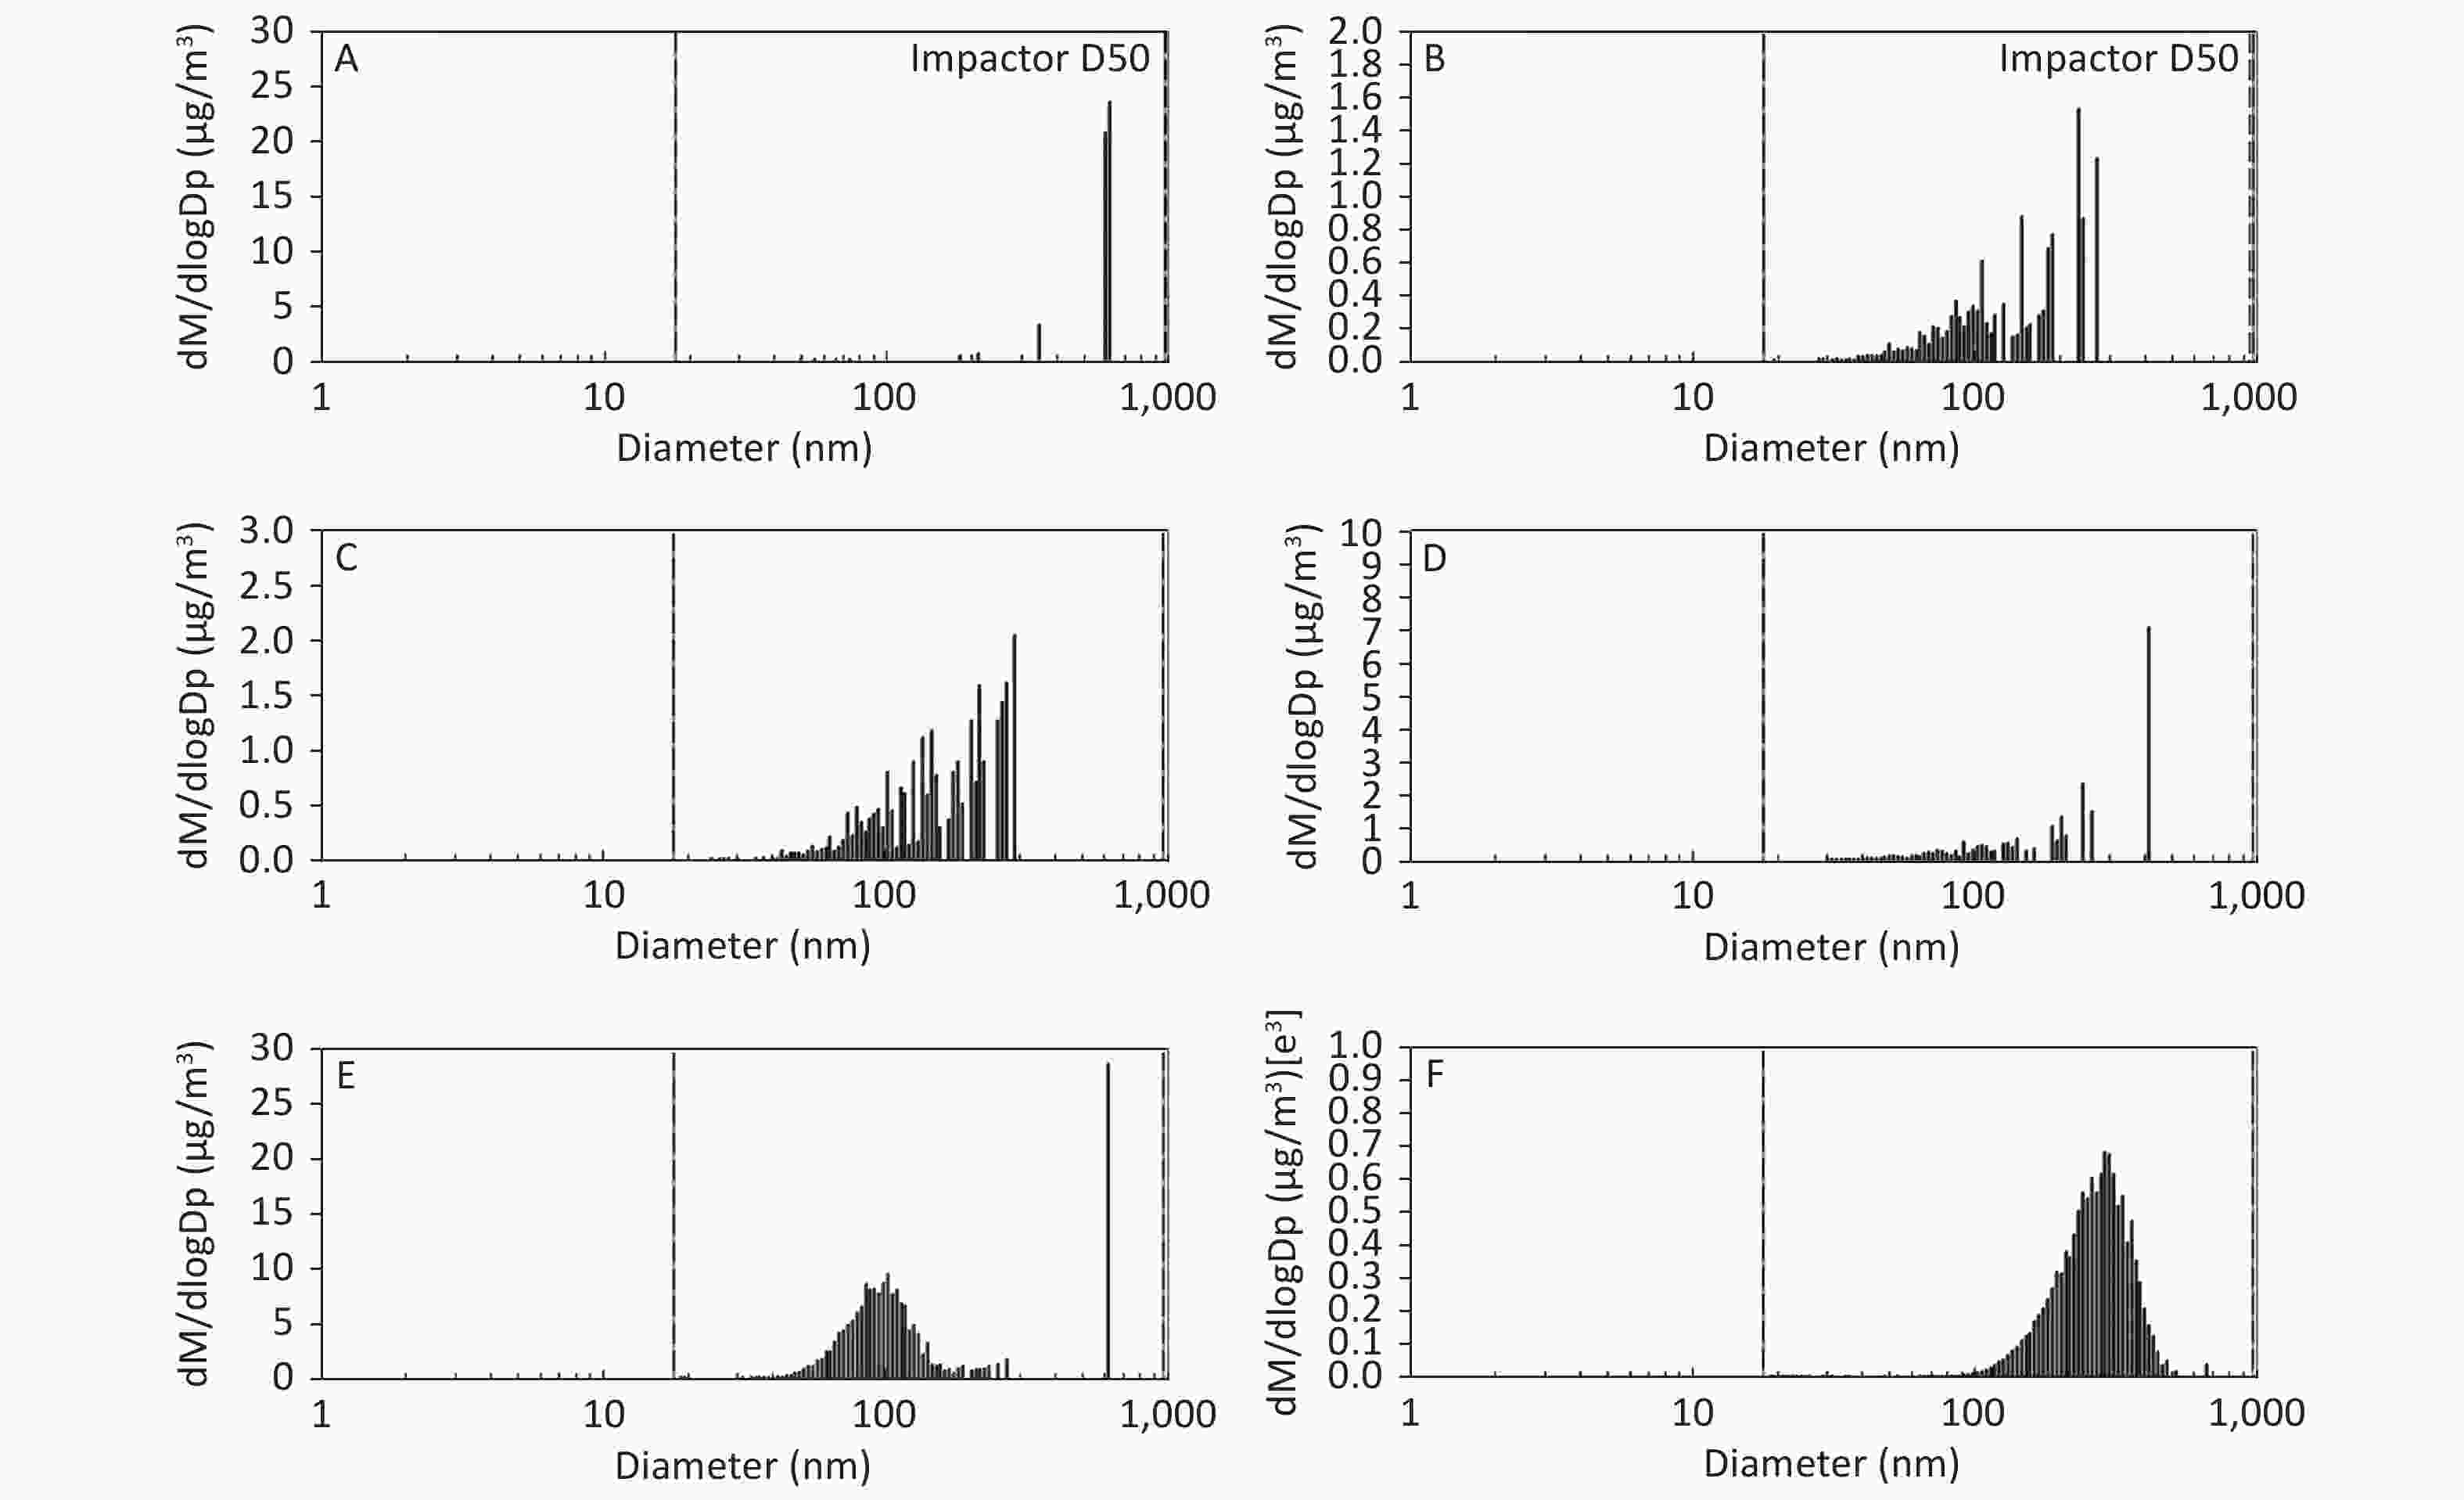
Figure 3. Motorcycle exhausts particle size distribution with respect to mass concentration in different dilution ME. The x-axis is the particle size of the particulate matter (nm). The y-axis is the mass concentration in all diameters of PM in the ME: (A) Clean air; (B) 1:20 diluted ME; (C) 1:10 diluted ME; (D) 1:5 diluted ME; (E) 1:2 diluted ME; and (F) Non-diluted ME.
The number, surface area, and MC of PM in the ME are shown in Table 1. There was a favorable decreased linear relationship between the NC of MEPs and dilution ratio. The same relationship was also observed between the SAC and MC of the MEPs (all P ≤ 0.001). Compared with the clean air group, the NC in the 1:20, 1:10, 1:5, and 1:2 diluted ME groups as well as in the non-diluted ME group were 13.8, 19.1, 22.4, 286.0, and 1237.0 times higher than that of the clean air group, respectively. The SAC in the 1:2 diluted ME and non-diluted ME groups were higher than those in the clean air group and 1:20, 1:10, and 1:5 diluted groups (P < 0.05). For MC, the 1:20 and 1:2 diluted and non-diluted ME groups were significantly higher when compared with the clean air group and the non-diluted ME group was also higher than those in the 1:20, 1:10, 1:5, and 1:2 diluted ME group (P < 0.001). Therefore, the number, surface area, and MC of PM in the ME were gradually reduced with increase in the dilution.
Groups Number concentration
(#/cm3)Surface area concentration
(× 107nm2/cm3)Mass concentration
(μg/m3)Clean air 27 ± 8 0.74 ± 0.60 0.07 ± 0.06 1:20 diluted ME 373 ± 60* 1.01 ± 0.10 0.28 ± 0.07* 1:10 diluted ME 517 ± 47* 1.81 ± 0.66 0.88 ± 0.96 1:5 diluted ME 606 ± 15*# 2.23 ± 0.65 1.72 ± 0.95 1:2 diluted ME 7,723 ± 48*#△▲ 16.57 ± 0.22*#△▲ 2.78 ± 0.16*# non-diluted ME 33,400 ± 883*#△▲□ 462.75 ± 13.12*#△▲□ 192.32 ± 6.27*#△▲□ Linear-by-Linear Association x2 = 13.438 x2 = 10.412 x2 = 10.130 P-value < 0.001 0.001 0.001 Note. The particle size of scanning ranges from 18.1–947.5 nm; Data represent Mean ± SD, n = 5/group.
*P < 0.05, as compared with the clean air group. #P < 0.05, as compared with the 1:20 diluted ME. △P < 0.001, as compared with the 1:10 diluted ME. ▲P < 0.001, as compared with the 1:5 diluted ME. □P < 0.001, as compared with the 1:2 diluted ME.Table 1. Number, surface area, and mass concentrations characterization of motorcycle exhausts particle in different diluted ME groups
To investigate the concentration of the MEPs with diameter ≤ 100 nm and > 100 nm, we selected NC as a variable and analyzed the NC of MEPs with diameter ≤ 100 nm or > 100 nm in different diluted ME groups. Results show that most of the PMs were smaller than 0.1 μm according to NC in the diluted groups (Table 2). The NC of MEPs with diameter ≤ 100 nm were 3.7, 3.1, 5.5, and 5.2 times higher than those with diameter > 100 nm in 1:20, 1:10, 1:5, and 1:2 diluted ME groups, respectively. But for the non-diluted ME, NC of the PM with diameter ≤ 100 nm was less than that with diameter > 100 nm (Table 2). These results indicate that dilution will greatly affect the particle size.
Groups Number concentration (#/cm3) P-value* Diameter ≤ 100 nm Diameter > 100 nm Clean air 14 ± 8 13 ± 5 0.944 1:20 diluted ME 294 ± 61 79 ± 13 0.007 1:10 diluted ME 392 ± 28 125 ± 20 < 0.001 1:5 diluted ME 513 ± 19 93 ± 13 < 0.001 1:2 diluted ME 6,490 ± 36 1,232 ± 39 < 0.001 non- diluted ME 1,877 ± 56 31,550 ± 858 < 0.001 Note. Data represent Mean ± SD, n = 5/group. *Compared between MEPs with diameter ≤ 100 nm and MEPs with diameter > 100 nm. Table 2. Number concentration of the MEPs with the diameter ≤ 100 nm and > 100 nm
-
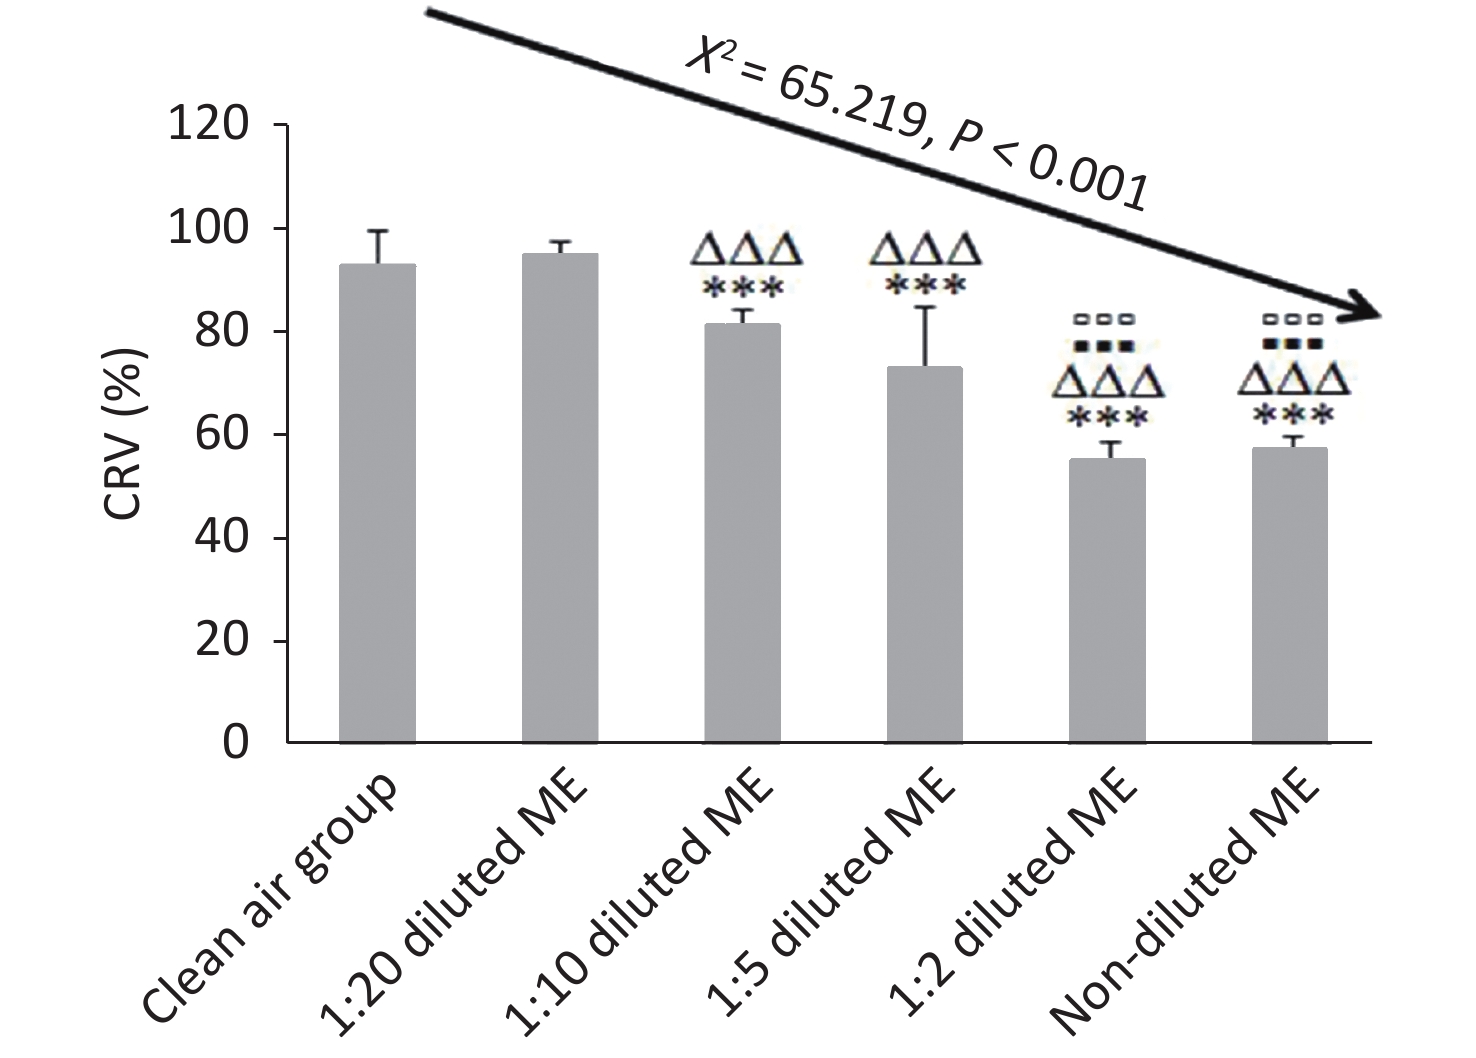
CRV% of the clean air group and 1:20 diluted ME group were higher than 90%; while CRV% of 1:10, 1:5, 1:2 diluted ME group and non-diluted ME group were reduced by about 14%, 23%, 42%, and 40% compared to that of 1:20 group, respectively (P < 0.001) (Figure 4). Compared to 1:10 and 1:5 diluted ME groups, both the 1:2 diluted and non-diluted ME group had a decreased CRV (P < 0.001). When comparing the CRV% between 1:2 diluted and non-diluted ME groups, there was no significant reduction (P > 0.05; Figure 4). These results indicate that the low concentration of ME exposure had a good dilution-dependent decrease of CRV in the BEAS-2B cells, with CRV more than 60%. However, at high concentration (1:2 diluted and non-diluted ME), CRV was less than 60%.
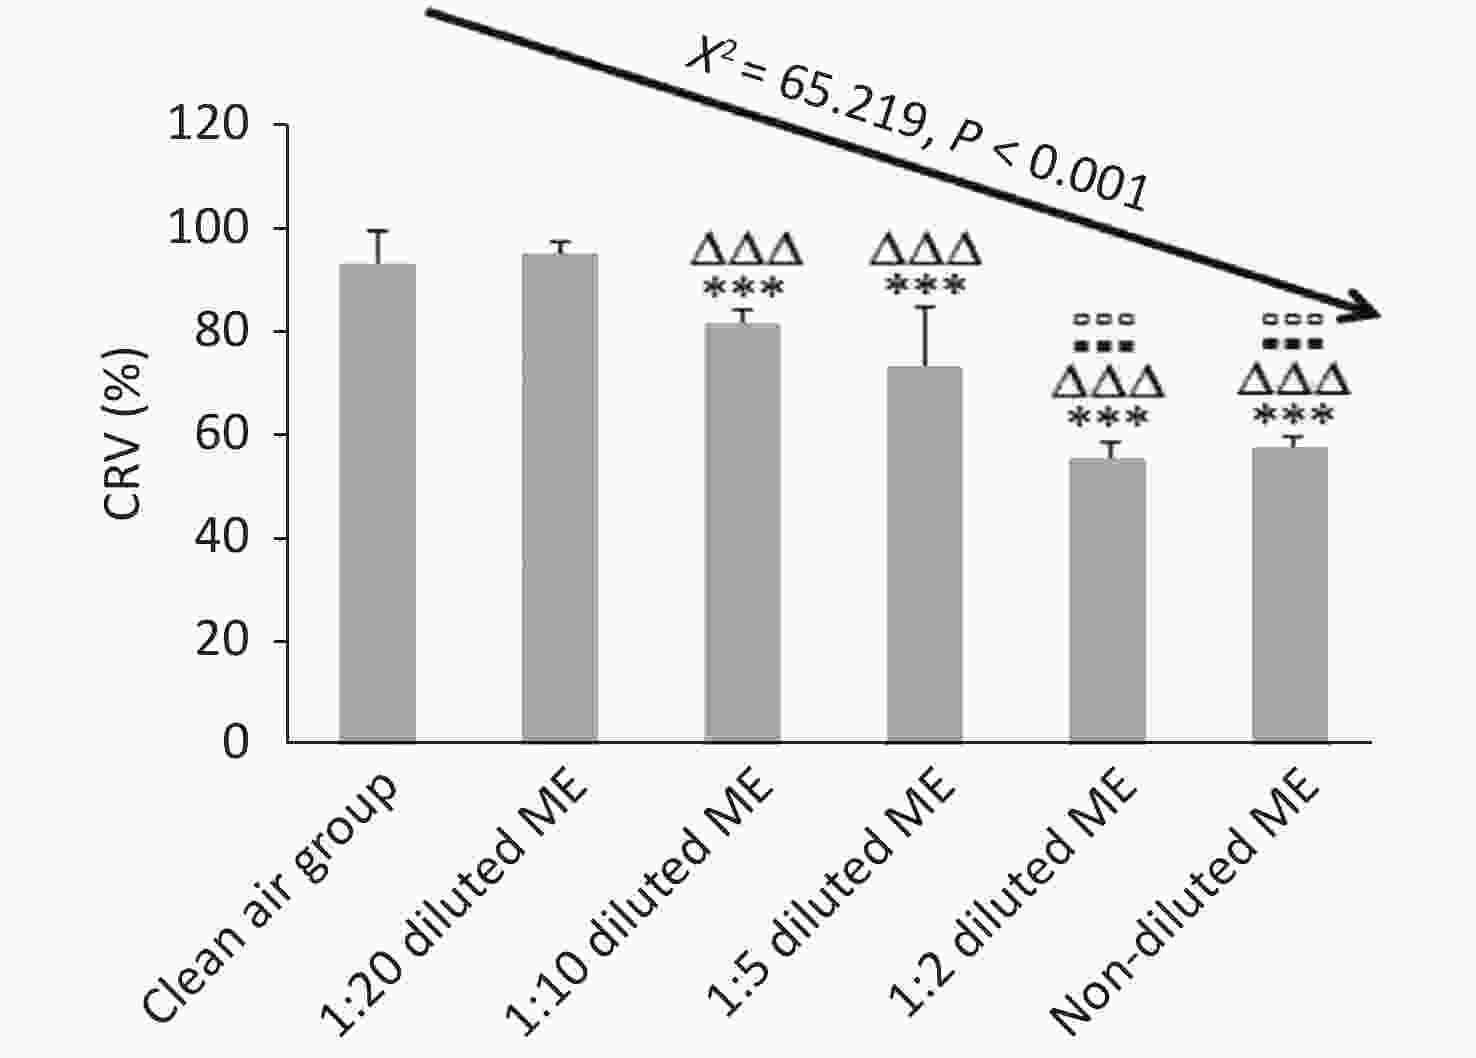
Figure 4. Dose-dependent cytotoxicity of BEAS-2B cells induced by ME using CCK-8 assay. Data represent Mean ± SD, n = 3/group. ***P < 0.001, as compared with group exposed to clean air; ∆∆∆P < 0.001, as compared with 1:20 diluted ME; ▪▪▪P < 0.001, as compared with 1:10 diluted ME; ▫▫▫P < 0.001, as compared with 1:5 diluted ME.
-
Based on the four models (including Hill, Linear, Polynomial and Power in the BMDS), the AIC, P-value, BMD, and BMDL (the 95% CI limit of BMD) were calculated automatically and presented in Table 3. According to the P-value (> 0.05) and minimal AIC, the best-fitting models for the NC, SAC and MC were Hill, Hill, and Polynomial models, respectively. The BMD of NC, SAC, and MC that induced the decrease of CRV were 450.6#/cm3, 1.449 × 10⁷ nm2/cm3, and 0.369 μg/m3, respectively. The best-fitting model showed that BMDL of particulates in ME for the CRV of BEAS-2B cell via ALI exposure were as follows: 364.2#/cm3 for NC; 0.662 × 10⁷ nm2/cm3 for SAC; and 0.278 μg/m3 for MC; respectively (Table 3).
Model name BMD BMDL AIC P-value Number concentration (#/cm3) Hill 450.6 364.2 87.88 0.5031 Linear 14339.8 9314.5 115.35 < 0.0001 Polynomial 1605.6 1130.1 102.39 0.0005 Power 14339.8 9314.5 115.35 < 0.0001 Surface area concentration (× 107 nm2/cm3) Hill 1.449 0.662 87.41 0.6348 Linear 278.125 164.574 119.21 < 0.0001 Polynomial 3.694 2.654 101.31 0.0008 Power 278.125 164.574 119.21 < 0.0001 Mass concentration (μg/m3) Hill 0.709 0.397 92.67 0.0458 Linear 119.907 70.14 119.53 < 0.0001 Polynomial 0.369 0.278 86.91 0.4914 Power 119.907 70.14 119.53 < 0.0001 Note. AIC: Akaike information coefficient. Table 3. BMD and BMDL for the decrease of CRV in BEAS-2B cells in terms of number, surface area and mass concentration calculated by different models
-
The main objective of this study was to estimate the benchmark dose in BEAS-2B cells by evaluating CRV in terms of NC, SAC and MC of particulates in motorcycle exhaust via the air–liquid interface exposure. Our results reveal that: 1) diameter of the MEPs was smaller than 1 μm and MEPs with diameter ≤ 100 nm accounts for MEPs in most of the diluted ME groups; 2) there was a significant relationship between NC, SAC, and MC in the MEPs with different dilution ratios; 3) the four models including Hill, Linear, Polynomial, and Power in the BMDS show that MEPs can induce a significant dose-dependent effect in BEAS-2B cells along with increasing dose of MEPs, based on NC, SAC, and MC; and 4) according to the best-fitting model, the BMDL, by evaluating the CRV with particulates in ME, were 364.2#/cm3 for NC, 0.662 × 10⁷ nm2/cm3 for SAC, and 0.278 μg/m3 for MC, respectively. So far, this is the first report evaluating the BMD and BMDL, as well as the dose-dependent cytotoxicity effect induced by MEPs using the unique ALI exposure system in vitro. In addition, our findings also indicate that the NC, SAC, and MC measured by SMPS may serve as the parameter to evaluate the exposure dose of MEPs.
ME is a complex multi-component mixture and an important pollutant that originates from anthropogenic sources. MEPs are considered as submicron particles, whose diameter is below 1 μm and are among the inhalable particles according to the particle classification[34]. Smaller particles can penetrate deeper into the lungs, irritate the respiratory system, and then cause a range of adverse health effects in the lungs. Particles less than 0.1 μm can be transported from the lungs directly into the bloodstream, potentially causing circulatory problems[35, 36]. In this study, characterization of particulate concentrations of diluted ME revealed that most of the MEPs were less than 0.1 μm. As a result, they could potentially increase the risk of respiratory illnesses and circulatory issues. Therefore, people need to pay more attention to its toxicity. However, it is important to ascertain the dose that is capable of causing human diseases in future studies.
The number, surface area, and mass concentrations were the most commonly used parameters for the characterization of PM[37-39]. In this work, characteristics of the MEPs were determined using SMPS-3938 and parameters such as number, surface area, and mass concentrations were included. With the increase in ME dilution ratio, NC, SAC, and MC of the MEPs were significantly decreased, especially for NC. Our results reveal that NC seemed to have a better dose-dependent relationship with dilution ratios of the ME. Therefore, NC may serve as a more suitable parameter to evaluate the characteristics of fine particles. More interestingly, our data also revealed that NC of the MEPs, whether with diameter ≤ 100 nm or diameter > 100 nm, had a decreased trend with the dilution ratio of ME from 1:20 to 1:2. However, the NC of MEPs with diameter > 100 nm was higher than that of the MEPs with diameter ≤ 100 nm in the non-diluted ME. These data suggest that when the vehicle emission is discharged, the particles are concentrated and then discharged into the air. This process could increase the particle size of the PM and then reduce the number of inhalable particles that can penetrate the lung barrier and ultimately reduce the risk of these particles acting on the respiratory system. Therefore, these results can provide some clues for the formulation of control measures to automobile exhaust particulate matter, in the sense that generation of fine PM can be reduced in automobile exhaust by reducing the chance of PM being diluted.
Similar to other aerosol, exposure to ME can reduce cell viability. Cytotoxic effects to human health are strongly associated with size of the emitted PM as well as their routes of exposure. Most of the previous cell-based studies on MEPs exposure are submerged cell culture[14]. As a newly developed inhalation exposure system, ALI system is now used to study whole ME (including MEPs and other gas component) exposure-induced lung cells cytotoxicity[17]. The current study applied this unique ALI exposure system in vitro and it was found that the CRV of BEAS-2B cells was increased with decreased dilution-dependent concentration of MEPs. This study is the first to assess the dose-dependent effect in the bronchial epithelial cells through direct exposure (ALI) to multi-concentration diluted MEPs.
The BMD method has been widely used to assess the health risk of environmental pollutants[40-48]. When evaluating the toxic effects of chemical hazards, quantitative dose-response relationships are developed for those hazards through evaluation of mathematical models with available data using curve-fitting techniques. BMDS has been found to be a useful tool to evaluate dose-response relationships in environmental hazards data through inhalation exposure[49-55]. When using CRV as the effect biomarker and the concentration of MEPs including NC, SAC and MC as the exposure doses, there was a significant dose-response relationship between the effect and exposure doses. The BMDL of MEPs-induced decreased of CRV was 364.2#/cm3 for NC, 0.662 × 10⁷ nm2/cm3 for SAC, and 0.278 μg/m3 for MC. To the best our knowledge, no study has proposed the biological exposure index for ME so far. Therefore, these results provide a solid basic knowledge to understand MEPs exposure-induced cytotoxicity through the ALI exposure system in vitro; and to assess the potential threshold for regulating MEPs levels in a lung cell model.
-
In summary, we clearly demonstrate that diluted MEPs are mainly composed of particulates with diameter ≤ 100 nm and that NC, SAC, and MC of MEPs appears to have a strong association with the dilution ratios, especially for NC. Our findings further suggest that CRV of BEAS-2B cells decreases with the increase of MEPs concentrations in a significant dose-dependent manner. According to the best-fitting model, the cytotoxicity BMDL (one-sided 95% lower confidence) of MEPs was calculated for the first time. Our study provides the exposure and toxic insights of MEPs through inhalation exposure using a lung cell model via the unique ALI exposure in vitro. The current study also provides important information on baseline data of the potential health risk to inhabitants of MEPs, thus providing valuable information to establish a standard for controlling environmental pollution in the future, especially for automobile exhaust in China.
-
We greatly acknowledge Kan Shao PhD from Department of Environmental Health, Indiana University School of Public Health, USA, for the critical guidance in the usage of USEPA BMDS 2.6.0.1 software.
-
All authors declare that there is no conflict of interests in the present work.
Assessment of Benchmark Dose in BEAS-2B Cells by Evaluating the Cell Relative Viability with Particulates in Motorcycle Exhaust via the Air-liquid Interface Exposure
doi: 10.3967/bes2021.036
Funds:
This work was supported by the funding from the National Natural Science Foundation of China [No. 81472955, 82073596 and 91643203]
- Received Date: 2020-02-15
- Accepted Date: 2020-11-03
-
Key words:
- Motorcycle exhaust particulates /
- Air–liquid interface /
- Bronchial epithelial cells /
- Cell relative viability /
- Dose-dependent effect
Abstract:
| Citation: | YU Tao, ZHANG Xue Yan, LI Shu Fei, ZHOU Yu Mei, LI Bin, WANG Zhong Xu, DAI Yu Fei, ADAMSON Sherleen Xue-Fu, ZHENG Yu Xin, BIN Ping. Assessment of Benchmark Dose in BEAS-2B Cells by Evaluating the Cell Relative Viability with Particulates in Motorcycle Exhaust via the Air-liquid Interface Exposure[J]. Biomedical and Environmental Sciences, 2021, 34(4): 272-281. doi: 10.3967/bes2021.036

|

 Quick Links
 DownLoad: