

-
To date, many epidemiological studies have shown that short-term exposure to extreme temperatures leads to adverse health events [1]. Numerous studies have analyzed the relationship between ambient temperature and human health, with the worst-case major health outcome being death [2]. However, non-fatal events, such as outpatient visits, can serve as an effective indicator of the body's acute response to ambient temperature. Therefore, it was considered appropriate to investigate the risk caused by ambient temperature, and the fraction of outpatients attributable to this metric, in China.
Qingdao, a coastal city of Shandong Province, is located in the monsoon area of the North Temperate Zone, and data on the association between temperature and outpatients had not been explored here. We therefore examined the relationships between temperature and outpatients for overall and cause-specific diseases in Qingdao, for the period 2015–2017, and calculated the disease burden attributable to non-optimal temperatures.
We obtained daily outpatient data from Chengyang District People's Hospital, Qingdao, a third-class hospital, from January 1, 2015, to December 31, 2017. This is a comprehensive facility, with convenient transportation, a complete inventory of equipment, and a hospital information system (HIS). The HIS indicated that > 70% of its patients are local residents. We used the 10th Revision of the International Classification of Diseases (ICD10) to identify all-causes (A00–Z99), cardiovascular (I00–I99), ischemic heart (I20–I25), cerebrovascular (I60–I69), respiratory (J00–J99), acute upper respiratory infections (J00–J06), influenza and pneumonia (J09–J18), digestive (K00–K93), diseases of the esophagus, stomach, and duodenum (K20–K31), and non-infectious enteritis and colitis (K50–K52) data. We then divided the daily total outpatients by gender (male, female) and age groups (0–17, 18–44, 45–59, and ≥ 60 years). Meteorological data were collected from the Qingdao Meteorological Bureau, including daily average temperature (°C) and relative humidity (RH; %). Daily mean air pollutant concentrations—including data for PM2.5 (μg/m3), SO2 (μg/m3), NO2 (μg/m3), CO (μg/m3), and O3-8 h (μg/m3)—were obtained from Qingdao Environmental Monitoring Station.
Daily outpatient counts generally follow a Poisson distribution, while previous studies [3] have shown that the effects of temperature on health are non-linear, and exhibit lag effects. Hence, a quasi-Poisson regression was performed, using a distributed lag non-linear model (DLNM) [4]. The model can be described using the following Equation:
$$\begin{split}{\rm{log}} E\;(Y_t) =\; &\alpha + cb \; (T_t,lag = 30) + ns\;(time,df = 8/year) \;+ \\ &ns\;(HR,3) + \beta DOW_t + \gamma Holiday_t\end{split}$$ where t represents the observation day, Yt refers to the number of outpatient visits on day t, α indicates the intercept, Tt represents the average temperature on day t, while cb means the 'cross-basis' function in the DLNM, which estimates both the exposure-response and lag-response relationship simultaneously. Metric ns represents a natural cubic spline, while DOWt and Holidayt are binary variables to control for the day of week and public holidays, respectively, with β and λ as coefficients. Model selection was based on the Akaike’s Information Criterion for quasi-Poission (Q-AIC), and on several previous studies to identify the knots, df, and the maximum number of lag days. On this basis, the maximum lag for the delayed effect of temperature change on morbidity was set to 30 d, ns (time, df = 8/year), as the natural cubic spline for time, was set to 8 df per year, to control for seasonality and long-term trends, and mean RH was modeled as a natural cubic spline with 3 df, to control for potential confounding effects.
The optimal temperature, which was assumed to correspond with the minimum number of outpatients, was derived from the DLNM mode, and was referred to as the reference value. The cumulative relative risks (CRR) and 95% confidence intervals (CI) under lag days were assessed, to estimate the impact of extreme temperatures on outpatients. In this study, the 5th and 95th percentiles of the temperature range were selected as extreme cold and extreme heat temperatures, respectively. To quantify temperature-related outpatient burden, fractions attributable to extreme cold, moderate cold, moderate heat, and extreme heat were evaluated, by summing the subsets corresponding to days with associated temperature distributions (< 5th percentile, 5th percentile to the optimal temperature, optimal temperature to 95th percentile, and > 95th percentile, respectively). Sensitivity analysis was carried out by changing some model parameters, to examine whether they affected the results. Statistical analysis was conducted using R software (version 3.6.1), with the ‘dlnm’ package used to fit DLNM, and the AF calculated using the function ‘attrdl’.
A total of 2,654,405 outpatients were recorded over the study period, with 130,423 suffering from cardiovascular disease, 340,689 from respiratory diseases, and 285,736 from digestive diseases (Table 1). In the subgroups, there were 1,390 female and 979 male outpatients per day. The 18–44 age group constituted 49.7% of the outpatient total, followed by the 0–17, 45–59, and ≥ 60 age groups. The daily average temperature ranged from −11.5 °C to 30.6 °C, with an average value of 13.9 °C, while the RH mean and standard deviation (SD) were 69% and 17%, respectively.
Variable Mean ± SD Min P25 P50 P75 Max Outpatient visits Total 2,422 ± 344 337 2,240 2,419 2,620 3,655 Cardiovascular disease 119 ± 48 3 85 106 151 267 Ischemic heart disease 34 ± 24 0 16 24 51 109 Cerebrovascular disease 11 ± 7 0 6 9 15 38 Respiratory disease 233 ± 152 64 253 300 358 578 Acute upper respiratory infections 114 ± 49 24 74 99 151 274 Influenza or pneumonia 23 ± 14 3 14 19 27 98 Digestive disease 196 ± 64 43 214 251 310 434 Disease of esophagus, stomach, or duodenum 43 ± 13 5 34 43 52 88 Non-infective enteritis or colitis 32 ± 11 4 25 32 39 68 Gender Male 979 ± 140 135 899 980 1,063 1,427 Female 1390 ± 210 201 1,280 1,384 1,509 2,227 Age (years) 0–17 489 ± 168 105 358 442 602 1,030 18–44 1178 ± 196 103 1,083 1,157 1,263 1,905 45–59 368 ± 59 26 338 372 404 498 ≥ 60 333 ± 84 32 275 345 395 560 Meteorology factors Temperature (°C) 13.9 ± 9.2 −11.5 5.6 15.0 22.1 30.6 Humidity (%) 69 ± 17 16 56 70 83 100 Air pollutants (µg/m3) PM2.5 45 ± 34 4 24 36 57 298 SO2 21 ± 14 4 11 18 26 144 NO2 34 ± 15 7 23 31 42 102 CO 0.8 ± 0.4 0.3 0.6 0.7 1.0 3.4 O3 102 ± 42 17 68 98 127 277 Table 1. Statistical summaries for daily outpatient numbers, and for meteorological and air pollution data, for Chengyang District People's Hospital, Qingdao, China, over the period January 1, 2015, to December 31, 2017
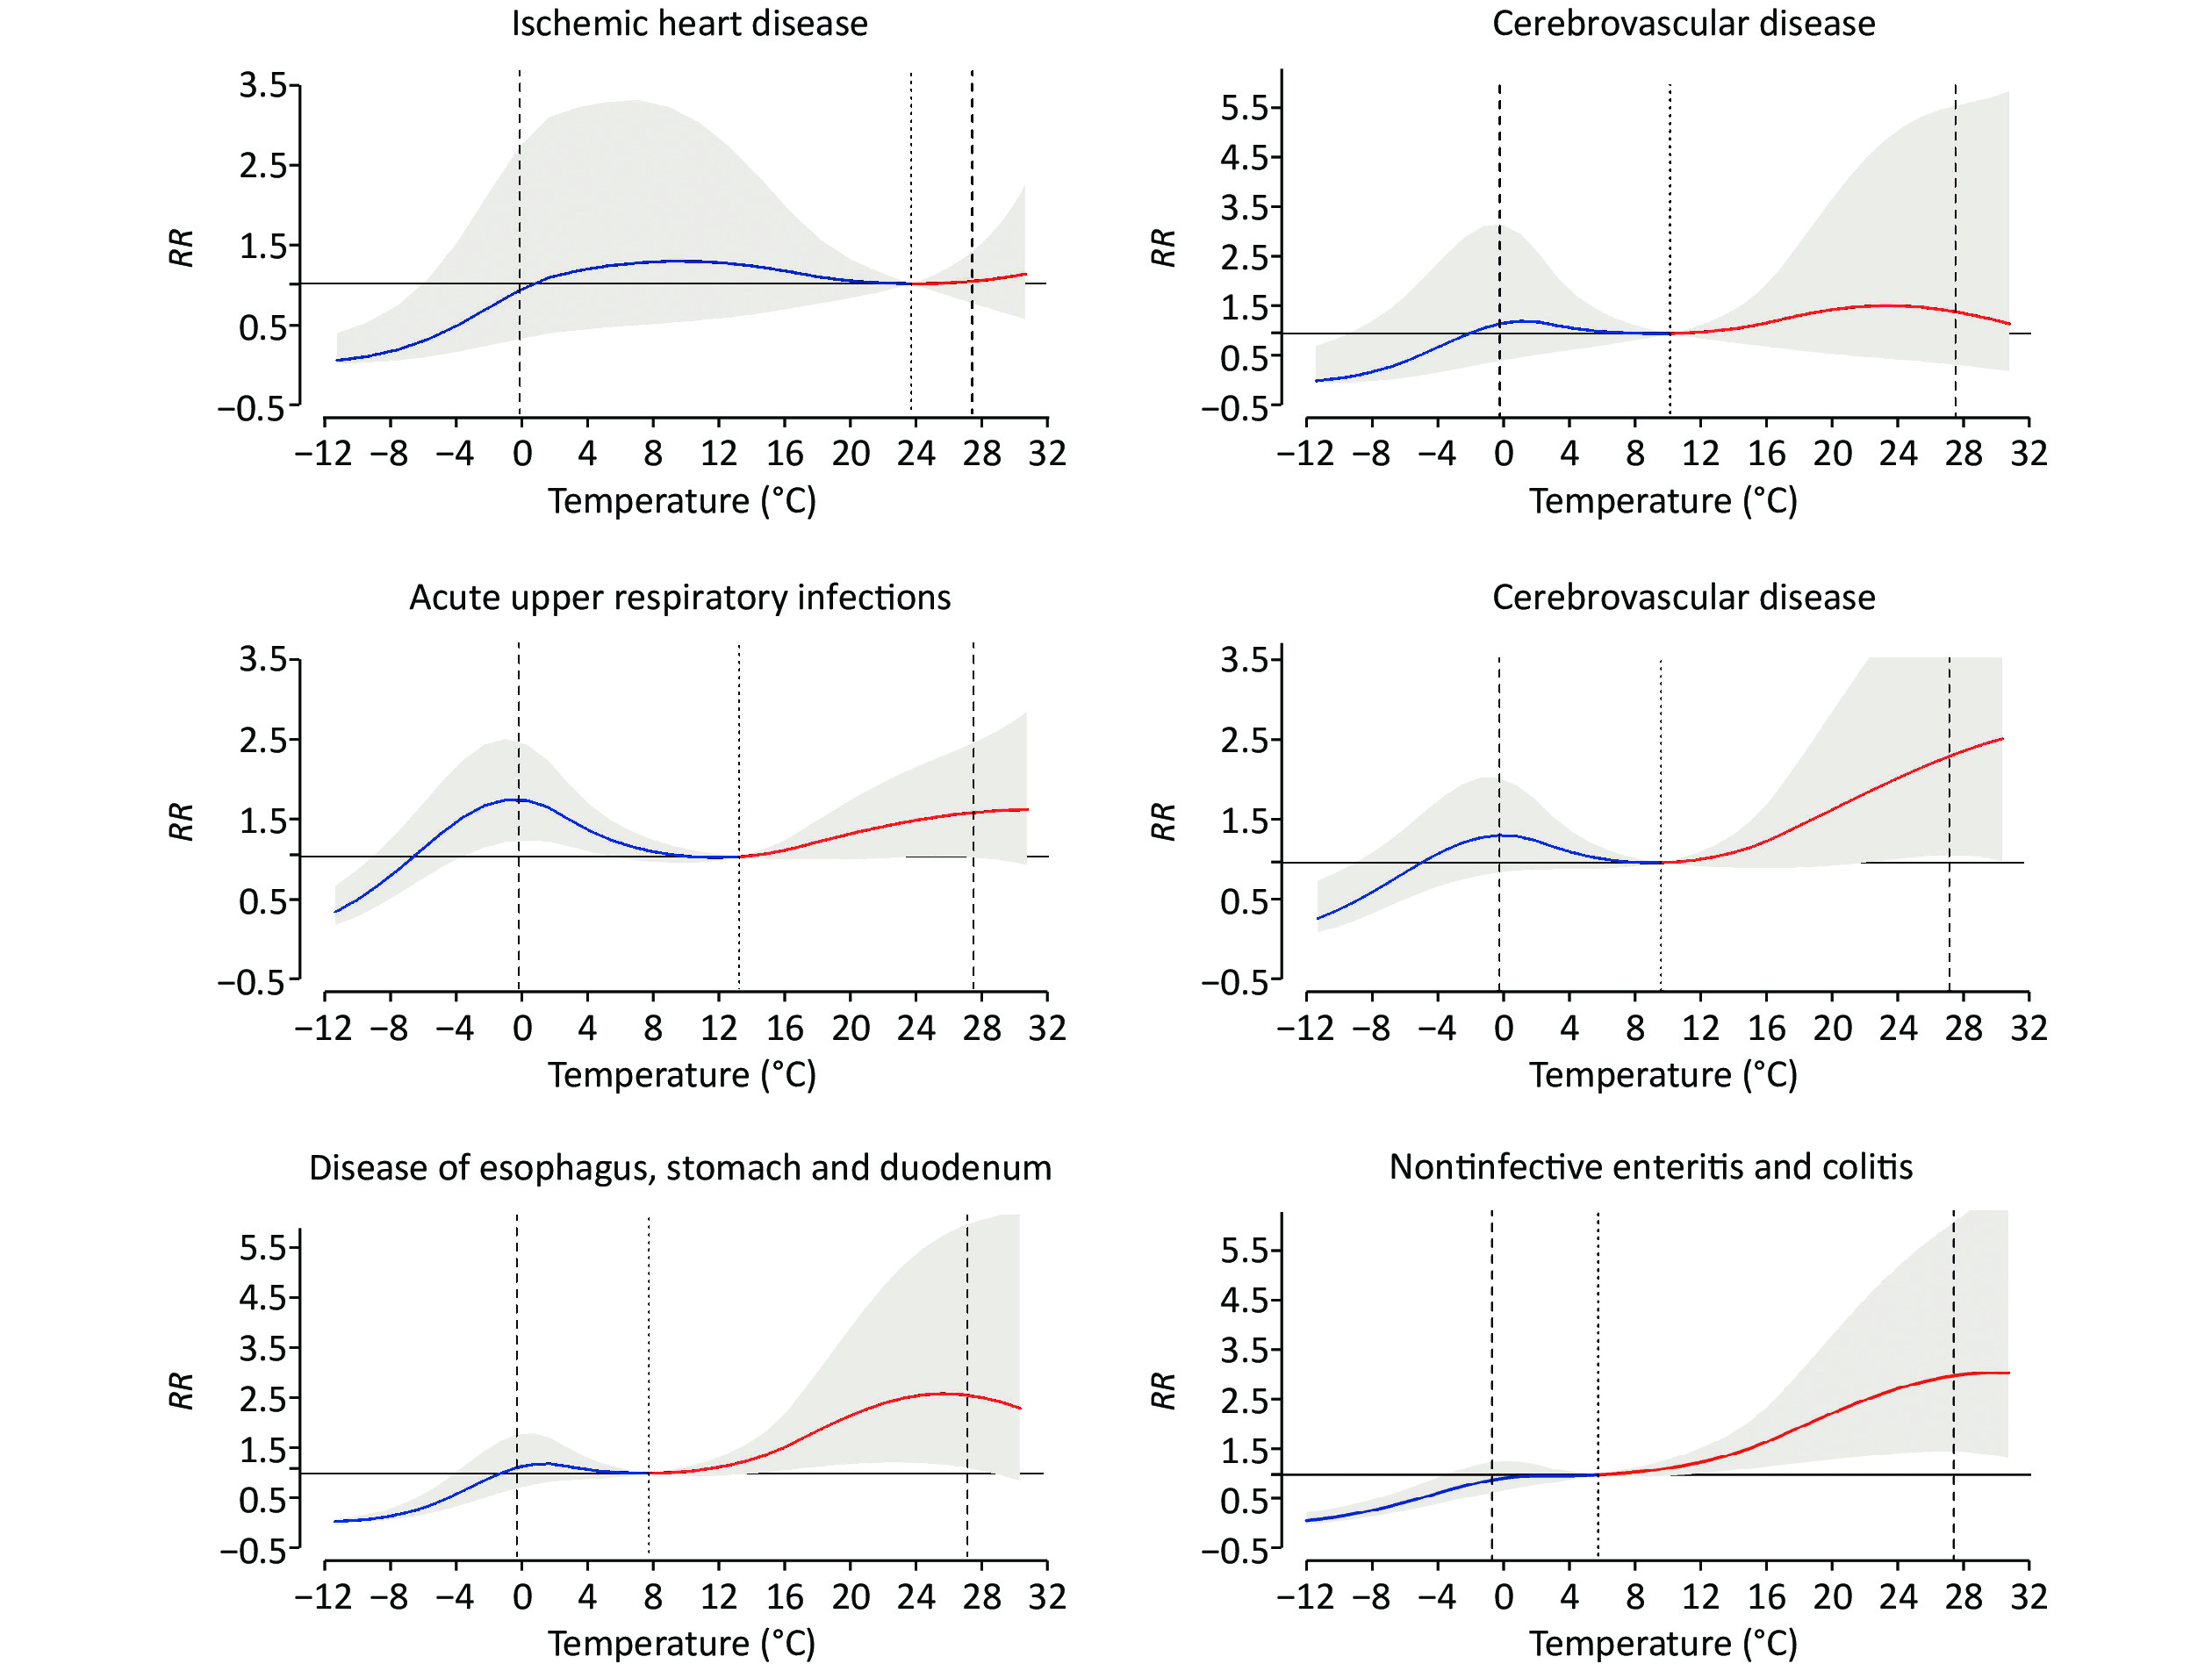
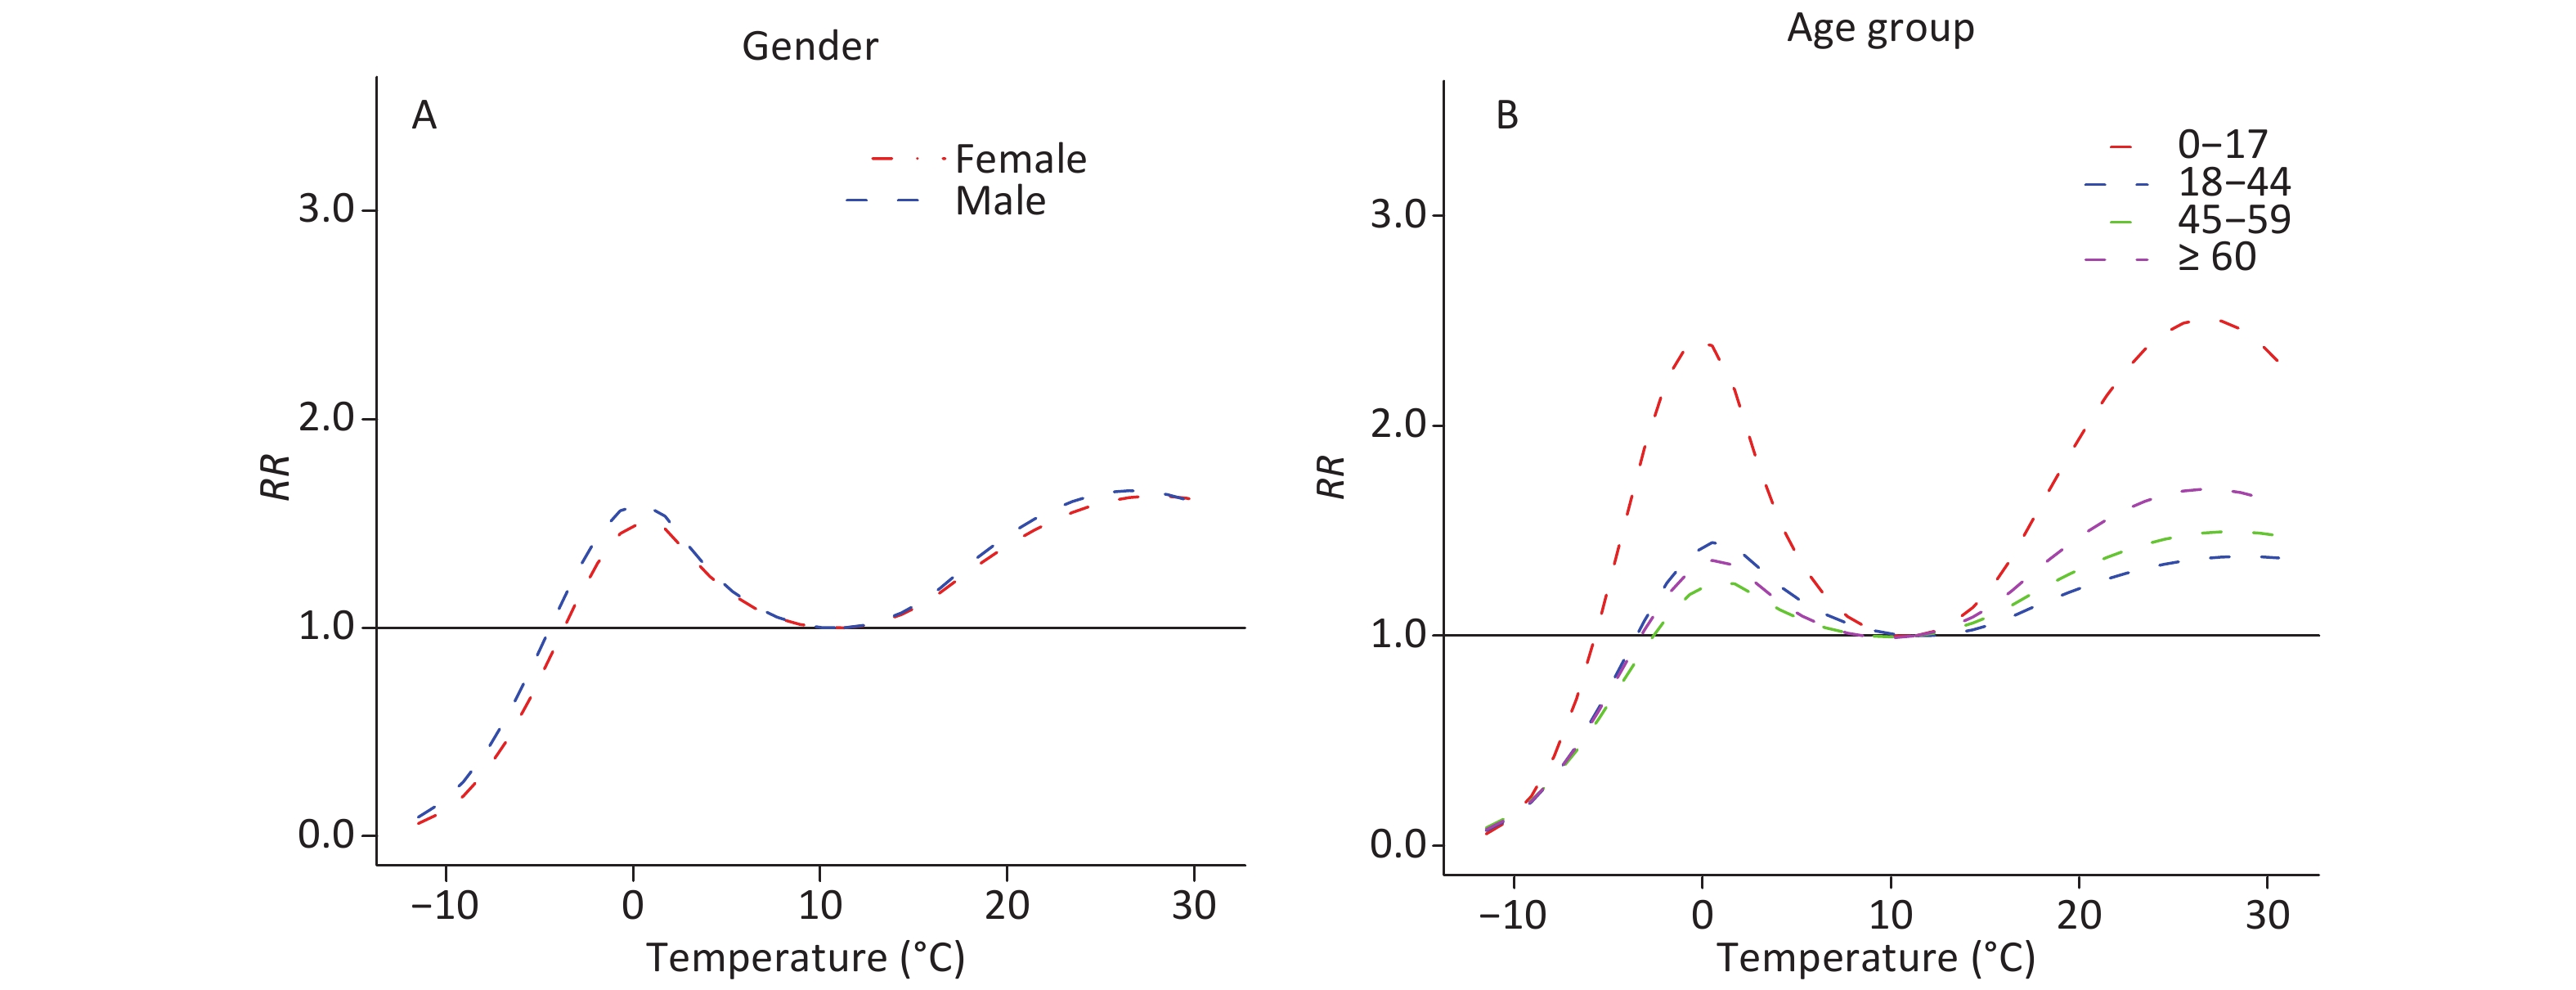
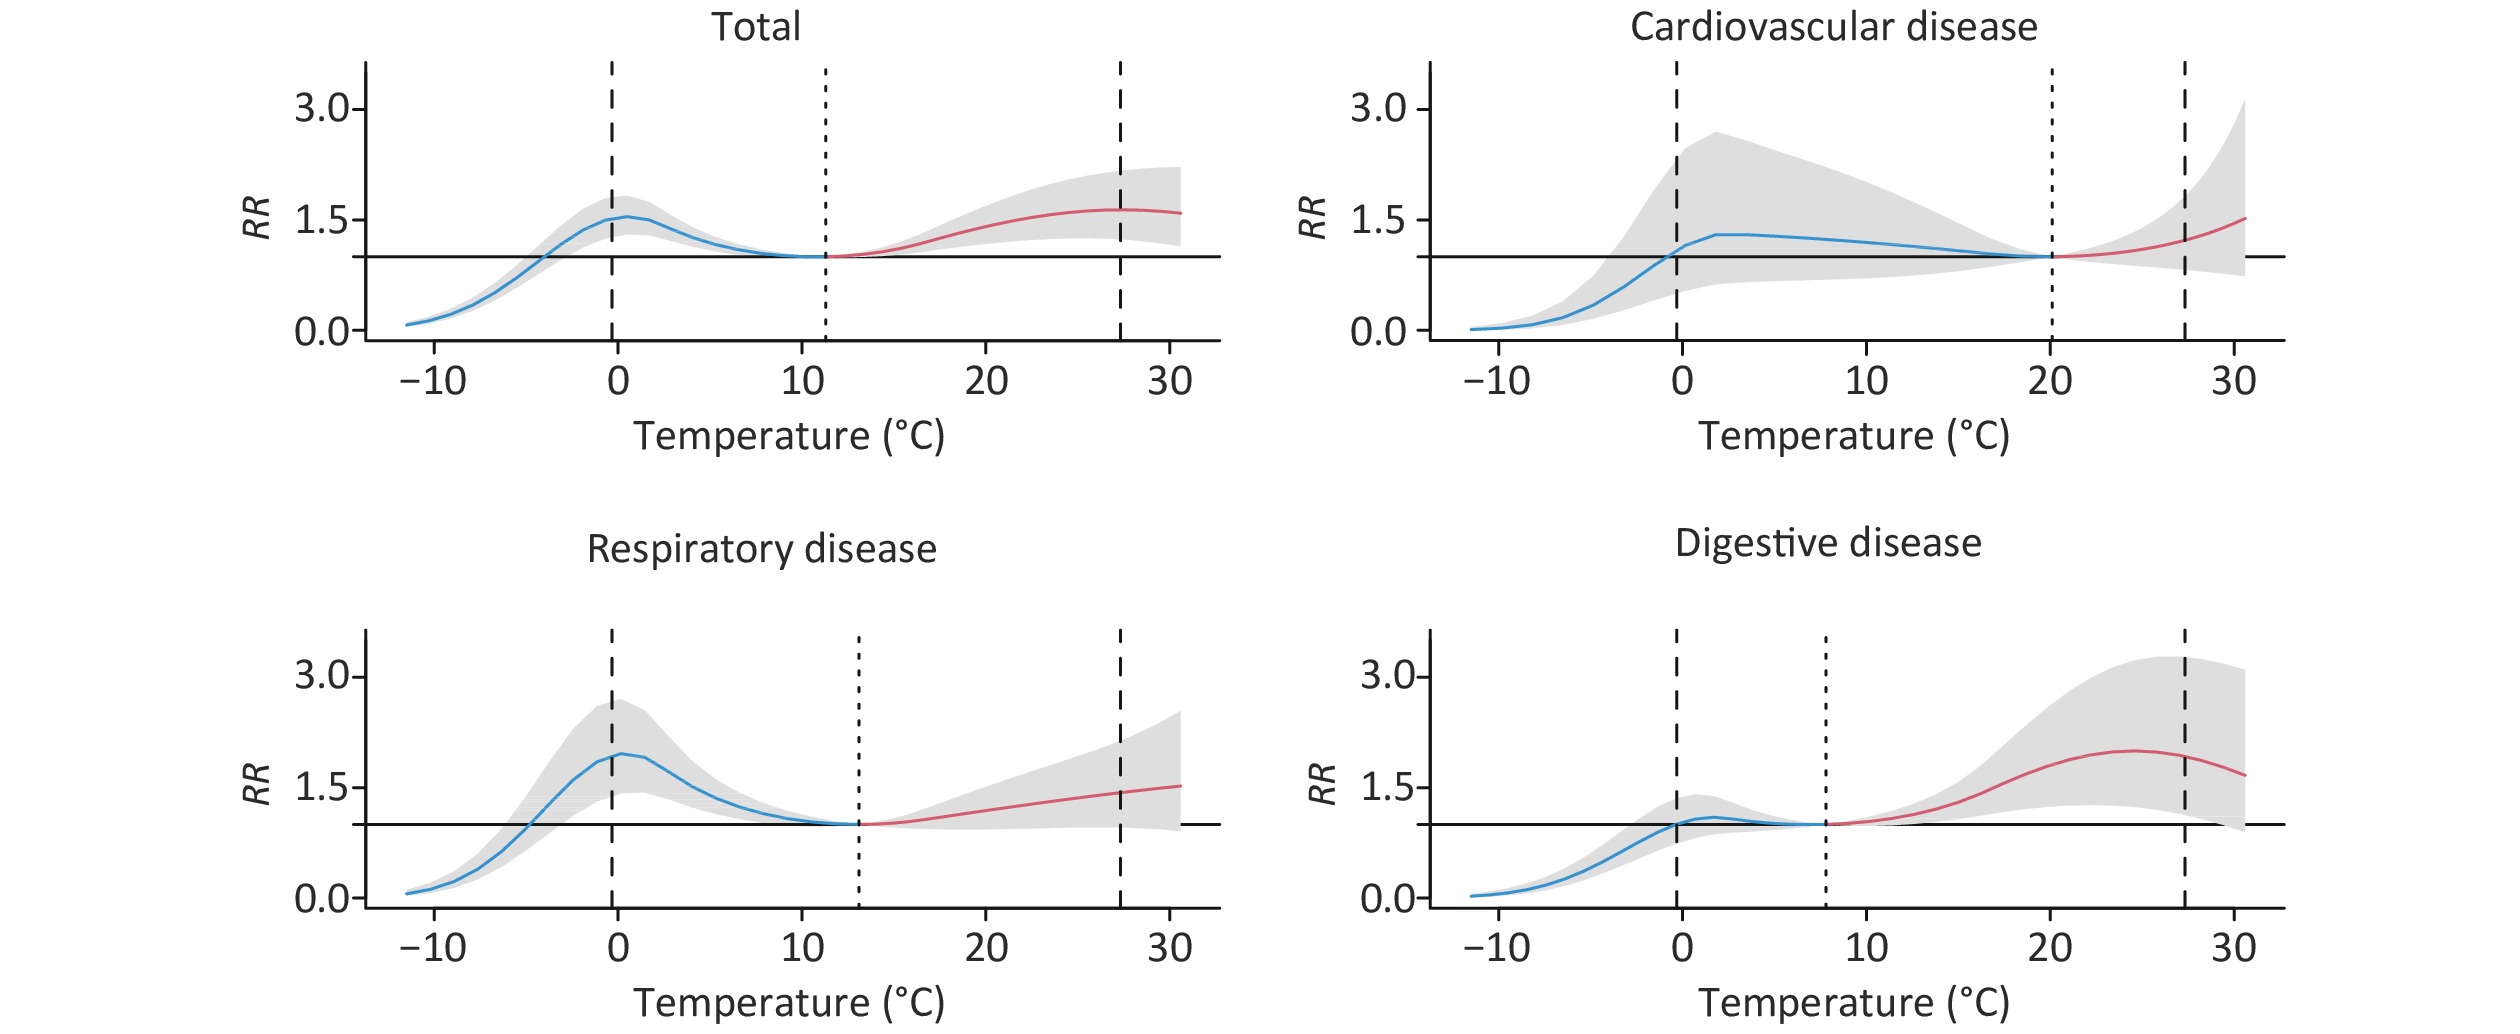
The overall cumulative exposure-response (ER) curves, for ambient temperatures and cause-specific outpatients over 30 lag days, are shown in Figure 1, with the relationship expressed using the CRR scale. Overall, the relationship curve was non-linear, with the CRR increasing in response to both cold and hot temperatures. Cumulative ER associations between temperature and other cause-specific outpatients are shown in Supplementary Figure S1, available in www.besjournal.com. Sex and age differences have been reflected in the ER curves illustrated as Supplementary Figure S2, available in www.besjournal.com.
Figure 1. Cumulative exposure-response relationships between temperature and cause-specific outpatients, for 0–30 lag days, for Chengyang District People's Hospital, Qingdao, China. Solid lines represent means estimates, while shaded areas denote the 95% confidence intervals. The three vertical dotted lines refer to the 5th percentile of ambient temperature, the optimum temperatures, and the 95th percentile, respectively.
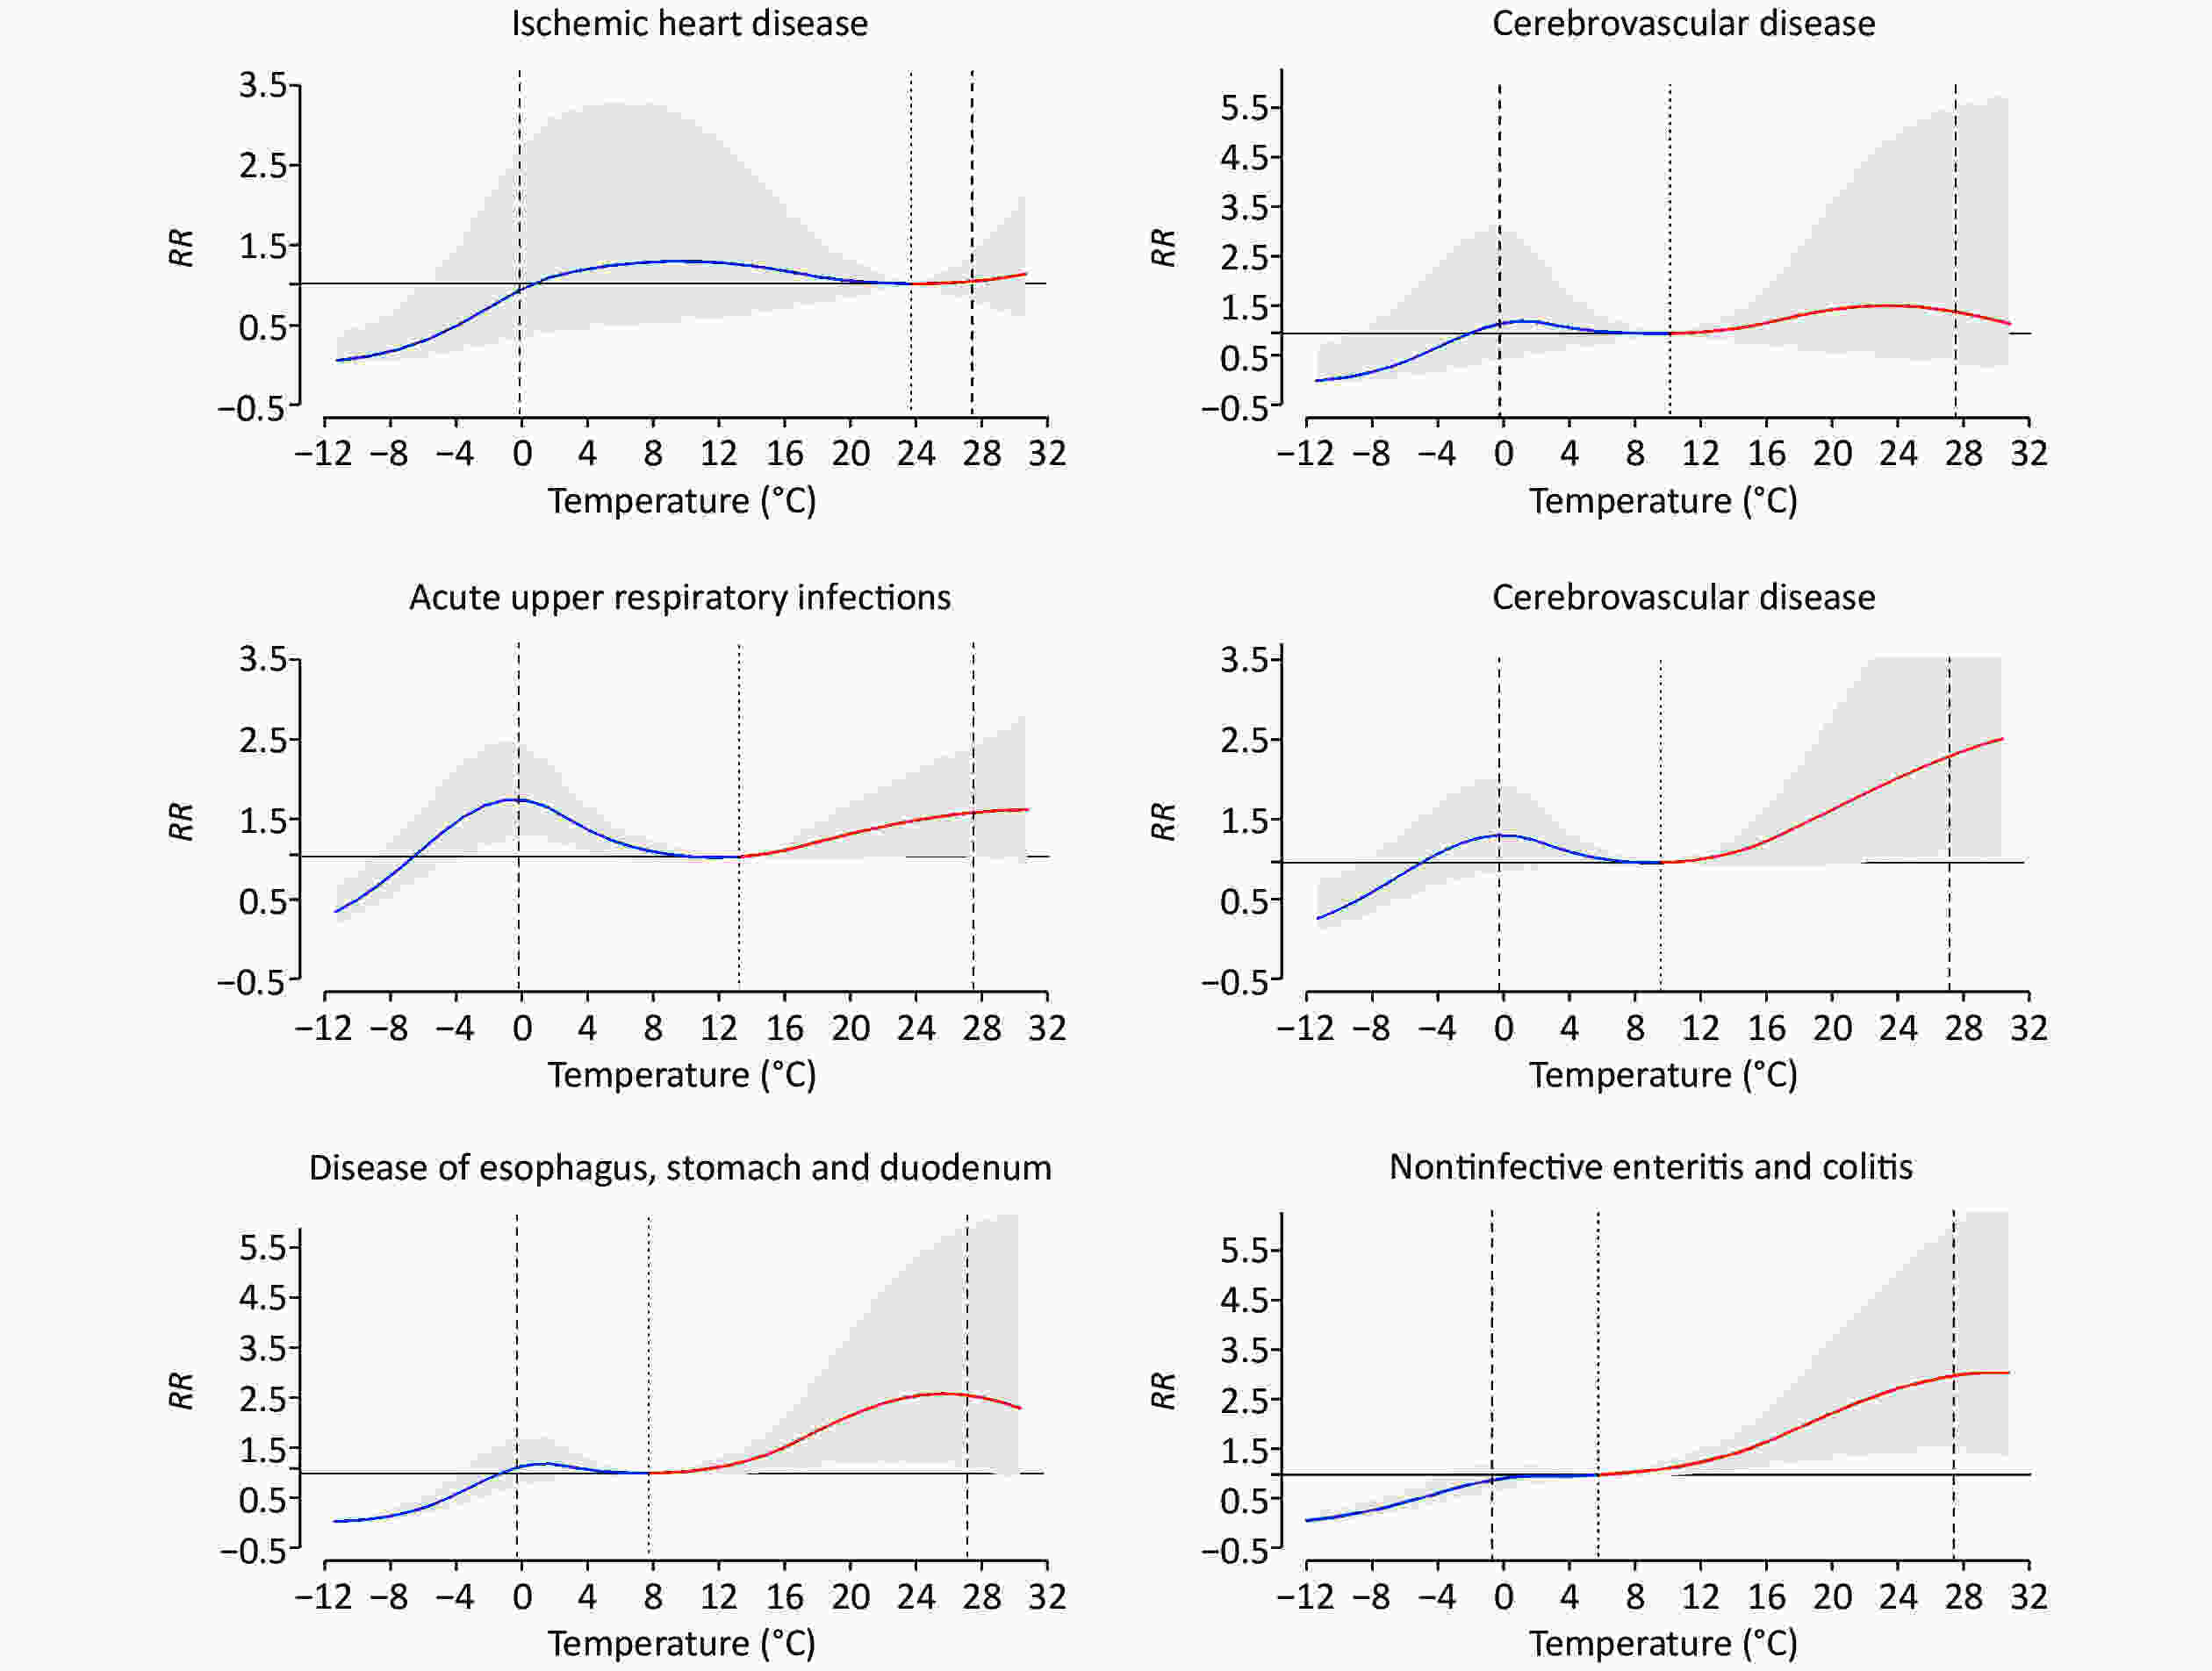
Figure S1. Overall cumulative exposure-response associations between temperature and cause-specific outpatients over 0−30 lag days in Qingdao, 2015−2017. Solid lines, means estimates; Shaded areas, 95% confidence intervals: The 3 vertical dashed lines show the 5th percentile of ambient temperature, the optimum temperatures, and the 95th percentile, respectively.
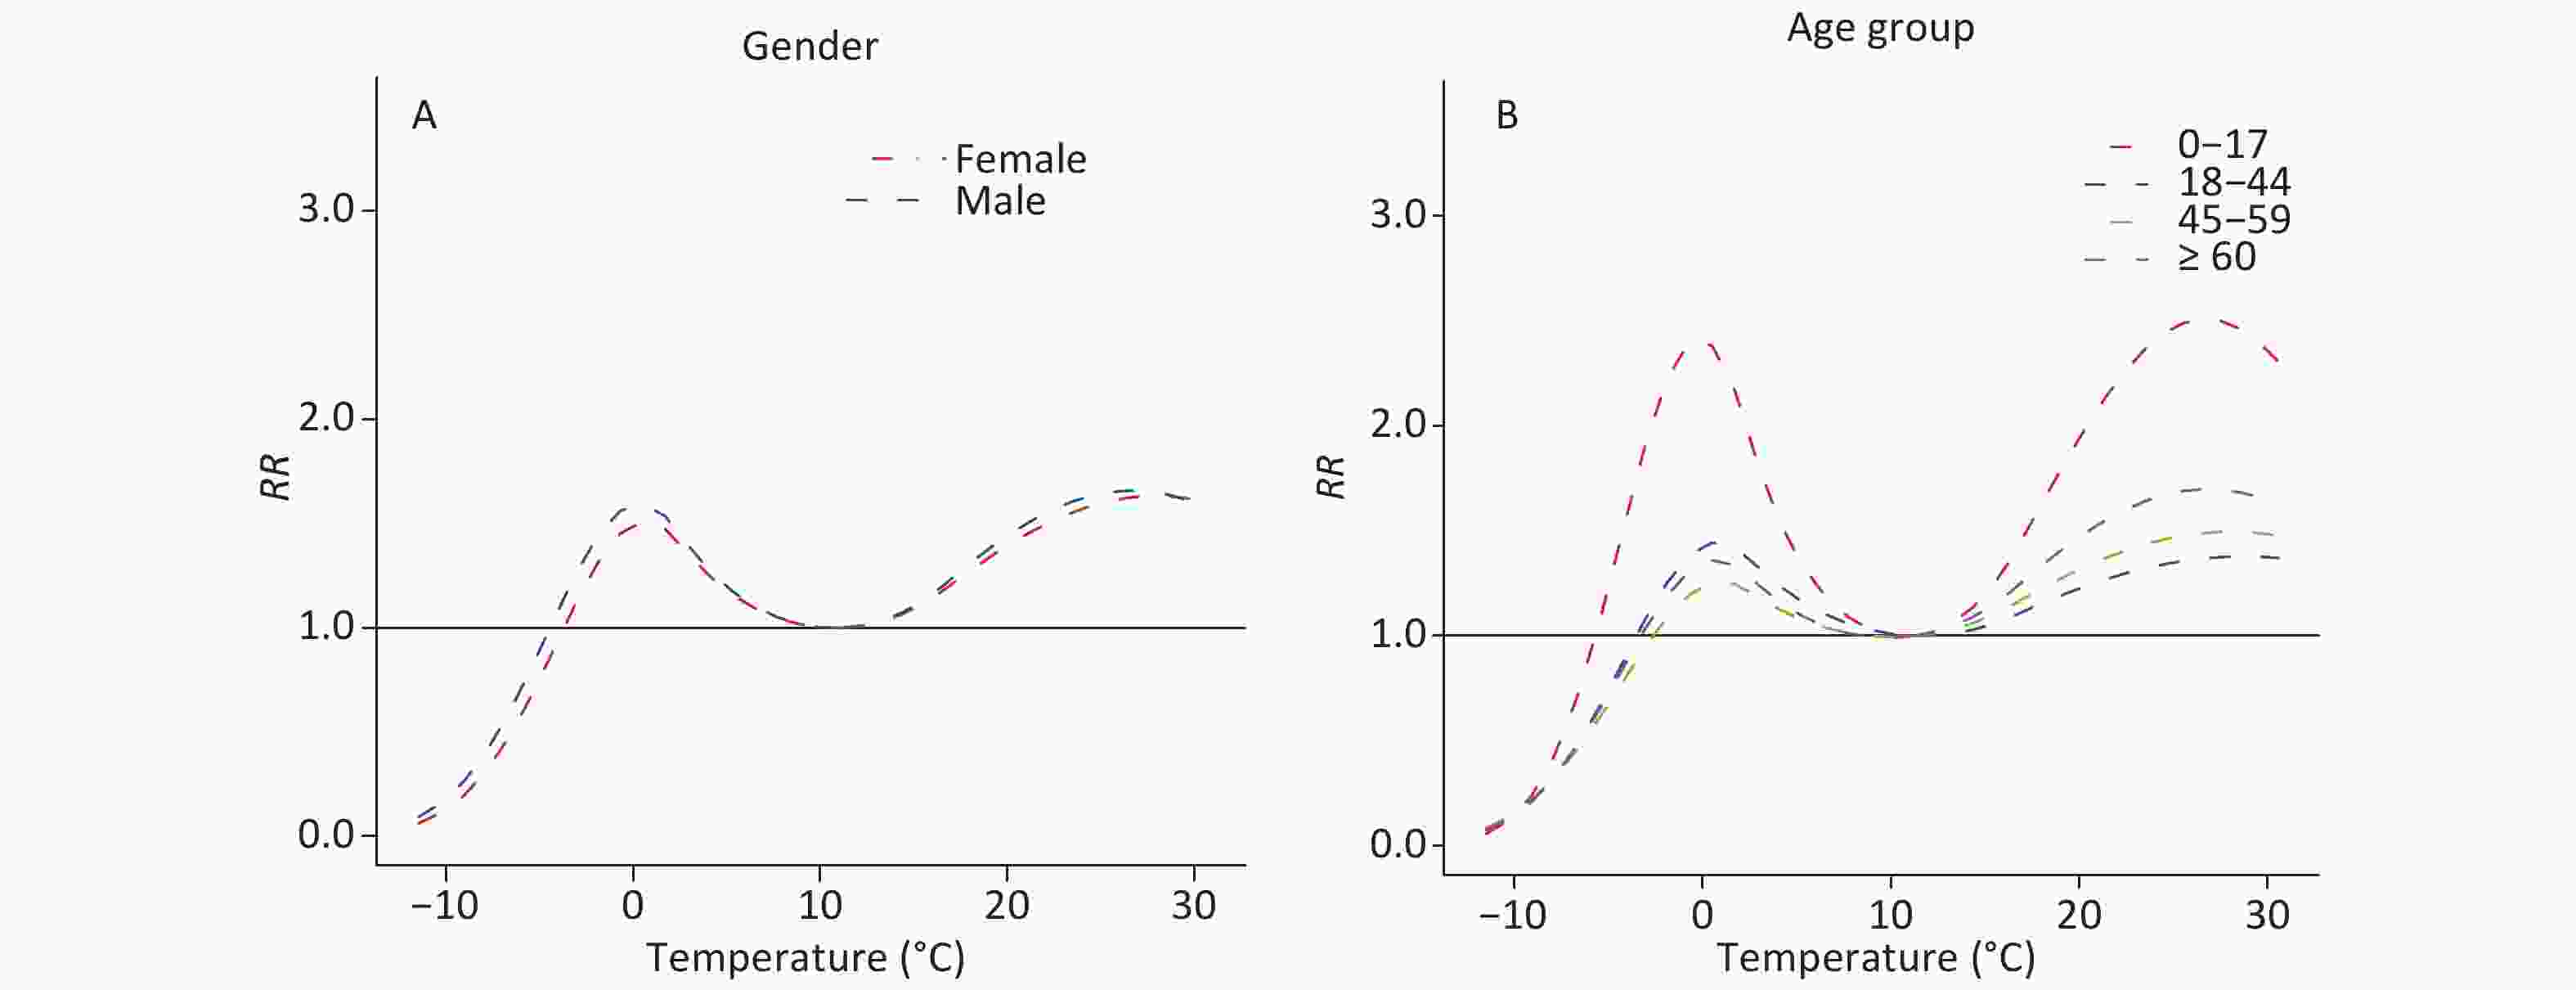
Figure S2. Overall cumulative exposure-response associations between temperature and outpatients along 0–30 lag days in gender- and age-specific groups in Qingdao, 2015−2017. (A) Gender. (B) Age.
The overall influence of extreme temperatures on total, cause-, gender-, and age-specific outpatient visits, over 0–30 lag days, can be seen in Supplementary Table S1, available in www.besjournal.com. For total outpatients, the optimum temperature was 11.3 ℃. Compared with the optimum temperature, the CRR for extreme heat was higher than that for extreme cold, at 1.64 (95% CI: 1.24, 2.16), and 1.47 (95% CI: 1.22, 1.77), respectively.
Variable Minimum-visit
temperature (°C)Extreme cold Extreme heat Diseases Total 11.3 1.47 (1.22, 1.77) 1.64 (1.24, 2.16) Cardiovascular disease 20.1 1.13 (0.53, 2.43) 1.20 (0.83, 1.74) Ischemic heart disease 23.6 0.95 (0.32, 2.80) 1.03 (0.78, 1.35) Cerebrovascular disease 9.6 1.22 (0.48, 3.13) 1.46 (0.38, 5.67) Respiratory disease 13.1 1.94 (1.39, 2.70) 1.43 (0.96, 2.14) Acute upper respiratory infections 11.3 1.70 (1.21, 2.41) 1.54 (1.00, 2.39) Influenza and pneumonia 9.6 1.35 (0.88, 2.07) 2.35 (1.09, 5.04) Digestive disease 7.8 1.00 (0.74, 1.36) 1.92 (1.13, 3.28) Disease of esophagus, stomach and duodenum 7.8 1.14 (0.69, 1.67) 2.04 (0.91, 4.55) Non-infective enteritis and colitis 6 0.92 (0.67, 1.27) 2.95 (1.46, 5.95) Gender Male 11.3 1.55 (1.29, 1.86) 1.65 (1.25, 2.19) Female 11.3 1.43 (1.18, 1.74) 1.63 (1.21, 2.20) Age (years) 0−17 11.3 2.23 (1.77, 2.82) 2.63 (1.85, 3.74) 18−44 11.3 1.25 (1.02, 1.55) 1.45 (1.06, 2.00) 45−59 9.6 1.08 (0.86, 1.35) 1.63 (1.09, 2.45) ≥ 60 9.6 1.18 (0.91, 1.52) 1.89 (1.18, 3.02) Table S1. Cumulative relative risks of outpatients related to extreme cold temperature (5th percentile) and extreme heat temperature (95th percentile) in each subgroups along 0–30 lag days
The AFs and 95% empirical confidence intervals (eCI) of outpatients due to overall non-optimal temperature, extreme cold, moderate cold, moderate heat, and extreme heat, grouped by cause, gender, and age, have been presented in Table 2. The overall AF was 22.20% (95% eCI: 14.84%, 28.25%). Compared with other temperature ranges, moderate cold and heat were responsible for the greatest fraction in every cause-specific group. Similar patterns were observed for each gender and age group.
Variable Overall Extreme cold Moderate cold Moderate heat Extreme heat Diseases Total 22.20 (14.84, 28.25) 0.30 (−0.57, 1.11) 5.99 (3.23, 8.30) 14.44 (7.56, 20.64) 2.42 (0.96, 3.76) Cardiovascular disease 9.99 (−22.82, 28.73) −1.73 (−5.80, 1.57) 8.52 (−22.79, 28.00) 1.79 (−3.35, 5.98) 1.35 (−1.39, 3.56) Ischemic heart disease 8.14 (−63.55, 37.81) −1.58 (−7.87, 2.74) 9.14 (−46.66, 38.21) 0.13 (−2.13, 2.36) 0.28 (−2.22, 2.13) Cerebrovascular disease 19.68 (−54.38, 46.36) 0.03 (−5.09, 3.58) 2.78 (−10.29, 13.11) 15.58 (−40.23, 39.07) 1.70 (−7.69, 7.02) Respiratory disease 21.39 (10.08, 29.82) 1.84 (−0.15, 3.53) 10.89 (5.50, 15.32) 7.88 (−2.68, 16.09) 1.71 (−0.23, 3.32) Acute upper respiratory infections 21.78 (9.21, 30.93) 2.29 (0.13, 4.03) 7.96 (1.84, 13.39) 10.55 (1.05, 19.07) 1.86 (−0.24, 3.49) Influenza and pneumonia 23.72 (3.18, 36.79) 1.30 (−2.18, 4.13) 5.10 (−2.93, 12.02) 15.59 (−0.91, 25.87) 3.15 (0.33, 4.98) Digestive disease 24.20 (7.15, 35.66) −1.67 (−3.41, 0.11) 0.89 (−2.49, 4.03) 22.93 (8.97, 33.18) 3.14 (0.32, 5.36) Disease of esophagus, stomach, and duodenum 24.29 (−2.16, 38.30) −1.66 (−4.64, 0.72) 1.41 (−4.00, 6.32) 22.46 (−0.38, 36.57) 3.06 (−1.36, 5.61) Non-infective enteritis and colitis 31.07 (12.58, 42.87) −2.00 (−4.04, 0.16) −0.47 (−4.08, 2.49) 30.59 (14.22, 42.11) 5.29 (1.92, 7.70) Gender Male 23.40 (16.14, 29.66) 0.62 (−0.20, 1.43) 6.32 (3.74, 8.53) 15.07 (7.96, 20.90) 2.44 (1.06, 3.76) Female 21.43 (13.46, 28.42) 0.07 (−0.80, 0.89) 5.73 (2.94, 8.24) 14.11 (6.64, 20.52) 2.42 (0.92, 3.73) Age (years) 0–17 38.24 (31.34, 43.38) 1.91 (0.84, 2.95) 10.37 (7.27, 12.84) 24.73 (18.03, 30.27) 4.05 (2.68, 5.26) 18–44 16.12 (5.93, 23.76) −0.46 (−1.50, 0.51) 4.19 (1.22, 6.99) 10.95 (1.65, 18.95) 1.98 (0.26, 3.52) 45–59 17.24 (3.71, 26.31) −1.12 (−2.25, 0.03) 2.05 (−1.22, 5.11) 14.56 (4.07, 23.70) 2.45 (0.16, 4.08) 60+ 22.17 (8.68, 31.90) −0.82 (−2.26, 0.55) 3.13 (0.63, 6.34) 18.00 (6.16, 26.86) 2.87 (0.75, 4.53) Table 2. Attributable fractions of outpatients due to overall non-optimum temperature, extreme cold, moderate cold, moderate heat, and extreme heat by cause, gender, and age
Sensitivity analysis indicated that changing the parameters of the model did not affect the main results, as can be seen in Supplementary Tables S2–S4, available in www.besjournal.com.
Lag (d) Lowest-risk temperature Relative risk Attributable fractions (%) Extreme cold Extreme hot Overall 28 11.3 1.37 (1.15, 1.63) 1.50 (1.16, 1.95) 19.22 (10.65, 25.33) 29 11.3 1.43 (1.20, 1.71) 1.57 (1.20, 2.06) 20.98 (12.65, 27.21) 30 11.3 1.47 (1.22, 1.77) 1.64 (1.24, 2.16) 22.20 (14.84, 28.25) 31 11.3 1.45 (1.20, 1.76) 1.74 (1.31, 2.31) 23.30 (15.27, 29.45) 32 9.6 1.43 (1.19, 1.72) 1.86 (1.36, 2.55) 24.55 (15.75, 30.97) Table S2. The relative risks and attributable fractions (means and 95% empirical confidence intervals) of daily total outpatients associated with non-optimum ambient temperatures, using alternative maximum lags
Confounders Lowest-risk temperature Extreme cold Extreme hot Attributable fractions (%) Null 11.3 1.47 (1.22, 1.77) 1.64 (1.24, 2.16) 22.20 (14.84, 28.25) +PM2.5 11.3 1.49 (1.24, 1.79) 1.63 (1.24, 2.15) 22.31 (14.59, 28.56) +O3 11.3 1.46 (1.22, 1.76) 1.63 (1.24, 2.15) 22.11 (14.88, 28.23) +SO2 11.3 1.44 (1.19, 1.73) 1.61 (1.22, 2.13) 21.52 (14.07, 28.12) +NO2 11.3 1.49 (1.24, 1.79) 1.61 (1.22, 2.13) 22.04 (14.19, 28.24) +CO 11.3 1.50 (1.24, 1.80) 1.60 (1.21, 2.11) 21.96 (14.26, 28.40) Note. The adjustment of the two-day average concentrations of air pollutants, which were conducted in Qingdao with 3-year data. Table S4. The national-average relative risks and attributable fractions (mean and 95% empirical confidence intervals) of daily total outpatients associated with non-optimum ambient temperatures, with and without the adjustment of air pollutants
To the best of our knowledge, this is the first time-series analysis to investigate the relationships between ambient temperature and outpatients from all causes, cardiovascular, respiratory, and particularly digestive diseases, in Qingdao. The morbidity burden was quantified further, with the results indicating that the majority of the temperature-related burden was due to moderate cold and heat—and that warmer temperatures accounted for more of the burden than cooler temperatures.
We found that associations between ambient temperature and outpatients were not simple U or J curves. When the temperature was lower than the reference temperature, the outpatient risk initially increased before decreasing, with decreasing temperature—which was consistent with previous research [5]. One possible interpretation was that as Qingdao is in the north of China, the government centralizes heating from November to April, which may make the locals less sensitive to extreme cold.
Furthermore, we found that moderate cold and heat were responsible for the majority of the disease burden—perhaps as they accounted for more days. For respiratory diseases, we found that cold weather had a stronger effect than warm and in this context, we recalled previous reports, which had found that exposure to cold could result in several immunoreactions, such as persistent bronchoconstriction [6]. The highest AFs were observed for non-infective enteritis, colitis, and overall digestive diseases at moderate heat—which increase the growth rate of bacteria, and opportunities for food items to become contaminated [7]. It is relevant to note here that Qingdao is situated on the coast of the East China Sea, in an area rich in seafood, which is highly susceptible to spoilage.
Subgroup analyses showed that male and 0–17 year-olds were the more vulnerable groups, and these may be associated with different physical conditions, living habits, and psychological pressures [8].
The limitations of this study should be acknowledged. First, we used temperature data from fixed meteorological stations to represent individual exposure, which may have led to exposure estimate errors. Second, we did not take personal habits—such as the use of air conditioners—into account, but these may affect associations between temperature and morbidity.
In conclusion, we found that both hot and cold temperatures had adverse effects on outpatients in Qingdao. Moderate hot and cold temperatures were responsible for a substantial fraction of the burden, particularly moderate heat. Among the subgroups, males and young people aged 0–17 years were found to be more vulnerable to extreme temperature effects.
The authors hope that the findings presented here can provide information for public health decision makers developing intervention/impact mitigation measures.
Author Contributions WANG Zi Xian conducted the data analysis and wrote the manuscript. CHENG Yi Bin and LI Yong Hong carried out the study and revised the manuscript. ZHANG Xin Hang and SONG He Jia prepared the data, while WANG Yu and WANG Yan conducted data analyses. YAO Xiao Yuan led the project.
Df of humidity Lowest-risk temperature Extreme cold Extreme hot Attributable fractions (%) 2 11.3 1.47 (1.22, 1.77) 1.64 (1.25, 2.16) 22.27 (14.82, 28.33) 3 11.3 1.47 (1.22, 1.77) 1.64 (1.24, 2.16) 22.20 (14.84, 28.25) 4 11.3 1.47 (1.23, 1.77) 1.64 (1.25, 2.17) 22.32 (14.85, 28.75) 5 11.3 1.48 (1.23, 1.78) 1.64 (1.24, 2.16) 23.32 (14.87, 28.51) Table S3. The relative risks and attributable fractions (means and 95% empirical confidence intervals) of daily total outpatients associated with non-optimum ambient temperatures, using alternative df of humility
Burden of Outpatient Visits Attributable to Ambient Temperature in Qingdao, China
doi: 10.3967/bes2021.052
Funds:
This research was funded by Special Foundation of Basic Science and Technology Resources Survey of Ministry of Science and Technology of China [No. 2017FY101201]
- Received Date: 2020-10-10
- Accepted Date: 2021-02-23
-
Key words:
- Temperature /
- Outpatient visits /
- Attributable fraction /
- Distributed lag non-linear model
Abstract: Climate change has been referred to as one of the greatest threats to human health, with reports citing likely increases in extreme meteorological events. In this study, we estimated the relationships between temperature and outpatients at a major hospital in Qingdao, China, during 2015–2017, and assessed the morbidity burden. The results showed that both low and high temperatures were associated with an increased risk of outpatient visits. High temperatures were responsible for more morbidity than low temperatures, with an attributed fraction (AF) of 16.86%. Most temperature-related burdens were attributed to moderate cold and hot temperatures, with AFs of 5.99% and 14.44%, respectively, with the young (0–17) and male showing greater susceptibility. The results suggest that governments should implement intervention measures to reduce the adverse effects of non-optimal temperatures on public health—especially in vulnerable groups.
| Citation: | WANG Zi Xian, CHENG Yi Bin, WANG Yu, WANG Yan, ZHANG Xin Hang, SONG He Jia, LI Yong Hong, YAO Xiao Yuan. Burden of Outpatient Visits Attributable to Ambient Temperature in Qingdao, China[J]. Biomedical and Environmental Sciences, 2021, 34(5): 395-399. doi: 10.3967/bes2021.052

|


 Quick Links
 DownLoad: