


-
Epithelial ovarian cancer (EOC) is the leading cause of death among gynecological malignancies globally, with an overall 5-year survival rate of only 26% to 46%[1]. Much progress has been made in the treatment of ovarian cancer in the past few decades[2-4]. The standard treatment strategy of EOC is cytoreductive surgery followed by cisplatin and paclitaxel-based chemotherapy[1,5]. Although more than 80% of patients initially respond well to standard treatment, chemotherapy resistance remains a critical therapeutic obstacle and one of the most common causes of death[5,6]. Elucidating the specific molecular mechanism of chemotherapy resistance and exploring the key factors to reverse drug resistance have important clinical significance for improving the survival rate of ovarian cancer patients.
In previous studies, we found that phosphorylated cofilin-1 (p-CFL-1) was overexpressed in paclitaxel-resistant EOC cell lines (SK-TR30, SK-TR2500, and A2780-TR) and ovarian cancer tissues by two-dimensional gel electrophoresis, matrix-assisted laser desorption ionization-time-of-flight-mass spectrometry (MALDI-TOF-MS), and immunohistochemistry (IHC) assays[7]. Cofilin-1 (CFL-1), a member of the actin-binding protein family, plays an essential role in the regulation of actin filament dynamics[8,9]. Serine-3 (Ser-3) is the only phosphorylation site in CFL-1. Through phosphorylation and dephosphorylation of Ser-3, the activity of CFL-1 is specifically regulated by protein kinases such as LIM-kinases (LIMKs) and testicular protein kinases (TESKs), as well as phosphatases such as slingshot (SSH) family members and chronophin[8,9]. The regulation of CFL-1 phosphorylation is a key link between extracellular stimulation and actin cytoskeleton dynamics. Abnormally phosphorylated CFL-1 activity plays an important role in many pathological conditions, such as neurological and cardiovascular diseases, tumor metastasis and invasion, and drug resistance[9-16]. Our group focuses on EOC chemo-resistance and is among the first groups to report p-CFL-1 as a trigger for chemotherapy resistance[7,9, 15,16]. However, the exact mechanism of drug resistance in EOC cells related to CFL-1 phosphorylation is still unclear. This study aimed to reveal the impact of p-CFL-1 on paclitaxel resistance in EOC cells. We confirmed that SSH-1 regulated the phosphorylation of CFL-1 at Ser-3 to prevent SKOV3 cells from paclitaxel resistance resulting from apoptosis inhibition. We also observed that the levels of SSH-1/CFL-1 were closely related to the response of EOC patients to paclitaxel and their prognosis.
-
The SKOV3 cell line was kindly provided by Prof. YANG (State Key Laboratory of Biotherapy and Cancer Center/Collaborative Innovation Center for Biotherapy, West China Hospital, Sichuan University, Chengdu, China). The SK-TR30 cell line is a stable paclitaxel-resistant cell line[7]. The human ovarian cancer cell lines A2780 and A2780-TR were kindly provided by Dr. LI (Department of Obstetrics and Gynecology, Guangxi Cancer Hospital, Guangxi Medical University, Nanning, China). SKOV3 and SK-TR30 cells were grown in high glucose DMEM (DMEM/HG) medium supplemented with 10% fetal bovine serum. A2780 and A2780TR cells were grown in RPMI-1640 medium supplemented with 10% fetal bovine serum. These cells were grown at 37 °C in a humidified atmosphere containing 5% CO2. SK-TR30 and A2780-TR cells were cultured in medium containing an additional 10 nmol/L paclitaxel to maintain drug resistance and further cultured in drug-free medium for one week before follow-up experiments. Once thawed, the cell lines were routinely authenticated approximately every 6 months.
-
Antibodies against CFL-1 (#ab42824), p-CFL-1 (#ab12866), SSH-1 (#ab76943), Bc1-2 (#ab59348), caspase-3 (#ab13847), Cytochrome c (#ab90529), and GAPDH (#ab70699) were purchased from Abcam (USA). HRP-conjugated anti-mouse and anti-rabbit antibodies (#7076 and #7047, respectively) were obtained from Cell Signaling Technology (USA). Anti-SSH-1 antibody used in the immunohistochemistry (IHC) assay was supplied by ECM Biosciences LLC (#SP1711, Kentucky, USA). Paclitaxel was purchased from Cell Signaling Technology (#9807S).
-
Plasmids with ectopic overexpression of CFL-1 or p-CFL-1 [including WT (wild type), S3A (phosphodeficient cofilin mutant, Ser-3 replaced with alanine) and S3D (phosphomimetic cofilin mutant, Ser-3 replaced with an aspartate)], overexpression of human SSH-1 and non-targeting negative-control targets were supplied by Vigene Bioscience (Shandong, China). CFL-1 and SSH-1 shRNAs were also purchased from Vigene Bioscience. Plasmids were transfected in ovarian cancer cells using Lipo3000-based Transfection Reagent (System Invetrogen Inc., Palo Alto, CA, USA), according to the manufacturer’s instructions.
-
Whole-cell and cytoplasmic proteins were extracted using a ProteoJET Kit (Fermentas, USA). Mitochondrial proteins were isolated using a ReadiPrepTM Mitochondrial/Cytoplasmic Fractionation Kit (AAT Bioquest, USA). Equal amounts of proteins were separated by SDS-PAGE and transferred onto polyvinylidene fluoride membranes (Millipore, Bedford, MA, USA). The membranes were incubated with primary antibodies at 4 °C overnight, then probed with the appropriate secondary antibodies for 1 h at room temperature. GAPDH was used as the endogenous control. The bands were visualized and quantitated using the ECL Advance Detection System (Millipore, Billerica, MA, USA).
-
Total RNA was extracted using TRIzol Reagent (TAKARA, Japan) according to the manufacturer’s instructions. First-strand cDNA was generated using the PrimeScript RT reagent Kit (TAKARA). qPCR was performed using SYBR Premix Ex Taq Kits (Takara, Dalian, China) according to the manufacturer’s introductions. For real-time PCR analysis, the following primers were used: LIMK-1 forward, 5'-AGATGAGGCTGGGATGGACA-3', reverse, 5'-GTGGAGCACTCCAAGCTGTACT-3'; LIMK-2 forward, 5'-AAGCTCTACTGCCCCAAGGA-3', reverse, 5'-ATATGCAT CCCCATCCTCAA-3'; SSH-1 forward, 5'-AGTCTTCAGCACCCCCACAA-3', reverse, 5'-GTCTTCGCAACGCAGAAGGT-3'; SSH-2 forward, 5'-TCTCTGGAGCGACACGCTAA-3', reverse, 5'-CACATTGCCTGCACAGATACA-3'; SSH-3 forward, 5'-CTTGCCCCTCTGGAGTGACA-3', reverse, 5'-TGGATGGAGATGGGCTTGAA-3'; TESK-1 forward, 5'-GGCCGAAAAGATTCCTGTGT-3', reverse, 5'-CAGCTCACCCCGTAACACCT-3'; and TESK-2 forward, 5'-GCATTTGCCTTGGACTGTGA-3', reverse, 5'-CTTCTCAGCCAGGCCAAAGT-3'. The reference gene β-actin was used as the internal control for RNA quality. The 2−ΔΔCt method was used to evaluate the gene expression fold change among the groups. All experiments were performed in triplicate.
-
SKOV3 cells were transfected with plasmids and shRNA for 24 h. Then, cells were seeded into 96-well plates at a density of 4 x 10³ cells/well. SKOV3 cells were exposed to paclitaxel at various concentrations (0, 2, 10, 20, 50, 100, and 200 nmol/L) for another 72 h after adhering to the plates. The Cell Counting Kit-8 (CCK-8) solution was added into each well at 0, 24, 48, and 72 h, and the cells were incubated in a 5% CO2 incubator at 37 ˚C for 2 h. Finally, the OD value was measured at 450 nm using a microplate reader (Bio-Tek, Winooski, VT, USA) and surviving fractions were calculated. Cell survival was calculated by normalizing the absorbance of untreated controls. The half-maximal inhibitory concentration (IC50) was used to reflect cell viability following paclitaxel treatment. The IC50 was obtained from the dose-response curves using Graph-Pad Prism 5.0 program (GraphPad Software, Inc.).
-
At 48 h after transfection with WT, S3D, S3A, shCFL1, and control vectors, 5 × 10⁵ cells/well were seeded into six-well plates. The cells were scraped with a 200 µL pipette tip when they achieved 90% confluency. After washing with phosphate-buffered saline, the scraped cells were then cultured for another 24 h. Images were captured at 0 and 24 h under a light microscope. All experiments were performed in triplicate.
Cellular invasion assay was performed using Matrigel Invasion Chambers (BD Biosciences) with inserts containing an 8 µm pore-sized membrane with a thin layer of Matrigel. Cells were seeded into the upper chamber of 24-well Transwell plates at a density of 5 x 10⁴ cells/well with serum-free medium after transfection. The bottom chamber was filled with 500 µL completed medium containing 10% fetal bovine serum. The Transwell-containing plates were incubated for 8 h. The upper chamber was washed, fixed with 70% ethanol, and stained with 0.1% crystal violet (Solarbio, C8470) for 20 min at room temperature. The cells remaining on the upper surface of the filter membrane were removed with a cotton swab. The invasive cells on the bottom of the membrane were stained and three different fields of stained cells were counted under a light microscope.
-
Prior to exposure to 10 nmol/L paclitaxel, all cells in exponential growth phase were transfected with overexpression and knockdown plasmids for 48 h. The degree of apoptosis was measured using an Annexin V Apoptosis Detection Kit (BD Biosciences, San Diego, CA, USA), according to the manufacturer’s protocol. The harvested cell suspension was incubated with annexin V for 15 min at room temperature in the dark and then detected by FACSC Calibur flow cytometry (BD Biosciences). The cell apoptosis rate was analyzed using CellQuest software (BD Biosciences).
-
For IHC analysis, we obtained formalin-fixed and paraffin-embedded tissue samples from 108 patients with FIGO stage I–IV EOC. All EOC patients involved underwent primary cytoreduction and subsequent paclitaxel-based chemotherapy in our hospital between February 2013 and June 2016. The date of the latest record retrieved was June 30, 2019. The clinical characteristics, pathologic diagnoses, and outcome information were collected from the patients' medical records and pathologic slides. The clinical and pathological features are shown in Table 1. Overall survival time (OS) was calculated as the time from surgery to the last follow-up date or death. Progression-free survival time (PFS) was calculated as the time from surgery to the time of detected recurrence or progression. Both OS and PFS were calculated from the date of pathologic diagnosis. EOC patients with PFS ≤ or > 6 months were divided into "sensitive" and "resistant" to paclitaxel-based chemotherapy groups, respectively. This study has been approved by the Beijing Hospital Medical Ethics Committee (BJ-2019BJYYEC-029-01) and registered at www.chictr.org.cn. Analysis of IHC was performed as previously described[7], with anti-p-CFL-1 (1:300) and anti-SSH-1 (1:100) antibodies. All staining was performed with HRP-conjugated anti-mouse or anti-rabbit IgG secondary antibody and visualized by DAB. Dr. Z. W. confirmed all of the pathological diagnoses, and was blinded to the clinical parameters. Staining was scored using a Foutier scale according to the percentage of positive cells and staining intensity: (−) or 0, tissue specimens without staining (0%–10%); (+) or 1, tissue specimens with weak staining (10%–25%); (++) or 2, tissue specimens with moderate staining (25%–50%) and (+++) or 3, tissue specimens with strong staining (> 50%). (−) and (+) were defined as low expression, and (++) and (+++) were defined as high expression (or overexpression)[7].
Clinicopathologic features Relative p-CFL-1 level χ2 value P value Relative SSH-1 level χ2 value P value Low, n (%) High, n (%) Low, n (%) High n (%) Age (y) < 60 26 (60.47) 17 (39.53) 1.694 0.193 23 (53.49) 20 (46.51) 0.038 0.846 ≥ 60 31 (47.69) 34 (43.31) 36 (55.38) 29 (44.62) FIGO staging I–II 20 (57.14) 15 (42.86) 0.396 0.529 17 (48.57) 18 (51.43) 0.767 0.381 III–IV 37 (50.68) 36 (49.32) 42 (57.53) 31 (42.46) Differentiation G1-2 28 (70.00) 12 (30.00) 7.605 0.020* 21 (42.50) 29 (57.50) 5.992 0.014* G3 29 (42.65) 39 (57.35) 38 (61.76) 20 (38.24) Chemotherapy response Sensitive 45 (61.64) 28 (38.36) 7.105 0.008** 34 (46.58) 39 (53.42) 5.896 0.015* Resistant 12 (34.29) 23 (65.71) 25 (71.43) 10 (28.57) Note. *P < 0.05, **P < 0.01. Table 1. Correlation between the clinicopathological features of EOC patients and the expression of SSH-1 or p-CFL-1
-
Statistical analysis was performed with SPSS 22.0 and GraphPad Prism 5.0 software. The data were expressed as mean ± SD/SEM (M ± s/sx). Student's t-test and one or two-way ANOVA were used as appropriate for experiment and treatment groups. The correlation between p-CFL-1 and SSH-1 expression in EOC patient tissues was analyzed by Spearman's χ2 test. Survival curves were generated according to the Kaplan–Meier method, and statistical analysis was performed using the log-rank test. A P-value of less than 0.05 was regarded as statistically significant.
-
This study was approved by the Ethics Committee of Beijing Hospital (2019BJYYEC-029-01) and was registered at www.chictr.org.cn (ChiCTR1900021718). Written informed consent was obtained from all participants.
-
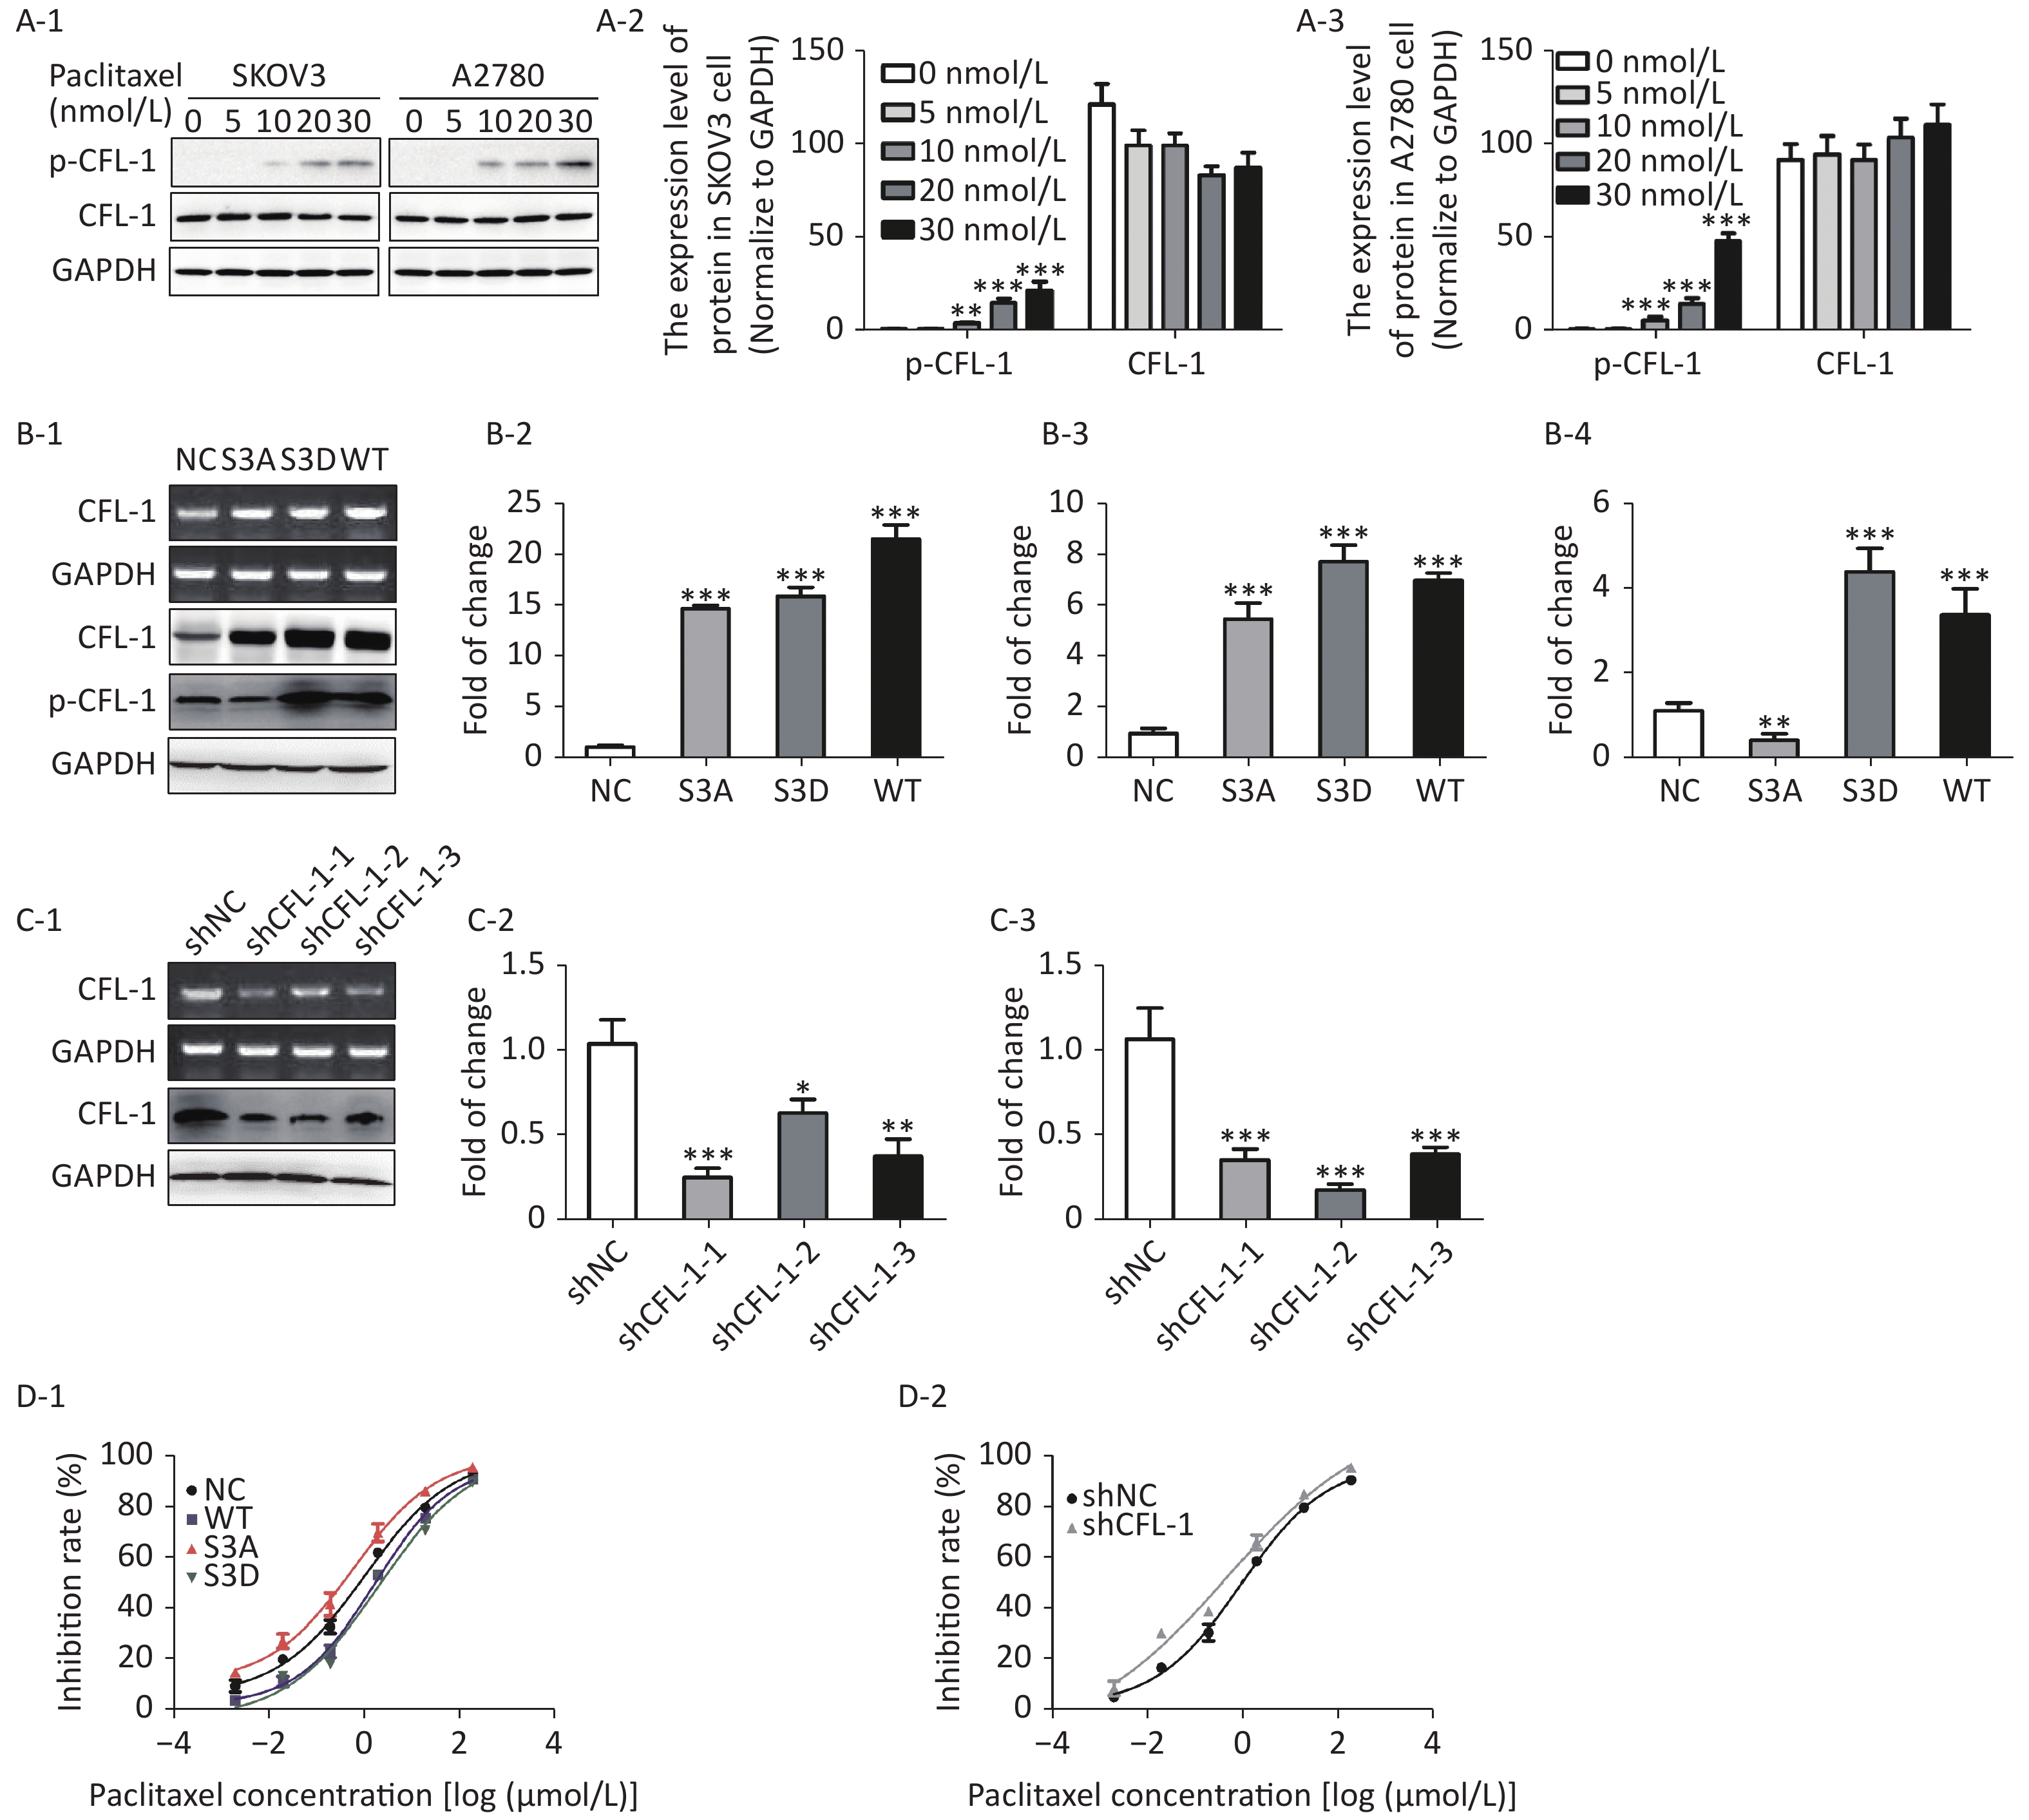
With increased paclitaxel concentration, the levels of p-CFL-1 in A2780 and SKOV3 cells increased accordingly. However, there was no significant change in the content of total CFL-1 protein (Figure 1A). To further determine the relationship between p-CFL levels and paclitaxel treatment response, we transfected plasmids that could modify the phosphorylation state of CFL-1 into SKOV3 cells. Compared with cells transfected with the control vector, the cells overexpressing wild type CFL (WT) and p-CFL-1 (S3D) were more resistant to paclitaxel, as demonstrated by a lower cell inhibition rate [(IC50, (1.709 ± 0.086) vs. (1.068 ± 0.110) μmol/L, P = 0.003, (2.077 ± 0.189) vs. (1.068 ± 0.110) μmol/L, P = 0.002)]. By contrast, the mutant S3A with downregulated p-CFL-1 production showed higher sensitivity to drug exposure [(IC50, (0.607 ± 0.148) vs. (1.068 ± 0.110) μmol/L, P = 0.001)]. (Figure 1B, 1D-1). Similarly, when CFL-1 expression was knocked down by shRNA technology, SKOV3 cells were more sensitive to paclitaxel [(IC50, (0.484 ± 0.327) vs. (0.962 ± 0.094) μmol/L, P = 0.005)] (Figure 1C, 1D-2). Collectively, these results indicated that elevated p-CFL-1 levels are implicated in a compromised paclitaxel response.
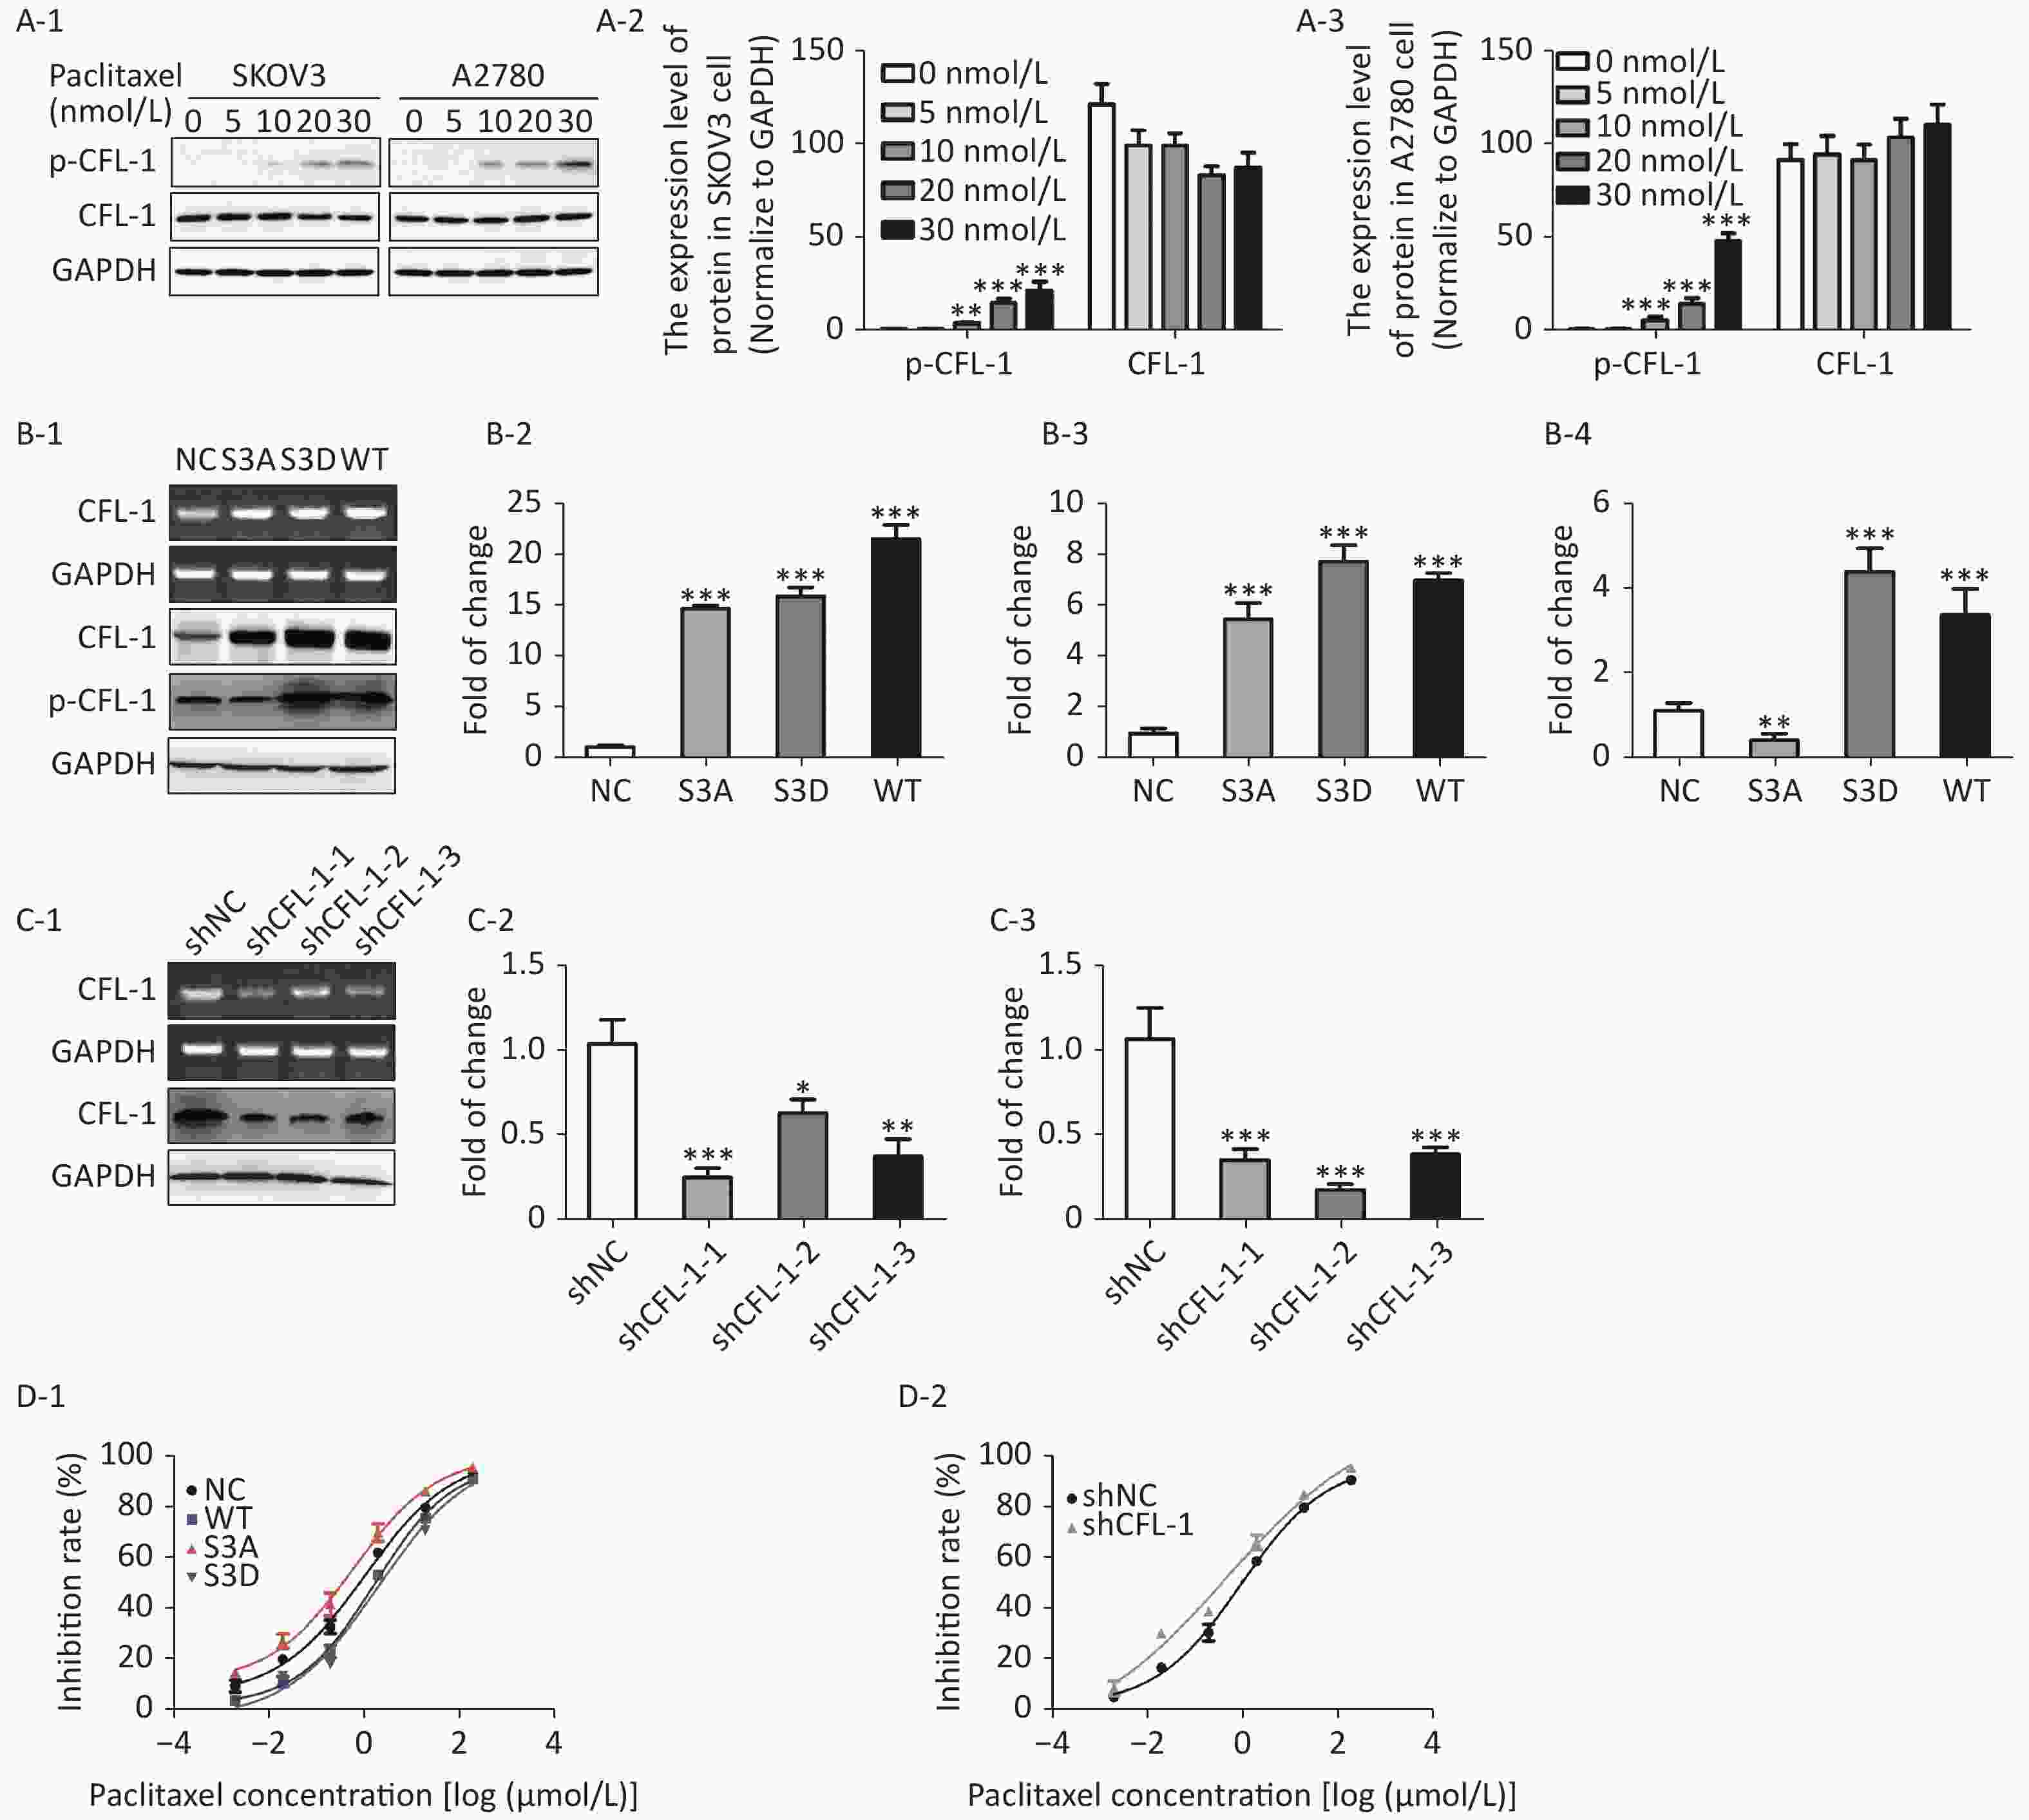
Figure 1. Effects of p-CFL-1 on paclitaxel resistance of EOC cells.
-
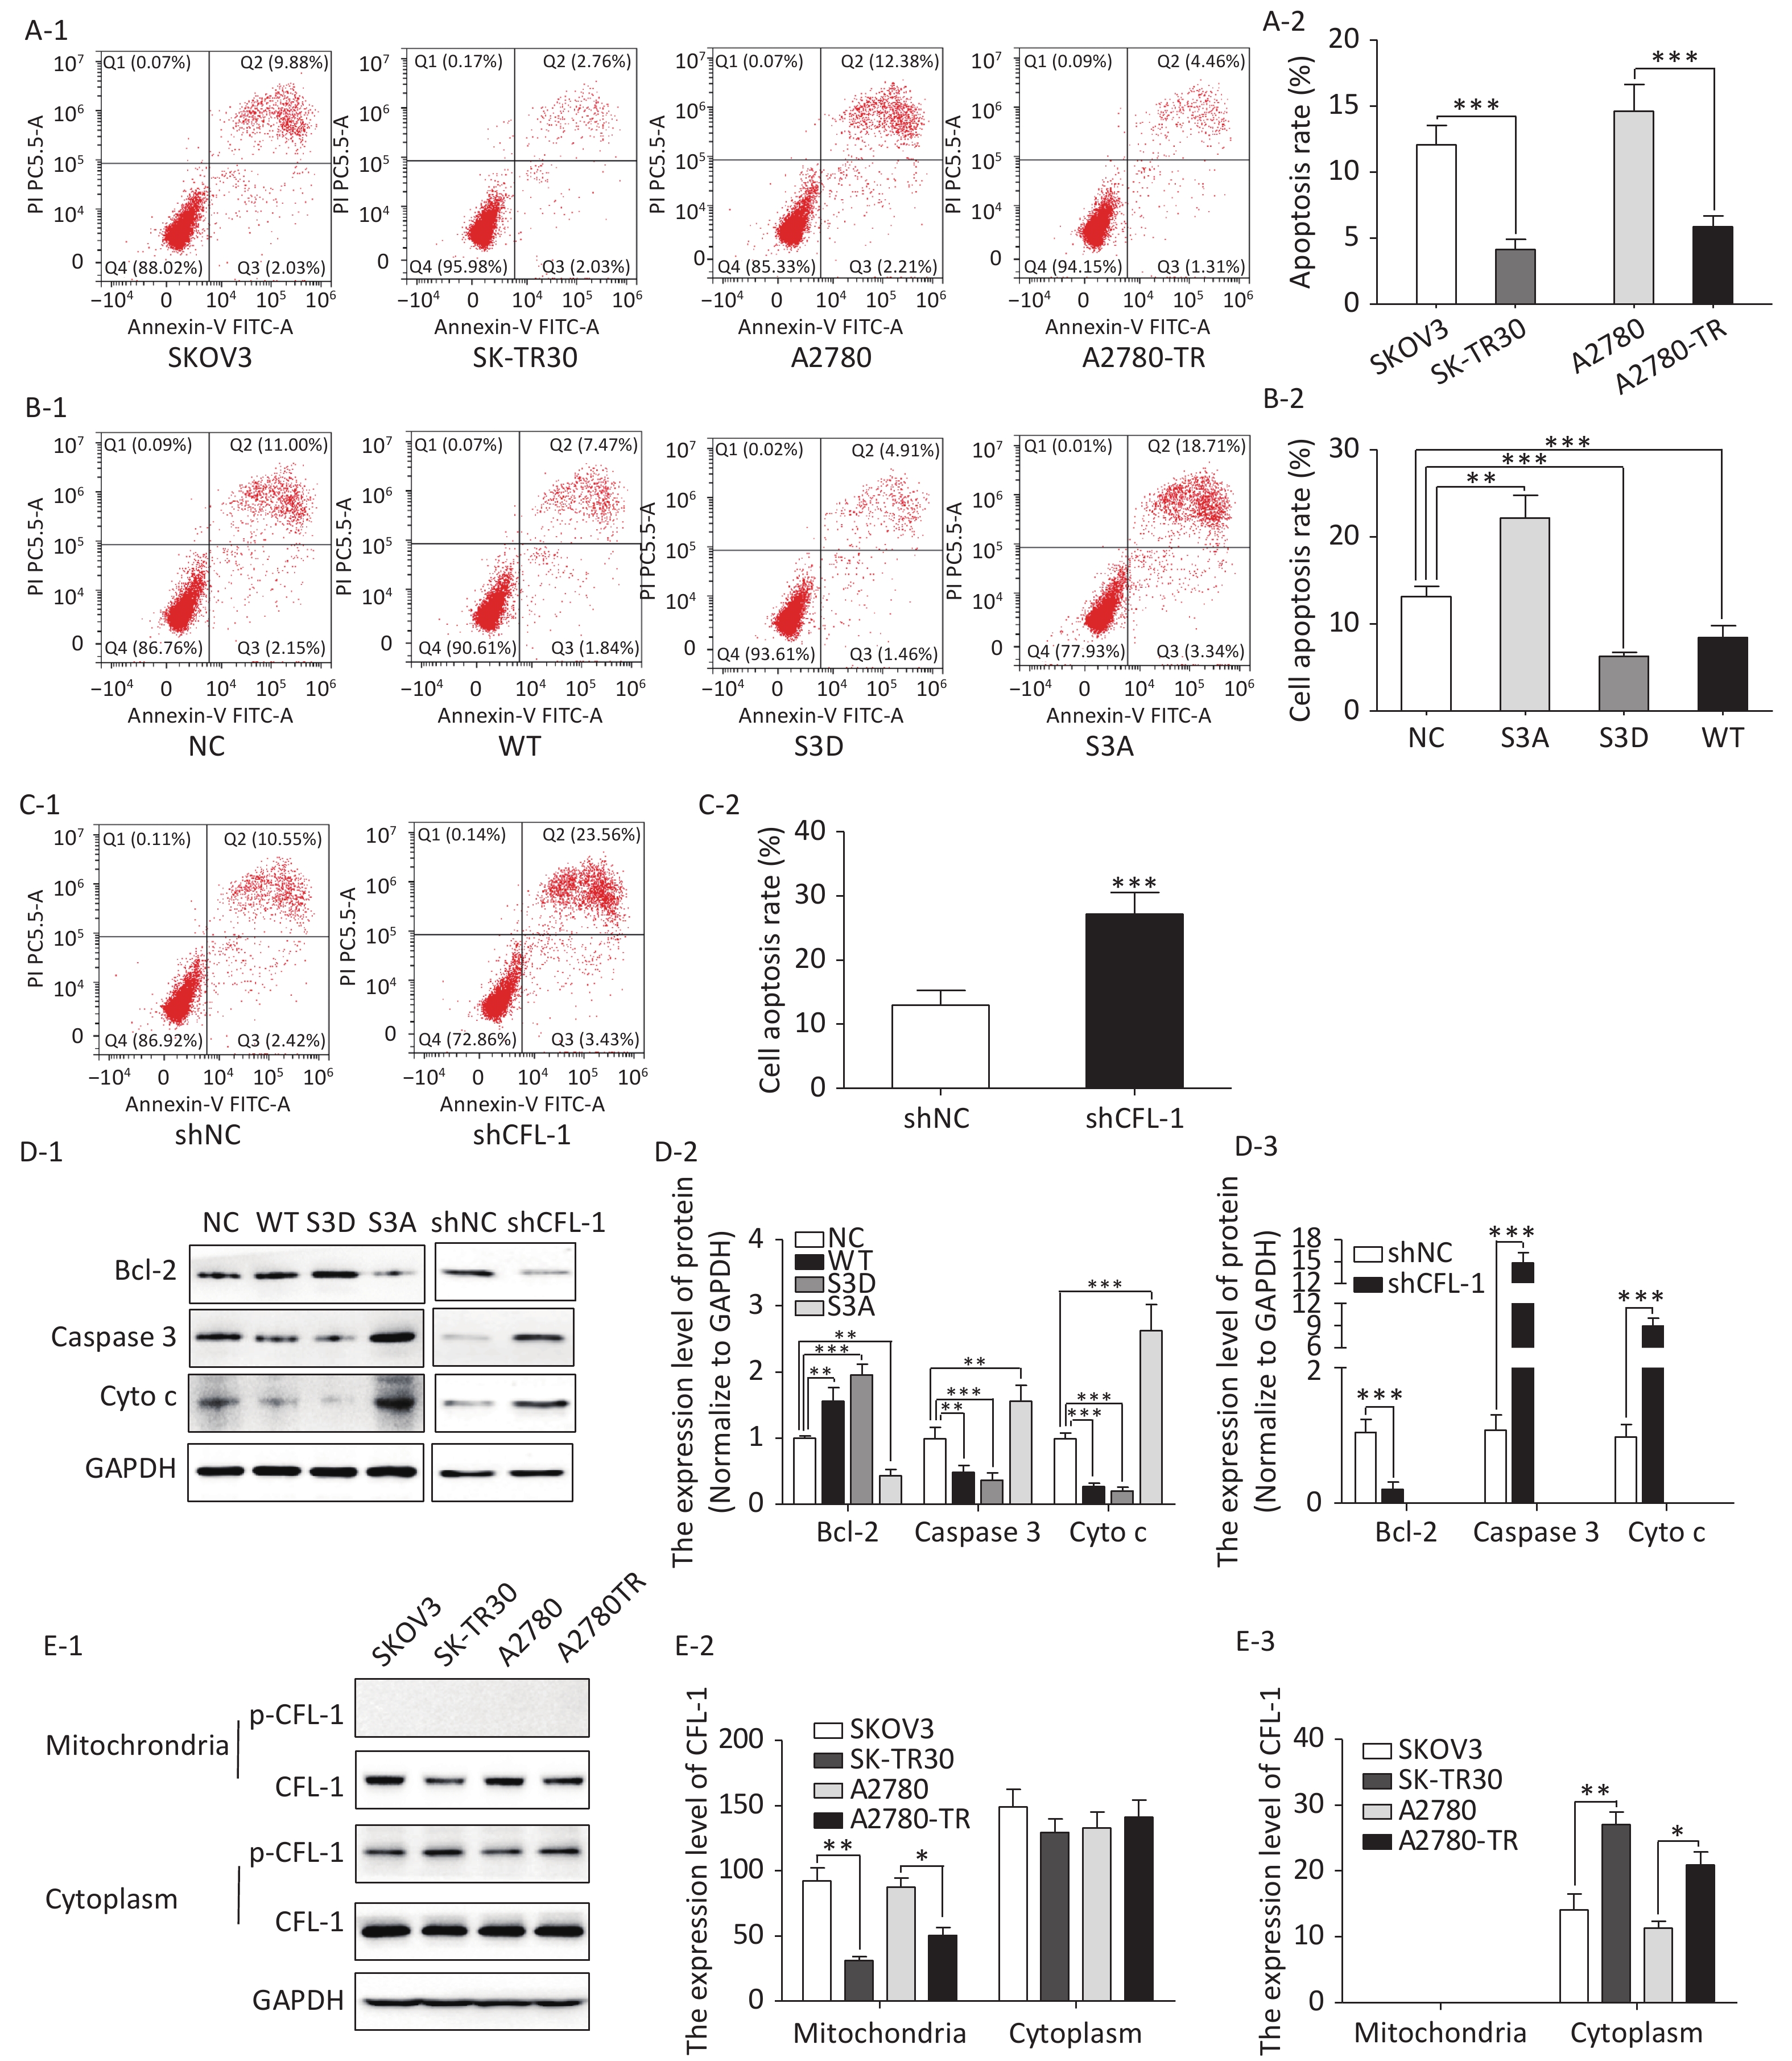
We observed a remarkable difference in apoptosis rates between paclitaxel-resistant (SK-TR30 and A2780-TR) and paclitaxel-sensitive (SKOV3 and A2780) cell lines as assessed by flow cytometry with annexin V/propidium iodide (PI) double staining. Following treatment with 10 nmol/L paclitaxel for 24 h, the rates of apoptosis of paclitaxel-resistant cell lines were significantly lower than those of the corresponding sensitive cell lines [SK-TR30 vs. SKOV3, (4.11% ± 0.78%) vs. (12.07% ± 1.47%), P = 0.01; A2780-TR vs. A2780, (5.84% ± 1.23%) vs. (14.60% ± 2.50%), P = 0.01] (Figure 2A). These data suggest a putative role of apoptosis inhibition in the mechanism of paclitaxel resistance. To verify our hypothesis that phosphorylated CFL-1 inhibits apoptosis, we detected the apoptosis rate, as well as the expression of apoptosis-specific proteins in the aforementioned mutants that displayed different levels of p-CFL-1. The S3D mutant with upregulated phosphorylated CFL-1 demonstrated a significantly lower apoptosis rate than the S3A mutant that expressed dephosphorylated CFL-1 [S3D vs. S3A, (4.35% ± 0.58%) vs. (17.9% ± 2.36%), P < 0.01, Figure 2B, 2C]. The expression of apoptosis-specific proteins further confirmed the apoptotic effect of p-CFL-1 on SKOV3 cells, including anti-apoptotic regulator (Bcl-2) and apoptosis biomarkers (cytochrome c and caspase-3). Western blotting showed that expression of Bcl-2 was upregulated and expression of cytochrome c and caspase-3 was downregulated in the S3D mutant group compared with the control group (Figure 2D). Conversely, the S3A mutant and CFL-1 knockdown groups demonstrated downregulated Bcl-2 and upregulated cytochrome c and caspase-3 levels compared with the control group (Figure 2D).
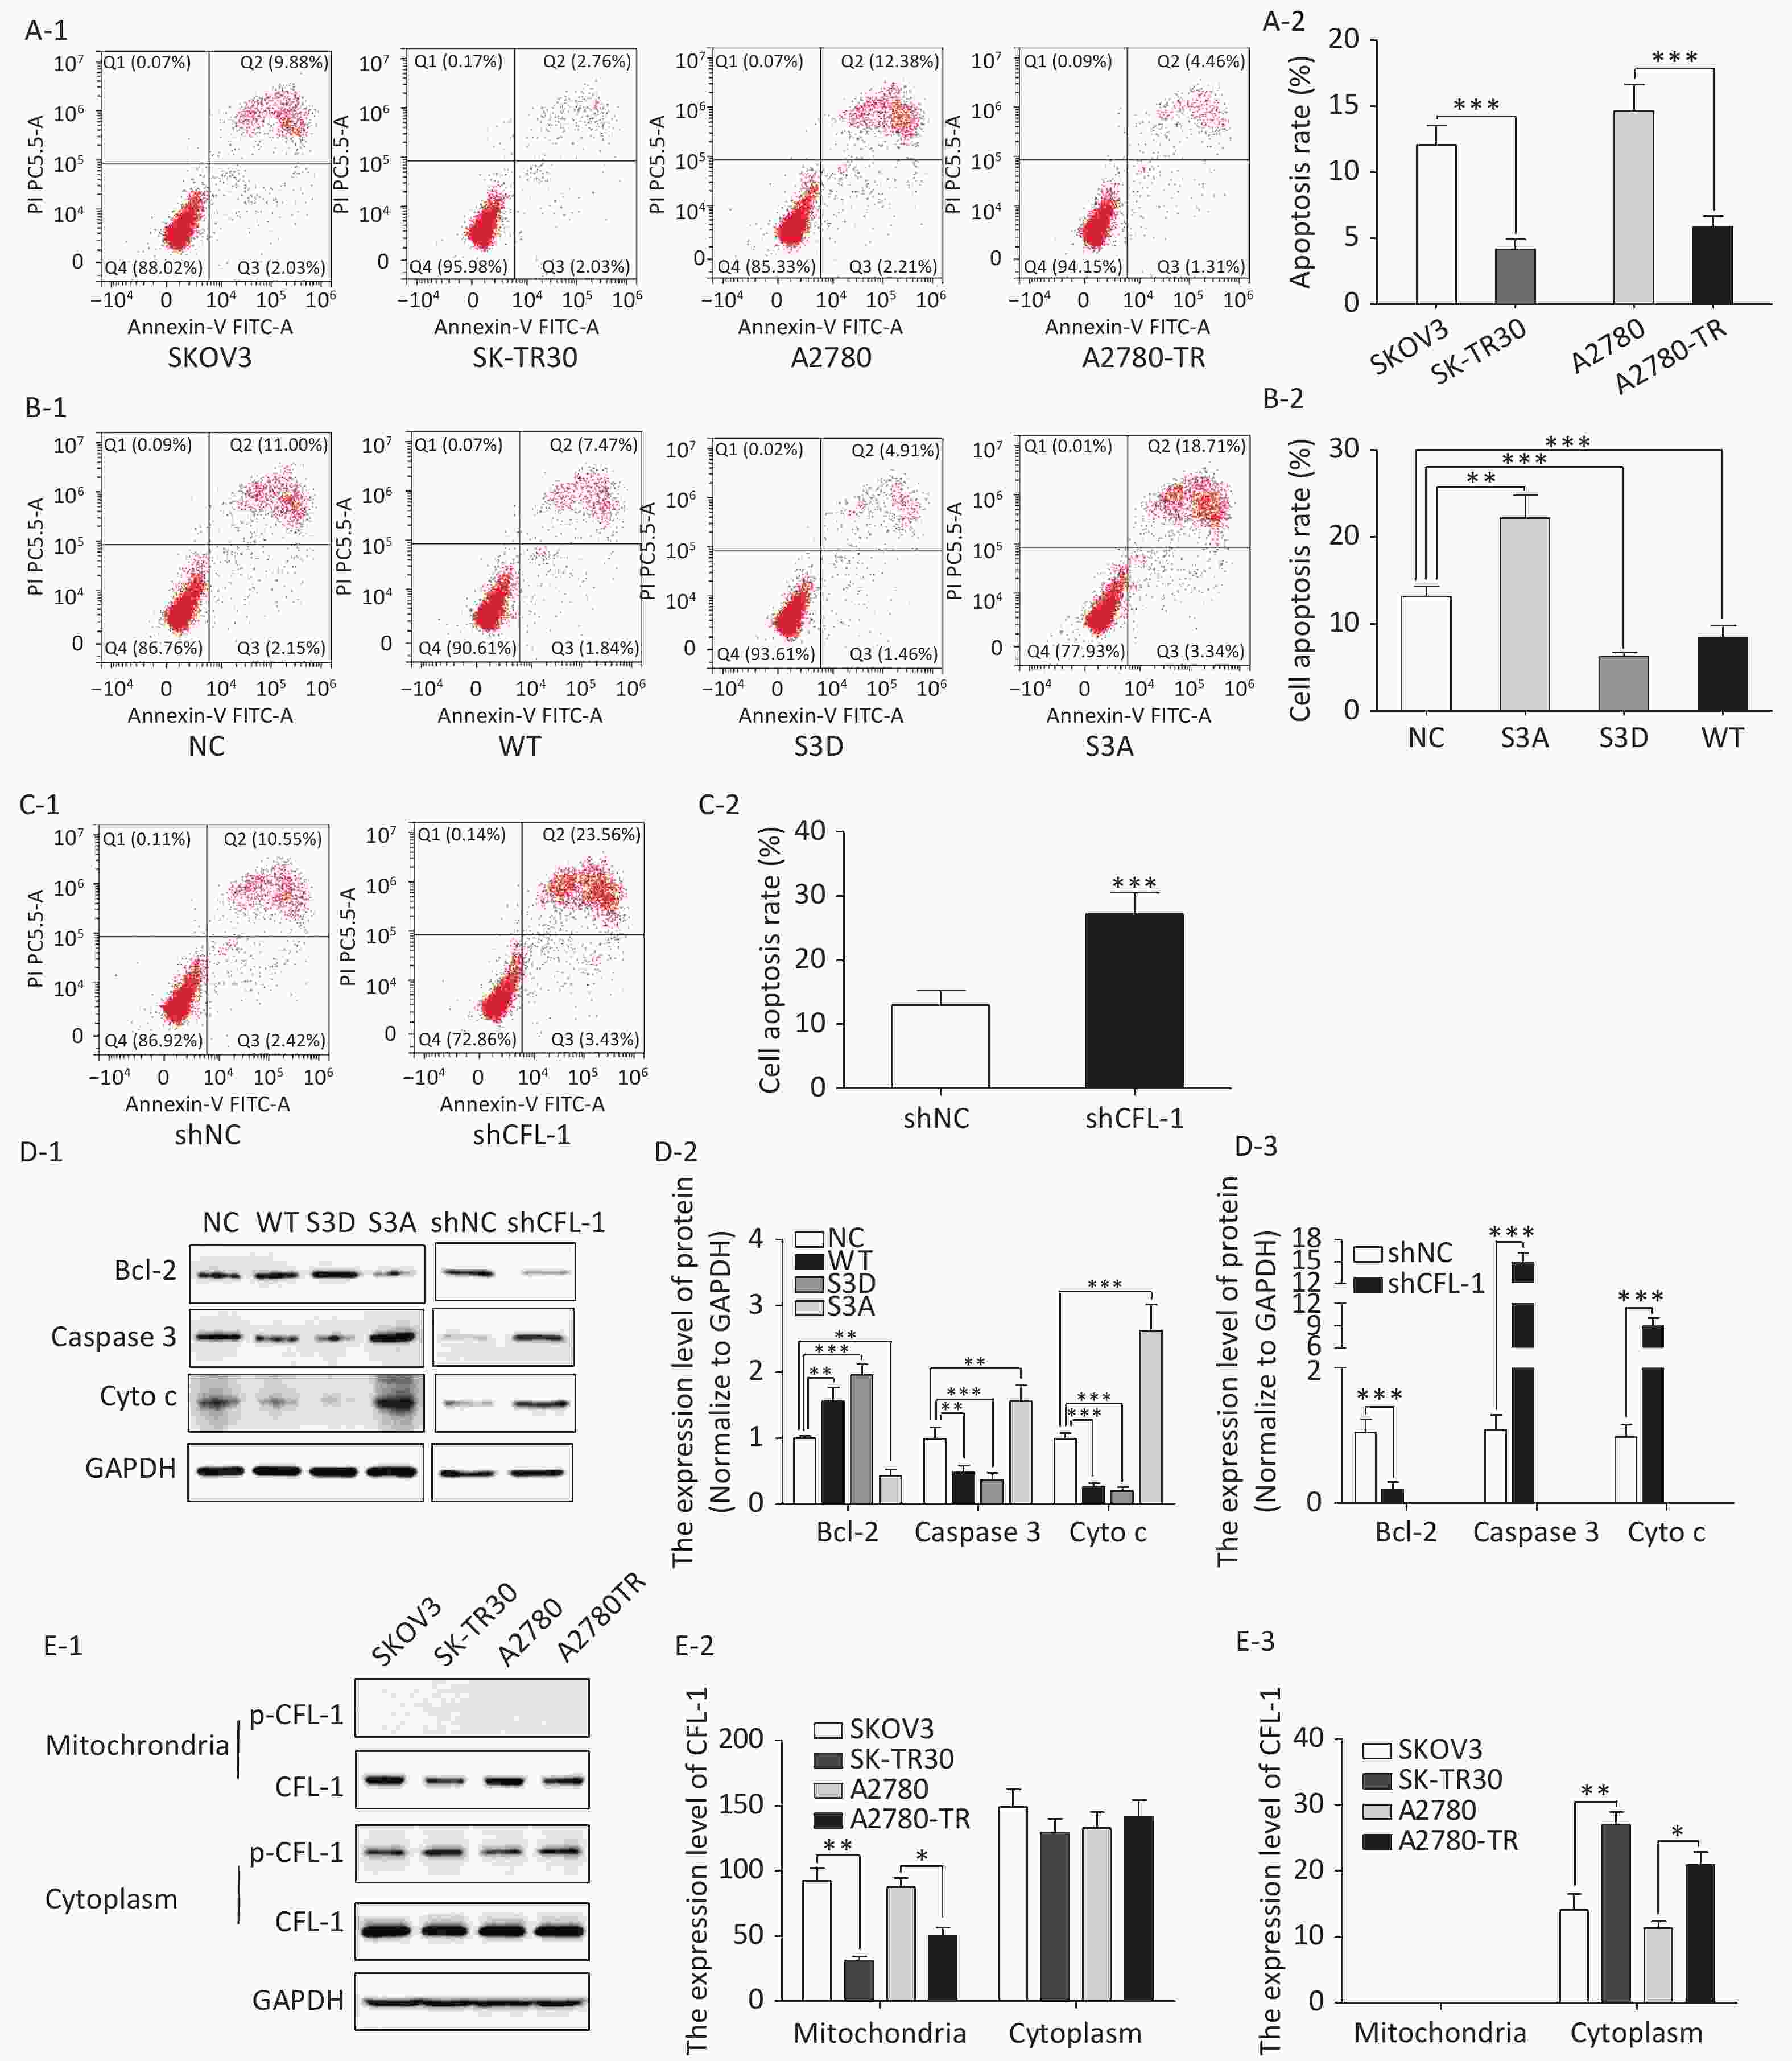
Figure 2. Phospharylated-CFL-1 in the cytoplasm was associated with mitochondrial apoptosis under paclitaxel treatment.
Previous studies have shown that mitochondrial translocation of dephosphorylated CFL, the only form able to enter the mitochondria, induces apoptosis[17-20]. To further elucidate how different phosphorylation states of cofilin and their respective distribution contribute to the paclitaxel response, we compared the cellular distribution of p-CFL-1 and total CFL-1 in paclitaxel-resistant and -sensitive EOC cell lines. Although there was no significant difference in cytoplasmic CFL-1 expression between paclitaxel-resistant and -sensitive cells, a significant decrease in mitochondrial CFL-1 expression was detected in SK-TR30 and A2780-TR cells, consistent with previous studies (Figure 2E-1, 2E-2). Expression of p-CFL-1 in paclitaxel-resistant cell lines mainly localized to the cytoplasm compared with paclitaxel-sensitive cell lines. Expression of p-CFL-1 was not detected in the mitochondria of all experimental groups (Figure 2E-1, 2E-3). Therefore, we speculated that p-CFL is prevented from mitochondrial translocation to further induce apoptosis, and thus accumulates in the cytoplasm, enabling the cell to survive paclitaxel treatment.
-
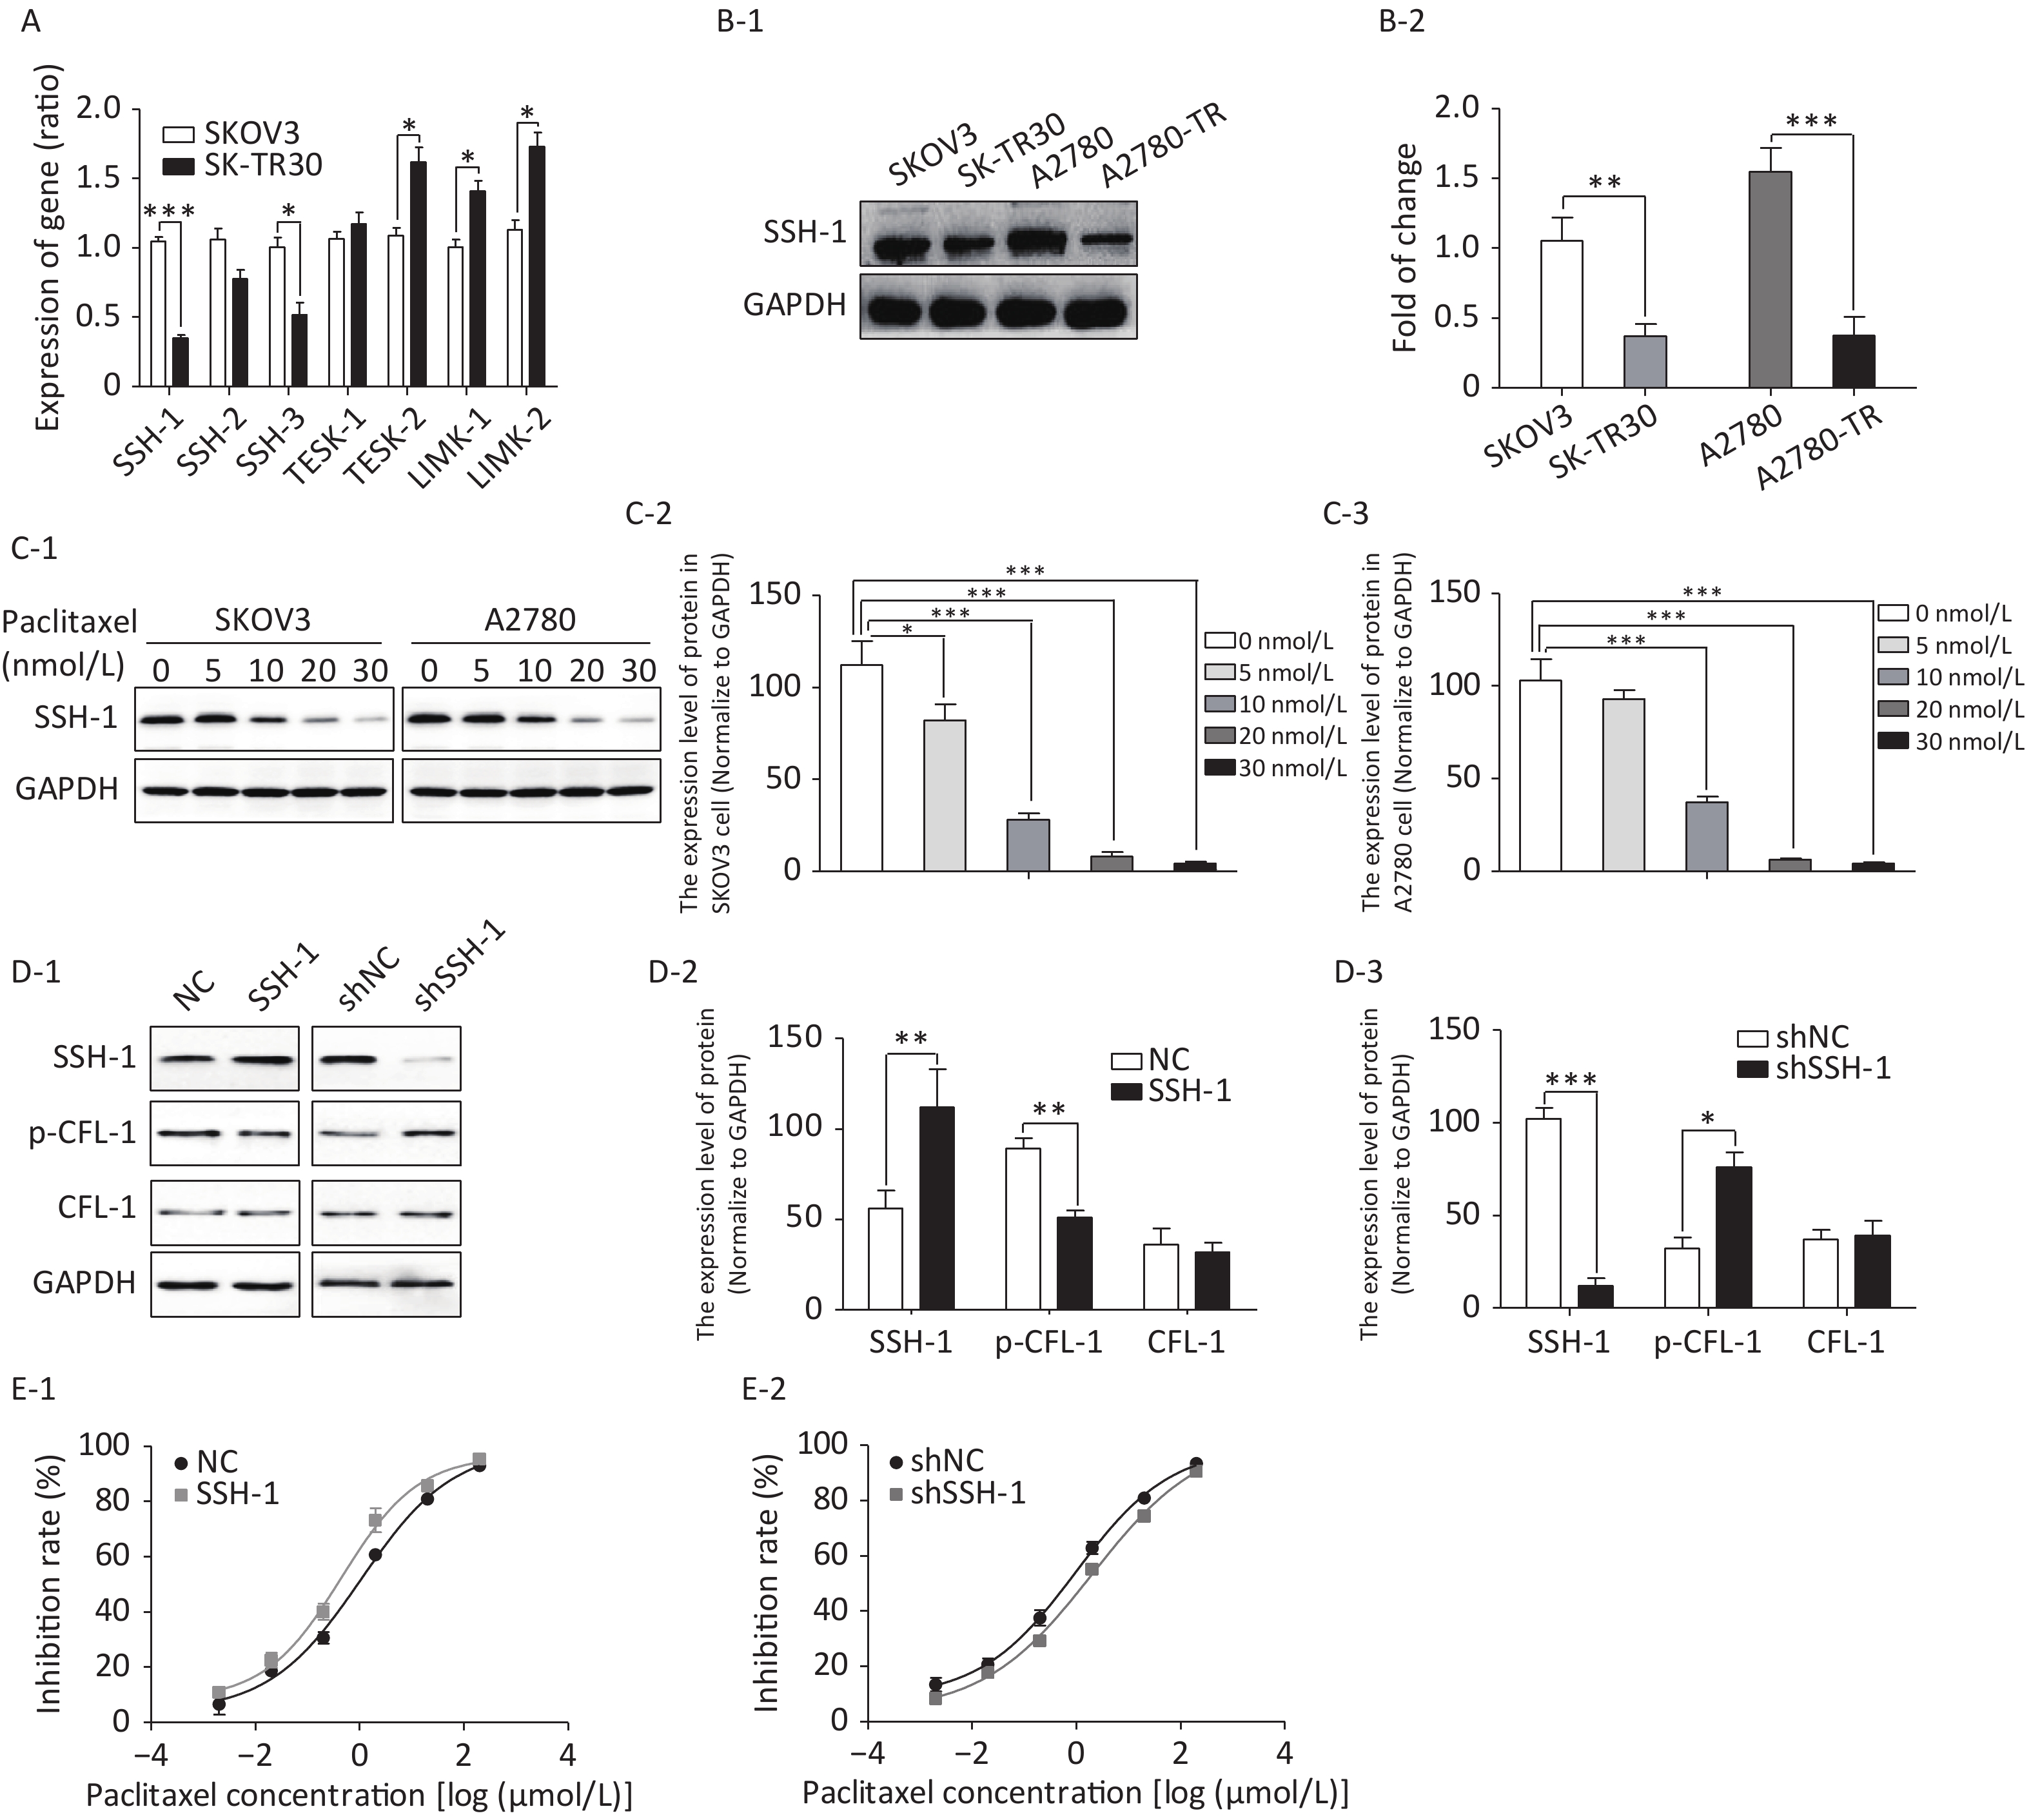
We detected gene expression of four CFL phosphokinases (LIMK-1, LIMK-2, TESK-1, and TESK-2) and three CFL phosphatases (SSH-1, SSH-2, and SSH-3) in SK-TR30 and SKOV3 cells. Expression of SSH-1 and SSH-3 was downregulated, while expression of TESK-2 and LIMK-2 was upregulated in SK-TR30 cells (Figure 3A). SSH-1 was selected for further study as it exhibited the largest difference in gene expression between paclitaxel-resistant and -sensitive cells.
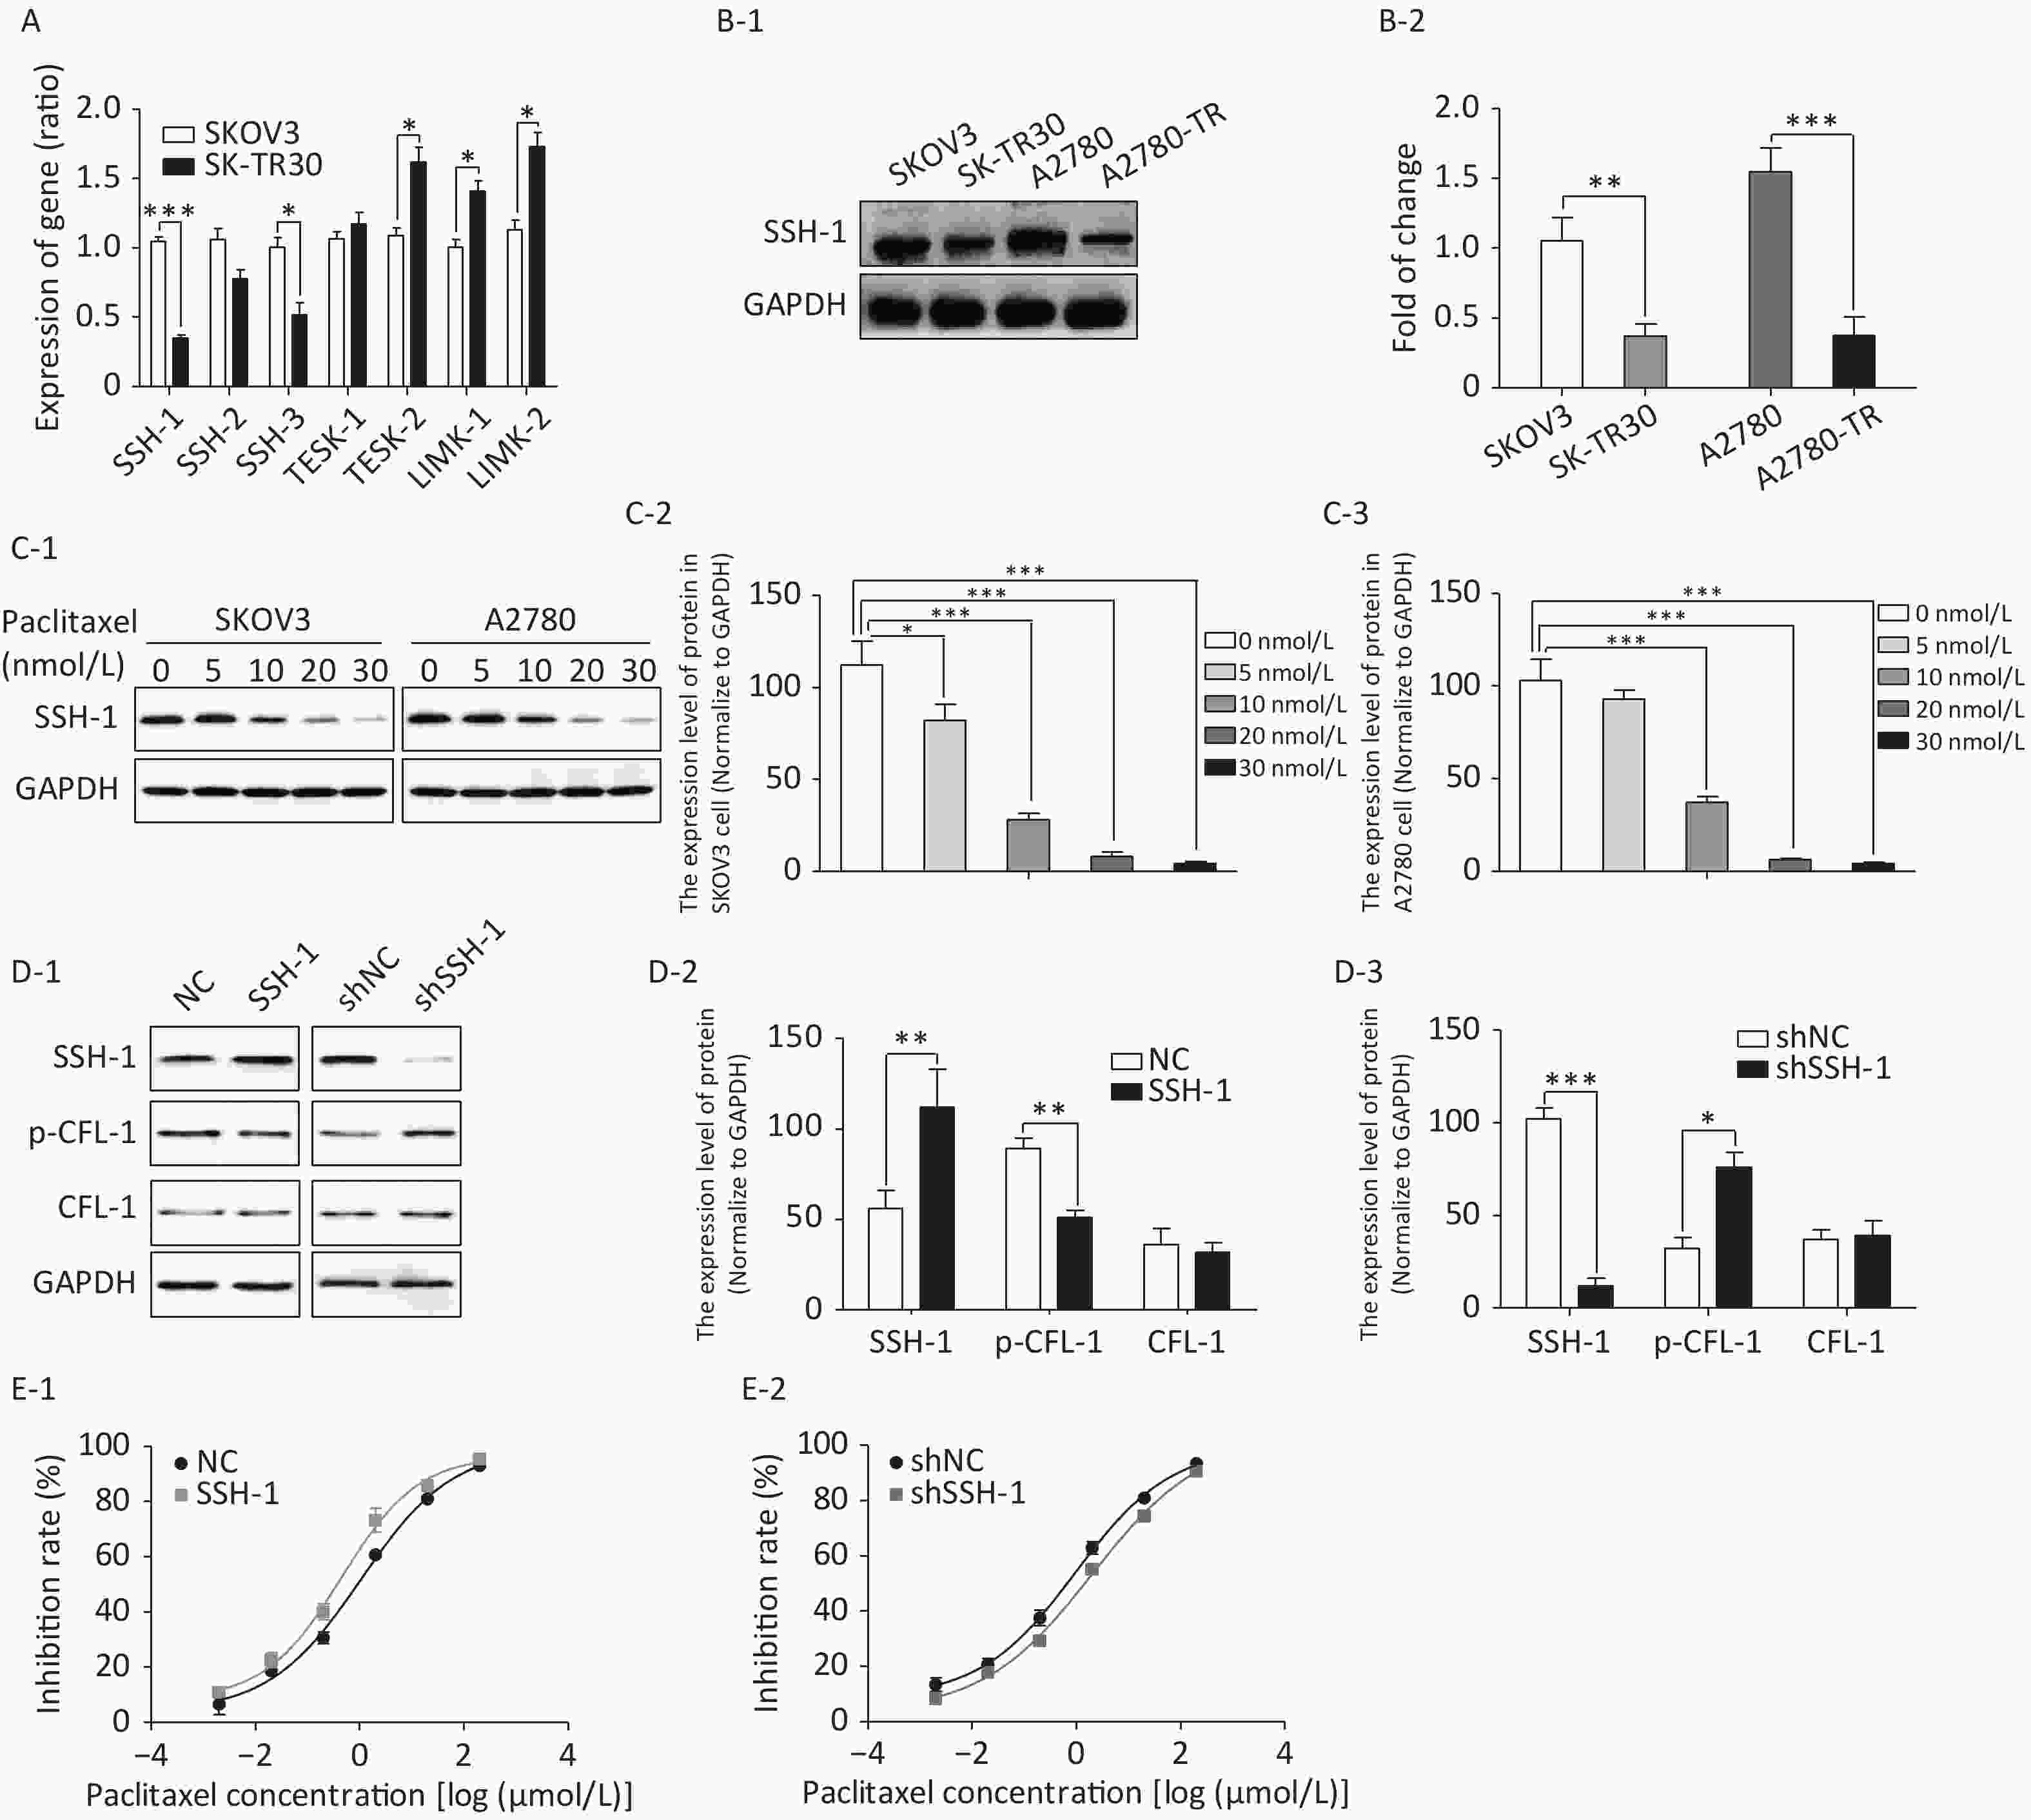
Figure 3. SSH-1 was responsible for upregulating p-CFL-1 to protect SKOV3 cells against paclitaxel.
The expression of SSH-1 in SK-TR30 and A2780-TR cells was substantially lower than that in SKOV3 and A2780 cells, and decreased gradually with increasing paclitaxel concentration (Figure 3B, 3C). In addition, there was a negative correlation between the level of SSH-1 and the level of p-CFL-1 (Figure 3D). We also found that overexpression of SSH-1 enhanced the killing effect of paclitaxel on SKOV3 cells, while knocking down SSH-1 had a protective effect against paclitaxel, contrary to the effect of p-CFL-1 as shown by the cytotoxicity assay (Figure 3E). Altogether, these data demonstrated that paclitaxel could trigger changes in SSH-1/p-CFL-1 signaling, which made EOC cells prone to paclitaxel resistance.
-
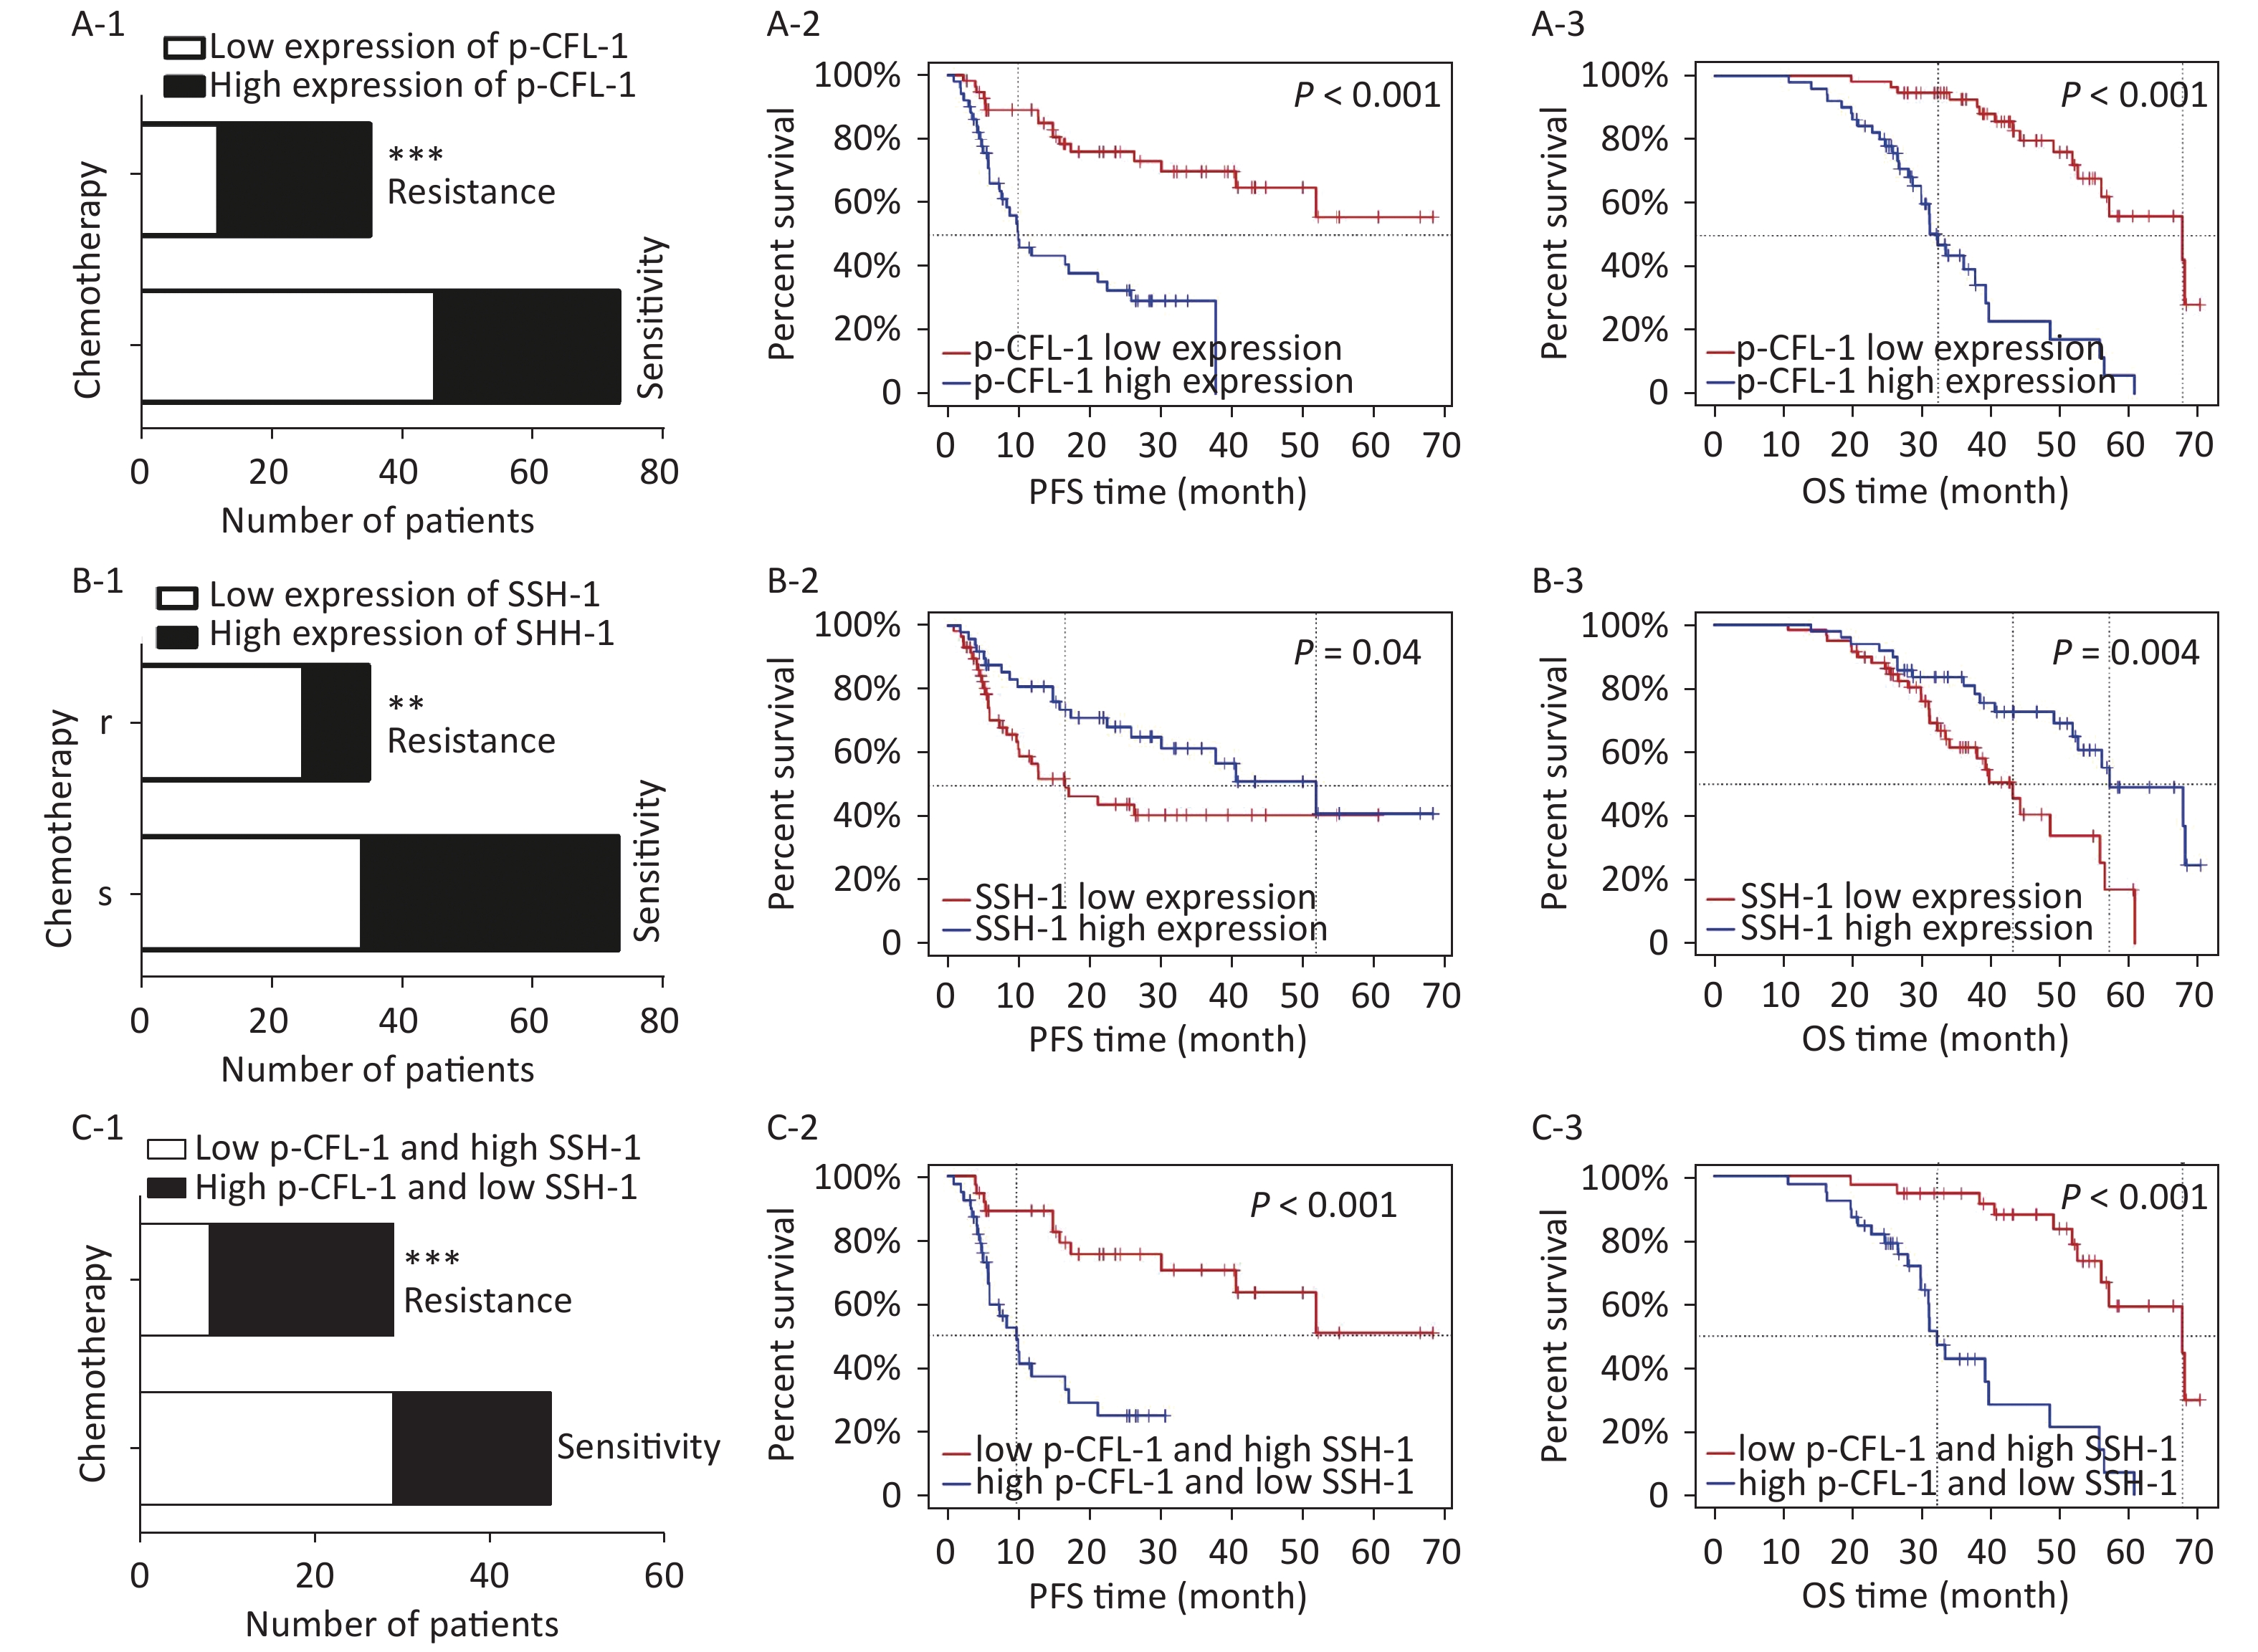
To determine the clinical relevance of SSH-1/p-CFL-1 signaling, we investigated 108 EOC patients, including 73 patients with chemo-resistance and 35 patients with chemo-sensitivity, all of whom underwent radical surgery followed by paclitaxel-based chemotherapy. The levels of p-CFL-1 and SSH-1 protein were analyzed by immunohistochemistry staining of tissue samples. The clinical characteristics of patients and the results of IHC analysis are shown in Table 1. High expression of p-CFL-1 was negatively correlated with the differentiation of ovarian cancer, while expression of SSH-1 was positively correlated with the differentiation of EOC. As shown by immunohistochemistry staining, 65.71% (23/35) of chemo-resistant patients had high levels of p-CFL-1, and 71.43% (25/35) of chemo-resistant patients had low expression of SSH-1 (Figure 4A-1, 4B-1; Table 1). Only 38.36% (28/73) of the patients had high expression of p-CFL-1, and 46.58% (34/73) of the patients had low expression of SSH-1 in the chemo-sensitive group, which was vastly different from that in the paclitaxel-resistant group. The coexistence of a low SSH-1 level and a high p-CFL-1 level accounted for 24.66% (13/73) of chemo-sensitive patients and 60.00% (21/35) of chemo-resistant patients with significant differences (χ2= 8.355, P = 0.008) (Figure 4C-1). Spearman's correlation analysis showed that there was a strong negative correlation between the low level of SSH-1 and the high level of p-CFL-1 expression in chemo-resistant patients (r = −0.725, P < 0.001) and a moderate negative correlation in all patients (r = −0.415, P < 0.001).
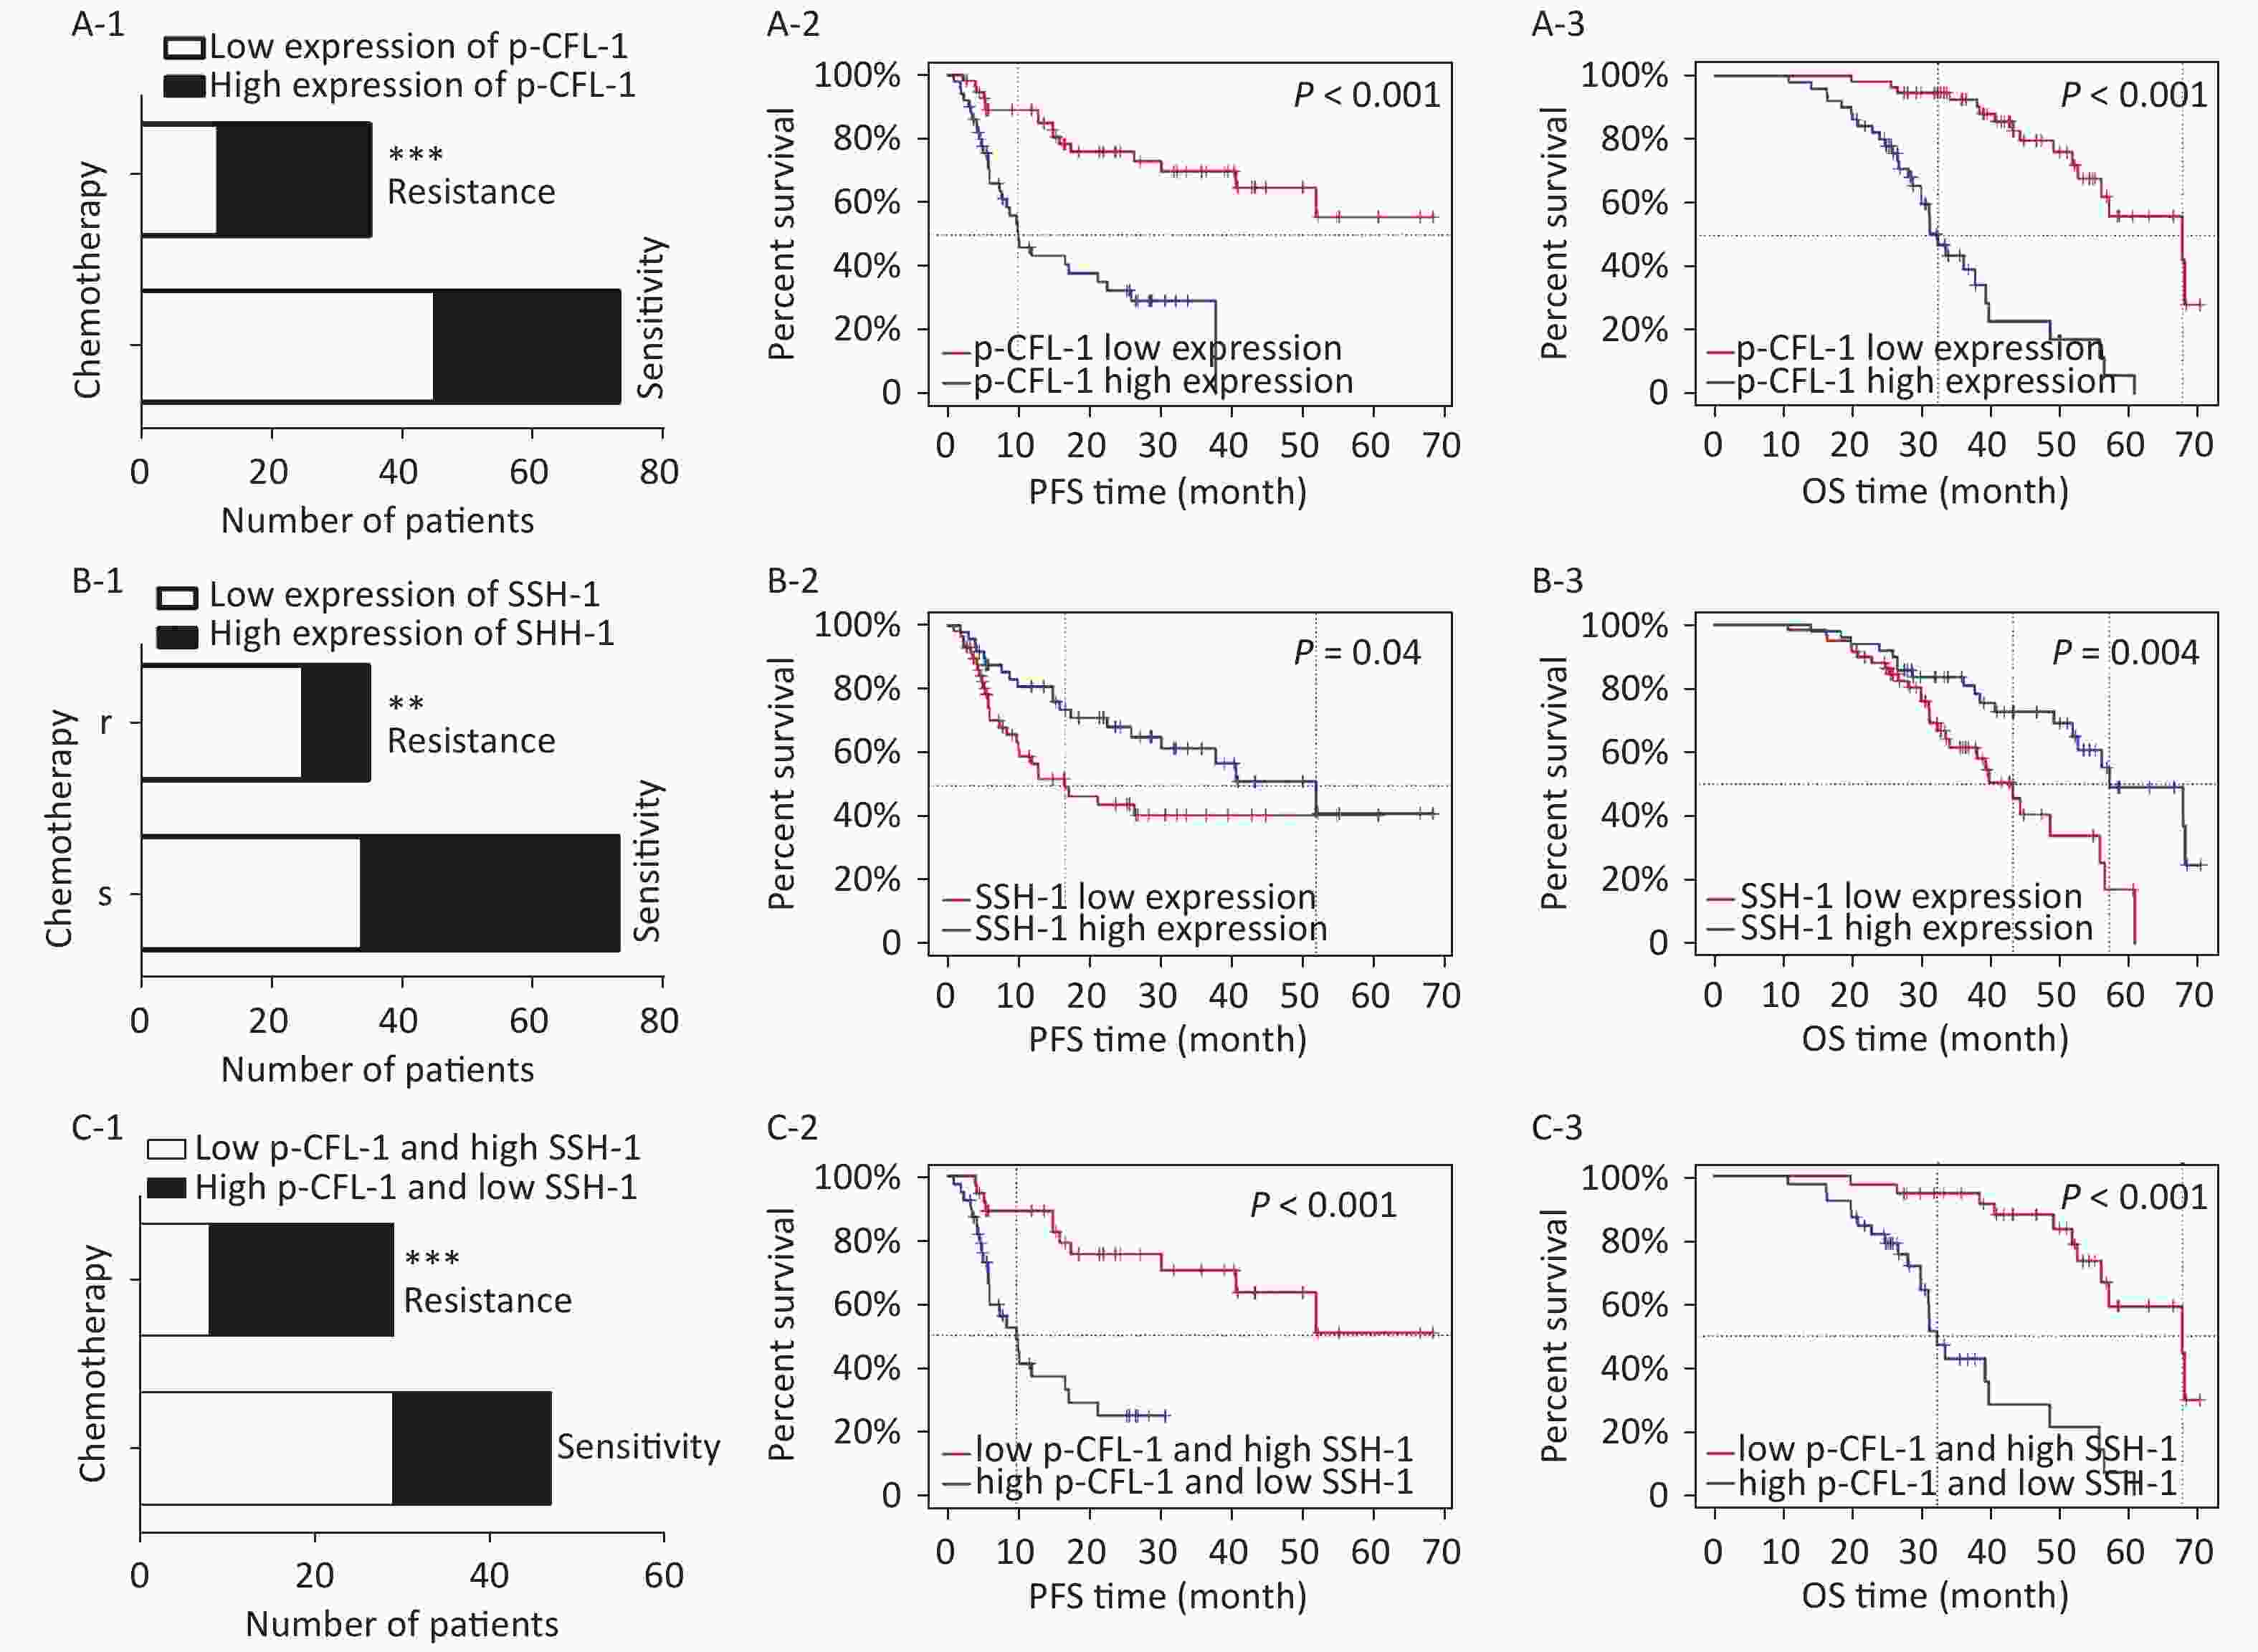
Figure 4. High expression of p-CFL-1 and low expression of SSH-1 in EOC tissues were closely related with the chemotherapy response and prognosis of EOC patients.
Survival analysis was performed to evaluate the relationship between levels of p-CFL-1 and SSH-1 and clinical outcome. We assessed overall survival (OS) and progression-free survival (PFS). As indicated in Figure 4 and Table 2, a high level of p-CFL-1 was significantly correlated with poor prognosis of patients with median OS shortened by 13 months (chemo-resistant group vs. chemo-sensitive group, 34 vs. 47 months, P < 0.001) and PFS shortened by 19 months (8 vs. 26 months, P < 0.001), respectively (Figure 4A-2, 4A-3; Table 2). However, high expression of SSH-1 was markedly correlated with better prognosis of patients, with median OS shortened by 14 months (chemo-resistant group vs. chemo-sensitive group, 38 vs. 52 months, P = 0.004) and PFS shortened by 20 months (10 vs. 30 months, P = 0.04) (Figure 4B-2, 4B-3; Table 2). In addition, patients with both a low level of SSH-1 and a high level of p-CFL-1 showed significantly poorer OS and PFS compared to those with both high SSH-1 and low p-CFL-1 levels (Figure 4C-2, 4C-3; Table 2). These survival data demonstrated that a high level of p-CFL-1 and low level of SSH-1 were closely associated with the poor prognosis of EOC patients.
Chemotherapy response (n) p-CFL-1 high expression SSH-1 low expression OS PFS OS PFS Median time (m) P value Median time (m) P value Median time (m) P value Median time (m) P value Chemo-sensitivity (73) 47 < 0.001*** 26 < 0.001*** 52 0.004** 30 0.04* Chemo-resistance (35) 34 8 38 10 Note. *P ≤ 0.05, **P ≤ 0.01 and ***P ≤ 0.001.OS, overall survival; PFS, progression-free survival. Table 2. Prognosis of 108 EOC patients with high expression of p-CFL-1 or low expression of SSH-1
-
Although a variety of novel therapeutic strategies for EOC have emerged in recent years, the prognosis of EOC has not been markedly improved, especially for patients with chemo-resistance. Explorations of biomarkers predicting chemo-response, the underlying mechanism of chemo-resistance, and measures to reverse such resistance are underway. We previously established an association between the high level of p-CFL-1 and paclitaxel resistance. In this study, we carried out further experiments to illustrate its mechanistic basis.
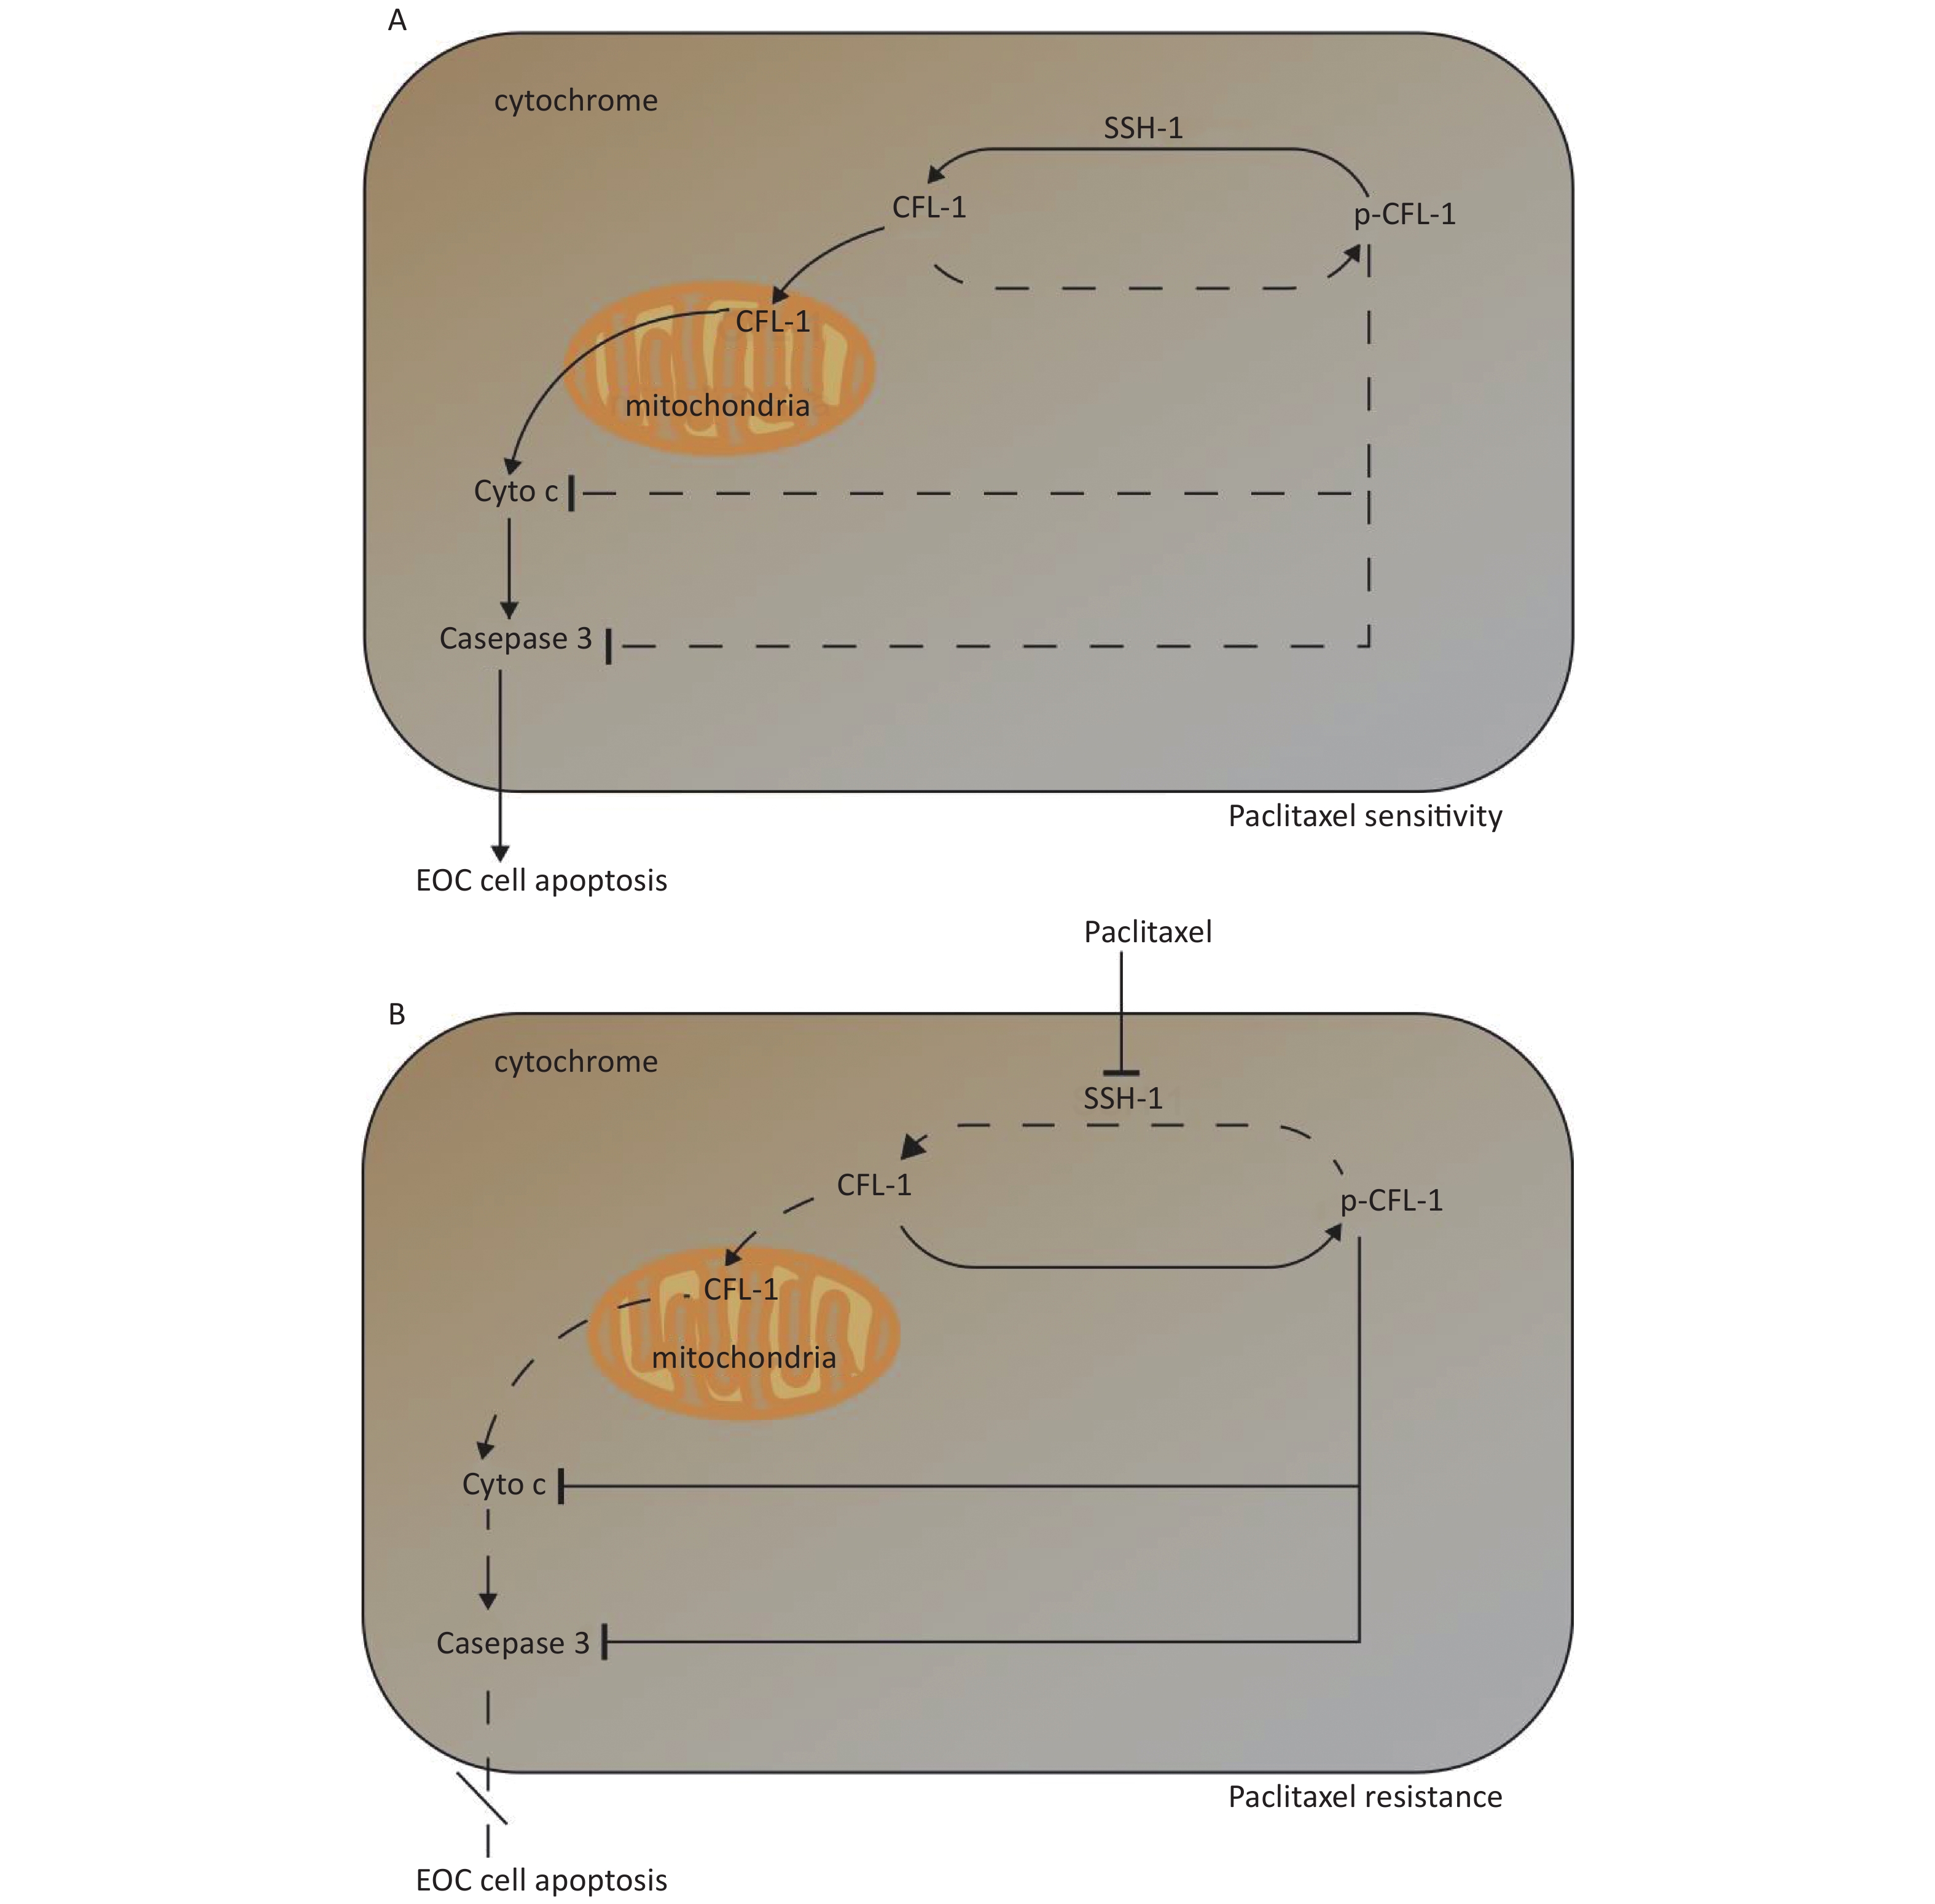
Three main findings were obtained in this study. Firstly, a high dose of paclitaxel treatment led to a high cellular level of p-CFL-1 protein, the phosphorylated form of CFL-1 at Ser-3, which induced paclitaxel-resistance. Secondly, cytoplasmic accumulation of p-CFL-1 inhibited mitochondrial apoptosis of EOC cells. Thirdly, SSH-1 silencing was responsible for the overexpression of p-CFL-1 in paclitaxel-resistant EOC cells. Both the low expression of SSH-1 and the high level of p-CFL-1 in EOC tissue, alone or in combination, could predict a likelihood of chemo-resistance and a poor prognosis among EOC patients. Our results suggest an important role for the SSH-1/p-CFL-1 signaling pathway regarding apoptosis inhibition in EOC cell paclitaxel resistance (Figure 5).
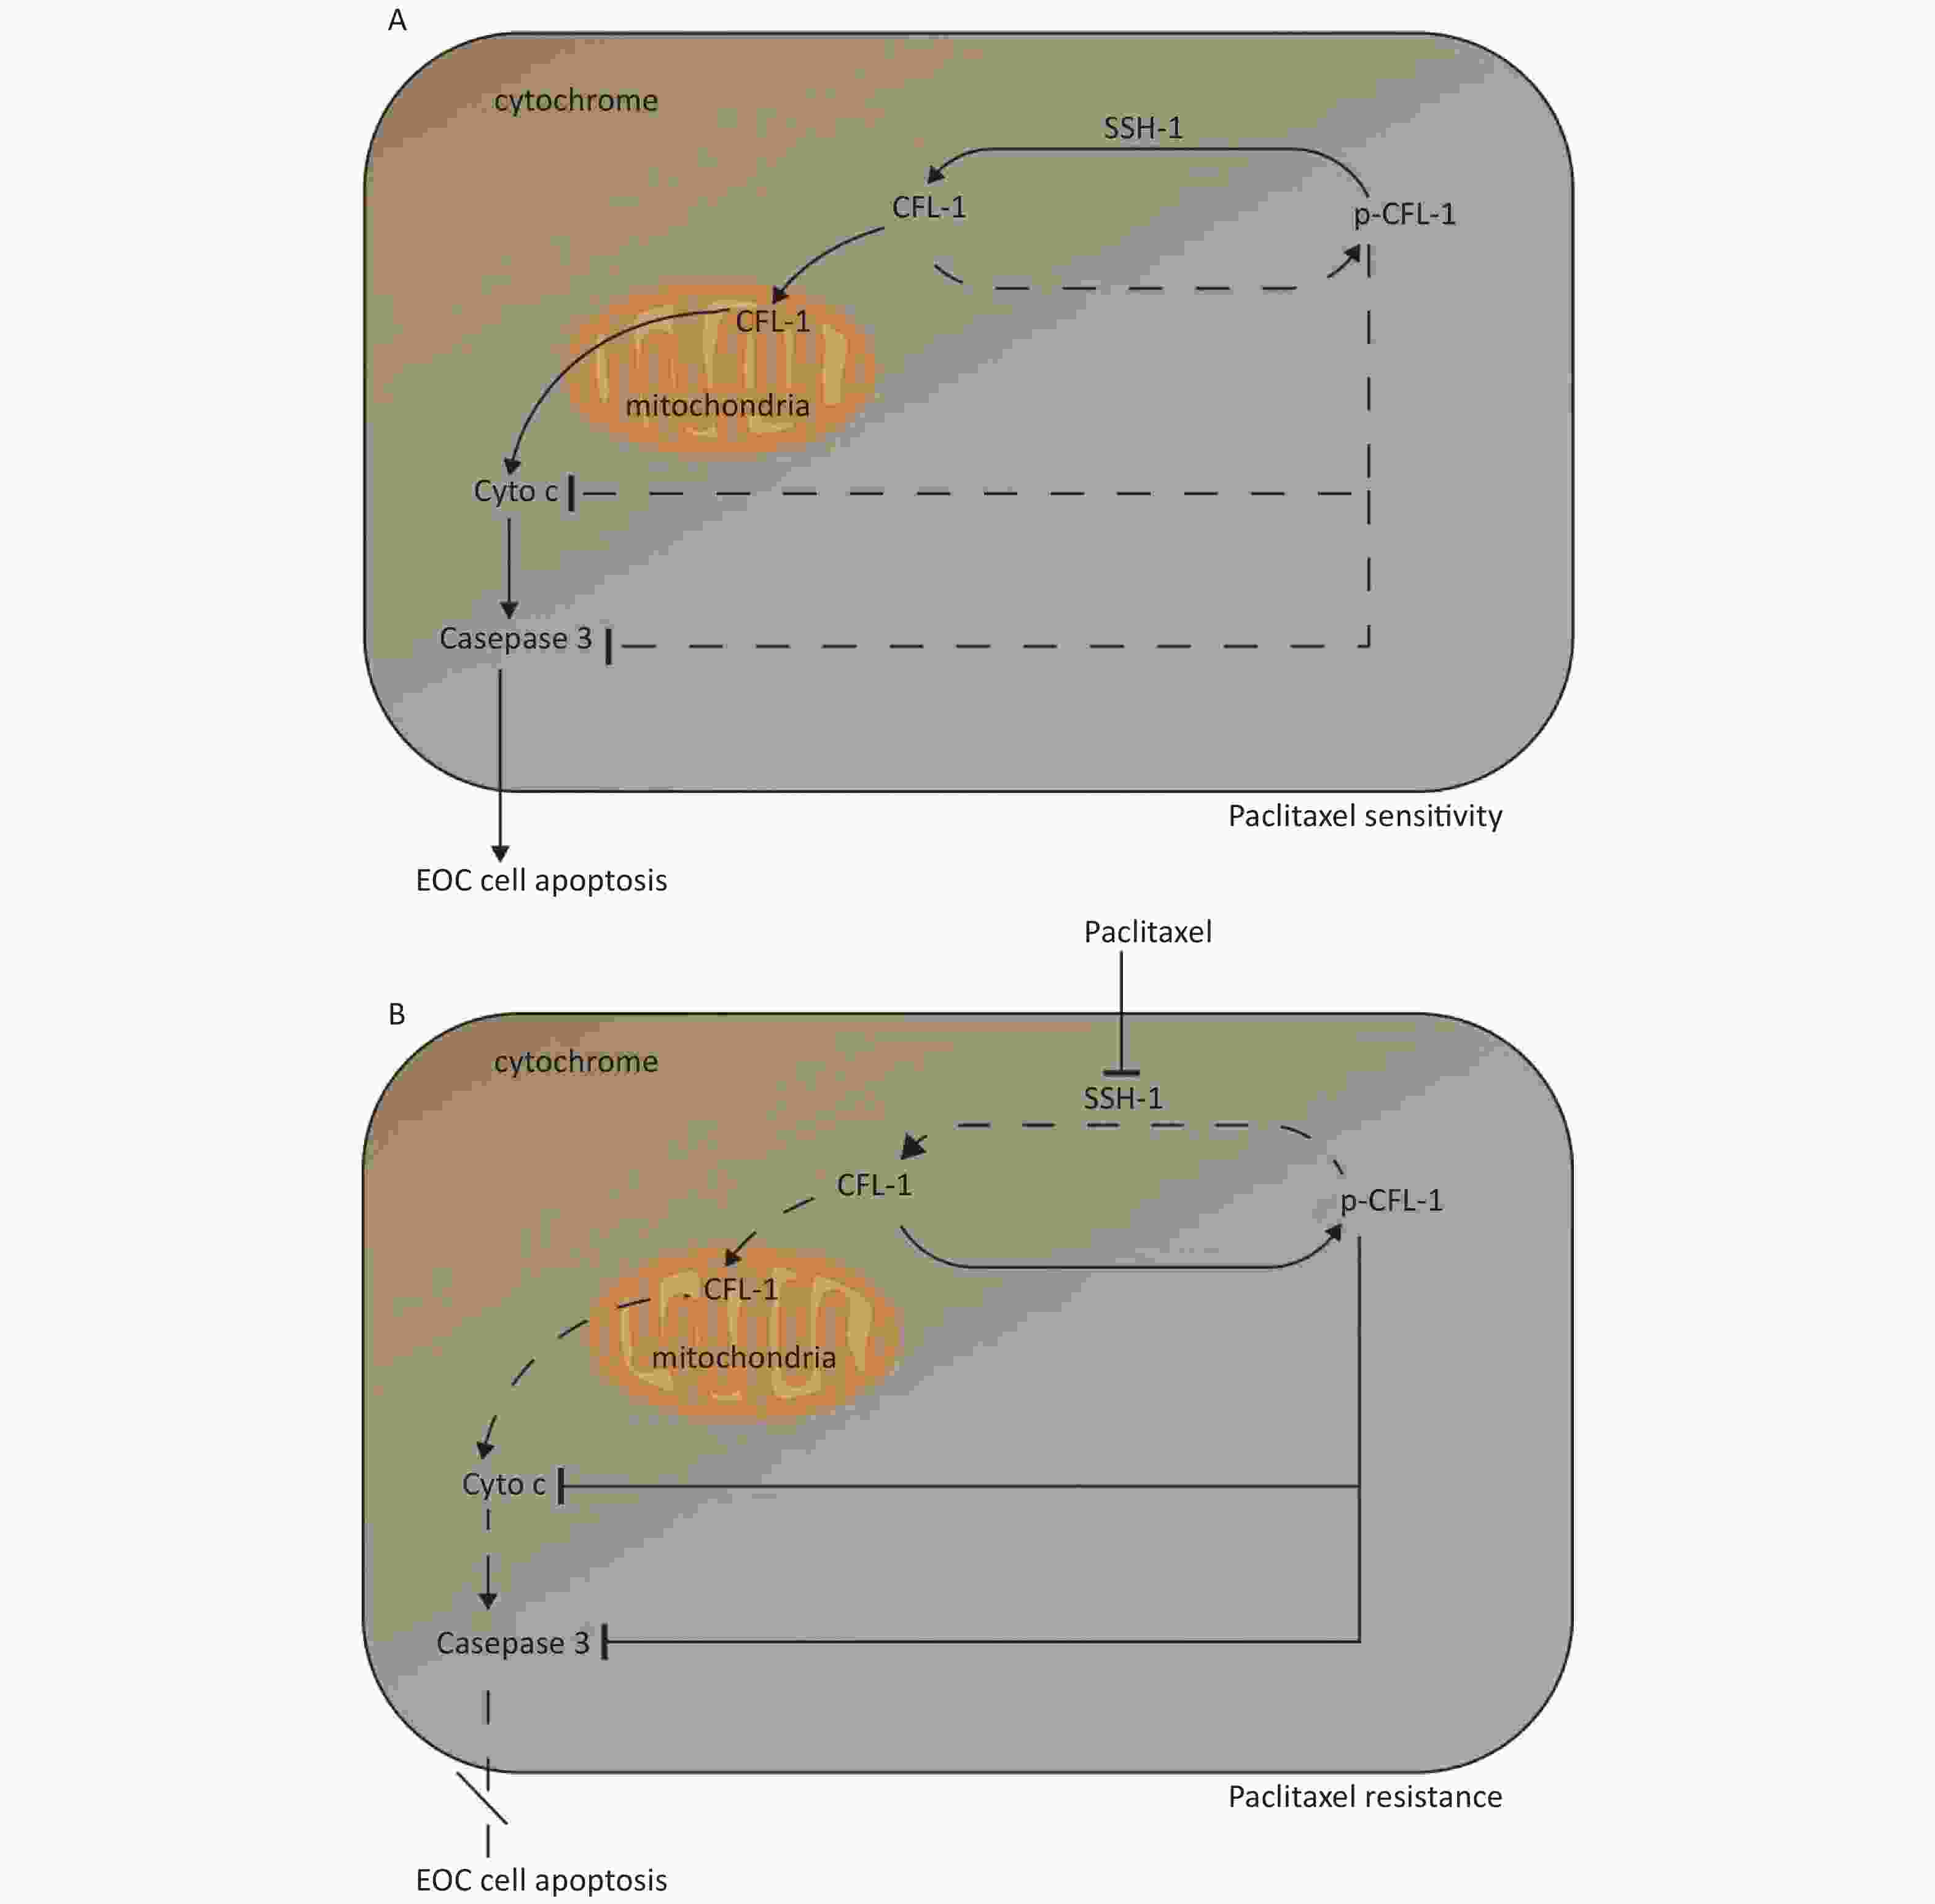
Figure 5. Mechanism of paclitaxel resistance via cytoplasmic p-CFL-1 induced mitochondrial apoptosis.
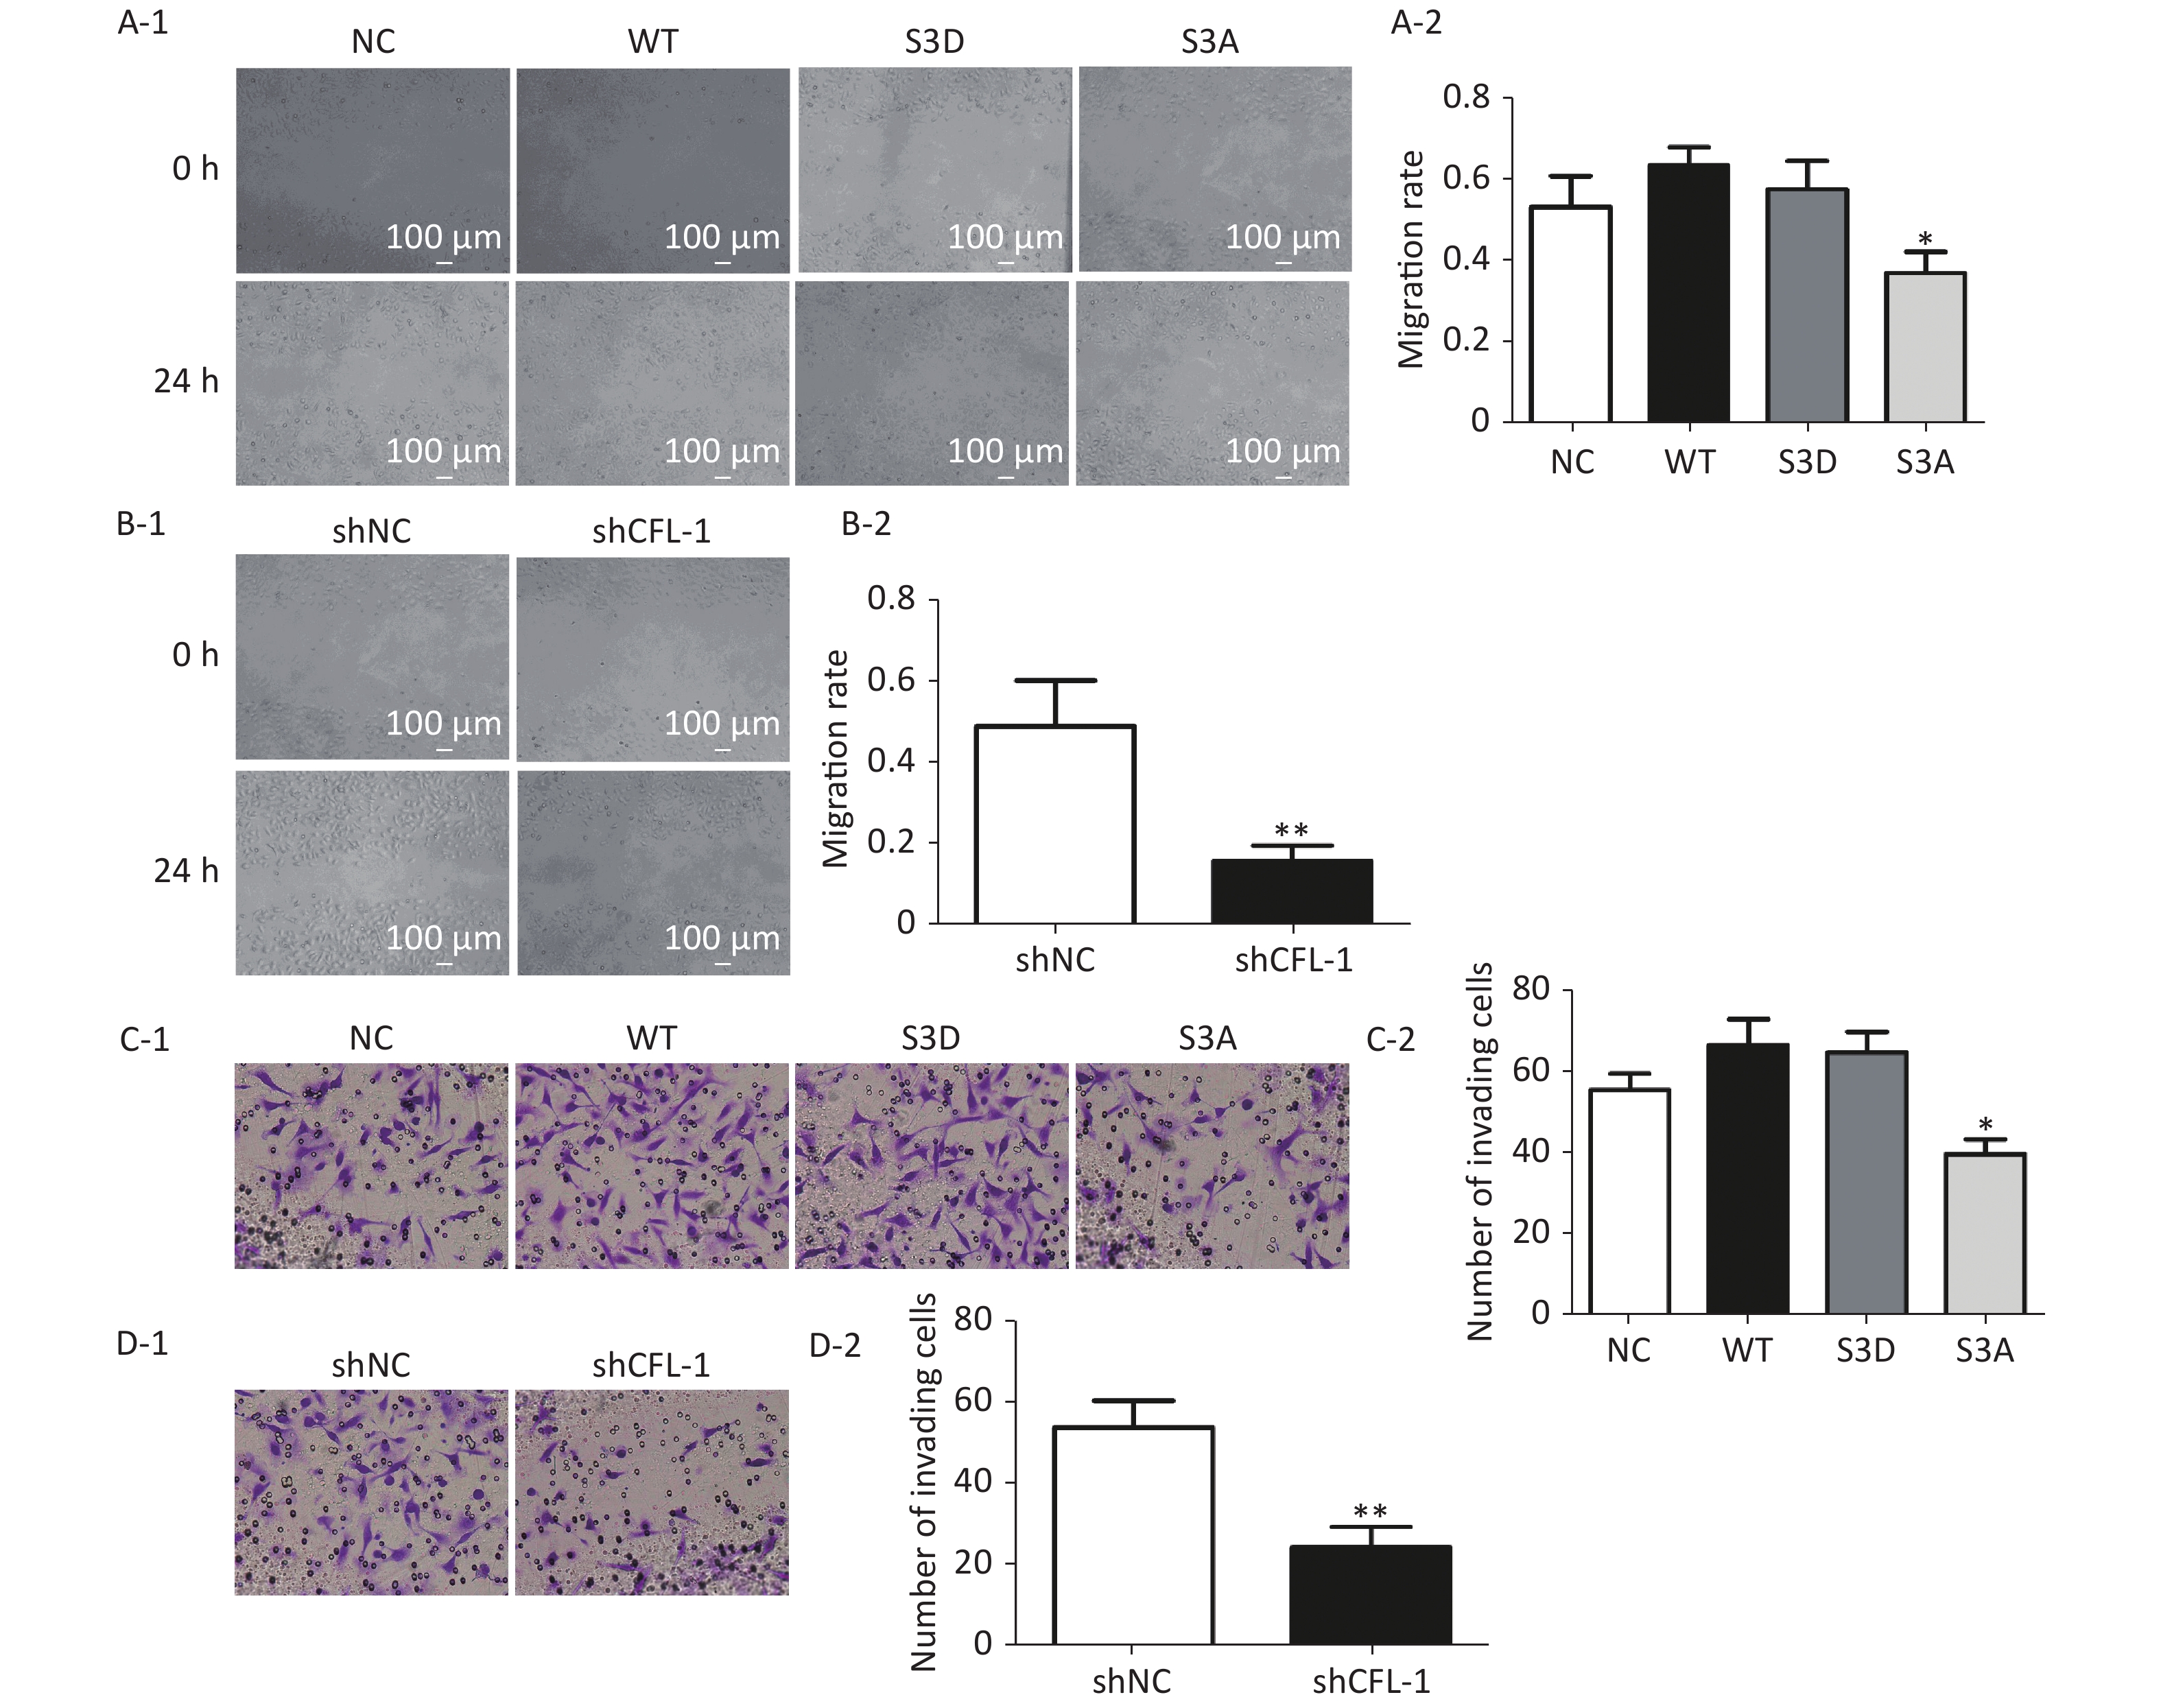
Previous studies have documented that CFL-1 is highly correlated with metastasis and invasion of cancer cells[13, 14]. However, our data showed that there was no significant increase in cell migration and invasion with CFL-1 or p-CFL-1 overexpression, although cell migration and invasion was attenuated by knockdown of CFL-1 and downregulation of p-CFL-1 (Supplementary Figure S1 available in www.besjournal.com). It has been suggested that metastasis and invasion is not a key trigger for SKOV3 cell resistance against paclitaxel. Mitochondrial translocation of CFL-1 was reported to induce apoptosis in previous studies, and dephosphorylated CFL-1 is the only form that can be transferred to mitochondria[17-20]. Our study confirmed that with more phosphorylated CFL-1 in the cytoplasm, less CFL-1 was able to translocate into the mitochondria to induce EOC cell apoptosis, resulting in a build-up of cytoplasmic p-CFL-1 in paclitaxel-resistant cells.
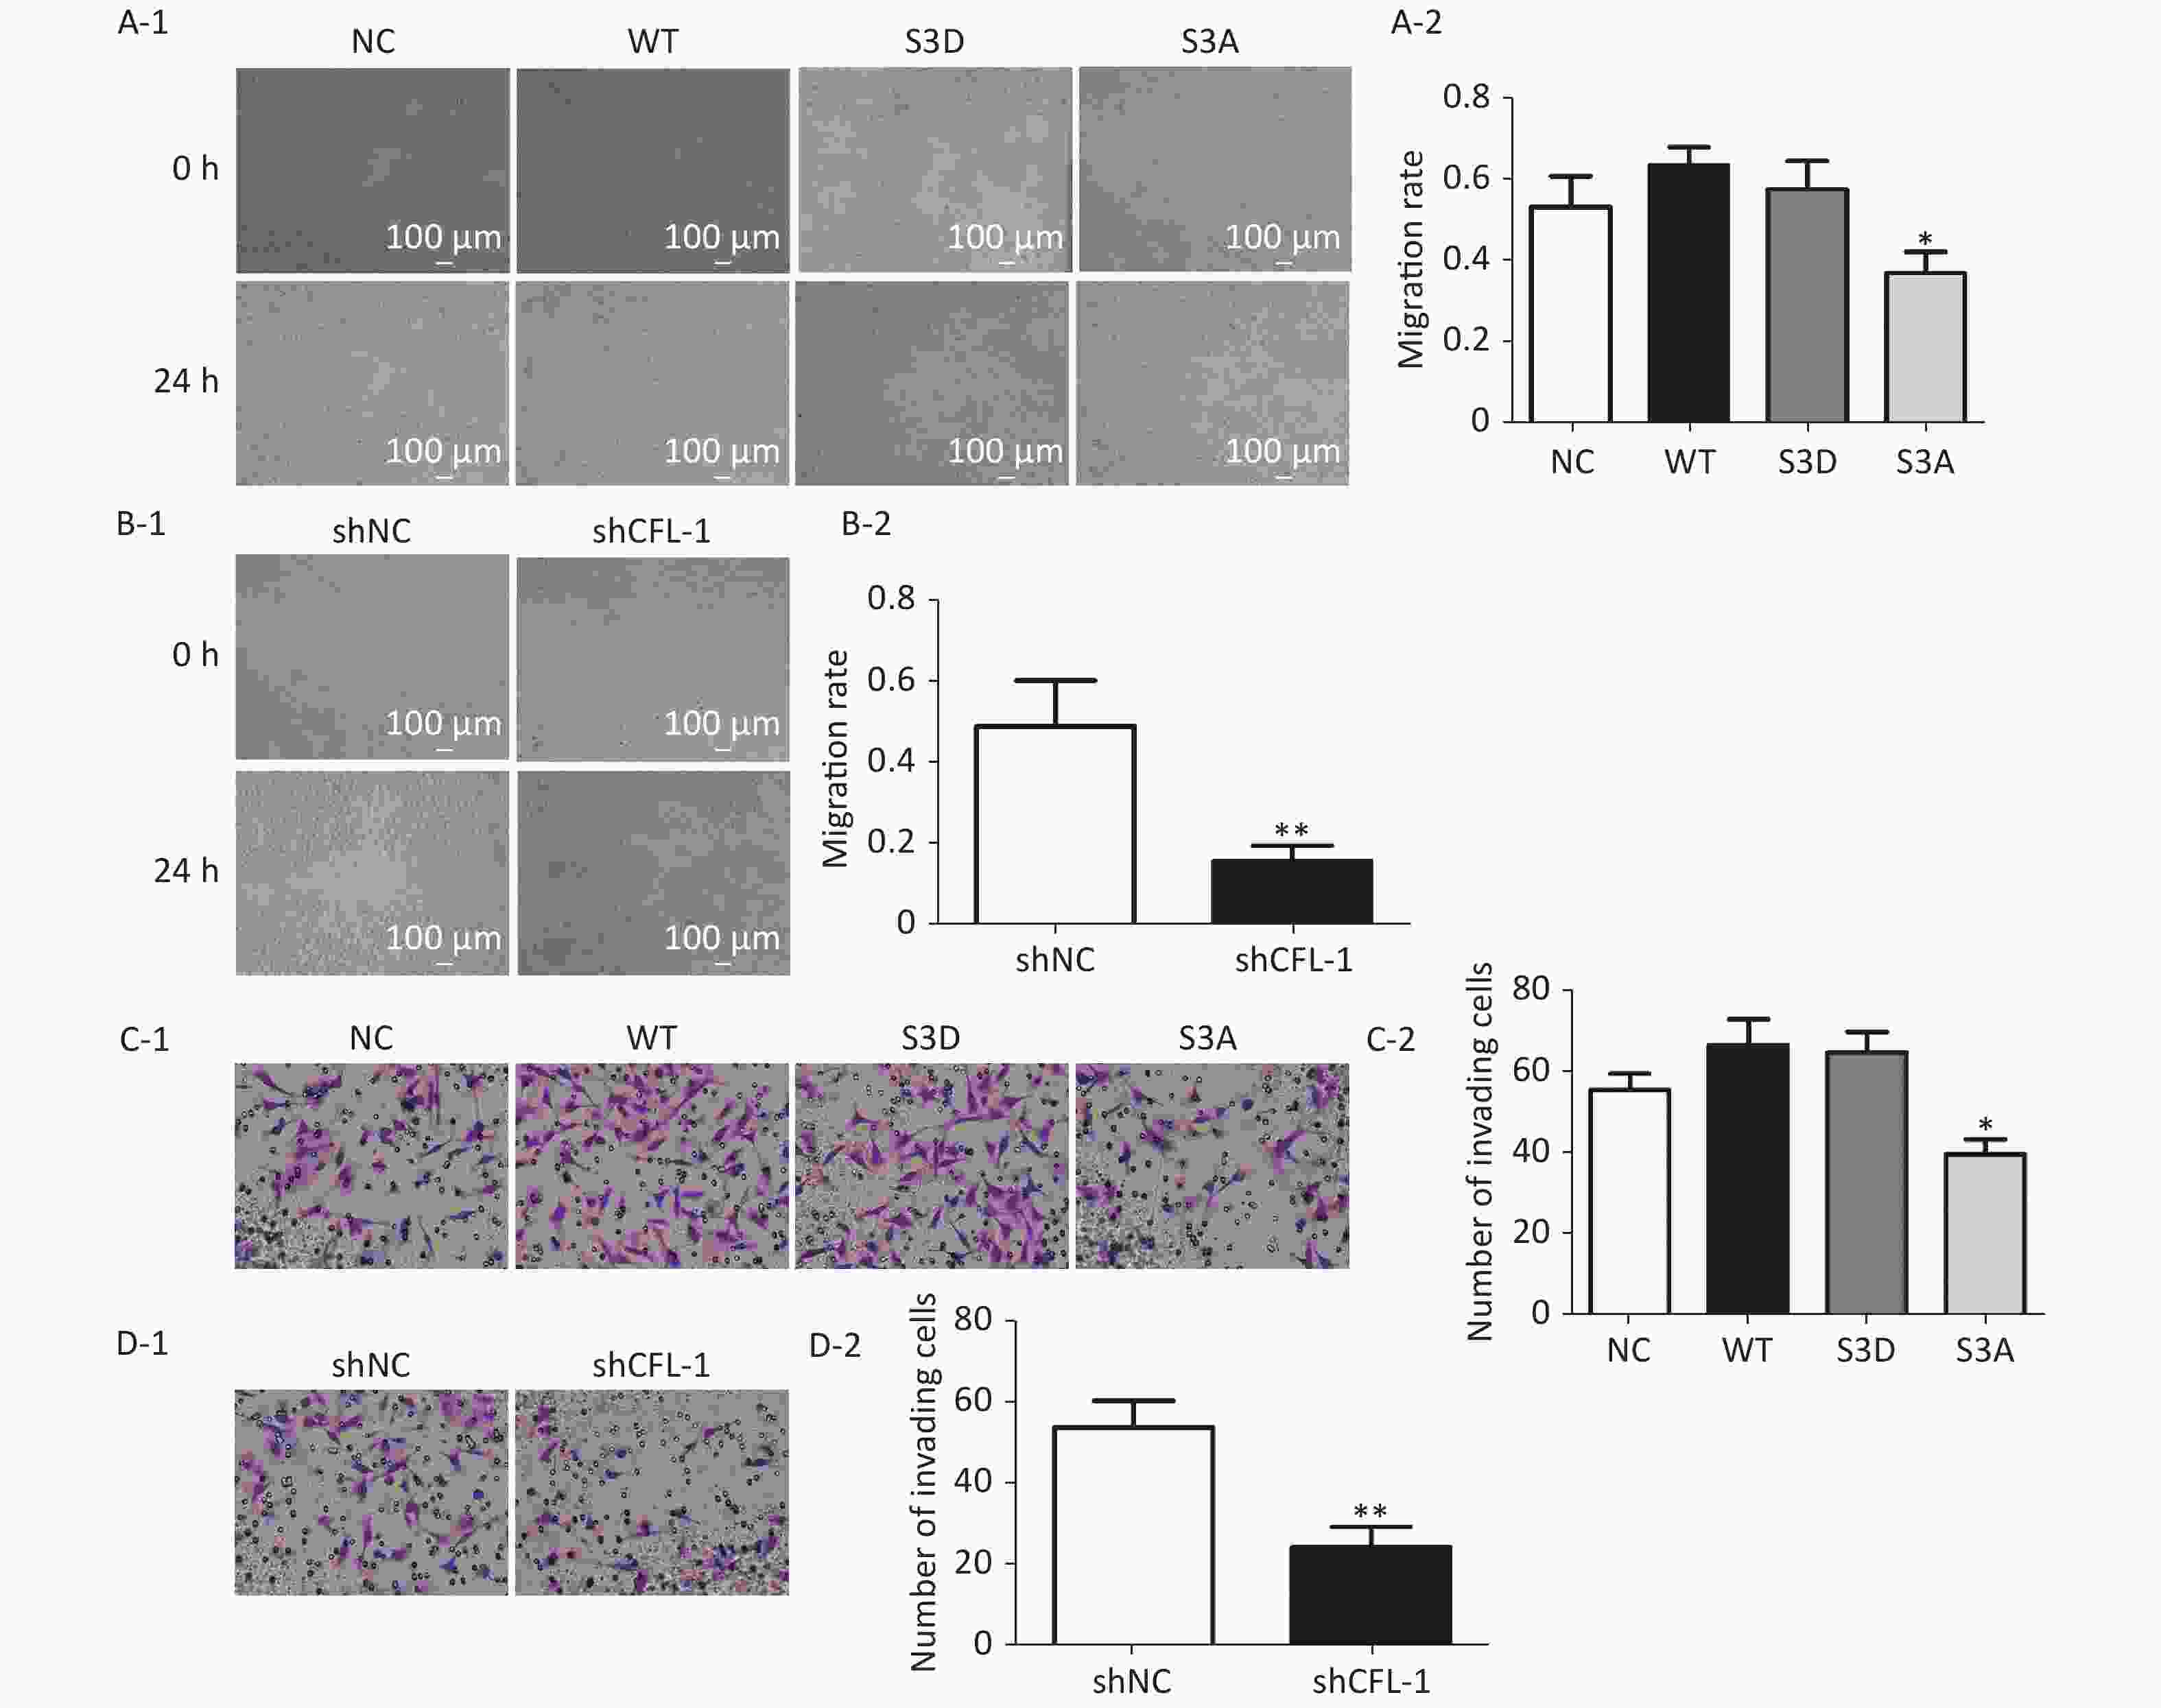
Figure S1. Effect of p-CFL-1 on the migration and invasion of ovarian cancer cells.
We also established that the p-CFL-1 level positively correlates with the level of Bcl-2, favoring cell survival. Wild-type CFL-1 and the S3D mutant with overexpressed p-CFL-1 enhanced Bcl-2 protein expression, while the S3A mutant with dephosphorylated CFL-1 decreased Bcl-2 expression. It has been reported that Bcl-2 family proteins are primary regulators of the mitochondrial apoptotic cascade and can be cleaved in cells treated with various concentrations of paclitaxel[21-23]. Young et al. reported that MCL-1, a pro-survival member of the Bcl-2 family, can directly bind and alter the phosphorylation of CFL-1 in breast cancer cells[24,25]. MCL-1 is an important target for cancer therapy and is involved in the drug resistance of many kinds of cancers, including oral cancer[26], lung cancer[27, 28], pancreatic cancer[29], ovarian cancer[28], and breast cancer[28, 30, 31]. However, the exact mechanism of apoptosis and chemo-resistance that involves CFL-1 phosphorylation and Bcl-2 will require further investigation.
Finally, we wanted to determine how phosphorylation of CFL-1 was regulated in paclitaxel-resistant EOC cells. Ser-3 is the only site where CFL-1 phosphorylation can be altered by different phosphokinases and phosphatases[32]. We screened several enzymes that could alter the phosphorylation state of CFL-1 at Ser-3 and observed a significant decrease in the expression of SSH-1 in paclitaxel-resistant EOC cells. The SSH-1 protein, a dual-specificity phosphatase, catalyzes hydrolysis of the Ser-3 phosphate group in phosphorylated CFL-1[33-36]. SSH-1 has been implicated in cell migration, protrusion, and mitosis, contributing to the metastasis, migration, and poor prognosis of breast and colorectal cancers[37-39]. To the best of our knowledge, the effect of the SSH-1/p-CFL-1 pathway on chemotherapy resistance of EOC has not been reported. Our results revealed a negative correlation between the expression of SSH-1 and p-CFL-1 in the mechanism of paclitaxel resistance for the first time. In addition, our data revealed that SSH-1/p-CFL-1 signaling was strongly correlated with survival and the chemo-response in EOC patients, consistent with the in vitro results, indicating that SSH1/pCFL1 signaling can serve as a predictor for chemo-resistance and EOC progression.
There are three limitations of this study. First, we adopted a retrospective single-center design. Second, it remains to be determined whether there is feedback regulation of SSH-1 and p-CFL-1, i.e., whether SSH-1 unidirectionally dephosphorylates p-CFL-1 or p-CFL-1 also regulates the expression of SSH-1. Finally, the specific mechanism of SSH-1/p-CFL-1-induced apoptosis requires further investigation. Therefore, whether p-CFL-1 is an independent prognostic biomarker of paclitaxel resistance, and whether the SSH-1/p-CFL-1 signaling pathway can be a target to reverse paclitaxel resistance will require further investigation.
-
We elucidated a novel mechanism underlying chemo-resistance mediated by CFL-1 phosphorylation. Downregulation of SSH-1 can promote the stability of p-CFL-1 in the cytoplasm, inhibit apoptosis, and further promote paclitaxel-resistance, which leads to poor prognosis in EOC patients.
-
EOC, epithelial ovarian cancer; CFL-1, cofilin-1; SSH-1, Slingshot-1; Bcl-2, B-cell lymphoma-2; OS, overall survival; PFS, progression-free survival; IC50, half-maximal inhibitory concentration; WB, western blot; CCK-8, Cell Counting Kit-8; qRT-PCR, quantitative real-time polymerase chain reaction; IHC, immunohistochemistry.
-
Conceptualization and methodology: LM; formal analysis and data curation: LM, ZW, CD, HS, and LHY; validation and investigation: LM, DXD, and LQB; original draft preparation and revisions: LM and YCX. All authors read and approved the final manuscript.
-
The authors declare that they have no competing interests.
Funds:
National Natural Science Foundation of China [No. 81302277]; Beijing Dongcheng District Excellent Talents Funding Project [No. 2018-13]; Yunnan Provincial Department of Science and Technology – 2020 Kunming Medical University Joint Special Project on Applied Basic Research [No. 202001AY070001-128]

 Quick Links
 DownLoad: