


-
The COVID-19 pandemic has affected 220 countries, areas, and territories worldwide, with more than 65 million confirmed cases and 1.5 million deaths[1]. By the beginning of May, 2020, only a few countries, such as China, South Korea, Australia, and New Zealand, seemed to be close to the epidemic’s late stage with a few daily reported new cases[1]. The daily reported new cases in many Western European countries appear to have a stable declining trend after approximately two months of high prevalence, while those in the North American countries are still at a high plateau. On the other hand, most countries, particularly in South Asia, South America, and Africa, are in the increasing stage[1-3]. Thus, the COVID-19 pandemic is far from ending.
To better understand the epidemic characteristics of COVID-19, we collected and reviewed the daily reported cases in several affected countries with a high number of confirmed cases, including the US, Spain, Italy, France, Germany, UK, Turkey, Iran, Russia, and China, as well as the Republic of Korea (South Korea). The period from the day when > 100 cases to the day when < 100 cases were reported, and the changes of the daily effective reproduction numbers (Rt) were calculated according to the data from the websites of WHO, European CDC, as well as relevant governmental and professional websites[1-3]. The duration and dynamics of the COVID-19 epidemic in each country were comparably analyzed based on the alterations of the numbers and ratios (percentage accounted for the highest case) of the daily reported new cases.
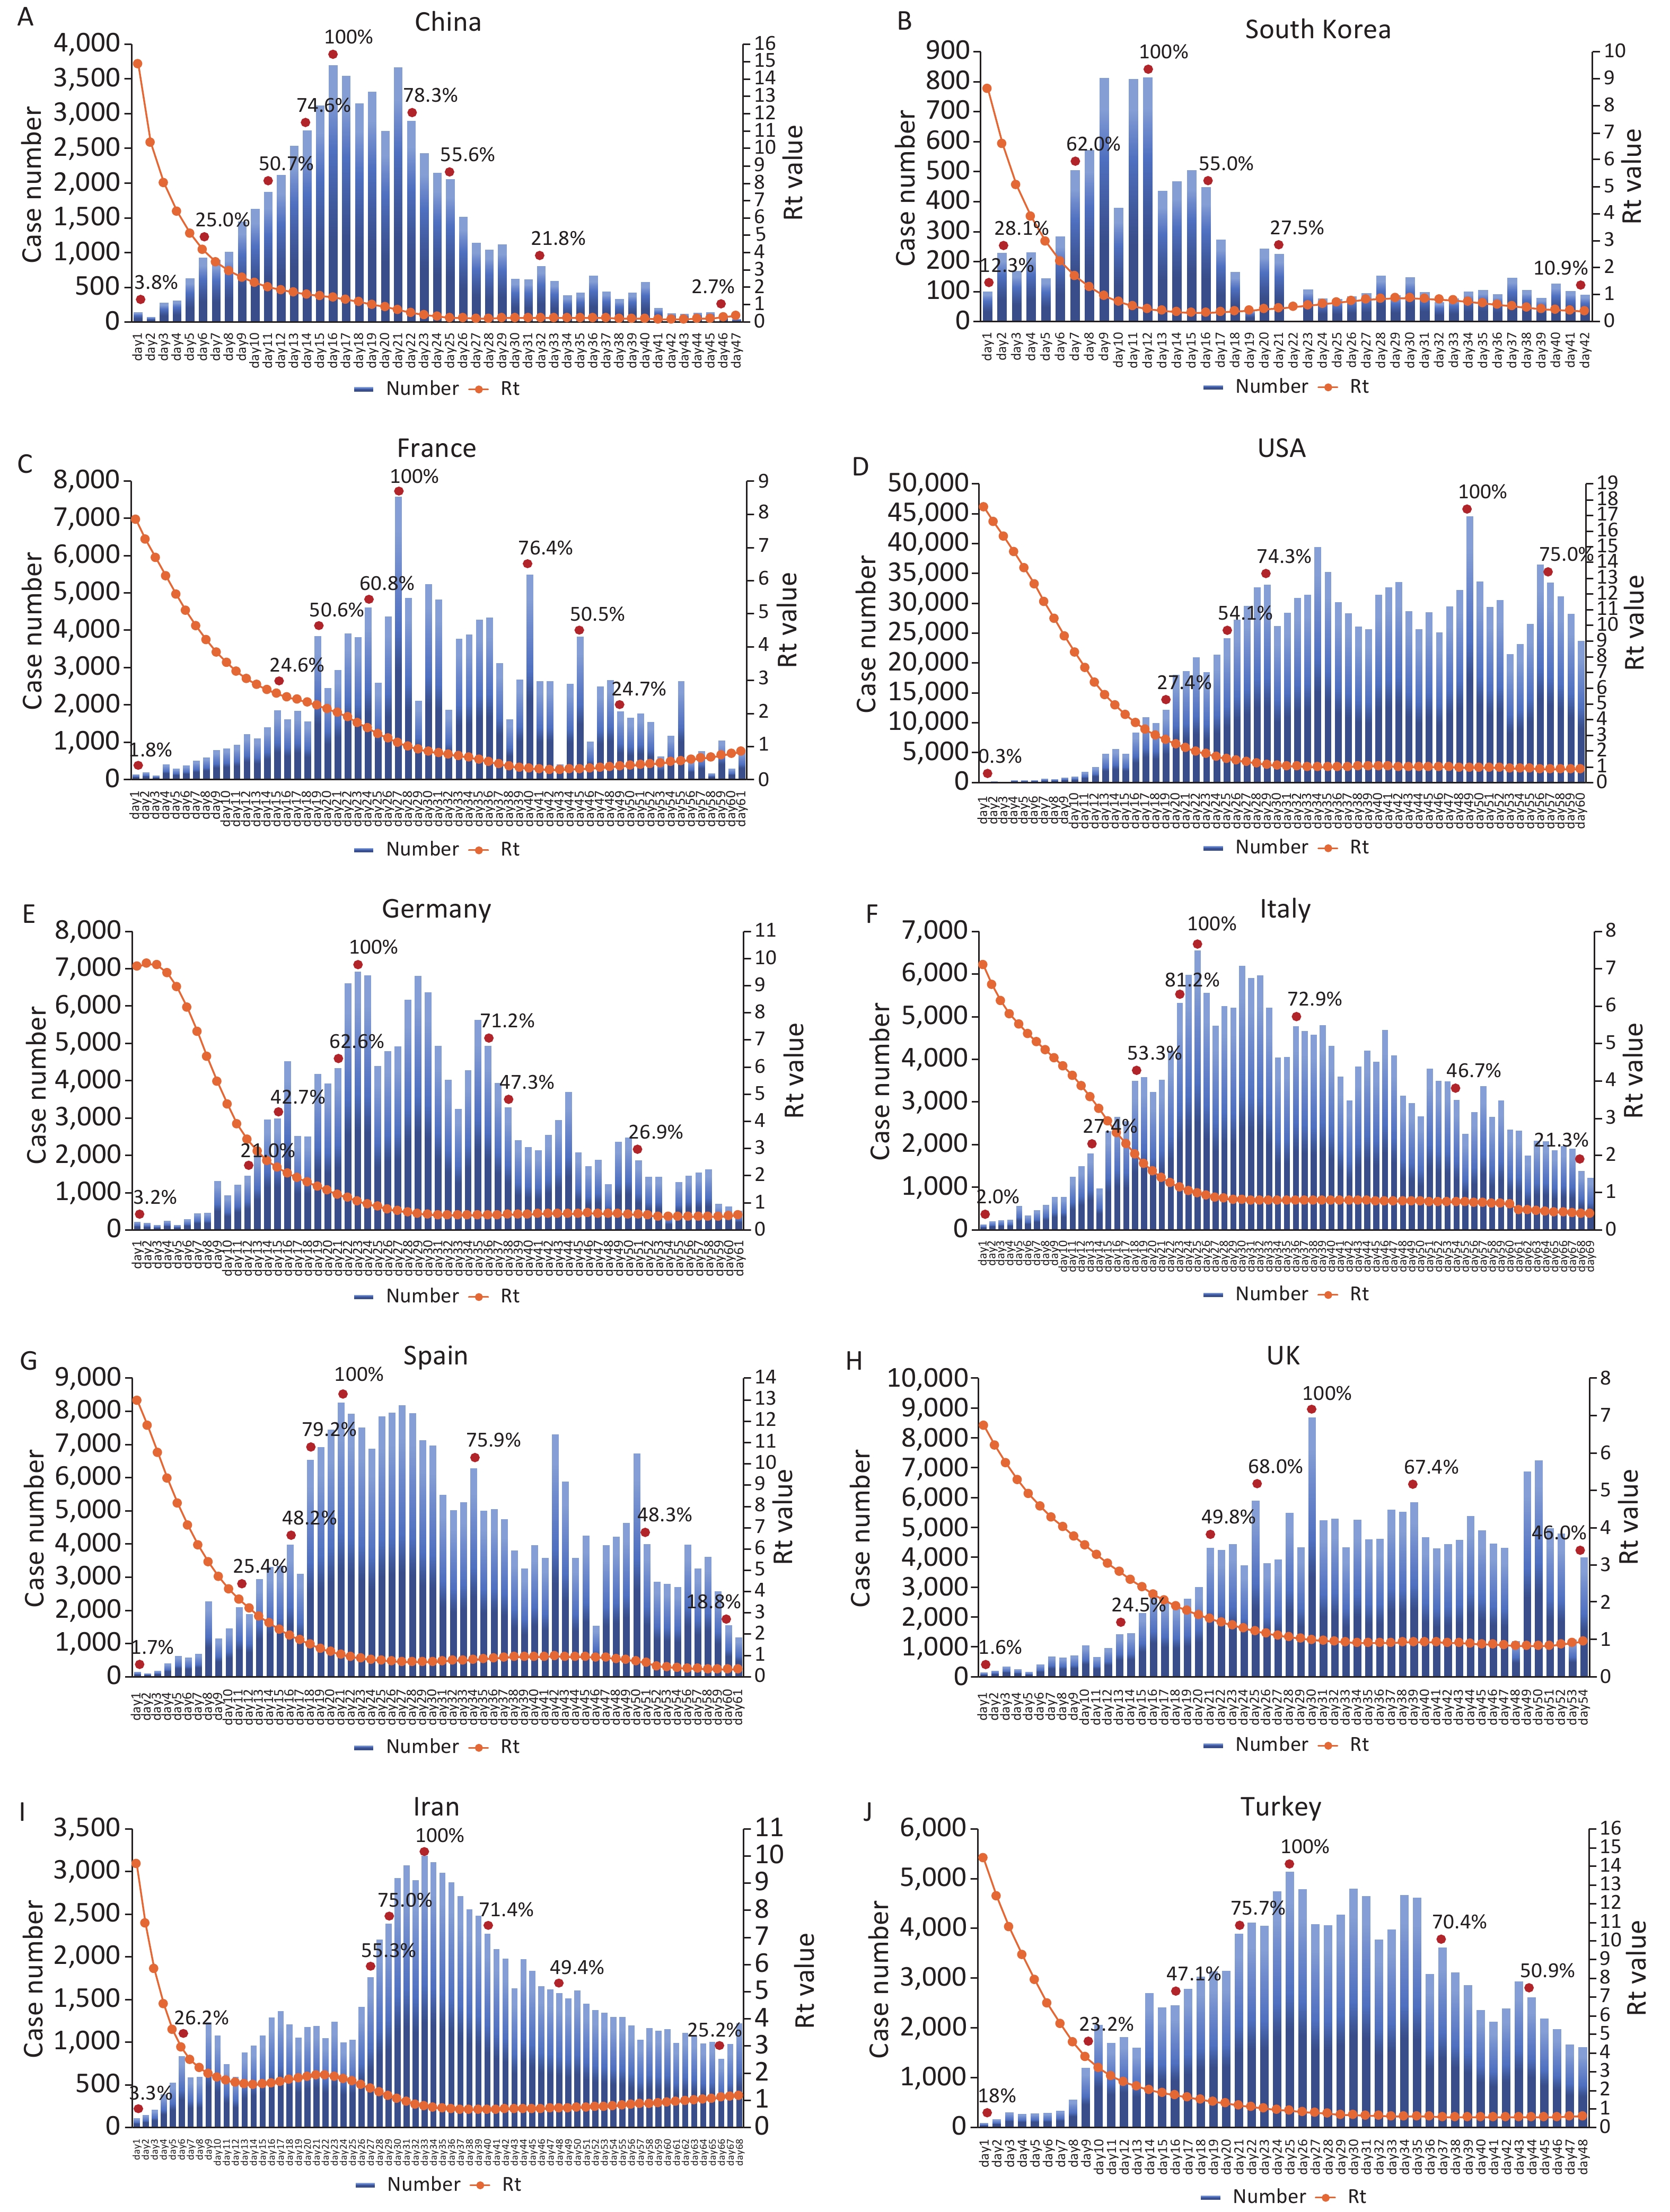
The daily new COVID-19 confirmed cases of 11 affected countries from the date when > 100 cases to the day when < 100 cases were reported or by May 4, 2020, are illustrated in Supplementary Figure S1, available in www.besjournal.com. Only the US and Russia showed a peak of daily cases higher than 10,000. The countries with a peak of daily cases higher than 5,000 but less than 10,000 were Spain, Italy, France, Germany, UK, and Turkey. China and Iran showed peaks of daily cases higher than 3,000 but less than 4,000 cases. The peak of daily cases in South Korea was less than 1,000.
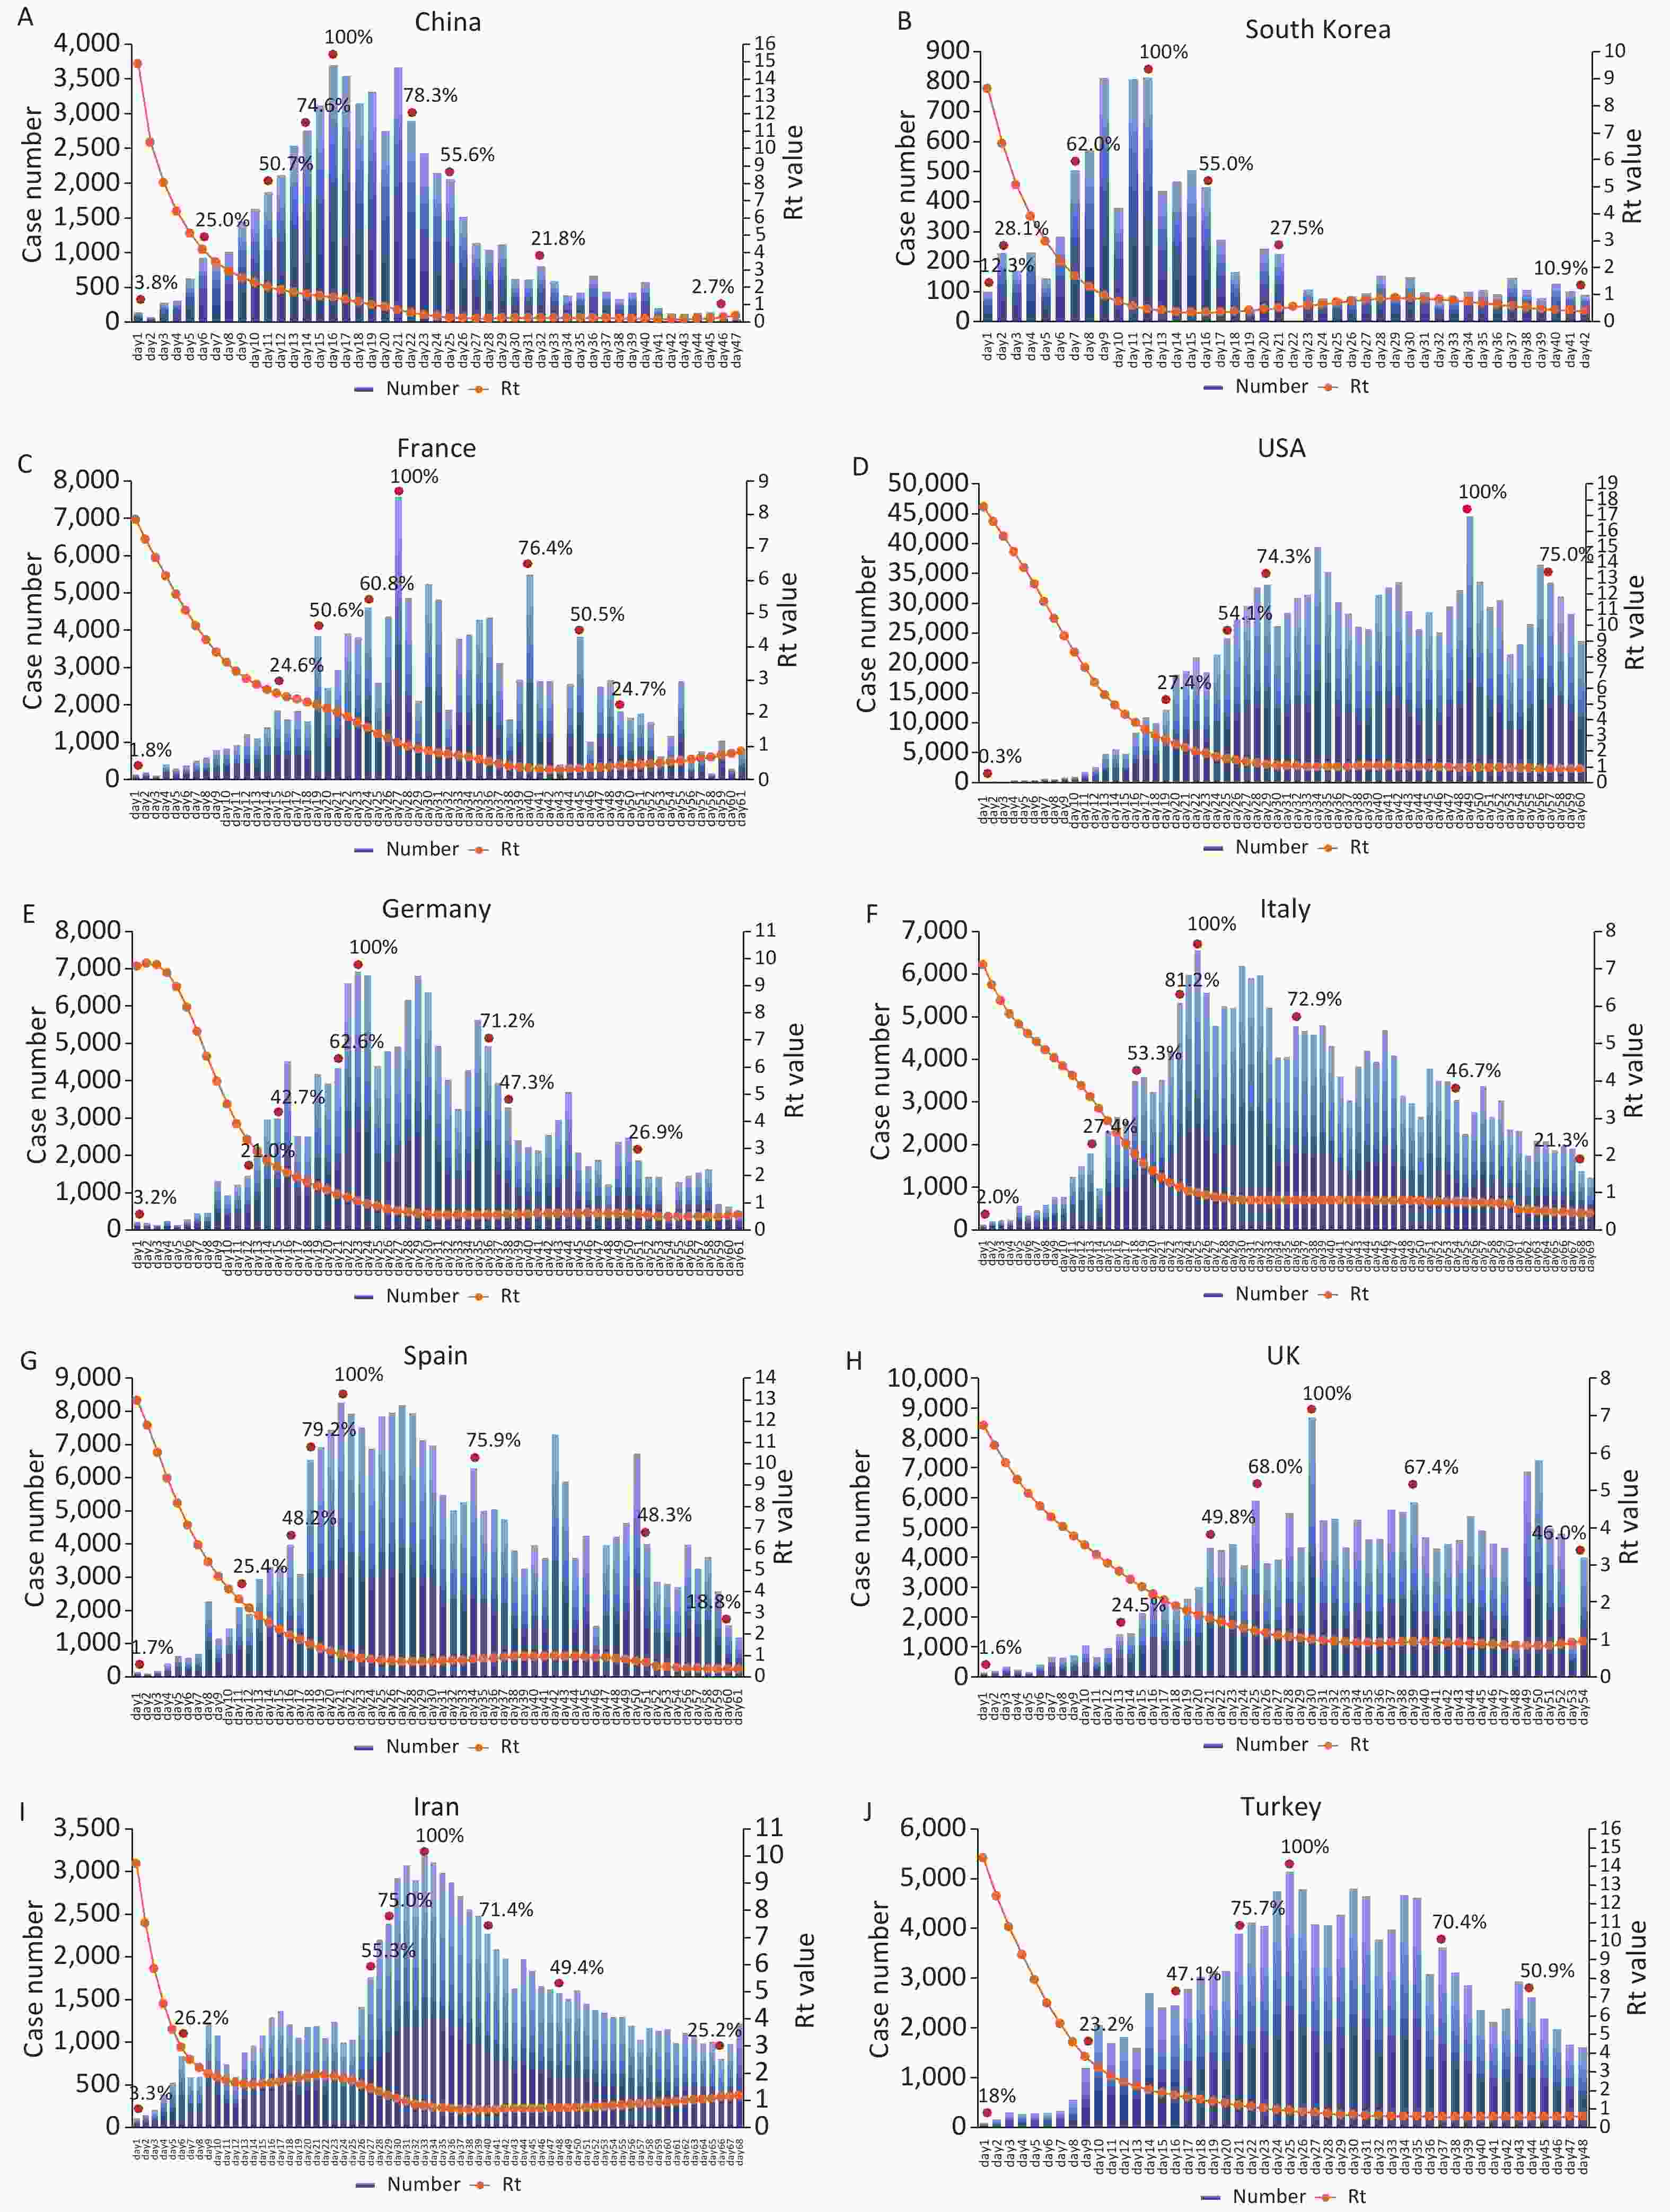

Figure S1. The daily new confirmed cases and Rt values of COVID-19 of the 11 enrolled countries. The date when > 100 cases to the day when < 100 cases were reported or by May 4, 2020. The case numbers are indicated on the left and are presented as a blue bar, roughly 25%, 50%, 75%, and 100% are marked using red solid circle on the corresponding blue bars. The Rt values are indicated on the right and presented as an orange solid line. Various countries are marked on the top in each histogram (A–K)
Only China and South Korea experienced a drop in the daily new cases to less than 100 cases. The intervals from > 100 to < 100 cases were 46 and 42 days in China and South Korea, respectively, with peaks of 3,704 cases on day 16 in China and 815 cases on day 12 in South Korea (Supplementary Figure S1, Table 1). The declining intervals from the peak to < 100 cases in China and South Korea were both 30 days, which were markedly longer than the increasing intervals from > 100 cases to the peak (16 and 12 days, respectively). By May 4, 2020 the number of daily cases in Germany, France, and Iran reduced to less than 1,000 after approximately 60 days, while that in Italy, Spain, and Turkey was less than 3,000 and that in the US, UK, and Russia was still higher than 3,000. As shown in Table 1, the increasing intervals from > 100 to > 1,000 cases among the enrolled countries were from 8 (China and Spain) to 14 (Russia) days. The intervals from > 1,000 to > 3,000 cases differed, with the US having the shortest duration (2 days), Iran having the longest (22 days), and the majority of European countries and China having an interval of 6–7 days. The days from > 3,000 cases to the peak were closely related to the countries' highest number of cases. China and Iran had the highest daily cases of 3,704 and 3,186, with intervals of 1 and 2 days, respectively. The interval of the US was remarkably long (36 days), with the highest daily number of cases of 44,638, while that of Russia was 18 days with the highest daily number of cases of 10,632. The intervals in the seven European countries were 6–8 days, with daily peaks in the range of 5,000–10,000.
Country > 100 cases > 1,000 cases > 3,000 cases Top < 3,000 cases < 1,000 cases < 100 cases By May 4,
2020day day Rt day Rt day Rt day Rt day Rt day Rt day China 1 8 2.94 15 1.50 16 1.40 22 0.53 30 0.23 46 0.27 − South Korea 1 − − − − 12 0.46 − − − − 42 0.37 − France 1 12 2.85 19 2.23 27 1.10 46 0.33 60 0.78 NA NA 61 USA 1 11 7.26 13 5.59 49 0.95 NA NA NA NA NA NA 60 Germany 1 9 5.45 16 1.92 23 1.06 39 0.58 59 0.50 NA NA 61 Italy 1 11 4.14 18 2.02 25 0.98 60 0.70 NA NA NA NA 69 Spain 1 8 5.37 14 2.50 21 0.95 59 0.34 NA NA NA NA 61 UK 1 10 3.51 20 1.55 30 0.99 NA NA NA NA NA NA 54 Iran 1 9 1.86 31 0.94 33 0.78 35 0.70 66 1.10 NA NA 68 Turkey 1 9 3.79 18 1.50 25 0.91 39 0.58 NA NA NA NA 48 Russia 1 14 3.30 22 1.93 40 1.73 NA NA NA NA NA NA 41 Note. NA represents not applicable. Table 1. Duration times and Rt values in the increase and decrease period based on the daily case number
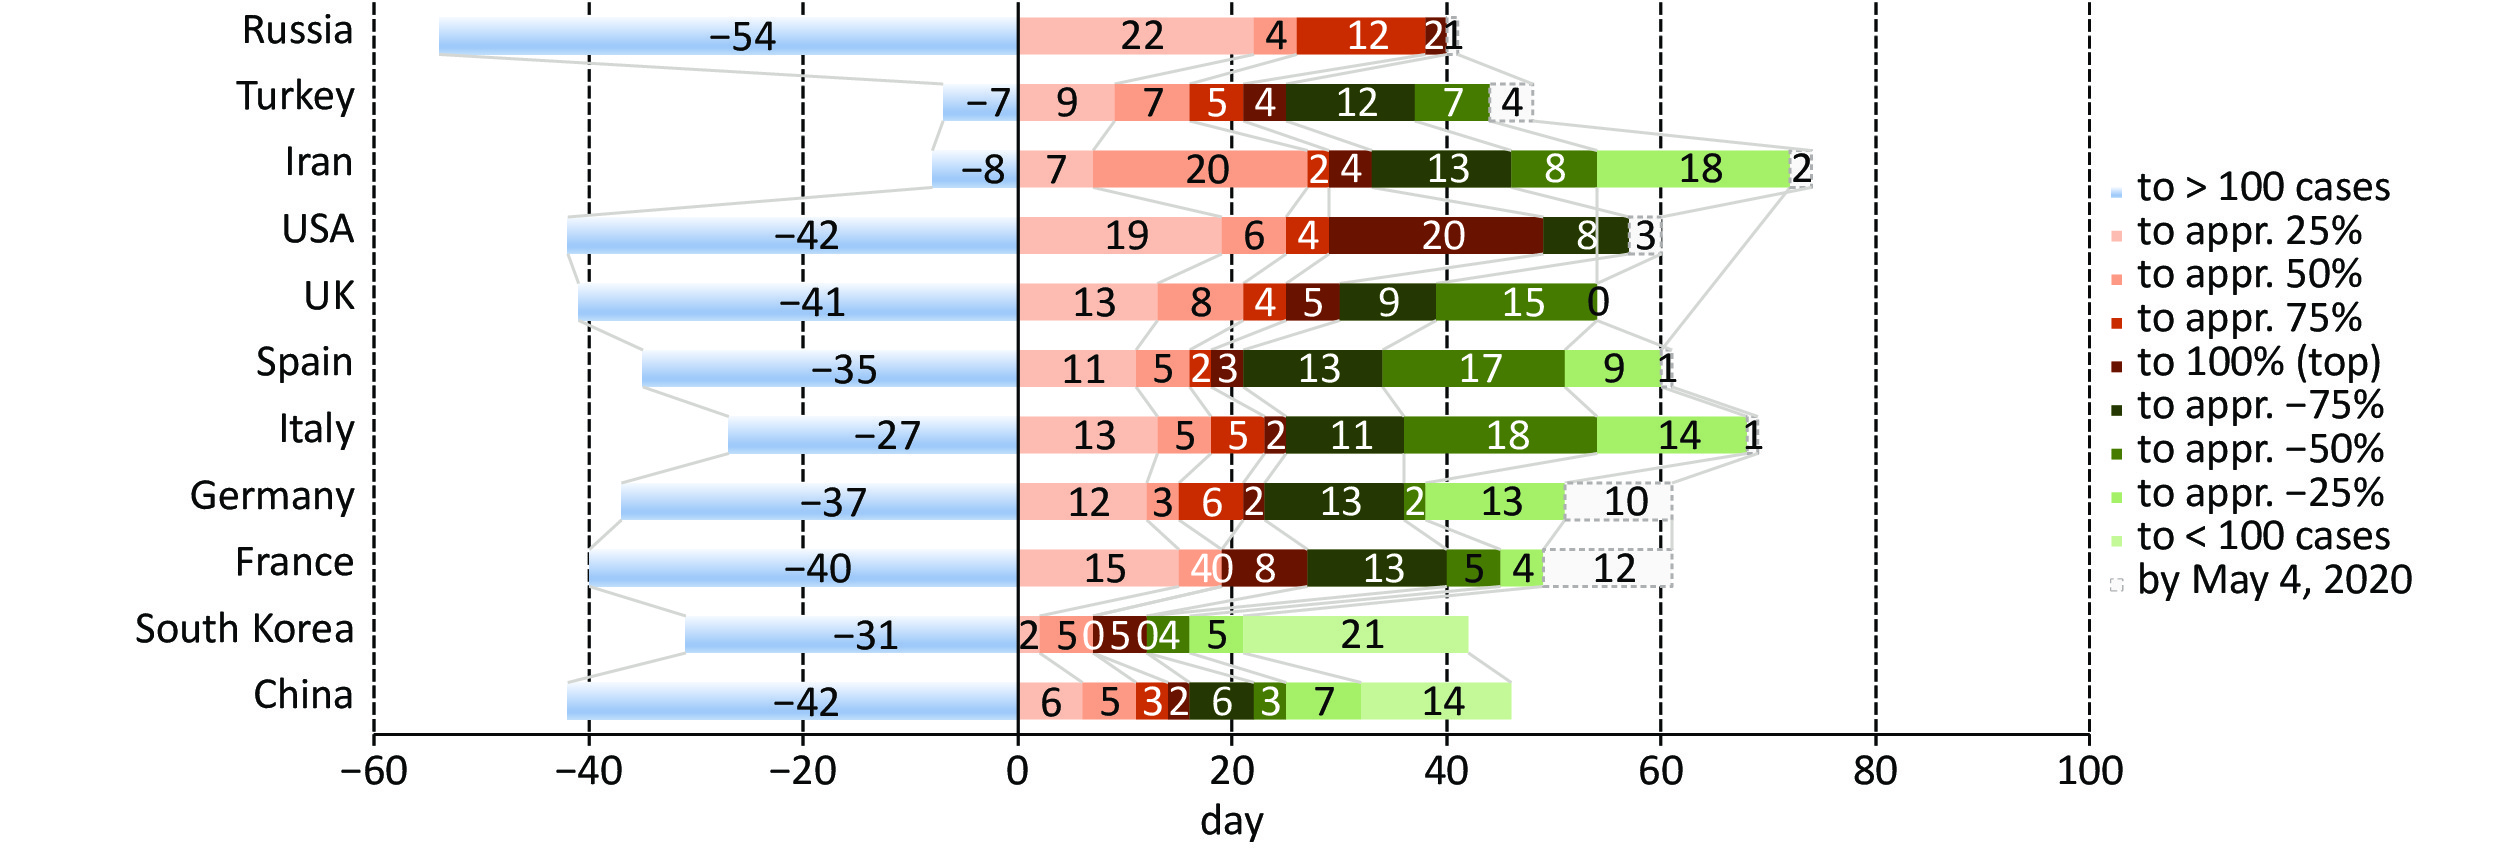
We took the data of the highest daily reported cases as 100% and then calculated the intervals from the appearance of the 1st cases to the increases of > 100 cases, approximately 25%, 50%, 75%, 100%, and decreases of −75%, −50%, −25%, and > 100 cases. As shown in Figure 1 and Supplementary Table S1 (available in www.besjournal.com), the intervals from the 1st case to > 100 cases in the majority of the enrolled countries ranged from 25–45 days. Russia showed the most prolonged interval with 54 days, whereas Iran and Turkey had shorter intervals with 7 and 8 days, respectively. Only the daily cases in China (March 12, 2020) and South Korea (April 2, 2020) declined to less than 100 cases during the epidemic with similar alternative patterns. Calculation of the intervals from > 100 cases to the peak and from the peak to < 100 cases revealed a short increasing time and a long decreasing time. The portions of increasing and decreasing times were 34.8% and 65.2% in China, and 28.6% and 71.4% in South Korea. Compared with the increasing intervals of China (16 days) and South Korea (12 days), those of Germany (23 days), Italy (25 days), Spain (21 days), France (27 days), Iran (33 days), UK (30 days), Turkey (25 days), Russia (40 days), and USA (49 days) were obviously longer, particularly in the range of > 100 cases to 50% (Figure 1, Supplementary Table S1).
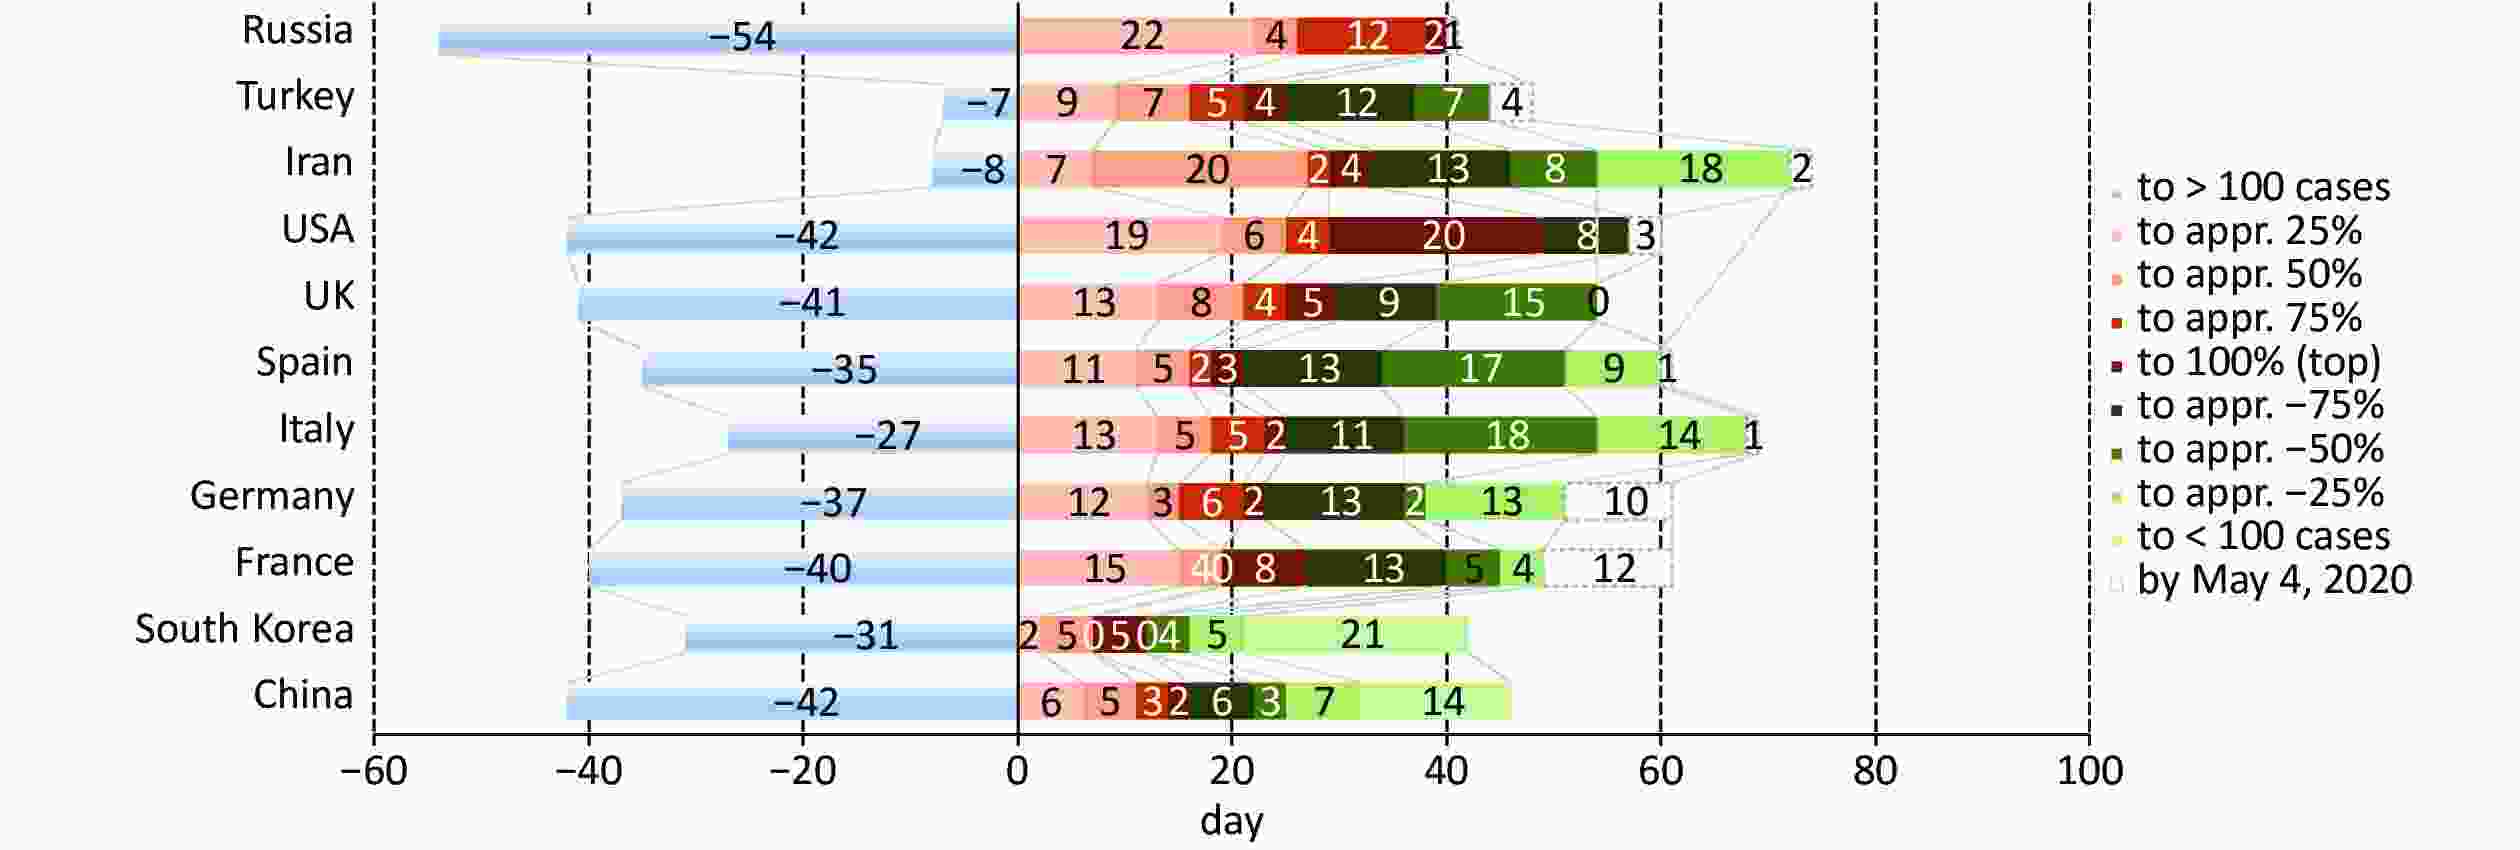
Figure 1. Duration times in the increase and decrease period based on the daily case ratio. Various duration times are marked on the histogram with different colors and illustrated on the right. Y axis presents the enrolled countries and X axis indicates the interval time (day)
Country > 100 cases Appr. 25% Appr. 50% Appr. 75% 100% Appr. −75% Appr. −50% Appr. −25% < 100 cases By May 4, 2020 % day % day Rt % day Rt % day Rt % day Rt % day Rt % day Rt % day Rt % day Rt Rt China 2.8 1 25.0 6 4.18 50.7 11 2.03 74.6 14 1.60 100 16 1.40 78.3 22 0.53 55.6 25 0.25 21.8 32 0.25 2.7 46 0.27 − South Korea 12.3 1 28.1 2 6.59 62.0 7 1.68 − − − 100 12 0.46 − − − 55.0 16 0.33 27.5 21 0.49 10.9 42 0.37 − France 1.8 1 24.6 15 2.59 50.6 19 2.24 NA NA 1.55 100 27 1.10 76.4 40 0.32 50.5 45 0.32 24.7 49 0.40 NA NA NA 0.84 USA 0.3 1 27.4 19 2.69 54.1 25 1.51 74.3 29 1.14 100 49 0.95 75.5 50 0.85 NA NA NA NA NA NA NA NA NA 0.82 Germany 3.2 1 21.0 12 3.33 47.7 15 2.30 62.1 21 1.31 100 23 1.06 71.2 36 0.54 47.3 38 0.56 16.9 51 0.56 NA NA NA 0.55 Italy 2.0 1 27.4 13 3.25 53.3 18 2.01 81.2 23 1.14 100 25 0.98 72.9 36 0.80 46.7 56 0.75 21.3 68 0.44 NA NA NA 0.43 Spain 1.7 1 25.4 11 3.62 48.2 16 1.95 79.2 18 1.50 100 21 0.95 75.9 34 0.81 48.3 51 0.65 18.8 60 0.33 NA NA NA 0.33 UK 1.6 1 24.5 13 2.81 49.8 21 1.55 68.0 25 1.23 100 30 0.99 67.4 39 0.92 46.0 54 0.95 NA NA NA NA NA NA 0.95 Iran 3.3 1 26.2 7 2.20 55.3 27 1.30 75.0 29 1.04 100 33 0.78 71.4 40 0.66 49.4 48 0.71 25.9 66 1.09 NA NA NA 1.16 Turkey 1.8 1 23.2 9 3.79 47.1 16 1.73 75.1 21 1.13 100 25 0.91 70.4 37 0.58 50.9 44 0.57 NA NA NA NA NA NA 0.61 Russia 2.7 1 26.1 22 1.92 26.1 26 1.66 74.6 38 1.77 100 41 1.73 NA NA NA NA NA NA NA NA NA NA NA NA 1.71 Average Rt 3.36 1.81 1.34 1.03 0.67 0.57 0.51 Table S1. Duration times and Rt values in the increase and decrease period based on the daily case ratio
The intervals from the peak to < 100 cases in China and South Korea were both 30 days. In addition, the intervals from the peak to −50%, from −50% to 25%, and from −25% to < 100 cases were 9, 6, and 15 in China and 4, 5, and 21 in South Korea, respectively, in which South Korea revealed a relatively long decreasing time from −25% to < 100 cases than China. By May 4, 2020, the daily cases in Germany, Italy, Spain, France, and Iran dropped to approximately −25%; UK and Turkey to roughly −50%, while those in Russia and the US were still at a high plateau. Calculating the intervals from the peak to −50% and −25% revealed markedly long time intervals in Germany (15 and 28), Iran (15 and 33), France (18 and 22), more than 30 days in Spain (30 and 39), and Italy (31 and 43), respectively. The intervals from the top to −50% in UK and Turkey were 24 and 19 days, respectively (Figure 1).
Furthermore, the time interval of the high plateau (75% to −75%) of the daily cases in each country was analyzed. As shown in Figure 1, the high plateau of China lasted for only 8 days with a peak of 3,704 cases, while that of Iran lasted for 17 days with a peak of 3,186 cases. The time intervals of the high plateau in the countries with peak daily cases ranging from 5,000–10,000 cases were 21 days in France (peak of 7,578 cases), 16 days in Spain (peak of 8,271 cases), 13 days in Italy (peak of 6,557 cases), 15 days in Germany (peak of 6,993 cases), 14 days in UK (peak of 8,681 cases), and 16 days in Turkey (peak of 5,138 cases), respectively. The high plateau of the US lasted for 28 days with a peak of 44,638 cases, while Russia was still at the increasing stage by May 10, 2020.
Since the daily cases exceeding 100 cases, the daily Rt value in each country was measured and is illustrated in Supplementary Figure S1 together with the daily cases. On the day with < 100 cases, the Rt values of China and South Korea were 0.2655 and 0.3672. By May 4, 2020, the Rt values of France, Germany, Italy, Spain, UK, Iran, Turkey, and the US were below 1.0 but mostly still higher than 0.5, while that of Russia (1.7096) was still higher than 1.0 (Supplementary Table S1).
The Rt values of the 25%, 50%, 75%, 100%, −75%, −50%, and −25% days in each country were further analyzed (Supplementary Table S1). Generally, the Rt values of the enrolled countries declined along with the decreases of the daily new cases. Most of the enrolled countries showed the Rt values of approximately 1.0 on the day of the peak. The Rt values of three time-points in the increase period in each country were all higher than 1.0, with an average of 3.36 on the day of 25%, 1.81 on that of 50%, and 1.34 on the day of 75%. On the contrary, the Rt values of three time-points in the decrease period were lower than 1.0, with an average of 0.67 on the day of −75%, 0.57 on that of −50%, and 0.51 on that of −25%. The Rt values of the 11 countries at each time-point seemed to be quite similar, as they varied in a limited range.
As a newly emerging infectious disease, COVID-19 spreads much faster and much more extensively worldwide than its peers such as SARS and MERS[4, 5]. Herein, we have comparatively analyzed the durations based on the alterations of the daily reported cases of 11 affected countries by May 4, 2020. Notably, the duration times of the decreasing periods (from peak to < 100 cases) are much longer than that of the increasing periods (from > 100 cases to the peak). The time intervals of the high plateau (from 75% to −75%) of China and South Korea were significantly shorter than those of the other countries.
Among the 11 analyzed countries, the daily cases of China and South Korea declined to two-digit numbers at more than 40 days post > 100 cases. Contrarily, the durations of many other countries post > 100 cases were already over 60 days by May 4, 2020, including France, Italy, Germany, Spain, US, UK, and Iran, since the rapid increases of COVID-19 cases in those countries had started at the end of February and the beginning of March, 2020. Turkey and Russia entered into their rapidly increasing periods in mid-March, 2020. The epidemics of those two countries are still at high levels, but the duration times post > 100 cases are already 48 and 41 days.
Compared with the other nine countries with an average of 30.4 days from > 100 cases to the peak, the increase times of China and South Korea were much shorter (16 and 12 days). Moreover, the decrease times of China and South Korea were much longer than their increase times (approximately 1.9- to 2.5-fold longer), indicating that it probably required at least more than twice as long to get down to < 100 cases. Only five other countries (France, Germany, Italy, Spain, and Iran) showed a reduction in the daily cases to −25% by May 4, 2020, with an average of 39.4 days. If the decreasing speeds of those five countries were similar to those of China and South Korea, it still needs at least more than 20 days to decrease to < 100 cases per day. UK and Turkey reduced the daily cases to −50% by May 4, 2020, while the US and Russia were still at a high plateau. Obviously, it will take a much longer time to decrease the daily cases to less than 100. The time of daily cases at the high plateau (75% to −75%) is another possible indicator for predicting the epidemic's duration. The time intervals during which the daily cases were at a high plateau in China (8 days) was shorter than that of the six European countries and Iran (average of 16 days), and much shorter than that of the US (28 days). The longer duration at a high plateau reflects the larger number of cases, which will definitely lead to a longer decrease time.
Notably, the Rt values of the analyzed countries reduced to approximately 1.0 on the day with the largest number of cases, highlighting that the transmissibility of COVID-19 has become relatively weak at the peak prevalence. The long duration of the decreasing period is assumed to be correlated with the large number of cases that act as the sources of the epidemic. In addition, the alteration of the daily Rt value seems to be related more closely with the changes in the ratios of daily cases, but not directly with the absolute daily case numbers of the country. Meanwhile, the daily Rt value may also not directly associate with the durations of the high plateau and whole period of the epidemic.
Certainly, the duration of the COVID-19 epidemic is influenced by many factors, including different testing and screening capacity of countries and differences in the principle of case reporting and the role of asymptomatic carriers, among which the strategies and measures of epidemic control play the essential role[6]. Implementation of the control strategy and measure differs between countries. It usually needs a balance of the willingness of the population, social system, public health resources, economic feasibility, etc[7]. China implemented strictly tailored control measures that contributed greatly to shorten the duration time of the epidemic definitely[8, 9].
The data presented here was collected from the websites of various government, mainstream media, and relevant professional websites, which may affect the accuracy and real-time performance. Thus, deviations of the predictions and assessments from reality are probably inevitable. Another limitation in this study is that the size and population density of the enrolled countries were not taken into account, which may influence the shape of the epidemic growth and attenuation curve.
No potential conflicts of interest were disclosed.
The authors would like to thank Yidu Cloud (Beijing) Technology Co., Ltd. for their contributions to the article.
CHEN Cao and DONG Xiao Ping designed the study and drafted the manuscript, CHEN Cao and SHI Qi performed the statistical analysis. DONG Xiao Ping conceived of the study, participated in its design and coordination and helped to draft the manuscript. All authors read and approved the final manuscript.
HTML
 20419.pdf
|

|

 Quick Links
 DownLoad: