-
Heavy alcohol consumption is considered as one of the leading risk factors for several acute and chronic diseases and premature death in adults[1,2]. With the increased life expectancy and aging population, cognitive decline and impairment in older adults have become a major challenge for many countries, including China[3].
Evidence regarding alcohol consumption and cognitive impairment has been controversial. Even though some studies have indicated that moderate alcohol consumption was associated with slower cognitive decline and lower risk of cognitive impairment than abstinence[4–9], other studies failed to find any significant associations[10–12]. In addition to the substantial heterogeneity, the inconsistency observed in previous researches might be mainly due to methodology issues, which may have resulted in exposure misclassification. First, most investigators only examined alcohol use once at the baseline, and changes of drinking habits in their lifetime were not taken into consideration[10,13,14]. Second, former drinkers were not separated from those individuals who were lifetime non-drinkers[1,15], which may lead to selection bias. Third, the criteria for determining the low-to-moderate drinker differed from study to study, so that findings from previous studies varied greatly[12,16].
Recent studies have shown that even moderate drinking could lead to brain damage[17]. However, previous studies primarily focused on the consumption of alcohol rather than alcohol cessation in preventing cognitive impairment. These are two different perspectives from which to study the association between alcohol use and cognitive impairment. Some studies conducted among alcohol-use-disorder or alcohol-dependent patients showed that alcohol cessation had potential beneficial brain effects (e.g., improvement in cortical gray matter, sulcal, and lateral ventricular volumes)[18,19]. However, among non-alcohol-dependent adults, whether the cessation of drinking could attenuate the risk of cognitive impairment remains unknown. The association between the duration of abstinence and cognitive impairment is also unclear.
Therefore, we collected repeated measurements on alcohol consumption to assess the association between alcohol cessation and incidence of cognitive impairment in a 12-year community-dwelling prospective cohort study of Chinese adults age 65 years and older.
-
Participants were recruited from the Chinese Longitudinal Healthy Longevity Survey (CLHLS), an ongoing longitudinal, community-based survey covered 23 provinces in China. Because of the high death rate of the older adults in the study, new participants were recruited at each wave of follow-up survey period to maintain a stable sample size. A detailed description of the CLHLS had been published elsewhere[20]. This study was approved by the Biomedical Ethics Committee of Peking University. All participants or their legal representatives signed written consent forms before the baseline and follow-up surveys.
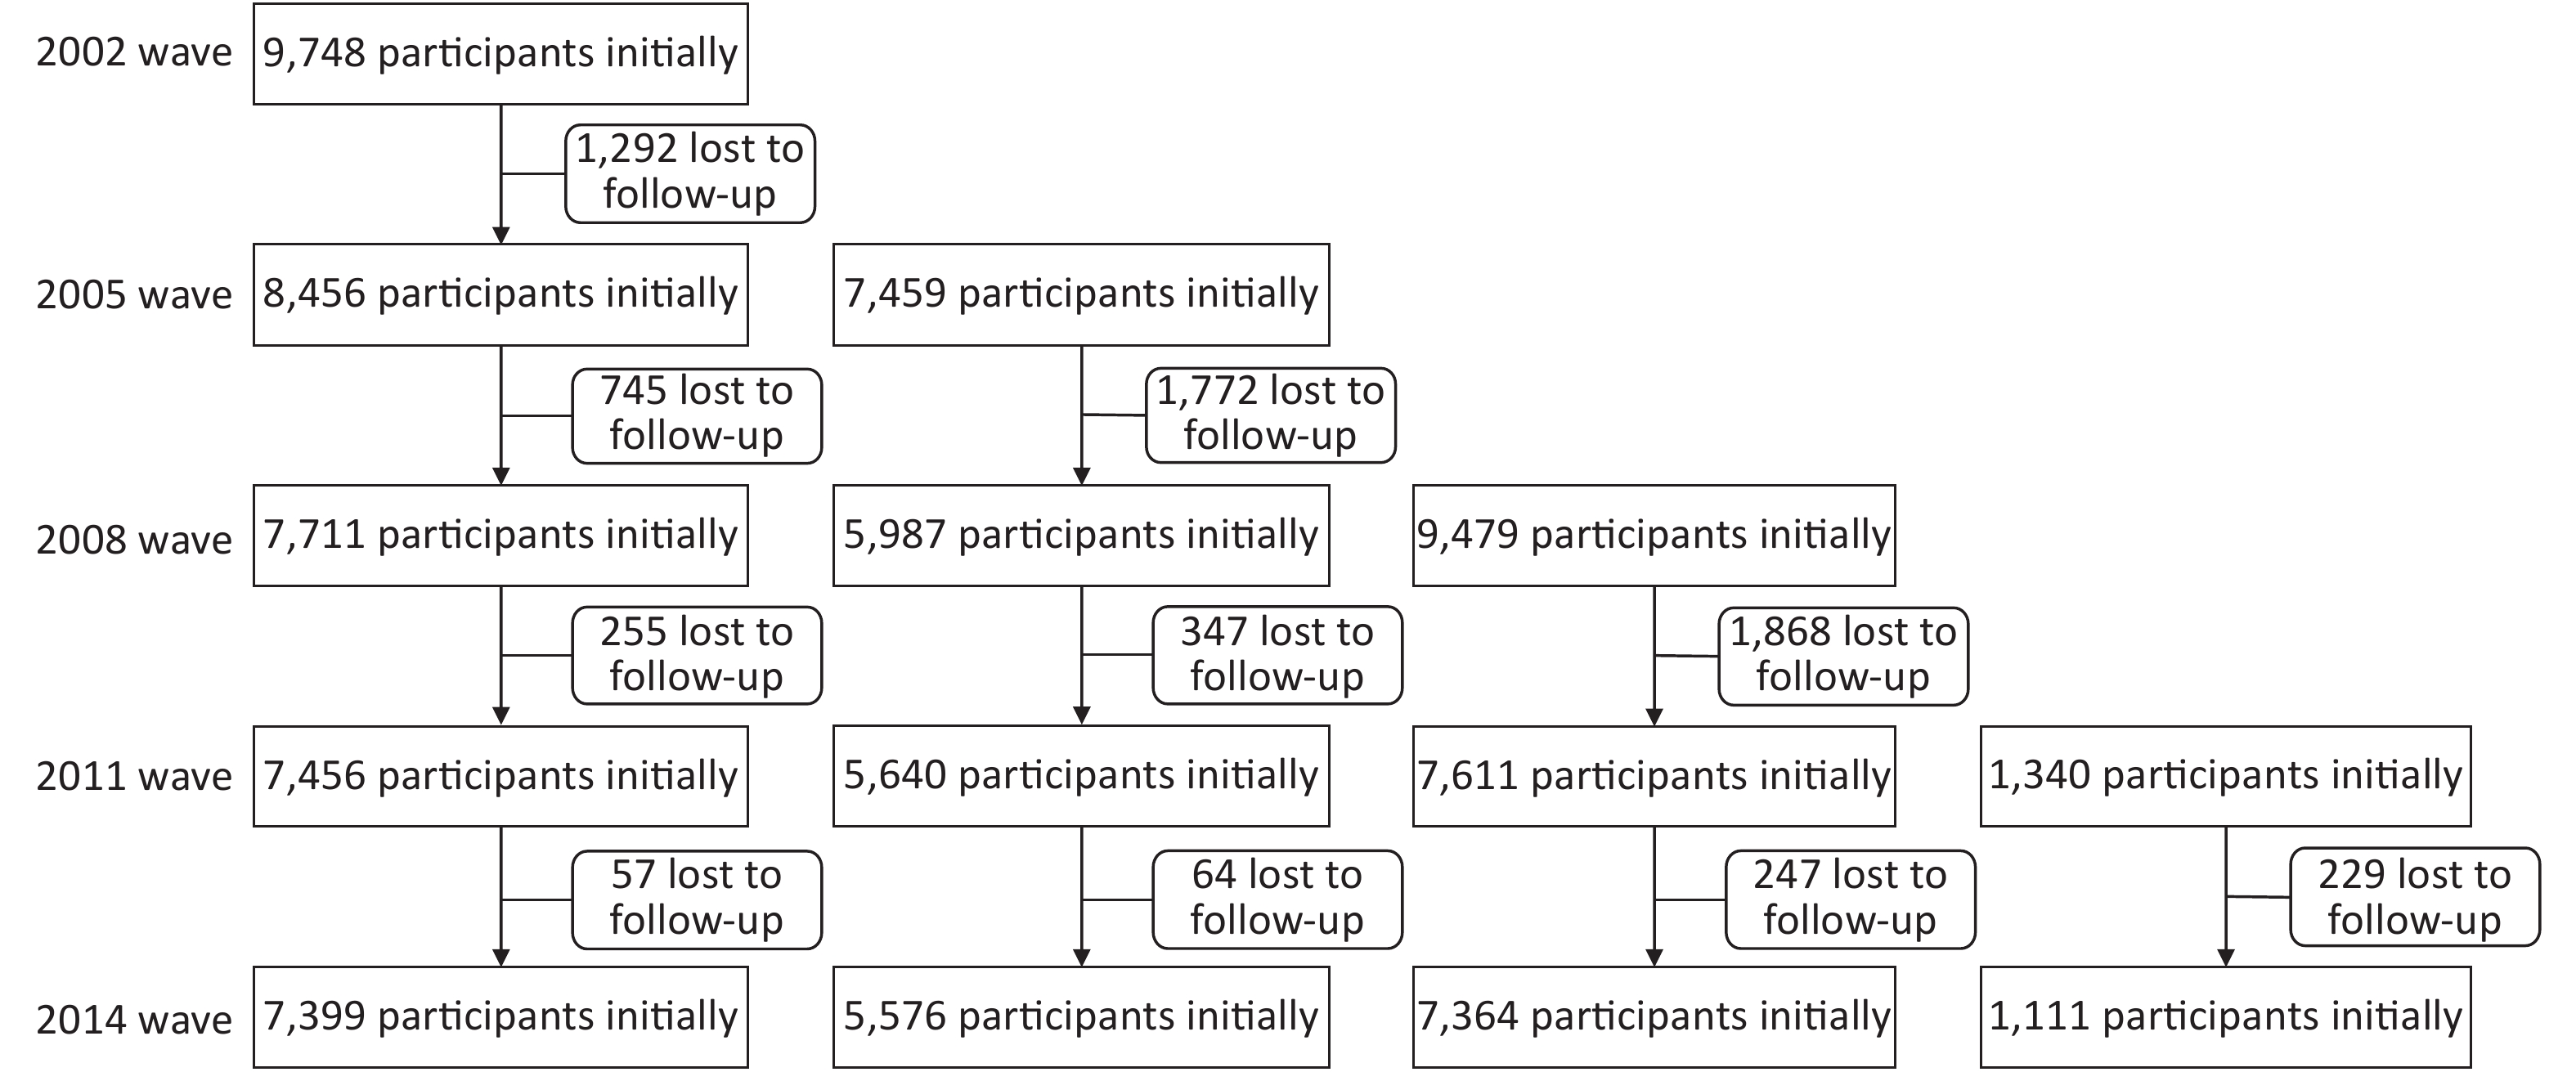
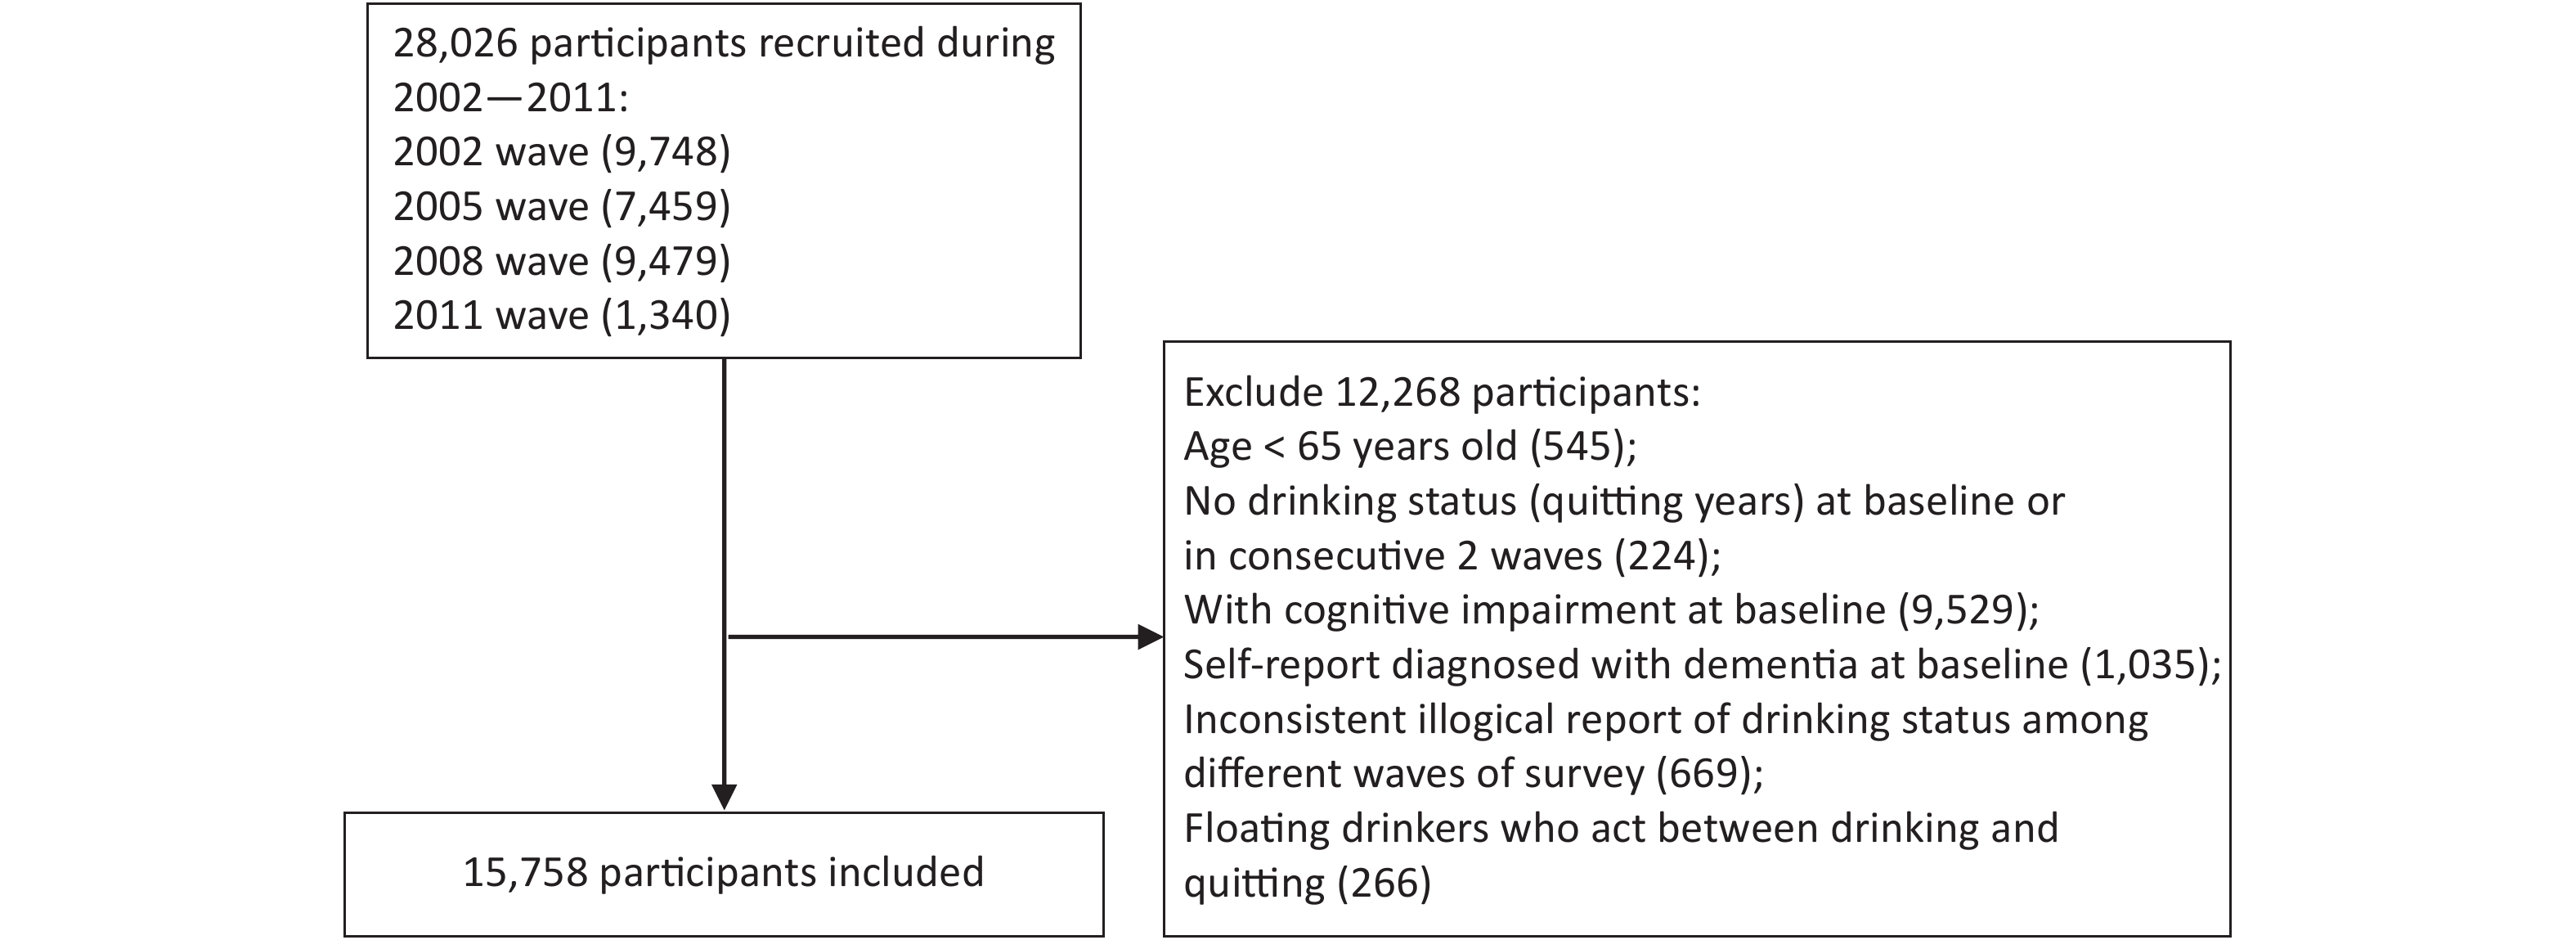
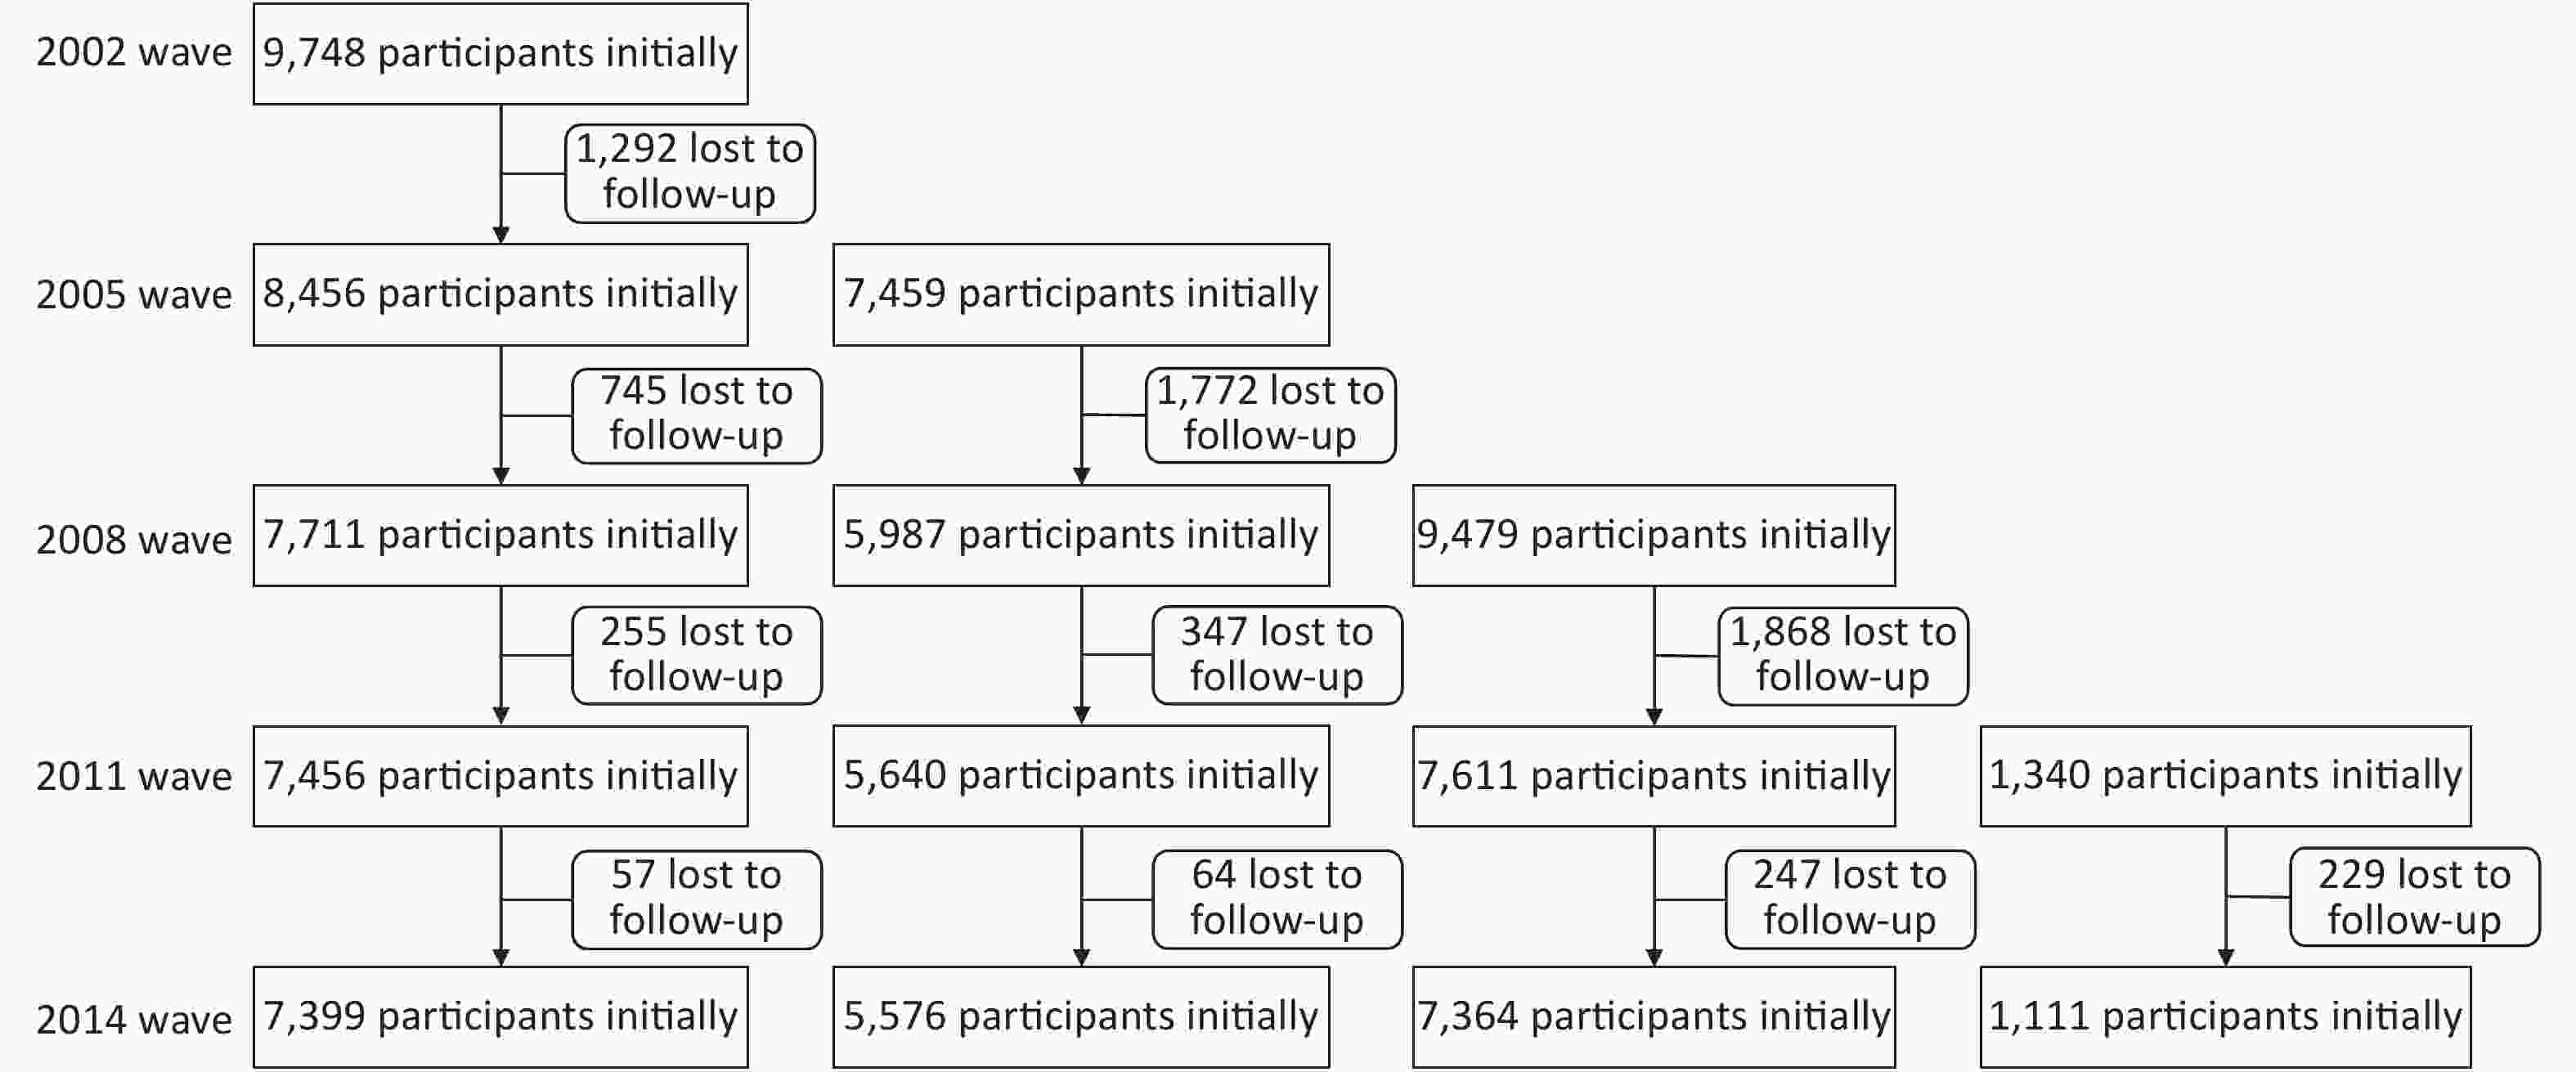
Older adults (above 65 years) recruited from the 2002 survey and new participants from the following 2005, 2008, and 2011 surveys were included in this study. The participants were followed up to 2014. A total of 28,026 participants were recruited, and 6,576 were lost to follow-up during the observation period. The structure of the sample was shown in Supplementary Figure S1 (available in www.besjournal.com). Participants were excluded if they were under 65 years old, exhibited cognitive impairment, or had been diagnosed with dementia at the baseline. Participants with missing information on their drinking status at the baseline or at two or more consecutive surveys, and those who only completed the baseline questionnaire or provided conflicting information concerning their drinking status at the follow-up surveys were further excluded. Participants who self-reported their status as stopped drinking at first but relapsed into alcohol later were excluded to minimize possible bias (Figure 1). Finally, 15,758 participants met the inclusion criteria and were included in the analysis.
-
In each repeated survey, information on current drinking status, types of drinking and alcohol consumption of each participant was collected. Current drinking status was ascertained by the following two questions: “Do you drink alcohol at the present time?” and “Did you drink alcohol in the past?”. Participants who kept drinking throughout the follow-up surveys or initiated drinking during the follow-up were classified as current drinkers. Individuals who never drank even a small amount of alcohol at the baseline survey and maintained a status of not drinking during the follow-up were categorized as non-drinkers. Individuals who drank before but had quit at the time of the baseline survey or at any time during the observation period were categorized as former drinkers.
The duration of alcohol cessation was calculated from the onset of quitting to the incidence of cognitive impairment or the end of the follow-up in this study. Those didn’t drink at present were asked about the age when they stopped drinking. At each follow-up survey, the beginning of the previous survey period was assumed to be the onset of alcohol cessation for participants who had reported that they were drinkers when they completed the previous survey but were former drinkers in the current survey period. The former drinkers were classified into three groups according to the duration of their drinking cessation: less than five years, five to nine years, and more than nine years.
In each survey, participants were asked about which kind of alcohol they drink (strong liquor, not strong liquor, wine, rice wine, beer, etc.) at present (or in the past) and how much they took in grams per day at present (or in the past). The alcohol consumption was quantified according to the kind of alcohol respondents answered. If a participant stopped drinking during the follow up, then the alcohol consumption before quitting was the average consumption of each survey when he still drank alcohol. Current drinkers were further divided into light-moderate drinkers and heavy drinkers according to Chinese Dietary Guidelines (2016). For male, alcohol consumption ≤ 25 g/day was considered as light-moderate drinking, > 25 g/day was considered as heavy drinking. For female, alcohol consumption ≤ 15 g/day was defined as light-moderate drinking, > 25 g/day was defined as heavy drinking. P50 (30 g/d) of the alcohol consumption was used to classify the former drinkers into two groups, which were light-moderate drinking and heavy drinking.
-
The primary outcome was cognitive impairment. Cognitive function was evaluated using the Chinese version of the Mini-Mental State Examination (MMSE), which is a 30-point evaluation tool used to assess cognitive performance. Since performance on the MMSE test was strongly associated with educational level, the validated education-based cutoff scores were used to define cognitive impairment. A MMSE score of less than 20 was used to define cognitive impairment for participants who had never been to school, and a MMSE score of less than 23 was used to define cognitive impairment for participants with one to six years of formal education, and a MMSE score of less than 27 was used to define cognitive impairment for those with more than six years of formal education[21,22]. Cognitive function was evaluated repeatedly at the baseline and follow-up surveys.
Survival status was examined at every follow-up survey. The death time of a participant was ascertained by a close family member of the decedent or the village doctor. Participants who could not be found or contacted were defined as lost to follow-up. Death of the participant was considered as a competing event with cognitive impairment. Participants who did not experience cognitive impairment or died during the follow-up were considered as censored observations.
-
Standard structured questionnaires were used to collect information, including age, sex, marital status, residential area, financial status, smoking status, physical activity, fresh fruit intake, fish intake, self-reported medical history (hypertension, diabetes mellitus, heart disease, cerebrovascular disease, and cancer), and activities of daily living (ADL).
Marital status was categorized as “not married” if the participant had never been married or widowed or divorced, and “married” if the participant was currently married. Residential area was classified as urban areas and rural areas. Financial status was evaluated by the question “How do you rate your economic status compared with others in your local area?”, and was grouped into “rich” “average” and “poor”. Physical activity was evaluated using the question, “Did you do exercises regularly in the past?” Participants who answered “yes” were classified as people having regular physical activity. Fish and fresh fruit intake at present were grouped into “every day” “often” “occasionally” and “rarely or never” according to the participants self-reporting. ADL disability was defined as the participant being dependent for help from others for toileting, bathing, indoor activities, dressing, eating, or continence.
-
Cause-specific hazard models were used to explore the associations between alcohol cessation and incident cognitive impairment. This method has been used for studying the etiology of an association when competing risks exist[23]. In our study, the competing event was death. Models were sequentially adjusted for age, sex, marriage status, education status, residential areas and financial status (Model 1), plus smoking status (current smoker, former smoker, or non-smoker), frequency of fish intake, regular physical activity (yes or no), frequency of fresh fruit intake, (Model 2), plus ADL (disability or normal), self-reported hypertension, diabetes, heart disease, stroke, cancer and baseline MMSE score (Model 3). Model 3 was the primary model. The restricted cubic spline was used to delineate the relationship between years since alcohol cessation and the risk of incident cognitive impairment. According to the alcohol cessation, three knots were set at the 5th, 50th, and 95th percentile. Stratified analyses were performed based on the following variables, including age (less than 80 or more than 80 years), sex (male or female), smoking status (never, former, or current), regular physical activity (yes or no), self-reported chronic diseases (yes or no, and if yes, defined as having any of the following diseases, hypertension, diabetes mellitus, heart disease, cerebrovascular disease, or cancer). The stratified analyses were completed using Model 3.
Several sensitivity analyses were conducted. 1) Participants died or loss to follow-up at the first year of follow-up were excluded. 2) Participants died or loss to follow-up at the first two years of follow-up were excluded. 3) Participants lost to follow-up were excluded. 4) Additional adjustments were made in the history of alcohol consumption for former drinkers. 5) MMSE score of 24 was used as an alternative cutoff value to define whether or not a participant was cognitive impairment.
All P-values were calculated as two-sided, with statistical significance determined by a false discovery rate of less than 0.05. Data were analyzed using SAS version 9.4 (SAS Institute Inc., Cary, USA) and R version 4.0.0 (R Foundation for Statistical Computing, Vienna, Austria).
-
This study included 15,758 participants with 61,032 person-years of follow-up data. The mean age was 82.8 (± 11.9) years at baseline. 7,199 (45.7%) participants were male, and 12,319 (78.2%) were in the rural area. Current drinkers accounted for 17.6% of the participants, 69.6% were non-drinkers, and 12.8% were former drinkers who had ceased drinking at the time of the baseline survey or during the follow-up time. The characteristics of individuals with different alcohol use status are presented in Table 1.
Characteristics Current drinkers Former drinkers Nondrinkers P value Quit < 5 years Quit 5–9 years Quit > 9 years Age, mean ± SD, y 82.1 ± 11.8 80.6 ± 10.8 77.5 ± 10.2 83.4 ± 11.5 83.3 ± 12.0 0.004 65–79 1,232 (44.5) 364 (48.6) 310 (60.3) 298 (39.8) 4,494 (40.9) < 0.001 80– 1,534 (55.5) 385 (51.4) 204 (39.7) 451 (60.2) 6,486 (59.1) Sex < 0.001 Male 2,028 (73.3) 591 (78.9) 410 (79.8) 597 (79.7) 3,573 (32.5) Female 738 (26.7) 158 (21.1) 104 (20.2) 152 (20.3) 7,407 (67.5) Residence < 0.001 Urban 523 (18.9) 146 (19.5) 104 (20.2) 192 (25.6) 2,474 (22.5) Rural 2,243 (81.1) 603 (80.5) 410 (79.8) 557 (74.4) 8,506 (77.5) Marital statusa < 0.001 In marriage 1,338 (48.4) 410 (54.7) 296 (57.6) 350 (46.7) 4,062 (37.0) Not in marriage 1,428 (51.6) 339 (45.3) 218 (42.4) 399 (53.3) 6,914 (63.0) Educational levela < 0.001 None 1,269 (46.2) 344 (46.2) 203 (39.5) 348 (46.6) 7,144 (65.6) 1–6 years 1,092 (39.7) 295 (39.5) 220 (42.8) 307 (41.1) 2,808 (25.8) 6– years 387 (14.1) 107 (14.3) 91 (17.7) 92 (12.3) 940 (8.6) Living pattern < 0.001 Live without family 2,339 (84.6) 641 (85.6) 419 (81.5) 641 (85.6) 9,013 (82.1) Live with family 427 (15.4) 108 (14.4) 95 (18.5) 108 (14.4) 1,967 (17.9) Smoking statusa < 0.001 Nonsmoker 1,149 (41.5) 262 (35.0) 141 (27.5) 201 (26.8) 8,705 (79.3) Current smoker 1,170 (42.3) 298 (39.8) 198 (38.5) 186 (24.8) 1,411 (12.9) Former smoker 447 (16.2) 189 (25.2) 175 (34.0) 362 (48.4) 856 (7.8) Physical activitya < 0.001 No 987 (35.7) 285 (38.1) 207 (40.3) 302 (40.3) 3,329 (30.4) Yes 1,779 (64.3) 464 (61.9) 307 (59.7) 447 (59.7) 7,626 (69.6) Fish intake < 0.001 Everyday 607 (21.9) 155 (20.7) 101 (19.6) 150 (20.1) 2,146 (19.5) Often 1,238 (44.8) 362 (48.3) 229 (44.6) 300 (40.1) 4,805 (43.8) Occasionally 796 (28.8) 196 (26.2) 157 (30.5) 241 (32.3) 3,248 (29.6) Rarely or never 125 (4.5) 36 (4.8) 27 (5.3) 56 (7.5) 778 (7.1) Participant-reported hypertensiona 389 (14.1) 126 (16.9) 113 (22.0) 181 (24.2) 2,074 (18.9) < 0.001 Participant-reported diabetesa 40 (1.4) 18 (2.4) 17 (3.3) 27 (3.6) 321 (2.9) < 0.001 Participant-reported heart diseasea 168 (6.1) 58 (7.7) 58 (11.3) 93 (12.4) 1,013 (9.2) < 0.001 Participant-reported strokea 89 (3.2) 35 (4.7) 38 (7.4) 70 (9.4) 506 (4.6) < 0.001 Participant-reported cancera 31 (1.1) 11 (1.5) 9 (1.8) 16 (2.1) 149 (1.4) 0.273 ADL disability 283 (10.2) 77 (10.3) 45 (8.8) 137 (18.3) 1,579 (14.4) < 0.001 Note. The sample size for each group (Current drinkers, quit < 5 years, Quit 5–9 years, Quit > 9 years, Nondrinkers) was 2,766, 749, 514, 749, 10,980, respectively. a: missing values existed. ADL, activities of daily living. Table 1. Characteristics of study participants, n (%)
-
During the 61,032 person-years of follow-up (the mean follow-up time was 3.9 years), 3,404 cases of cognitive impairment were identified (704 in wave 2005, 921 in wave 2008, 1,166 in wave 2011, 613 in wave 2014).
Current drinkers especially heavy drinkers showed significantly higher risk of cognitive impairment compared to non-drinkers (Table 2). Former drinking with longer abstinence was associated with lower risk than current drinking. Based on Model 3, the adjusted risk of cognitive impairment for former drinkers quitting drinking less than five years, five to nine years, and more than nine years were 0.94 (95% CI: 0.80–1.10), 0.79 (95% CI: 0.66–0.96), and 0.82 (95% CI: 0.69–0.98), respectively, compared with current drinkers (Table 3). The risk decreased rapidly and reached plateau after 10 years of drinking cessation (Figure 2).
Group NO. of cases/total person-years Model 1 Model 2 Model 3 Nondrinkers 2,336/41,818 1 [Reference] 1 [Reference] 1 [Reference] Light-moderate drinkersbc 160/2,835 1.13 (0.96−1.33) 1.14 (0.97−1.34) 1.15 (0.97−1.35) Heavy drinkersbc 270/4,886 1.18 (1.04−1.34) 1.20 (1.05−1.37) 1.21 (1.06−1.38) Former drinkers 511/9,126 1.00 (0.91−1.11) 1.01 (0.91−1.13) 1.01 (0.91−1.12) Note. aHRs were obtained from cause-specific hazard models. Model 1 was adjusted for age, sex, education status, marriage status, residential area and financial status; Model 2 was adjusted for variables in model 1 plus smoking status, fish intake, fruit intake and exercise status, Model 3 was adjusted for variables in model 2 plus medical history of hypertension, diabetes, heart disease, stroke, cancer, ADL and baseline MMSE score. bLight-moderate drinkers: alcohol consumption ≤ 25 g/day (male), or ≤ 15 g/day (female); Heavy drinkers: alcohol consumption > 25 g/day (male), or > 15 g/day (female). cMissing values existed for alcohol consumption. HR, hazard ratio; MMSE, Mini-mental State Examination; ADL, activities of daily living. Table 2. Hazard ratios for associations of current drinking in different daily consumption and incidence of cognitive impairmenta
Variables Current drinkers Former drinkers Non-drinkers Quit < 5 years Quit 5–9 years Quit > 9 years Cases 557 203 135 173 2,336 Person-years 10,087 3,192 2,850 3,084 41,818 Rate/1,000 person-years 55.2 63.6 47.4 56.1 55.9 HR (95% CI) Model 1 1 [Reference] 0.93 (0.79−1.09) 0.81 (0.67−0.97) 0.88 (0.74−1.04) 0.88 (0.80−0.97) Model 2 1 [Reference] 0.94 (0.80−1.10) 0.80 (0.66−0.97) 0.85 (0.71−1.01) 0.86 (0.78−0.95) Model 3 1 [Reference] 0.94 (0.80−1.10) 0.79 (0.66−0.96) 0.82 (0.69−0.98) 0.85 (0.77−0.94) Note. aHRs were obtained from cause-specific hazard models. Model 1 was adjusted for age, sex, education status, marriage status, residential area and financial status; Model 2 was adjusted for variables in model 1 plus smoking status, fish intake, fruit intake and exercise status, Model 3 was adjusted for variables in model 2 plus medical history of hypertension, diabetes, heart disease, stroke, cancer, ADL and baseline MMSE score. HR, hazard ratio; MMSE, Mini-mental State Examination; ADL, activities of daily living. Table 3. Hazard ratios for association between alcohol use and the incidence of cognitive impairmenta
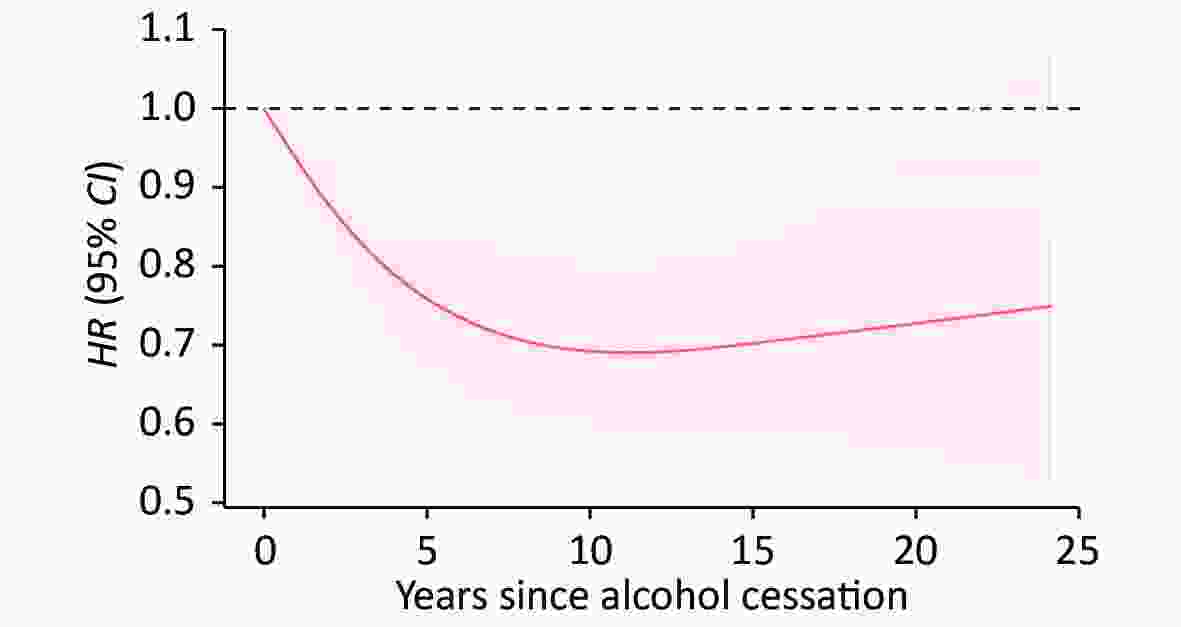
Figure 2. Association between alcohol cessation and risk of incident cognitive impairment. The association between alcohol cessation and risk of incident cognitive impairment was delineated using restricted cubic splines, and adjusted for age, sex, education status, marriage status, residential area, financial status, smoking status, fish intake, fruit intake, exercise status, medical history of hypertension, diabetes, heart disease, stroke, cancer and activities of daily living (ADL). The reference group is current smokers. The red line and red shading indicate hazard ratio (HR) and 95% CI.
The hazard ratio for former drinkers who used to drink more than 30 g/d was 0.95 (95% CI: 0.82–1.11) and for those used to drink 30 g/d or less was 0.78 (95% CI: 0.66–0.91), which indicated that less alcohol consumed before quitting was associated with a significantly reduced risk of cognitive impairment than current drinking (Table 4).
Group NO. of cases/total person-years Model 1 Model 2 Model 3 Current drinker 557/10,087 1 [Reference] 1 [Reference] 1 [Reference] Former drinker, ≤ 30 g/day 229/4,027 0.80 (0.68, 0.93) 0.79 (0.67, 0.92) 0.78 (0.66, 0.91) Former drinker, > 30 g/day 246/4,476 0.97 (0.83, 1.13) 0.96 (0.82, 1.12) 0.95 (0.82, 1.11) Note. aHRs were obtained from cause-specific hazard models. Model 1 was adjusted for age, sex, marriage status, education status, residential area and financial status; Model 2 was adjusted for variables in model 1 plus smoking status, fish intake, fruit intake and exercise status, Model 3 was adjusted for variables in model 2 plus medical history of hypertension, diabetes, heart disease, stroke, cancer, ADL and baseline MMSE score. HR, hazard ratio; MMSE, Mini-mental State Examination; ADL, activities of daily living. Table 4. Hazard ratios for different daily alcohol consumption before quitting in former drinkers, HR (95% CI)
-
In males and females, the decreased risks of cognitive impairment for drinking cessation of 5–9 years were both observed. Among participants under 80 years old, drinking cessation for less than 5 years was related to reduced risk than current drinking (adjusted hazard ratio [aHR] = 0.72; 95% CI: 0.54–0.96). While in older adults over 80 years old, the association was not significant (Table 5). Among former smokers and current smokers, non-drinking was associated with lower risk of cognitive impairment than current drinking, the adjusted HR were 0.67 (95% CI: 0.5–0.9) and 0.75 (95% CI: 0.62–0.91), respectively.
Characteristics NO. of cases/
total person-yearsCurrent
drinkersFormer drinkers Non-drinkers P value for
interactionQuit < 5 years Quit 5–9 years Quit > 9 years Sex 0.019 Male 1,371/28,132 1 0.97
(0.81, 1.18)0.83
(0.67, 1.03)0.84
(0.68, 1.03)0.77
(0.67, 0.88)Female 2,033/32,899 1 0.86
(0.63, 1.17)0.66
(0.44, 0.99)0.74
(0.53, 1.05)0.94
(0.81, 1.1)Age (years) < 0.001 ≥ 80 2,170/26,605 1 1.06
(0.87, 1.29)0.73
(0.55, 0.97)0.87
(0.7, 1.1)0.97
(0.85, 1.1)< 80 1,234/344,265 1 0.72
(0.54, 0.96)0.8
(0.61, 1.03)0.74
(0.56, 0.97)0.68
(0.58, 0.8)Chronic diseasesb 0.642 Yes 1,106/20,886 1 1.05
(0.78, 1.41)0.73
(0.53, 1.01)0.87
(0.65, 1.15)0.84
(0.7, 1.02)No 2,295/40,097 1 0.87
(0.72, 1.06)0.82
(0.64, 1.04)0.79
(0.63, 0.99)0.85
(0.76, 0.96)Physical activity 0.241 Yes 1,066/20,747 1 0.89
(0.68, 1.18)0.75
(0.55, 1.02)0.96
(0.73, 1.27)0.78
(0.65, 0.93)No 2,335/40,238 1 0.94
(0.77, 1.15)0.82
(0.64, 1.04)0.74
(0.59, 0.93)0.89
(0.79, 1.01)Smoking status 0.013 Nonsmoker 2,390/39,973 1 0.96
(0.75, 1.23)0.83
(0.6, 1.13)0.82
(0.61, 1.11)0.95
(0.83, 1.08)Current smoker 644/13,687 1 0.88
(0.68, 1.14)0.77
(0.57, 1.04)0.77
(0.55, 1.07)0.75
(0.62, 0.91)Former smoker 368/7,350 1 0.94
(0.65, 1.38)0.73
(0.48, 1.09)0.77
(0.55, 1.06)0.67
(0.5, 0.9)Note. aHR were analyzed with Model 3. bChronic diseases included hypertension, diabetes, stroke, other cerebrovascular disease, heart disease and cancer. If any one of the above is reported by the subject, then he (she) was classified as having chronic disease. Table 5. Hazard ratios for association between alcohol use and the incidence of cognitive impairment among different subgroups, HR (95% CI)a
-
When excluding events died or loss to follow-up within the first one and two years or excluding participants lost to follow-up, or when MMSE score < 24 was used to define cognitive impairment, the association between alcohol use and cognitive impairment did not substantially alter. The decreased trend remained with years of cessation when we accounted for the history of the volume of alcohol consumption for the former drinkers in the cause-specific hazard model. Compared with people who ceased drinking for less than five years, the HRs for those who quitted for five to nine years and more than nine years were 0.82 (95% CI: 0.65–1.04) and 0.79 (95% CI: 0.63–0.99), respectively.
-
In this longitudinal study, lifetime alcohol use, especially alcohol cessation, was examined in relation to risk of cognitive impairment in the older Chinese population. Both light-moderate drinking and heavy drinking were associated with increased risk of incident cognitive impairment than non-drinking. Compared to current drinking, abstained from drinking for more than 5 years or used to drink 30 g per day or less before quitting were both associated with lower risks of cognitive impairment. With restricted cubic spline, the hazard ratio was found to decrease with longer cessation duration and reach plateau after 10 years.
Several studies about current drinking and cognitive impairment were conducted in Chinese. A cohort study carried out in Chongqing showed that among people older than 60 year old, daily drinking was associated with increased risk of Alzheimer’s Disease (HR = 2.25, 95% CI: 1.43–3.97) and Vascular dementia (HR = 3.42, 95% CI: 1.18–4.51)[24]. Another Chinese cross sectional study including 16,328 older adults found that drinking > 14 standard drinks per week was associated with worse episodic memory[25]. Our study also found that current drinking was associated with increased risk of cognitive impairment, and the association of heavy drinking was even stronger.
Most researches on alcohol use and cognitive function were focused on alcohol consumption rather than cessation of drinking. Our prospective study found that both non-drinking and former drinking had a lower risk of cognitive impairment than current drinking, which corresponds with the research conducted in alcohol-dependent people. Previous studies on alcohol-use-disorder patients found that abstinence from alcohol could reverse much of the damage to the brain[26,27]. For example, a study that included 102 alcoholics showed that after six months of abstinence, the direct mean scores in all cognitive areas were improved[28]. And in another study, the improvement in neurocognitive functions was observed after three months of abstinence[18].
However, the Korean Longitudinal Study of Aging found that female past drinkers were more likely to develop cognitive impairment than current drinkers (OR: 1.9, 95% CI: 1.1–3.5)[29], which was inconsistent with our findings. The reason for this difference might be that the Korean study was a cross-sectional study, and the sample size of former drinkers was small (n = 394). Our prospective study has been followed up for 12 years with 2,766 current drinkers, 2,012 former drinkers, and 10,980 non-drinkers, which are more likely to have a powerful statistic effectiveness to assess the association between alcohol cessation and cognitive impairment.
Recent clinical and epidemiological studies have revealed that even a small amount of drinking may exert adverse effects on the brain[16,17], through neurotoxic effects, pro-inflammatory effects, and indirect effects from cerebrovascular disease[13]. Among these mechanisms, the neurotoxic effects might be mediated through damage to brain structures from alcohol, including reduced grey matter density, reduced white matter microstructure integrity, and hippocampal atrophy, which were regarded as sensitive and specific markers for Alzheimer’s disease[14,16,17,30]. The neurotoxic effects might be mediated indirectly through thiamin deficiency, metabolite toxicity, electrolyte imbalance, or accompanying physical illnesses, including liver disease and infections.
Our study also found that longer duration of abstinence correlated with lower risk of cognitive impairment. When former drinkers quitted drinking for more than five years, their risk of getting cognitive impairment was reduced 19% compared to current drinkers. In a study conducted with alcohol-dependent patients, researchers discovered that patients who abstained from alcohol for less than one year made more errors in cognitive tests than patients with longer durations of abstinence[31].
Stratified analysis showed that the association between alcohol cessation and cognitive impairment might be influenced by gender, age and smoking status (P for interaction < 0.02). Previous studies had shown that females were more vulnerable to organ damage even with moderate drinking, and experienced more difficulty with recovering from alcohol-induced cognitive impairment[32,33]. We found that female participants who ceased drinking for 5–9 years also had a significantly lower risk than current drinkers (aHR = 0.66; 95% CI: 0.44–0.99). But this finding need to be verified by more follow-up researches, since the relatively small sample size of female former drinkers (n = 414) and current drinkers (n = 738) compared to that of men.
In our study, the association of participants over 80 years old who quitted drinking for less than 5 years with cognitive impairment was not significant. It might imply that more time is needed for one to recover from alcohol harm with aging. While aging alone was an important risk factor for cognitive impairment[34], older people also were more susceptible to the harmful effects of alcohol use[35].
Among current and former smokers, never drinking was associated with reduced risk of cognitive impairment than current drinking. However, the association was not statistically significant in non-smokers. Smoking and drinking might have synergistic effects on cognitive impairment, as demonstrated in previous studies. An prospective study, which found that smokers who consumed a large amount of alcohol showed a faster cognitive decline of 36%[36]. Another study in Singapore Chinese population showed those who were both current smokers and regular drinkers (OR = 1.77, 95% CI: 1.39–2.26) had an increased risk of incident cognitive impairment than those neither smokers nor drinkers (OR = 1.77, 95% CI: 1.39–2.26)[37]. Though chronic cigarette smoking appeared to have a negative impact on neurocognition during early abstinence from alcohol[38]. Our study implied that among smokers, years of alcohol cessation was associated with reduced risk of incident cognitive impairment.
-
As far as we know, this is the first study to examine the association between alcohol abstinence and cognitive impairment in non-dependent drinkers. Our study, conducted in China, had a large sample size of older adults to explore the association. The repeated assessments of the participants’ alcohol consumption status allowed us to identify those individuals who initiated drinking or ceased drinking during the 12 years of follow-up, improving the accuracy of exposure measurements. Furthermore, we used cause-specific hazard models that considered competing risks to present a more robust hazard ratio for cognitive impairment.
This study also has several limitations. First, alcohol-use-disorder participants could not be identified and excluded from the current drinker group, which would increase the hazard ratios for this group. However, according to some literature, the percentage of alcohol-use-disorder patients among older adults is quite low (1%–3%)[39]. Therefore, the impact of these people could not cause substantial changes on the results. Second, the alcohol consumption status and other confounding factors such as clinical diseases were self-reported, which might lead to information bias. Third, this study focused on older adults aged 65 and over, so these observations might not be generalized to younger adults. Fourth, MMSE test as a screening tool for cognitive impairment and dementia, might not be used alone without other clinical tests for clinical diagnosis. However, MMSE test was applied widely in the epidemiological studies for community dwelling people and showed acceptable sensitivity and specificity[40]. Fifth, for participants stopped drinking during the follow-up, information on their exact quitting date was not collected in the survey. We considered the beginning of the previous survey to be the onset of the alcohol cessation[41]. Finally, the effects of acute alcohol withdrawal, such as illness and death[42], were not observed in this study.
-
In this study, we found that both cessation of drinking and never drinking were associated with the risk of cognitive impairment assessed by MMSE than current drinking in the older adults age 65 and above. The longer time abstained from alcohol consumption, the more reduced risk was observed. Lower historical daily alcohol consumption was also associated with lower risk of cognitive impairment. Thus, alcohol cessation should be emphasized in older adults to prevent cognitive impairment. It is never late to stop drinking, even in later life.
-
We thank staff at the provincial and county-level centers for Disease Control and Prevention for carrying out the fieldwork and data collection, and all the older adults who participated in the study.
-
The authors have no conflict of interest to report.
-
X-CZ contributed to the study concept, data analysis and drafted the manuscript. X-MS designed the survey and directed its implementation. XG, Y-BL, CM, and X-MS helped to interpreted the results and provided critical revisions. J-HZ, YW, Z-XY, and J-XM helped on statistical analysis and correction of the manuscript. All authors approved the final version of the manuscript.
Alcohol Cessation in Late Life is Associated with Lower Risk of Cognitive Impairment among the Older Adults in China
doi: 10.3967/bes2021.071
- Received Date: 2020-10-28
- Accepted Date: 2021-04-12
-
Key words:
- Cognition /
- Alcohol abstinence /
- Alcohol drinking /
- Epidemiology /
- Aging
Abstract:
| Citation: | ZHANG Xiao Chang, GAO Xiang, LYU Yue Bin, ZHOU Jin Hui, WEI Yuan, YIN Zhao Xue, MA Ji Xiang, MAO Chen, SHI Xiao Ming. Alcohol Cessation in Late Life is Associated with Lower Risk of Cognitive Impairment among the Older Adults in China[J]. Biomedical and Environmental Sciences, 2021, 34(7): 509-519. doi: 10.3967/bes2021.071 |




 Quick Links
 DownLoad:
