


-
Folate and vitamin B12 are involved in the carbon metabolism pathway supplying essential methyl groups for DNA and protein synthesis and play a vital role in individual health. They have also been shown to be associated with cardiovascular disease, especially stroke[1]. A recent study showed that stroke was the leading cause of death and disability-adjusted life years (DALYs) at the national level in China[2]. Therefore, the nutritional status of folate and vitamin B12 in the Chinese population is a concern. The elderly are more prone to develop folate and vitamin B12 deficiencies due to poor appetite, dental defects, and issues with digestion. Our previous study showed that insufficient dietary folate and vitamin B12 intake were particularly salient among rural elderly Chinese populations[3]. However, few studies have assessed folate and vitamin B12 status in vivo in this population.
Since human cells cannot synthesize folate and vitamin B12 de novo, these vitamins must be obtained from dietary sources. Hence, dietary factors play an important role in folate and vitamin B12 levels. The geographical environment, food culture, and dietary habits are markedly different between southern and northern China, resulting in distinct dietary patterns and nutritional status[4]. However, there are currently no relevant studies on the determinant factors in the diet that contribute to these geographical differences in folate and vitamin B12 status among the elderly Chinese population. Accordingly, the objective of this study was to determine folate and vitamin B12 status among the rural elderly population in the northern and southern counties of China and to elucidate the possible dietary factors related to folate and vitamin B12 deficiencies in these regions.
Two rural non-impoverished counties were randomly selected in the south and the north of China from surveillance sites included in the 2015 China Chronic Disease and Nutrition Surveillance Study. These sites were Luxi County, the Honghe Hani and Yi Autonomous Region, Yunnan Province in the south and Wuyuan County, Bayannaoer, the Inner Mongolia Autonomous Region of China in the north. Using a random cluster sampling method from each county, a random sample of residents aged 60 years and older was surveyed from the two selected villages. A total of 439 participants were included in the study and analyzed. All participants signed informed consent, and the study was approved by the Ethics Committee of the National Institution for Nutrition and Health, Chinese Center for Disease Control and Prevention.
A face-to-face interview was conducted at the participants’ homes by trained interviewers using a standard questionnaire to collect individual demographic, socioeconomic, and lifestyle information. A semi-quantitative food frequency questionnaire was used to investigate the frequency and amount of food intake during the past year, and the daily consumption of various foods and crude energy intake were calculated. Anthropometric measurements were taken by highly trained staff at the local community health service centers using uniform equipment. Body mass index (BMI) was calculated as weight (kg) divided by height squared (m). Venous blood was extracted from all participants after an overnight fast of at least 10 h. Serum concentrations of folate and vitamin B12 were measured by electrochemiluminescence immunoassay (ECLIA) using commercial kits (Cobas Folate, vitamin B12 reagent kit, Roche Diagnostics, Mannheim, Germany) on a Cobas e601 analyzer (Roche Diagnostics, Mannheim, Germany). Based on the WHO Technical Consultation on folate and vitamin B12 deficiencies[5], the cut-off value for defining deficiencies according to metabolic indicators was set at < 4 ng/mL (10 nmol/L) for serum folate and < 203 pg/mL (150 pmol/L) for serum vitamin B12. Throughout the test, the intra- and inter-assay Coefficient of Variation (CV) across the full range of concentrations were 4%–9% for serum folate and 3%–7% for serum vitamin B12.
Data analysis was performed using SAS for Windows V9.3 (SAS Institute, Cary, NC, USA). Due to the skewed distribution, the geometric mean (GM) and the 95% CI were used to describe the concentrations of serum folate and vitamin B12. The analysis of covariance was conducted to compare the difference of serum folate and vitamin B12 concentrations among the groups after controlling for the potential confounders of age, gender, region, BMI, education level, income level, energy intake, and current drinking and smoking status. For categorical variables, the Chi-square test was used to examine differences between the groups. BMI was classified as underweight, normal weight, overweight, and obese (BMI < 18.5, 18.5–23.9, 24–27.9, and > 28.0, respectively). Food intake was categorized as quartiles, tertiles, or binary variables depending on the distribution of consumption. The factors contributing to folate and vitamin B12 deficiency were determined by univariate and multivariate logistic regression analysis. A P value < 0.05 was considered statistically significant.
A total of 439 subjects aged ≥ 60 years were included in this study, with an average age of 71.0 years (Supplementary Table S1, available in www.besjournal.com). A total of 223 participants lived in Wuyuan County (northern rural) and 216 participants lived in Luxi County (southern rural). The northern participants were slightly older, had a higher BMI, and more were smokers compared to the southerners (P < 0.05). Overall, the geometric mean concentration of serum folate among the subjects was 5.99 ng/mL and the prevalence of folate deficiency was 27.3%. For vitamin B12, the geometric mean concentration was 318.6 pg/mL and the prevalence of vitamin B12 deficiency was 14.1%. This indicated that folate and vitamin B12 status were worse in the rural compared to the urban elderly population in China[6] as well as the elderly in the United States[7].
Item Wuyuan County (n = 223) Luxi County (n = 216) Total (n = 439) t or χ2 (P-value)& Age#, $ \bar \chi $ ± s 71.8 ± 6.3 70.2 ± 7.4 71.0 ± 6.9 2.371 (0.018) BMI#, $ \bar \chi $ ± s 24.1 ± 3.7 21.7 ± 3.5 22.9 ± 3.8 7.052 (< 0.001) Male, n (%) 113 (50.7%) 109 (50.5%) 222 (50.6%) 0.019 (0.889) Energy, kcal/d, $ \bar \chi $ ± s 2,064 ± 1,122 1,957 ± 1,116 2,010 ± 1,119 1.00 (0.316) Han ethnic, n (%) 209 (93.7%) 214 (99.1%) 423 (96.4%) 0.705 (0.401) Education level*, n (%) 27.141 (< 0.001) High 3 (1.3%) 7 (3.2%) 10 (2.3%) Medium 121 (54.3%) 68 (31.5%) 189 (43.0%) Low 99 (44.4%) 141 (65.3%) 240 (54.7%) Income level*, n (%) 23.032 (< 0.001) High 15 (6.7%) 5 (2.3%) 20 (4.5%) Medium 69 (30.9%) 38 (17.6%) 107 (24.4%) Low 139 (62.3%) 173 (80.1%) 312 (71.1%) Marital status, n (%) 5.297 (0.151) Single 47 (21.1%) 50 (23.1%) 97 (22.1%) Has a partner 176 (78.9%) 166 (76.9%) 342 (77.9%) Smoke, n (%) 7.931 (0.005) yes 96 (43.0%) 65 (30.1%) 161 (36.7%) no 127 (57.0%) 151 (69.9%) 278 (63.3%) Drink, n (%) 0.025 (0.875) yes 40 (17.9%) 40 (18.5%) 80 (18.2%) no 183 (82.1%) 176 (81.5%) 359 (81.8%) Note. #: $ \bar \chi $: mean, s: standard deviation. *: Education level: low for illiterate; medium for primary school or below but able to read and write, or junior high school; high for senior high school or above. Income level = annual average income: low for < 5,000 RMB; medium for 5,000–20,000 RMB; high for ≥ 20,000 RMB. &: Continuous variables using a Student t-test to compare; categorical variables used χ2 test to compare. Table S1. General characteristics of participants in the study
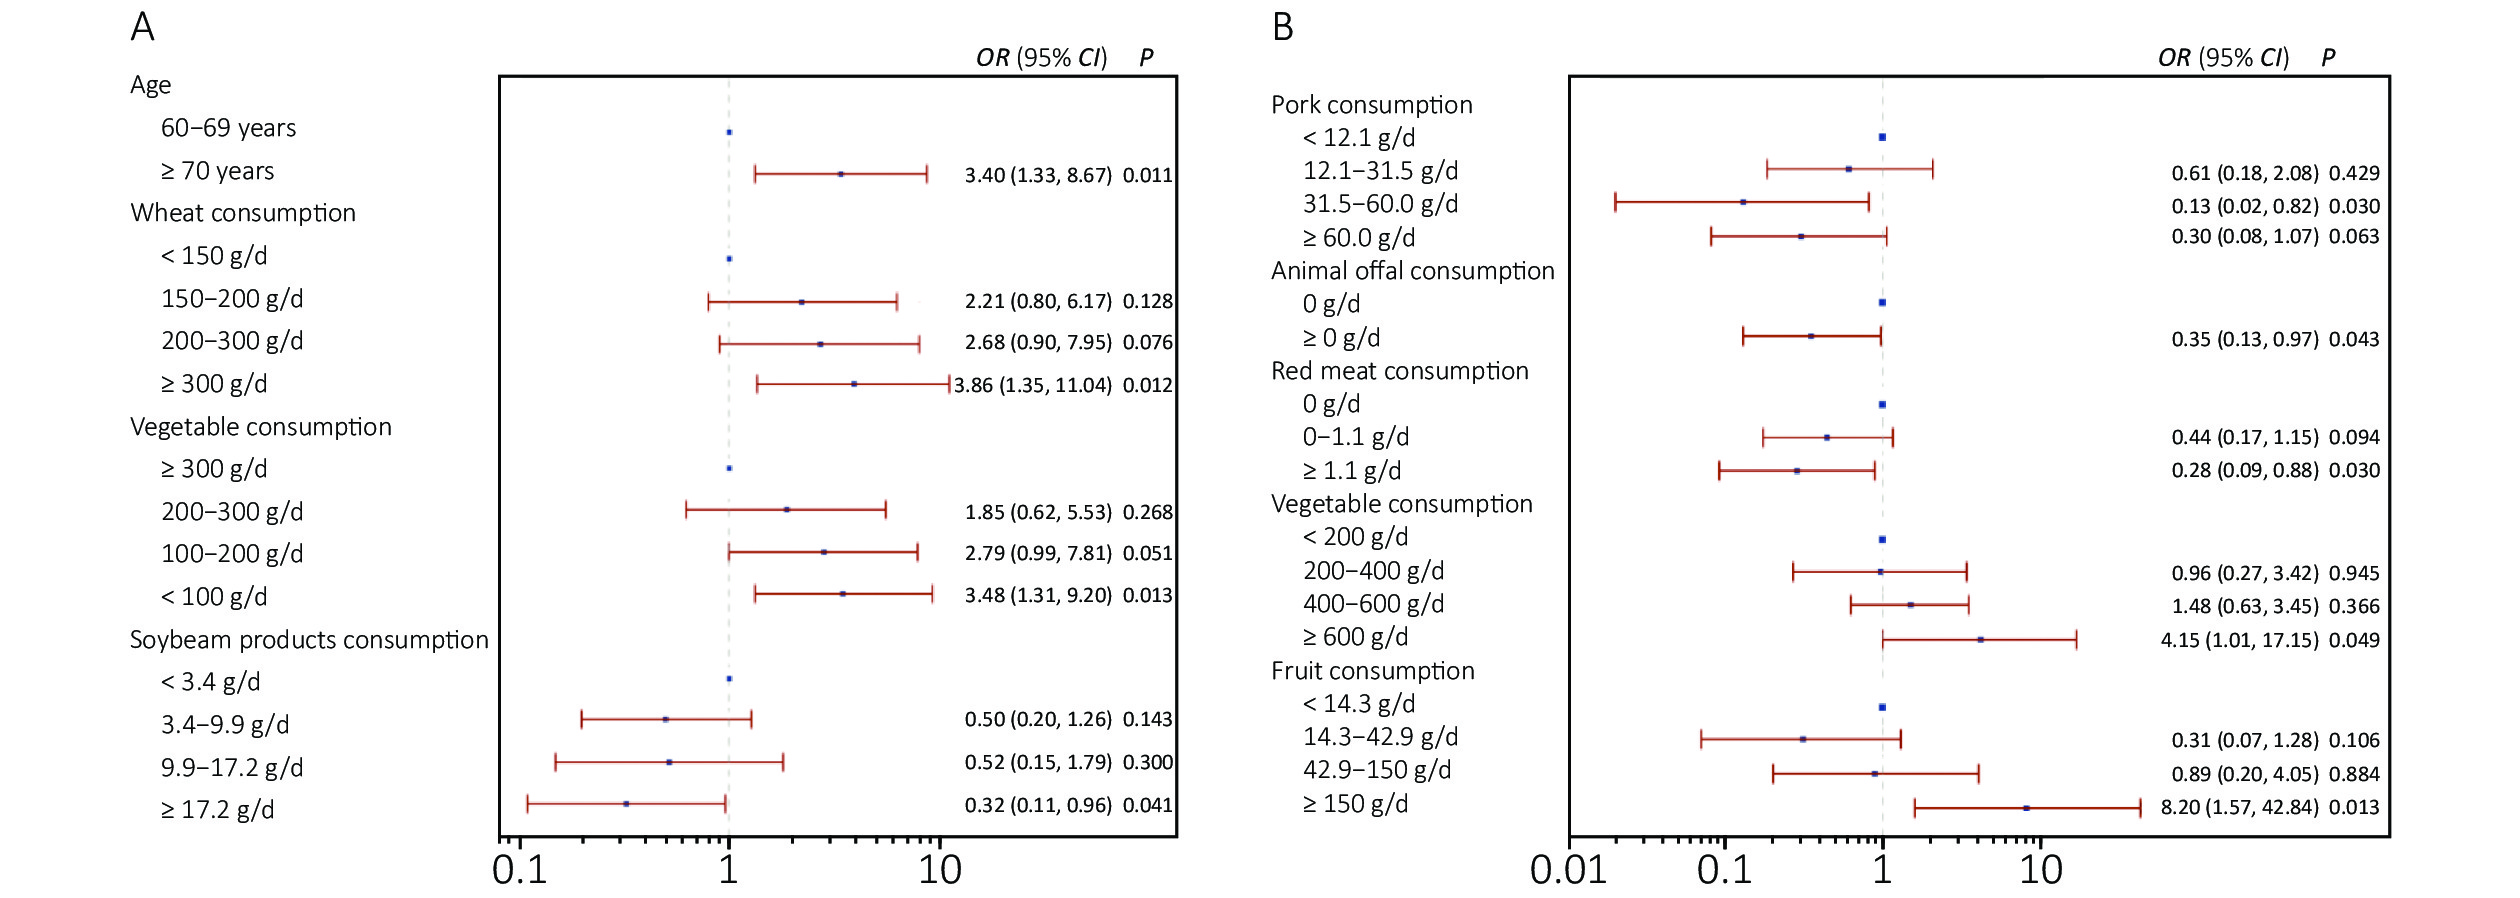
Moreover, the prevalence of folate deficiency was significantly higher among the elderly living in Wuyuan County (47.5% vs. 6.4%), and the odds ratio (OR) of folate deficiency with regions was 13.072 (95% CI: 7.159–23.867, P < 0.001). The results were presented in Table 1. These findings may be attributed to the presence of several independent dietary factors. In our advanced analysis, we found that moderate vegetable intake (100–300 g/d) and nut consumption (≥ 0 g/d) were negatively associated with folate deficiency while high wheat consumption was positively associated with folate deficiency, with an OR of 6.19 (95% CI: 1.41–27.20, P = 0.016), 6.89 (95% CI: 1.60–29.59, P = 0.010), 0.40 (95% CI: 0.17–0.96, P = 0.031), and 0.44 (95% CI: 0.20–0.99, P = 0.048) (Supplementary Table S2, available in www.besjournal.com). In addition, among the northern rural elderly Chinese population, high wheat consumption (≥ 300 g/d) (OR = 3.86, 95% CI: 1.35–11.04, P = 0.012) and low vegetable consumption (≤ 100 g/d) (OR = 3.48, 95% CI: 1.31–9.20, P = 0.013) were positively associated with folate deficiency and high soybean and soybean product consumption (≥ 17.2 g/d) (OR = 0.32, 95% CI: 0.11–0.96, P = 0.041) were inversely associated with folate deficiency (Figure 1A). Green leafy vegetables, legumes, nuts, and liver are high in folates, whereas some staple foods such as wheat and tuber contain little. The traditional dietary pattern in the south includes rice as the major staple food with plenty of vegetable and pork dishes, and the traditional northern dietary pattern is comprised of a high intake of wheat, other cereals, and tubers[4]. Riaz et al. demonstrated that most wheat cultivars in northern China lack folate and had a poor ability to accumulate it[8]. The rural northerners in the current study tended to eat more wheat and consume less vegetables, fruits, and nuts, which might partly explain the difference in blood folate concentrations and folate deficiencies between the two regions.
Variables Wuyuan County Luxi County Total n Geometric mean (ng/mL) (95% CI) Deficiency, % (95% CI) n Geometric mean (ng/mL) (95% CI) Deficiency, % (95% CI) n Geometric mean (ng/mL) (95% CI) Deficiency, % (95% CI) Overall 223 4.16
(3.84, 4.51)*47.5
(40.8, 54.3)*216 8.75
(8.23, 9.30)6.4
(3.6, 10.6)439 5.99
(5.63, 6.37)27.3
(23.2, 31.8)Sex Male 113 3.87
(3.48, 4.29)52.2
(42.6, 61.7)109 7.56
(6.92, 8.25)‡9.2
(4.5, 16.2)222 5.38
(4.96, 5.84)‡31.2
(25.1, 37.6)Female 110 4.48
(3.95, 5.08)42.6
(33.1, 52.5)107 10.18
(9.45, 10.97)3.7
(1.0, 9.3)217 6.70
(6.11, 7.35)23.3
(17.8, 29.5)Age (years) 60–69 83 4.68
(4.12, 5.30)38.8
(28.4, 50.0)106 9.58
(8.89, 10.31)1.9
(0.2, 6.6)189 6.99
(6.42, 7.61)18.2
(13.0, 24.4)≥ 70 138 3.88
(3.49, 4.31)#52.9
(44.2, 61.5)#106 7.99
(7.27, 8.79)##11.0
(5.8, 18.4)##244 5.31
(4.88, 5.78)##34.4
(28.5, 40.7)##BMI Underweight 12 5.19
(3.11, 8.65)25.0
(0.5, 49.5)37 8.05
(7.05, 9.19)2.7
(0.7, 7.9)49 7.23
(6.17, 8.47)8.2
(0.5, 15.8)†Normal weight 104 4.11
(3.65, 4.62)51.9
(42.3, 61.5)129 9.17
(8.46, 9.94)7.0
(2.6, 11.4)233 6.39
(5.86, 6.97)27.0
(21.3, 33.2)Overweight 73 3.98
(3.45, 4.59)52.1
(40.6, 63.5)41 8.01
(6.91, 9.29)7.3
(0.2, 15.3)114 5.13
(4.54, 5.80)†36.0
(21.2, 44.8)Obese 34 4.38
(3.61, 5.32)32.4
(16.6, 48.1)9 9.64
(6.95, 13.37)11.1
(0.3, 31.6)43 5.09
(4.21, 6.16)†27.9
(14.5, 41.3)Smoker Yes 96 3.88
(3.47, 4.33)51.0
(41.0, 61.0)65 7.55
(6.76, 8.44)&9.2
(2.2, 16.3)161 5.08
(4.63, 5.59)&&34.2
(26.8, 41.5)&No 127 4.39
(3.91, 4.92)44.9
(36.2, 53.5)151 9.34
(8.69, 10.03)5.3
(1.7, 8.9)278 6.59
(6.09, 7.13)23.4
(18.4, 28.4)Drinker Yes 40 3.67
(3.00, 4.48)52.5
(37.0, 68.0)40 7.54
(6.62, 8.59)$7.5
(0.0, 15.7)80 5.28
(4.58, 6.09)30.0
(20.0, 40.0)No 183 4.27
(3.91, 4.67)46.5
(39.2, 53.7)176 9.06
(8.46, 9.70)6.3
(2.7, 9.8)359 6.16
(5.75, 6.59)26.7
(22.2, 31.3)Note. *P < 0.001 compared with the southern population; ‡P < 0.001 compared with women; #P < 0.05; ##P < 0.01 compared with the elderly aged 60–69 years; †P < 0.01, ††P < 0.001 compared with the elderly with normal weight; &P < 0.05, &&P < 0.001 compared with non-smokers; $P < 0.05 compared with non-drinkers. Table 1. Distribution of serum folate concentration in the elderly rural Chinese population by geographic, demographic, and lifestyle factors
Dietary group Folate deficiency Vitamin B12 deficiency Q1 Q2 Q3 Q4 P-value Q1 Q2 Q3 Q4 P-value Rice 1 0.76
(0.39−1.49)0.60
(0.27−1.33)0.40
(0.14−1.13)0.084 1 3.09
(0.98−9.78)1.92
(0.56−6.54)3.03
(0.83−11.13)0.177 Wheat 1 1.90
(0.53−6.87)6.19
(1.41−27.20)6.89
(1.60−29.59)0.039 1 1.39
(0.64−2.99)1.27
(0.32−5.05)0.62
(0.14−2.70)0.481 Coarse grain# 1 0.97
(0.47−1.99)1.32
(0.63−2.79)− 0.588 1 1.75
(0.82, 3.70)1.06
(0.41, 2.78)− 0.280 Tubers 1 1.26
(0.58, 2.74)1.41
(0.63, 3.11)1.60
(0.70, 3.65)0.724 1 0.89
(0.39, 2.04)1.01
(0.38, 2.68)0.69
(0.27, 1.78)0.866 Pork 1 1.72
(0.77, 3.86)1.56
(0.69, 3.55)2.00
(0.90, 4.49)0.373 1 0.71
(0.29, 1.78)0.85
(0.33, 2.20)0.81
(0.33, 1.96)0.904 Red meat# 1 2.04
(0.78, 5.35)1.99
(0.66, 6.00)− 0.347 1 0.62
(0.33, 1.16)0.34
(0.13, 0.83)− 0.027 Poultry 1 0.88
(0.32, 2.39)0.70
(0.27, 1.78)0.53
(0.19, 1.45)0.605 1 1.14
(0.47, 2.81)0.50
(0.17, 1.43)1.12
(0.32, 3.92)0.386 Animal offals& 1 1.05
(0.58, 1.92)− − 0.871 1 0.76
(0.35, 1.67)− − 0.494 Aquatic products& 1 1.09
(0.59, 2.01)− − 0.791 1 0.69
(0.31, 1.54)− − 0.369 Milk& 1 1.05
(0.61, 1.81)− − 0.868 1 0.53
(0.29, 0.98)− − 0.042 Eggs 1 0.93
(0.39, 2.18)1.86
(0.84, 4.12)0.71
(0.32, 1.59)0.084 1 1.05
(0.42, 2.60)1.30
(0.55, 3.05)0.99
(0.35, 2.84)0.924 Soybean products 1 0.62
(0.29, 1.33)0.76
(0.35, 1.62)0.56
(0.25, 1.26)0.492 1 0.62
(0.26, 1.49)0.81
(0.34, 1.94)0.80
(0.31, 2.07)0.767 Vegetable 1 0.72
(0.36, 1.45)0.40
(0.17, 0.96)0.91
(0.46, 1.83)0.041 1 1.13
(0.41, 3.12)2.28
(0.70, 7.45)1.06
(0.42, 2.68)0.491 Fruit 1 1.04
(0.51, 2.14)0.76
(0.31, 1.84)0.99
(0.40, 2.42)0.902 1 0.72
(0.29, 1.77)0.52
(0.19, 1.40)1.68
(0.66, 4.24)0.110 Nuts& 1 0.44
(0.20, 0.99)− − 0.048 1 1.76
(0.80, 3.86)− − 0.158 Note. *: Using multivariate logistic regression analysis models adjusted for age, gender, BMI, education level, income level, smoke and drink status, energy intake and food consumption. #: Food intake categorical levels were: none, below or above medium intake; &: Food intake categorical levels were: no consumption and consumption. Table S2. Odds Ratio (95% CI) for prevalence of folate and vitamin B12 deficiency by quartiles of dietary food intake among the subjects*
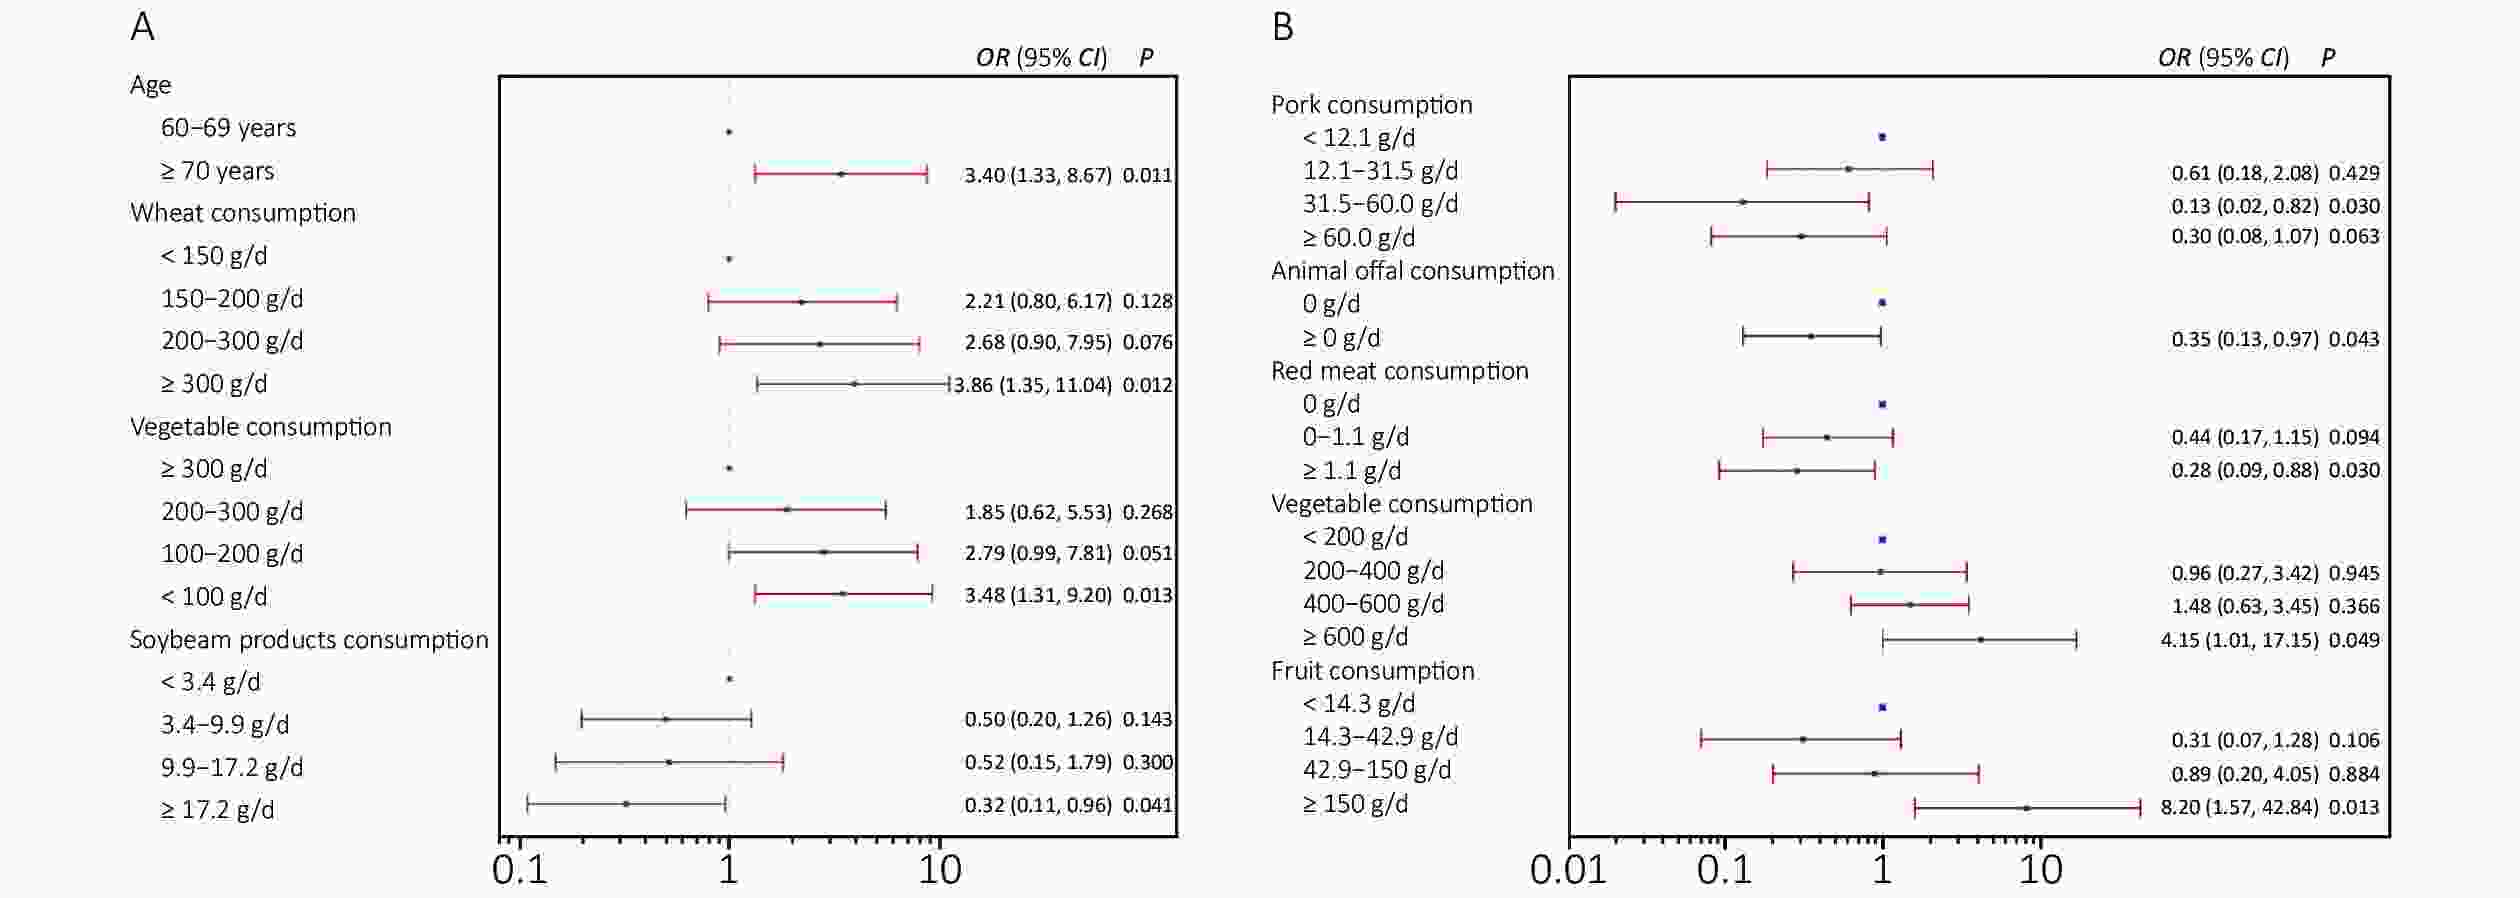
Figure 1. (A) Odds ratios of dietary and demographic factors for folate deficiency among the elderly in rural northern China. (B) Odds ratios of dietary factors for vitamin B12 deficiency among the elderly in rural southern China. Models were controlled for independence variables using multivariate logistic regression analysis, with the normal folate group or normal vitamin B12 group as the reference.
On the other hand, as shown in Table 2, the southern elderly population had significantly lower serum B12 concentrations than the northerners, even after controlling for confounders (P = 0.0019). Accordingly, the subjects in the south had a higher prevalence of vitamin B12 deficiency than those in the north (20.8% vs. 7.6%) (P = 0.0001). After further analysis, an inverse association was found between higher red meat (≥ 13.3 g/d) and milk consumption (> 0 g/d) and vitamin B12 deficiency (OR = 0.34, 95% CI: 0.13–0.87, P = 0.025; OR = 0.53, 95% CI: 0.29–0.98, P = 0.042, respectively) (Supplementary Table S2). Moreover, among the southern elderly, moderate pork consumption (31.5–100.0 g/d), animal offal intake (≥ 0 g/d), and higher red meat intake (> 1.1 g/d) were found to be inversely related to vitamin B12 deficiency (Figure 1B). Vitamin B12 is synthesized exclusively by microorganisms and must be obtained by the regular intake of food rich in vitamin B12. Excellent sources of B12 are foods of ruminant origin; therefore, dairy and meat products play an important role in meeting daily vitamin B12 intake requirements. As expected, we found that the northern rural elderly consumed more animal food, including red meat, poultry, animal offal, seafood, dairy products, and eggs than the southern elderly population (Supplementary Table S3, available in www.besjournal.com). Beyond this, we found high levels of vegetable (≥ 600 g/d) and fruit (≥ 150 g/d) intake were positively associated with vitamin B12 deficiency in the southerners, with an OR of 4.15 (95% CI: 1.01–17.15) and 8.20 (95% CI: 1.57–42.84), respectively. Vitamin B12 is virtually absent in vegetables, which may have serious implications for certain populations. A previous study suggested that vitamin B12 deficiency was common among vegetarians who had very low or no intake of animal food[9]. This might explain the regional differences in vitamin B12 levels between the two counties in our study.
Variables Wuyuan County Luxi County Total n Geometric mean
(pg/mL) (95% CI)Deficiency, %
(95% CI)n Geometric mean
(pg/mL) (95% CI)Deficiency, %
(95% CI)n Geometric mean
(pg/mL) (95% CI)Deficiency, %
(95% CI)Overall 223 340.1
(323.3, 357.7)*7.6
(4.5, 11.9)**216 297.7
(278.4, 318.4)20.8
(15.6, 26.9)439 318.6
(305.5, 332.4)14.1
(11.0, 17.7)Sex Male 113 339.3
(315.5, 365.0)9.7
(5.0, 16.8)109 303.8
(279.1, 330.6)16.5
(10.1, 24.8)222 321.4
(304.0, 339.8)13.1
(8.9, 18.2)Female 110 341.3
(317.5, 367.0)5.6
(2.1, 11.7)107 291.7
(262.3, 324.4)25.2
(17.3, 34.6)217 315.9
(296.2, 336.9)15.4
(10.8, 20.9)Age (years) 60–69 83 351.6
(325.5, 379.8)5.9
(1.9, 13.2)106 306.3
(282.9, 331.6)16.8
(10.3, 25.3)189 325.4
(307.6, 344.3)12.0
(7.8, 17.4)≥ 70 138 333.4
(311.8, 356.4)8.7
(4.6, 14.7)106 289.4
(259.4, 323.0)24.8
(17.0, 34.0)244 313.5
(295.0, 333.2)15.8
(11.5, 21.0)BMI Underweight 12 315.6
(244.0, 408.1)16.7
(2.1, 37.8)37 344.9
(276.1, 430.7)16.2
(4.3, 28.1)49 337.5
(283.2, 402.1)16.3
(6.0, 26.7)Normal weight 104 340.3
(315.9, 366.5)7.7
(2.6, 12.8)129 273.4
(253.6, 294.9)25.6
(18.1, 34.0)233 301.7
(285.6, 318.7)17.6
(12.7, 22.5)Overweight 73 341.9
(314.0, 372.1)6.9
(1.1, 12.6)41 309.6
(270.5, 354.3)12.2
(2.2, 22.2)114 329.8
(306.8, 354.5)8.8
(3.6, 14.0)Obese 34 344.9
(296.4, 401.3)5.9
(0.7, 13.8)9 471.3
(291.9, 760.9)††11.1
(0.3, 31.6)43 366.0
(315.9, 424.0)†7.0
(1.5, 19.1)Smoker Yes 96 351.0
(327.7, 376.7)4.2
(0.2, 8.2)65 306.4
(277.6, 338.2)12.3
(4.3, 20.3)&161 332.3
(313.8, 352.0)7.5
(3.4, 11.5)&No 127 332.1
(308.1, 357.1)10.2
(5.0, 15.5)151 294.1
(269.6, 320.8)24.5
(17.6, 31.4)278 311.0
(293.5, 329.4)18.0
(13.5, 22.5)Drinker Yes 40 353.5
(311.8, 400.7)10.0
(0.0, 19.3)40 313.8
(280.4, 351.2)7.5
(0.02, 15.7)$80 332.8
(306.2, 361.7)8.8
(0.03, 14.9)No 183 337.3
(319.0, 356.6)7.1
(3.4, 10.8)176 294.1
(271.8, 318.3)23.9
(17.6, 30.2)359 315.6
(300.7, 331.1)15.3
(11.6, 19.1)Note. *P < 0.01, **P < 0.001 compared with the southern population; #P < 0.05, ##P < 0.01 compared with the elderly aged 60–69 years; †P < 0.05, ††P < 0.01 compared with the elderly with normal weight; &P < 0.01 compared with non-smokers; $P < 0.05 compared with non-drinkers. Table 2. Distribution of serum vitamin B12 concentrations in rural elderly Chinese by geographic, demographic, and lifestyle factors
Item Wuyuan County (n = 223) Luxi County (n = 216) Total (n = 439) M P25, P75 M P25, P75 M P25, P75 Rice 28.6 (21.4, 64.3) 200.0* (100.0, 220.0) 100.0 (28.6, 200.0) Wheat 200.0* (150.0, 300.0) 3.3 (1.0, 12.7) 50.0 (3.3, 200.0) Coarse grain 14.3* (2.9, 30.0) 2.1 (0.0, 6.7) 5.7 (0.0, 20.0) Tubers 50.0 (14.3, 100.0) 37.9 (14.3, 100.0) 42.9 (14.3, 100.0) Pork 42.9 (14.3, 60.0) 31.5 (12.1, 100.0) 40.0 (14.3, 85.7) Red meat 16.7* (6.7, 33.3) 0.0 (0.0, 1.1) 3.3 (0.0, 20.0) Poultry 10.0* (3.3, 20.0) 0.9 (0.0, 3.3) 3.3 (0.5, 10.0) Animal offal 0.0* (0.0, 1.6) 0.0 (0.0, 0.3) 0.0 (0.0, 1.1) Aquatic products 3.3* (0.5, 8.3) 0.3 (0.0, 2.6) 1.2 (0.0, 6.7) Milk 0.0* (0.0, 41.6) 0.0 (0.0, 6.7) 0.0 (0.0, 28.6) Eggs 17.1* (3.3, 50.0) 10.0 (2.2, 22.9) 12.0 (3.3, 42.9) Soybean products 9.9 (3.4, 17.2) 9.1 (3.8, 15.2) 9.4 (3.8, 15.3) Vegetable 200.0 (100.0, 300.0) 400.0* (200.0, 600.0) 300.0 (100.0, 400.0) Fruit 20.0 (3.3, 64.3) 42.9* (14.3, 114.3) 28.6 (6.7, 100.0) Nuts 0.0 (0.0, 0.0) 0.0* (0.0, 1.7) 0.0 (0.0, 0.3) Note. *: M: Median, P25: 25th percentile, P75: 75th percentile, using Wilcoxon rank sum test to compare between two groups. Table S3. Dietary intakes among the elderly in northern and southern counties
In addition, the prevalence of folate deficiency was higher among the population aged 70 years and older (34.4% vs. 18.2%) and in smokers (34.2% vs. 23.4%) (P < 0.05) (Table 1), whereas the prevalence of vitamin B12 deficiency was much higher in the elderly who were non-smokers (P < 0.01). Dietary micronutrient deficiency is common at advanced ages owing to the interference of oral health problems, poor chewing and swallowing function, and physical and cognitive impairment. The chemical components of tobacco smoke can interact with folate, transform it into inactive compounds, reduce active concentrations in biological fluids, and possibly alter the ability of the cell to store and metabolize folate[10]. Such biological reasons might explain the difference in folate deficiency between the different ages and smoking statuses. Furthermore, we also evaluated the difference in food consumption between the groups with different smoking statuses, and found significantly more animal food, such as pork, red meat, poultry, and seafood, among the elderly who smoked. The higher intake of meat and alcohol might explain the lower prevalence of vitamin B12 deficiency in smokers.
There are several limitations to our study. First, the participants were chosen randomly from surveillance sites in the south and the north that were included in the 2015 China Chronic Disease and Nutrition Surveillance Study, which is a nationally and provincially representative survey that applies stratified multistage systematic clustered random sampling proportional to the populations at the urban, rural, and provincial levels. Thus, the subjects in this study had regional representations to some extent. However, this was only a pilot study due to the small sample size. Therefore, further studies using a multicenter design involving the northern and southern regions with an extensive sample size are necessary to confirm the results. In addition, the long-term or functional indicators of folate and vitamin B12 status should be assessed in future studies, such as red blood cell folate concentrations, methyl methacrylate, and homocysteine levels.
The insufficient status of folate and vitamin B12 among the rural Chinese population aged 60 years and older is a public health concern that must be addressed. In particular, the regional discrepancy in folate and vitamin B12 deficiency requires our attention. Dietary interventions and strategies for implementation should therefore be designed according to these regional differences.
The authors declare no conflicts of interest.
Folate and Vitamin B12 Status and Related Dietary Factors among the Elderly Northern and Southern Rural Chinese Population
doi: 10.3967/bes2021.075
- Received Date: 2020-09-07
- Accepted Date: 2021-02-25
| Citation: | LIU Zhen, MAN Qing Qing, JIA Shan Shan, SONG Peng Kun, WANG Jing Zhong, WANG Xi Le, KANG Bing Xian, YANG Li Gui, ZHANG Jian. Folate and Vitamin B12 Status and Related Dietary Factors among the Elderly Northern and Southern Rural Chinese Population[J]. Biomedical and Environmental Sciences, 2021, 34(7): 552-556. doi: 10.3967/bes2021.075

|

 Quick Links
 DownLoad: