


-
Hypertension is an increasingly prevalent chronic disease that affects approximately 1 billion people worldwide[1]. Elevated blood pressure inflicts long-term damage to various organs, including the kidneys. Hypertension aggravates the clinical course of chronic kidney disease, and promotes progression toward end-stage renal disease. Among the cases of end-stage renal disease, 30% are directly attributable to hypertension[2, 3]. Though the molecular mechanism responsible for renal injury remains largely unknown, elucidating this mechanism is critical to preventing these deleterious complications.
More than 30% of hypertensive pedigrees are estimated to be caused by mitochondrial abnormalities, and several experimental studies have implicated mitochondrial injury in the pathogenesis of kidney damage in hypertension and ischemic stages of kidney disease[2,4]. Eirin et al. reported that hypertensive kidney injury is characterized by the activation of multiple harmful pathways that might be related to mitochondrial integrity and function[1]. Mitochondrial DNA copy number (mtDNA-CN) variation reflects the cell damage induced by oxidative stress, which can be observed in many human diseases[5]. In recent years, a decrease in mtDNA-CN has been shown in many types of cancer, including renal cell carcinoma, indicating that the reduced mtDNA-CN may be related to tumorigenesis. The factors that regulate mtDNA homeostasis are not fully clear, it is likely that both genetic and environmental factors play important roles[6]. In this study, we used peripheral blood cell mtDNA-CN as a surrogate biomarker of systemic mitochondrial function, and designed to test the hypothesis whether hypertension, albuminuria, and urinary albumin-to-creatinine (uACR) diagnosed hypertension combined with albuminuria (HCA) are associated with peripheral blood mtDNA-CN.
A total of 363 miners with hypertension and 295 normotensive subjects were enrolled for the study from July 2013 to December 2013. All participants completed a standard questionnaire which included social-demographic status (age, gender, income, and education), health history, occupational information, and lifestyle factors (smoking, alcohol consumption). General information and biological specimens for each participant were collected and anthropometric measurements were recorded. The BMI was calculated as kilograms per meter squared. Essential hypertension (EH) was defined by the 2010 Chinese Hypertension Management Guidelines. Blood pressure was measured by experienced and certified examiners at least three times in a sitting position after a 10-min break using a mercury sphygmomanometer. The research protocol was approved by the Ethics Committee of Shanxi Medical University (HX201201). Written informed consent was obtained from each participant.
Fresh morning spot urine samples from each subject were collected, centrifuged, and the supernatant was stored. Urinary albumin was measured using the ELISA method (Bio-swamp Bio-technology Co., Ltd, China). Urinary creatinine (Cr) was determined with alkaline picrate, and the creatinine-picrate complex was quantified with spectrophotometry (Tecan Infinite M200 Pro, Swiss). The ACR (mg/g creatinine) was the ratio of the two measurements. Albuminuria was defined by ACR ≥ 18.14 mg/g Cr. All participants were classified into four groups, including a control (n = 194), a hypertension group (n = 32, defined as essential hypertension, and ACR < 18.14 mg/g Cr), a hyperalbuminuria group (n = 101, ACR ≥ 18.14 mg/gCr without hypertension), and a HCA group (n = 331, hypertension with ACR ≥ 18.14 mg/g Cr). EDTA tubes were used to collect peripheral blood samples after overnight fasting (> 12 hours). Whole blood genomic DNA was extracted using the QIAamp DNA Blood Sample Mini Kit (Valencia, California, USA). Quantitative real-time PCR (qRT-PCR) was performed. The quantity and purity of the DNA were assessed using a Nanodrop 2000 spectrophotometer (Thermo Scientific, Wilmington, DE, USA) and the OD260/OD280 values of all DNA samples were 1.7–2.0. The relative copy number of mtDNA was quantified with qRT-PCR, and the nuclear DNA was simultaneously measured and normalized according to methods described previously[7]. The primer sequences L394, 5ʹ-CACCAGCCTAACCAGATTTC-3ʹ, and H475, 5ʹ-GGGTTGTATTGATGAGATTAGT-3ʹ were chosen to measure the mtDNA. The primers HBG1F, 5ʹ-GCTTCTGACACAACTGTGTTCACTAGC-3ʹ and HBG1R, 5ʹ-CACCAACTTCATCCACGTTCACC-3ʹ were used for amplifying the single-copy nuclear β-globin gene. The assay was carried out with the Maxima SYBR Green qPCR MasterMix (Thermo Fisher Scientific, Waltham, MA, USA). The relative mtDNA-CN was calculated by the equation –ΔCt (ΔCt = CtmtDNA−Ctβ-globin). The acceptable standard deviation was set to 0.3. If the result is beyond the acceptable range, the sample was run repeatedly. The samples were categorized into four mtDNA-CN groups: < 5.63, 5.64–6.96, 6.97–8.08, and ≥ 8.09, based on the interquartile range (IQR) of the control group.
The data were double-entered into Epi info (version 3.5.1, CDC, Atlanta, GA, USA). Baseline characteristics were described using mean (SD) for normally distributed variables and median with IQR (25th–75th percentile) for non-normally distributed variables. Categorical variables were presented as percentages of observations and were examined for significant differences with the χ2 test. The skewed values were log transformed for analysis as a normally distributed continuous variable. ANOVA and χ2 tests were performed as appropriate with P values. Odd ratios (ORs) and 95% confidence intervals (CIs) comparing each quartile of mtDNA-CN to the highest quartile were calculated for each study group using a logistic regression model. Adjusted models were controlled for age, sex, education levels, family monthly incoming, tobacco smoking, alcohol consumption, workplace, working shift, and BMI. Those who smoked ≥ 1 cigarette/d in the past 6 months were considered positive for tobacco smoking. Alcohol drinking was positive for those who drank hard liquor, beer, or wine more than or at least once per week in the past 6 months. We further used the restricted cubic spline (RCS) macro in SAS software version 9.4 (SAS Institute Inc., Cary, NC, USA) to create a spline analysis with three knots (25th, 50th, and 75th percentiles) to flexibly model the relationship between mtDNA-CN and the prevalence of hypertension, hyperalbuminuria, and HCA, respectively[7]. Cubic splines were carried out to explore overall relationships between log-transformed mtDNA-CN and the odds of disease development, to reveal evidence of nonlinear dose-response relationship. All showed P values were based on two-sided test with significance level of 0.05.
Totally 658 subjects were registrated in this survey. The mean age of the participants was 44.36 (8.59) years, and 88.1% of the coal miners were male. Of these, 101 had hyperalbuminuria, 32 had essential hypertension, 331 had HCA, and 194 were healthy control individuals. Supplementary Table S1 (available in www.besjournal.com) summarized the general demographic characteristics of participants. Among the four groups, the differences (P < 0.05) in age, sex, education level, marital status, family monthly incoming, work place, working shifts, alcohol consumption, smoking status, BMI, and mtDNA-CN were statistically significant. The median mtDNA-CN was highest among individuals with hypertension (7.98, IQR: 5.83, 9.32) and lowest among those with HCA (6.76, IQR: 5.47, 7.98) (P < 0.05). The mtDNA-CN was lower in hyperalbuminuria (P = 0.02) and HCA (P < 0.01) groups compared with that in the hypertension group as seen in Figure 1. In the HCA group, being male, married, < 45 years old, working underground, working shifts, smoking or alcohol consumption were all associated with having a lower mtDNA-CN compared with the hypertension group. No significant differences were showed among the four different groups concerning education or monthly family incoming (shown inSupplementary Table S2, available in www.besjournal.com). The basic characteristics of different mtDNA-CN quartile groups are also compared. Except for the different distribution of work places in different mtDNA-CN quartile groups (P = 0.008), other factors were not statistically significant in different quartile groups (Supplementary Table S3, available in www.besjournal.com).
Variables Control Albuminuria Hypertension HCA H Pa Age < 45 7.21 (5.65, 8.07) 7.51 (6.12, 8.25) 8.24 (6.88, 9.36) 6.76 (5.71, 8.08)c 8.651 0.034 ≥ 45 7.44 (5.90, 8.08) 6.65 (5.67, 7.86) 6.48 (5.03, 8.43) 6.76 (5.24, 7.95) 4.147 0.246 Z −0.548 −1.726 −1.345 −1.719 Pb 0.584 0.084 0.179 0.086 Sex Male 7.17 (5.82, 8.07) 6.79 (5.78, 8.01) 8.12 (6.48, 9.36) 6.83 (5.47, 8.01)c 12.775 0.005 Female 7.50 (4.98, 8.13) 7.42 (5.67, 8.11) 5.10 (4.83, 5.37) 6.40 (5.47, 7.74) 2.958 0.398 Z −0.510 −0.211 −2.024 −0.835 P 0.610 0.833 0.036d 0.404 Married status Married 7.22 (5.80, 8.09) 6.92 (5.77, 7.98) 7.94 (5.94, 9.17) 6.99 (5.47, 7.97)c −10.688 0.014 Unmarried 5.86 (5.38, 6.16) 7.60 (7.57, 9.00) 9.42 (5.72, 9.70) 7.52 (5.58, 7.99) 5.089 0.165 Z −2.428 −1.179 −0.649 −0.981 P 0.015 0.253d 0.545 0.327 Education College or higher 7.04 (5.29, 8.34) 7.60 (7.39, 9.04) 8.12 (7.65, 9.42) 6.47 (5.08, 8.34) 3.614 0.306 Senior middle school 7.28 (5.77, 8.09) 7.18 (5.67, 8.15) 7.73 (5.48, 9.36) 6.75 (5.48, 7.91) 4.301 0.231 Junior middle school 7.18 (5.94, 8.10) 6..64 (6.01, 7.79) 8.01 (6.48, 9.17) 6.86 (5.34, 7.98) 4.047 0.256 Primary school and less than primary school 7.49 (7.10, 8.15) 7.29 (6.17, 7.57) 10.08 6.30 (5.40, 7.79) 3.564 0.313 H 0.065 1.946 0.635 0.038 P 0.978 0.127 0.599 0.990 Family monthly incoming (yuan) 0– 7.33 (6.14,7.88) 7.42 (5.93, 7.95) 8.65 (5.48, 10.08) 6.40 (5.53, 8.08) 2.528 0.470 4,000– 7.36 (5.66, 8.10) 6.73 (5.67, 7.67) 8.13 (5.97, 9.35) 6.76 (5.41, 7.91) 6.458 0.091 6,000– 6.95 (5.74, 8.19) 7.59 (6.31, 8.23) 8.50 (5.94, 8.76) 6.87 (5.44, 7.93) 2.171 0.538 8,000– 7.28 (6.05, 7.97) 7.60 (5.78, 8.39) 7.65 (7.59, 7.73) 7.39 (4.93, 8.17) 3.660 0.301 H 0.225 0.913 0.083 0.194 P 0.879 0.460 0.982 0.900 Work place Underground 7.13 (5.92, 8.29) 6.95 (6.04, 7.94) 8.76 (6.88, 9.70) 6.67 (5.25, 7.88)c 8.765 0.033 Underground auxiliary 7.18 (5.60, 7.93) 7.46 (6.04, 9.00) 7.97 (6.21, 9.39) 7.21 (5.64, 8.10) 5.239 0.155 Ground 7.48 (6.37, 8.19) 6.73 (5.67, 7.98) 6.72 (4.83, 8.61) 6.42 (5.60, 7.74) 6.478 0.091 Office workers 6.92 (5.45, 7.92) 7.09 (5.59, 7.99) 5.37 (4.23, 8.24) 6.30 (5.26, 8.13) 0.551 0.908 H 1.075 1.334 1.364 0.936 P 0.361 0.268 0.274 0.423 Work shift No 7.15 (5.76, 7.79) 7.34 (5.67, 7.97) 7.83 (5.97, 8.99) 6.38 (5.45, 8.08) 2.612 0.455 Yes 7.22 (5.77, 8.22) 6.82 (5.78, 8.23) 8.19 (5.83, 9.41) 6.96 (5.55, 7.87)c 7.825 0.050 Z 1.506 −0.495 −0.506 −0.176 P 0.134 0.621 0.632 0.860a Alcohol drinking No 7.20 (5.82, 8.17) 6.94 (5.69, 8.00) 7.43 (5.37, 8.43) 6.38 (5.41, 7.85) 6.240 0.100 Yes 7.22 (5.66, 7.93) 7.22 (6.01, 8.07) 8.76 (8.01, 9.53) 7.12 (5.55, 8.09)c 13.746 0.003 Z −0.759 −0.663 −2.513 1.603 P 0.449 0.508 0.011d 0.110 Current Smoking No 7.14 (5.61, 8.16) 7.12 (5.67, 8.11) 7.65 (5.37, 9.17) 6.65 (5.34, 8.00) 1.71 0.171 Yes 7.22 (5.90, 7.95) 6.95 (5.93, 7.94) 8.01 (6.48, 9.36) 6.80 (5.54, 7.96)c 2.99 0.031 Z −0.057 −0.379 −0.902 0.714 P 0.954 0.704 0.367 0.476 Note: Values are presented as median (IQR). Bold entries indicate statistically significance values. aThe P-value comparing median mitochondrial DNA (mtDNA) copy number among four groups. bThe P-value comparing median mtDNA copy number among groups defined by selected characteristics. cCompared with hypertension group, the mtDNA copy number is significant different in hypertension combined with albuminuria (HCA) group. dThe P-value was used exactly probability method. Table S2. Median mtDNA copy number by selected risk factors among four groups [median (IQR)]
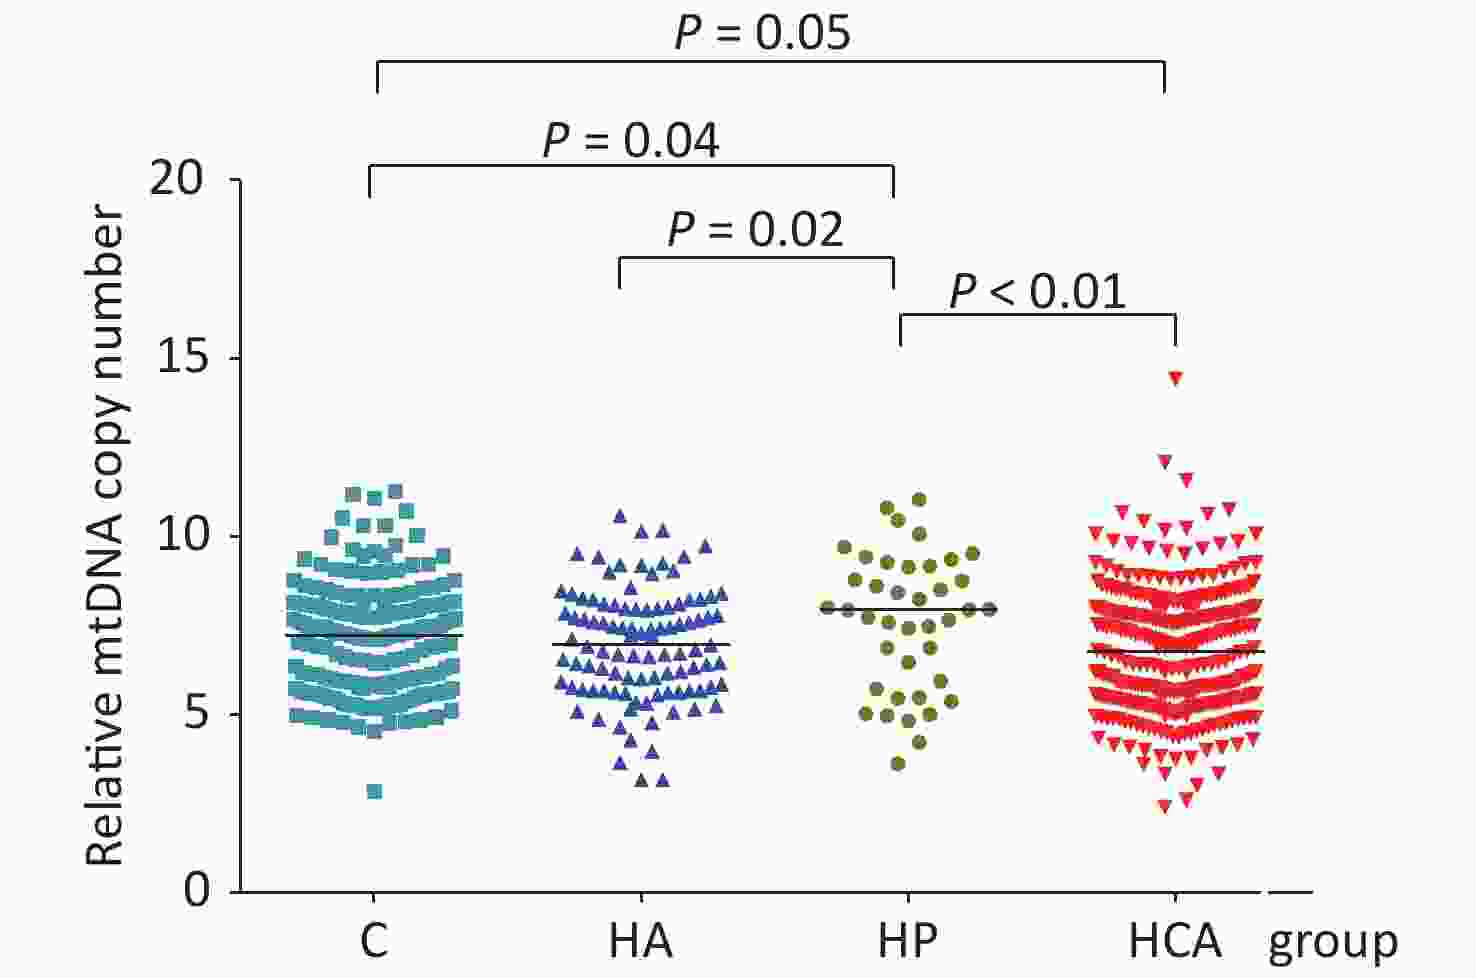
Figure 1. Relative mtDNA-CN of four study groups. Compared with control group (C), mtDNA-CN was higher in hypertension (HP) (P = 0.04) and lower in hypertension combined with hyperalbuminuria (HCA) groups (P = 0.05). mtDNA-CN in HP group was higher than that in hyperalbuminuria (HA) (P = 0.02) and HCA groups (P < 0.01).
Variables N Characteristics F/χ2 P Age 1st Quartile 190 45.21 ± 8.61 2.02 0.109 2nd Quartile 158 44.37 ± 8.60 3rd Quartile 142 44.75 ± 8.71 4th Quartile 168 43.05 ± 8.38 Sex (male/female) 1st Quartile 163/27 2.04 0.565 2nd Quartile 142/16 3rd Quartile 124/18 4th Quartile 151/17 Married status (married/unmarried) 1st Quartile 180/9 0.557 0.906 2nd Quartile 152/6 3rd Quartile 135/6 4th Quartile 158/9 Educationa 1st Quartile 21/118/45/5 11.659 0.233 2nd Quartile 10/91/48/9 3rd Quartile 11/89/34/7 4th Quartile 24/94/42/5 Family monthly incoming (0–/4,000–/6,000–/8,000– yuan) 1st Quartile 45/74/45/22 10.096 0.343 2nd Quartile 36/58/45/17 3rd Quartile 30/54/26/28 4th Quartile 37/59/45/20 Work placeb 1st Quartile 40/63/43/44 22.382 0.008 2nd Quartile 52/44/47/15 3rd Quartile 32/53/32/34 4th Quartile 44/61/30/30 Work shift (no/yes) 1st Quartile 105/84 6.783 0.079 2nd Quartile 69/89 3rd Quartile 77/64 4th Quartile 77/88 Alcohol drinking (no/yes) 1st Quartile 106/83 3.081 0.379 2nd Quartile 96/62 3rd Quartile 72/69 4th Quartile 89/76 Current Smoking (no/yes) 1st Quartile 83/106 5.211 0.157 2nd Quartile 56/102 3rd Quartile 47/94 4th Quartile 69/96 Note: a: Education showed is the number of participants of College or higher/Senior middle school/Junior middle school/Primary school and less than primary school of each quartile, respectively; b: Showed the number of people worked in different positions (Underground/Underground auxiliary/ground/Office workers). Table S3. The basic characteristics compared between the quartiles of mtDNA-CN
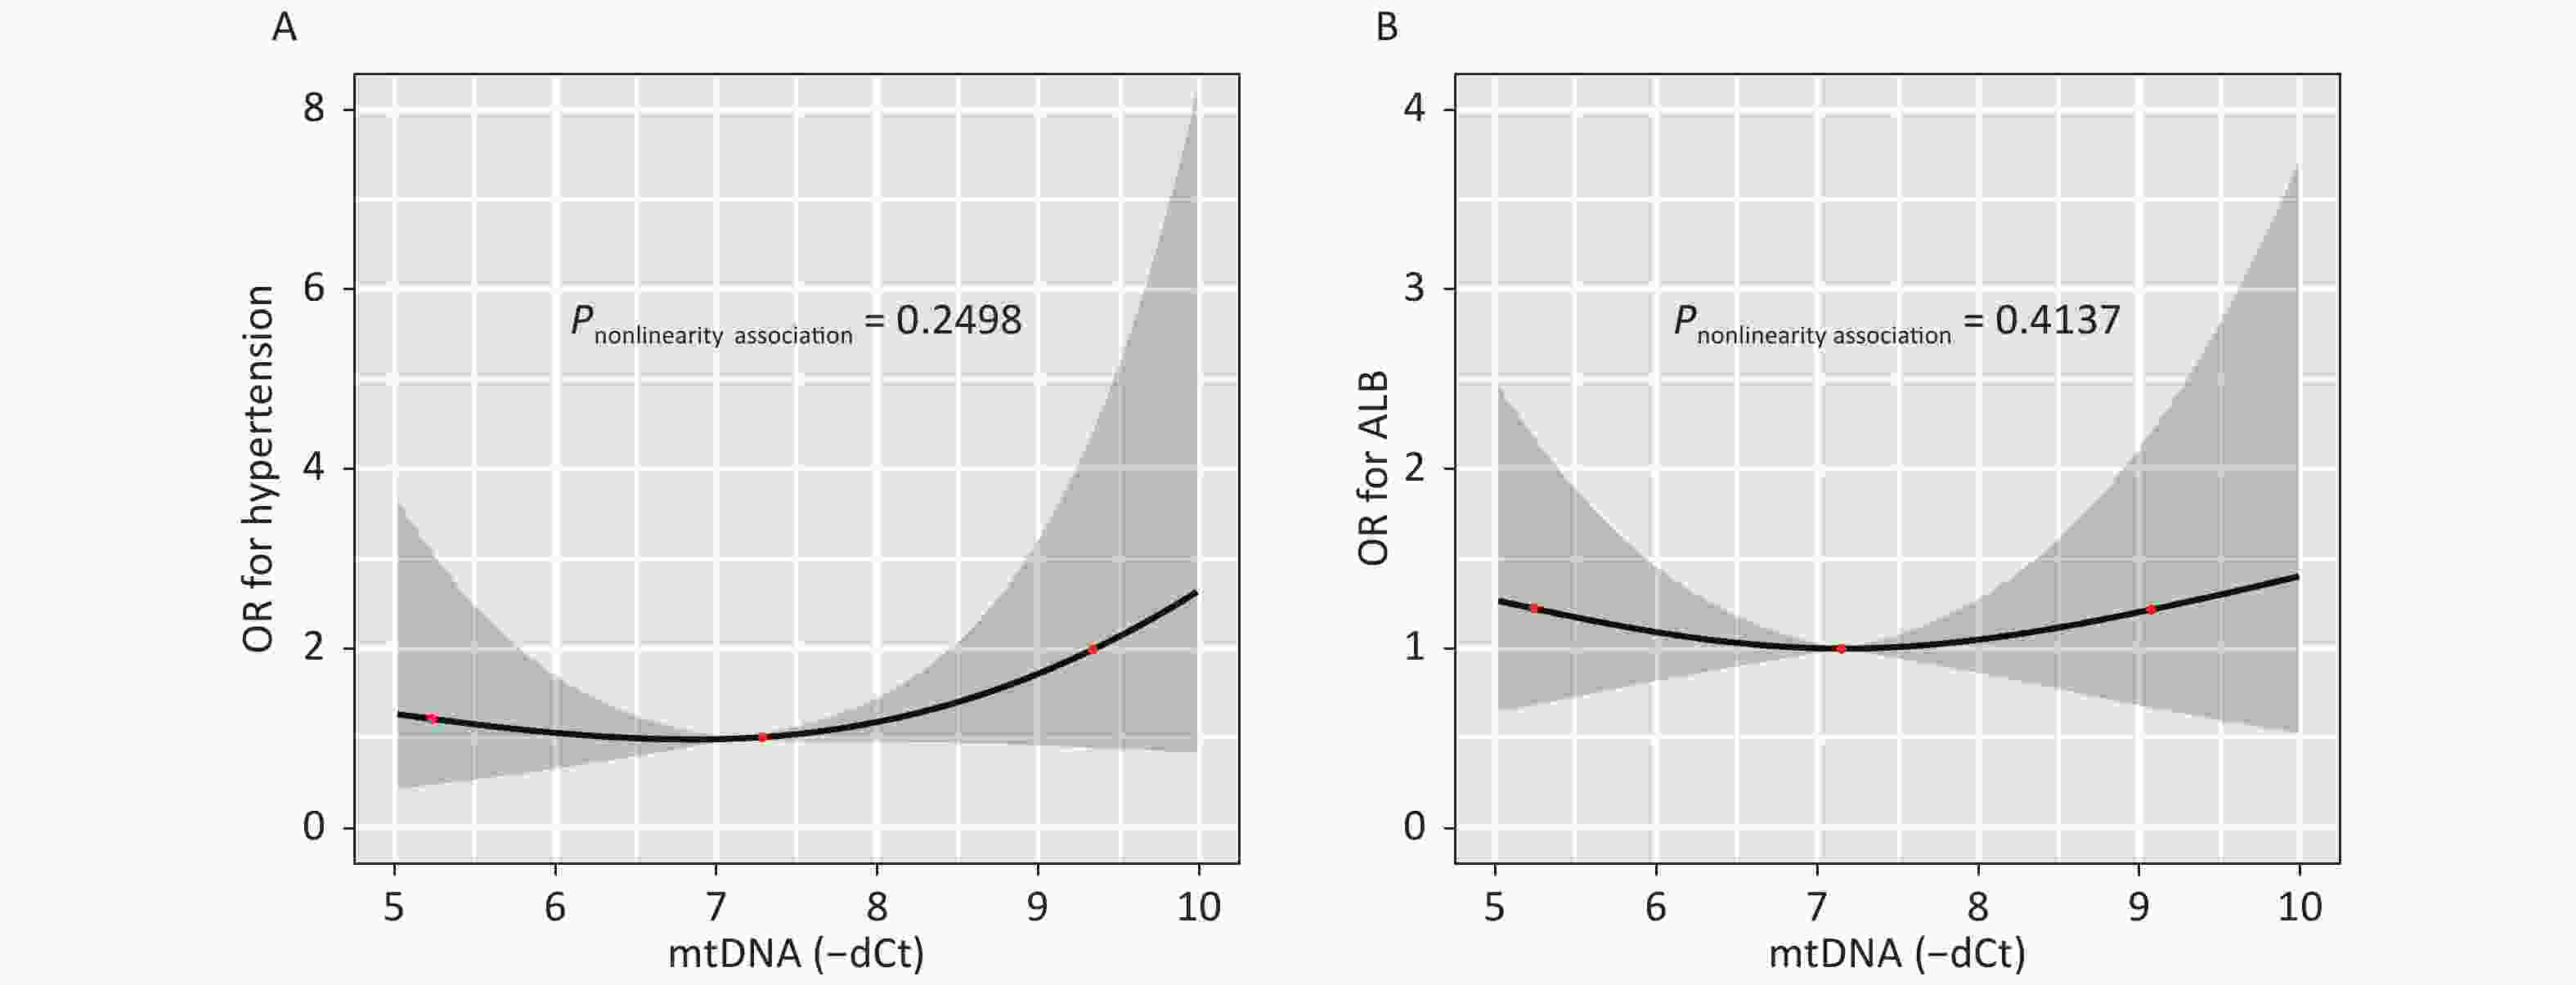
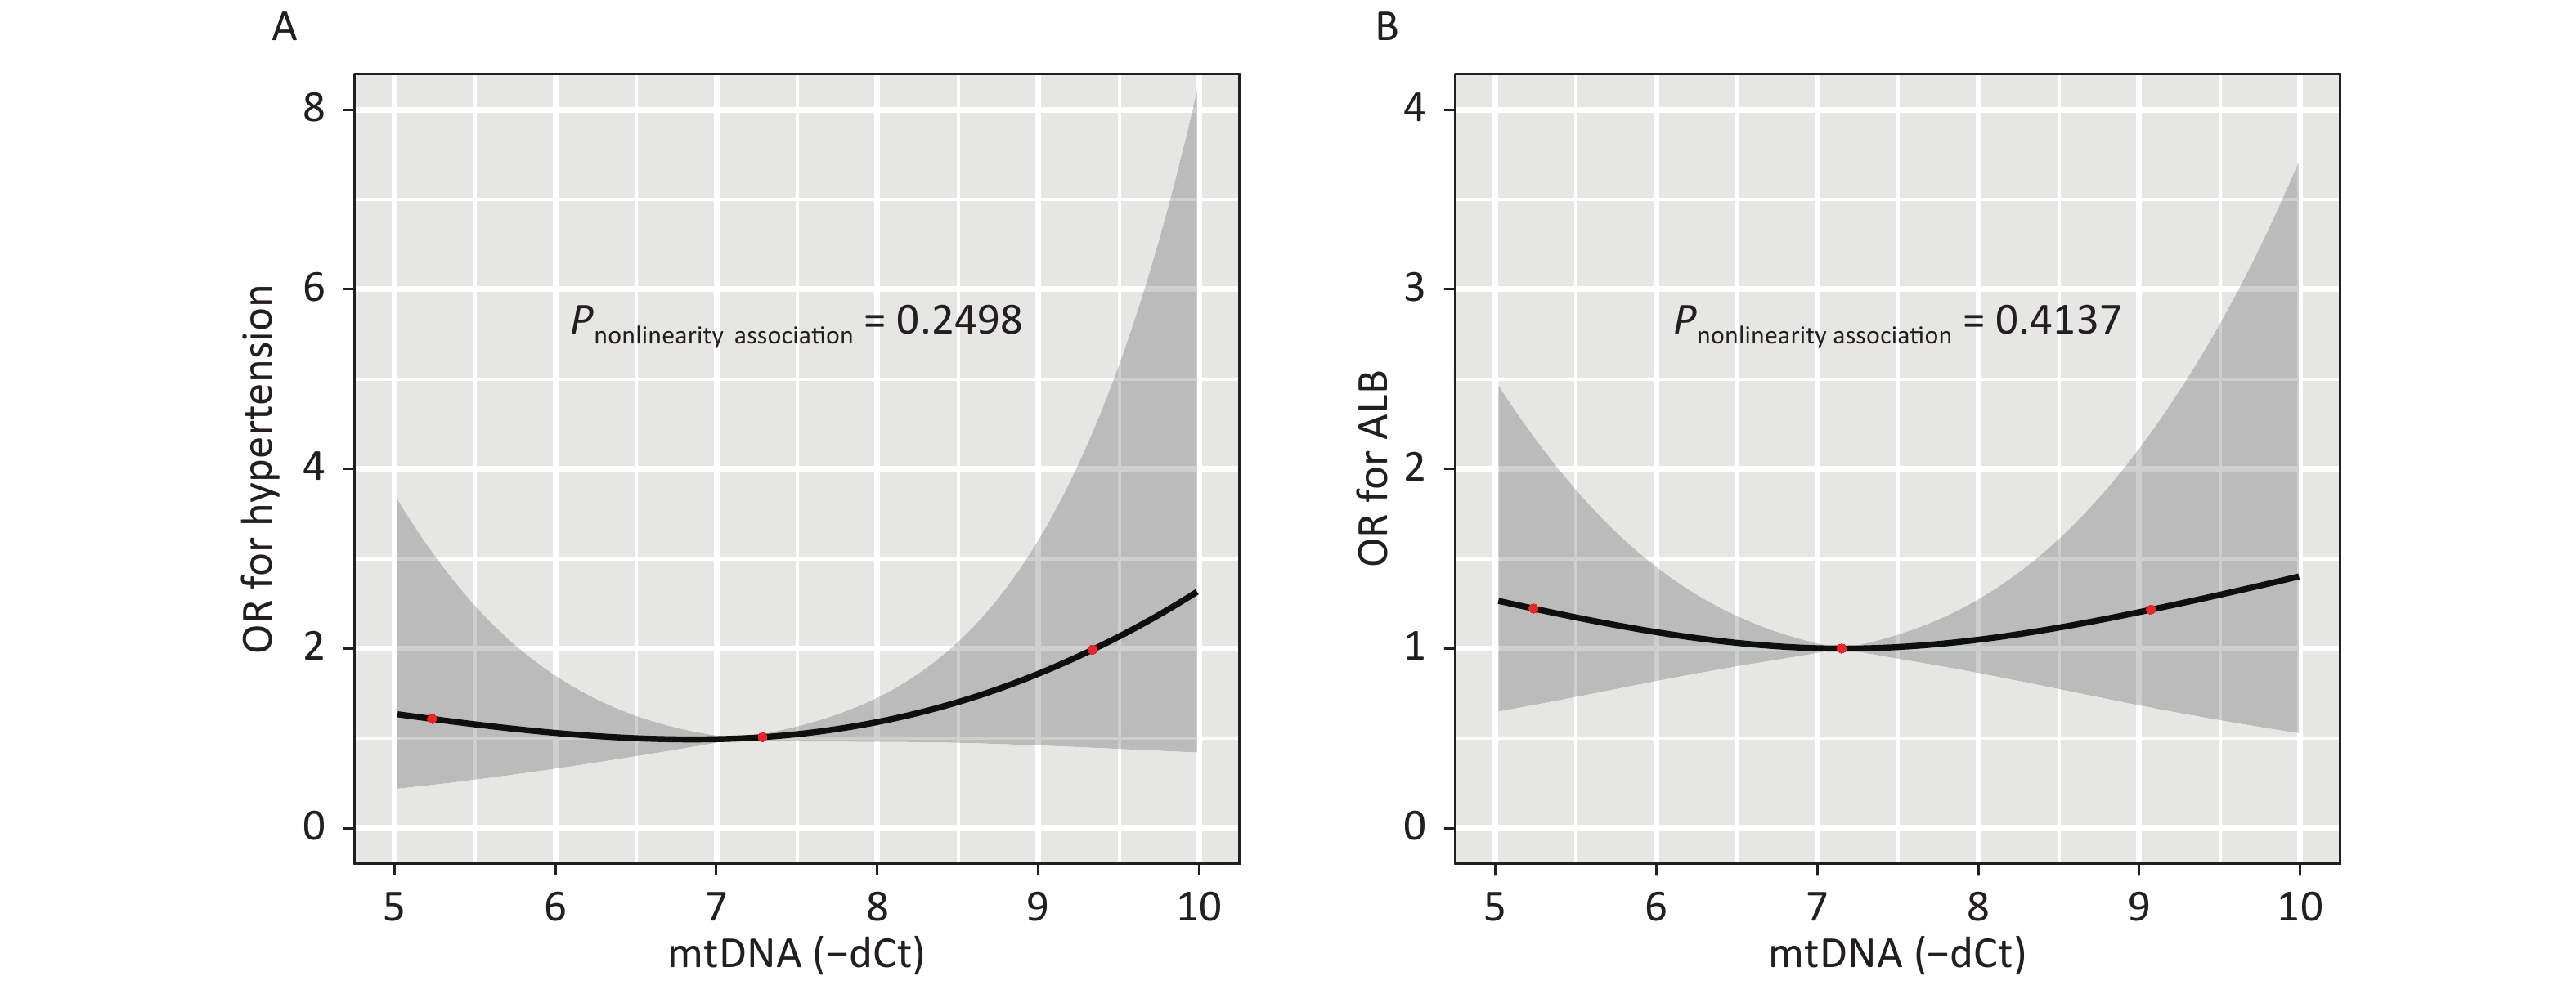
Figure S1. illustrates the dose-response relationship between the mtDNA-CN and the odds of having hypertension or hyperalbuminuria as modeled using RCS analysis. After adjusting for covariates, an association between the mtDNA-CN and the risk of hypertension (P-nonlinearity = 0.250) (A) or hyperalbuminuria (P-nonlinearity = 0.414) did not observe seen in (B).
Variables Total Control Albuminuria Hypertension HCA t/Z/${{{\chi }}^2}$ P Number (%) 658 (100.0) 194 101 32 331 Age (mean ± SD, year)a 44.36 ± 8.59 43.74 ± 8.35 47.23 ± 8.37 38.63 ± 9.22 44.43 ± 8.42 9.20 < 0.001 Age group 24.61 < 0.001 < 45 343 (52.1) 103 (53.1) 32 (31.7) 25 (78.1) 155 (46.8) ≥ 45 315 (47.9) 91 (46.9) 69 (68.3) 7 (21.9) 176 (53.2) Sex (male/female) Male 580 (88.1) 182 (93.8) 74 (73.3) 30 (93.8) 294 (88.8) 28.47 < 0.001 Female 78 (11.9) 12 (6.2) 27 (26.7) 2 (6.2) 37 (11.2) Married status 9.97 0.019 Married 627 (95.3) 187 (96.9) 97 (96.0) 27 (84.4) 316 (95.5) Unmarried 31 (4.7) 7 (3.1) 4 (4.0) 5 (15.6) 15 (4.5) Education 17.58 0.040 College or higher 66 (10.0) 24 (12.4) 8 (7.9) 6 (18.8) 28 (8.5) Senior middle school 394 (59.9) 109 (56.2) 52 (51.5) 15 (46.9) 218 (65.9) Junior middle school 169 (25.7) 52 (26.8) 37 (36.6) 10 (31.2) 70 (21.1) Primary school and less than 26 (4.0) 7 (3.6) 4 (4.0) 1 (3.1) 14 (4.2) Missing 3 (0.4) 2 − − 1 Family monthly incoming (yuan) 77.79 < 0.001 < 4,000 148 (22.5) 14 (7.3) 27 (26.7) 6 (18.8) 101 (31.3) 4,000– 246 (37.4) 61 (31.9) 35 (34.7) 16 (50.0) 134 (41.5) 6,000– 162 (24.6) 74 (38.7) 22 (21.8) 5 (15.6) 61 (18.9) 8,000– 91 (13.8) 42 (22.0) 17 (16.8) 5 (15.6) 27 (8.4) Missing 11 (1.7) 3 − − 8 Work place 30.94 < 0.001 Underground 170 (25.8) 64 (33.0) 29 (28.7) 11 (34.4) 66 (19.9) Underground auxiliary 223 (33.9) 72 (37.1) 25 (24.8) 16 (50.0) 110 (33.2) Ground 152 (23.1) 30 (15.5) 27 (26.7) 2 (6.2) 93 (28.1) Office workers 113 (17.2) 28 (14.4) 20 (19.8) 3 (9.4) 62 (18.7) Work shift 17.89 < 0.001 No 331 (50.3) 76 (39.2) 58 (57.4) 12 (37.5) 185 (55.9) Yes 327 (49.7) 118 (60.8) 43 (42.6) 20 (62.5) 146 (44.1) Alcohol drinking 13.41 0.004 No 364 (55.3) 115 (59.3) 68 (67.3) 19 (59.4) 162 (48.9) Yes 294 (44.7) 79 (40.7) 33 (32.7) 13 (40.6) 169 (51.1) Tobacco smoking 10.79 0.013 No 257 (39.1) 64 (33.0) 53 (52.5) 13 (40.6) 127 (38.4) Yes 401 (60.9) 130 (67.0) 48 (47.5) 19 (59.4) 204 (61.6) Tea drinking 1.17 0.760 No 406 (61.7) 123 (63.4) 59 (58.4) 18 (56.2) 206 (62.2) Yes 252 (38.3) 71 (36.6) 42 (41.6) 14 (43.8) 125 (37.8) BMI (kg/m2) 34.38 < 0.001 < 24.0 239 (36.7) 86 (44.3) 50 (49.5) 7 (21.9) 96 (29.6) 24.0–27.9 281 (43.2) 83 (42.8) 41 (40.6) 18 (56.3) 139 (42.9) 28.0– 131 (20.1) 25 (12.9) 10 (9.9) 7 (21.9) 89 (27.5) Missing 7 − − − 7 mtDNA copy numberb 7.01 (5.63, 8.07) 7.21 (5.77, 8.07) 6.95 (5.77, 8.01) 7.98 (5.83, 9.32) 6.76 (5.47, 7.98) 10.94 0.010 1st Quartile 165 (25.1) 48 (24.7) 24 (23.8) 15 (46.9) 78 (23.6) 2nd Quartile 145 (22.0) 49 (25.3) 24 (23.8) 6 (18.8) 66 (19.9) 15.31 0.083 3rd Quartile 152 (22.7) 47 (24.2) 27 (26.7) 3 (9.4) 75 (49.3) 4th Quartile 196 (33.8) 50 (29.5) 26 (25.7) 8 (25.0) 112 (33.8) Note: a: Values are presented as mean ± SD; b: number (%) or median (IQR). Bold entries indicate statistically significance values. Table S1. Baseline demographic characteristics of participants [N(%)]
Table 1 presents the relationships between mtDNA-CN and the odds of three kinds of diseases determined through unconditional logistic regression analysis. The encode of variables were shown in Supplementary Table S4, available in www.besjournal.com. After adjusting for various covariates, including demographics, lifestyle, workplace, and work shift, a negative correlation between mtDNA-CN and the odds of having HCA (multivariable-adjusted OR = 0.87, 95% CI: 0.79, 0.97) was observed. Furthermore, we have found higher monthly family incoming (OR = 0.41, 95% CI: 0.32, 0.52) and work shift (OR = 0.48, 95% CI: 0.30, 0.74) were both inversely related with HCA, whereas BMI (OR = 1.18, 95% CI: 1.10, 1.26) and alcohol consumption (OR = 2.11, 95% CI: 1.36, 3.28) were positively associated with HCA.
Item Hypertension P Albuminuria P HCA P Age 0.91 (0.86, 0.97) 0.001 1.05 (1.01, 1.09) 0.014 1.00 (0.97, 1.03) 0.977 Sex 1.75 (0.23, 13.21) 0.590 3.82 (1.36, 10.73) 0.011 1.92 (0.78, 1.03) 0.155 Education 1.46 (0.70, 3.04) 0.315 1.02 (0.65, 1.58) 0.943 0.93 (0.66, 1.33) 0.706 Family monthly incoming 0.44 (0.27, 0.73) 0.001 0.66 (0.48, 0.89) 0.008 0.41 (0.32, 0.52) < 0.001 BMI 1.10 (0.96, 1.25) 0.158 0.98 (0.89, 1.07) 0.601 1.18 (1.10, 1.26) < 0.001 Tobacco smoking 0.74 (0.28, 1.93) 0.532 0.80 (0.42, 1.50) 0.479 0.98 (0.60, 1.59) 0.931 Alcohol drinking 1.07 (0.44, 2.61) 0.885 1.02 (0.57, 1.83) 0.950 2.11 (1.36, 3.28) < 0.001 Workplace 0.64 (0.36, 1.13) 0.125 0.86 (0.62, 1.19) 0.371 0.96 (0.75, 1.23) 0.734 Workshift 0.90 (0.35, 2.31) 0.829 0.69 (0.38, 1.25) 0.216 0.48 (0.30, 0.74) 0.001 mtDNA copy number Model 1 1.22 (1.03, 1.47) 0.062 0.95 (0.83, 1.08) 0.498 0.90 (0.82,0.98) 0.052 Model 2 1.18 (0.97, 1.44) 0.164 0.99 (0.85, 1.15) 0.936 0.87 (0.79, 0.97) 0.027 Model 3 1.22 (1.02, 1.47) 0.067 0.97 (0.85, 1.11) 0.742 0.90 (0.83, 0.99) 0.066 Model 4 1.16 (0.95, 1.42) 0.214 1.00 (0.85, 1.16) 0.957 0.87 (0.78, 0.96) 0.024 Note. Model 1: unadjusted. Model 2: adjusted by age, sex, education, family monthly incoming, smoking, alcohol, BMI. Model 3: adjusted by workplace, workshift. Model 4: adjusted by age, sex, education, family monthly incoming, workplace, workshift, smoking, alcohol, BMI. HCA, hypertension combined with albuminuria. Table 1. Logistic regression of the characteristics and disease risk [OR (95% CI)]
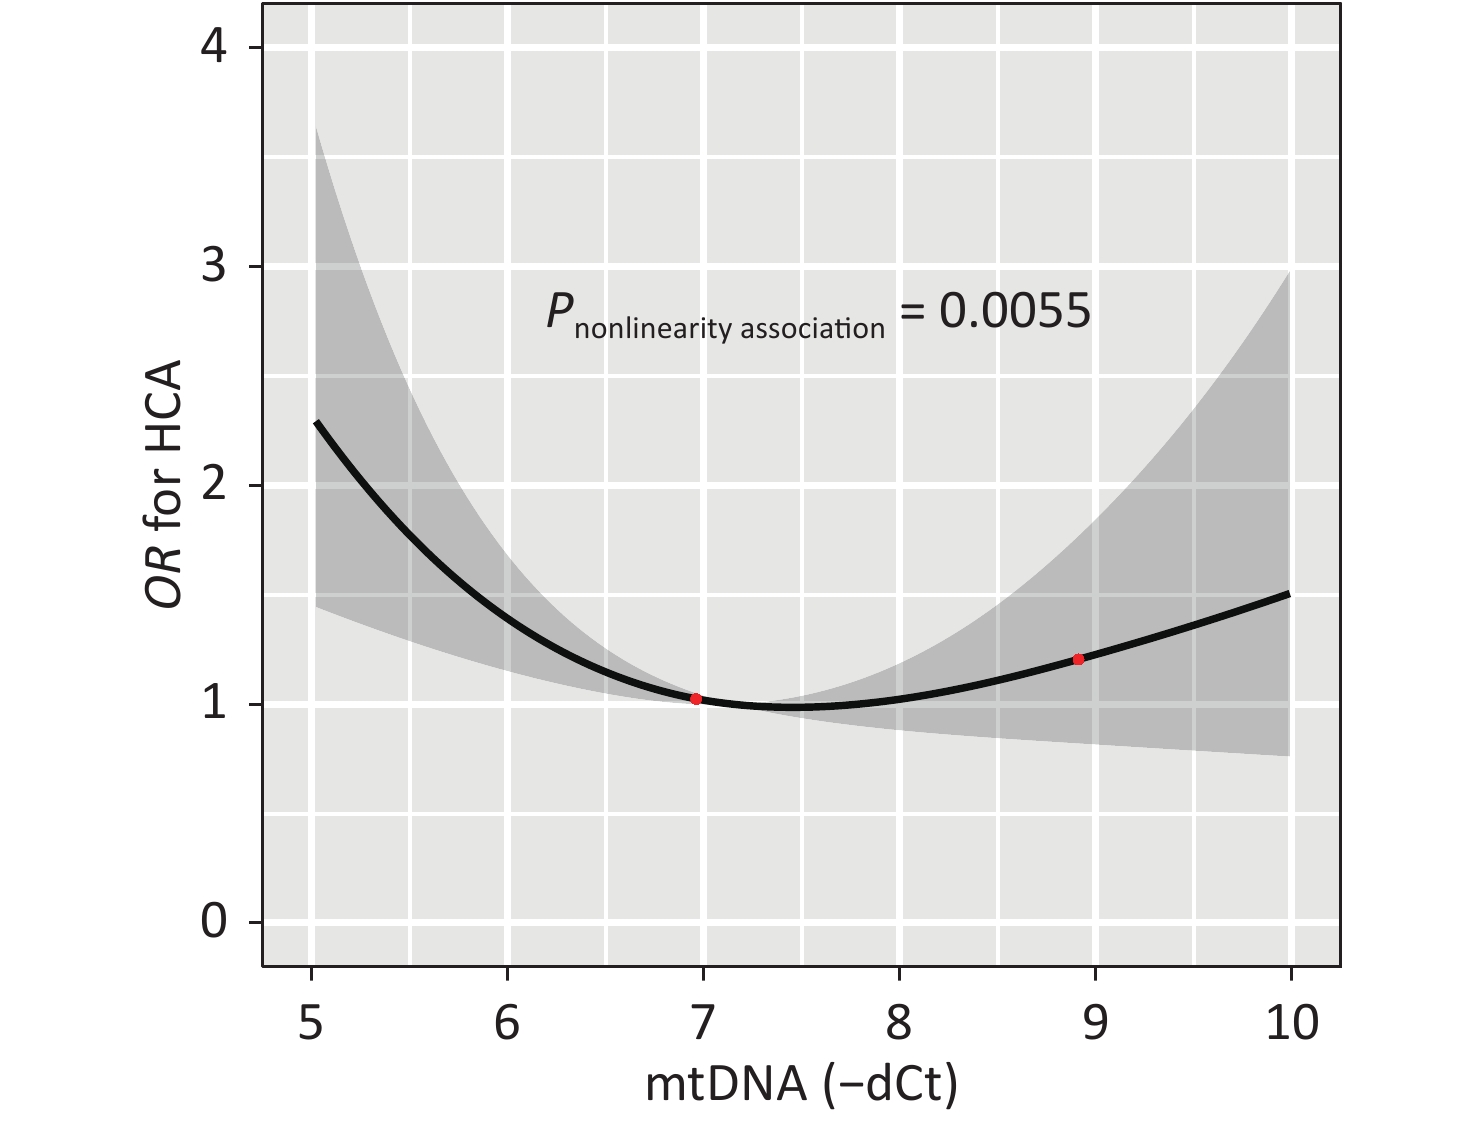
Figure 2 illustrates the dose-response relationship between the mtDNA-CN and the odds of having HCA as modeled using RCS analysis. After adjusting for covariates, the non-linear association between mtDNA-CN and HCA with three knots at 5.63, 6.96, and 8.08 (25th, 50th, and 75th percentiles) are exhibited in Figure 2 (P-nonlinearity = 0.006). Subjects with high or low mtDNA-CN had increased odds of HCA, indicating that increased mtDNA-CN results in decreased odds of disease until a threshold value of mtDNA-CN (6.96) where the odds of having HCA begin to increase gradually. And the nonlinearity relationship did not observe between mtDNA-CN and hypertension or hyperalbuminuria (Supplementary Figure S1, available in www.besjournal.com).
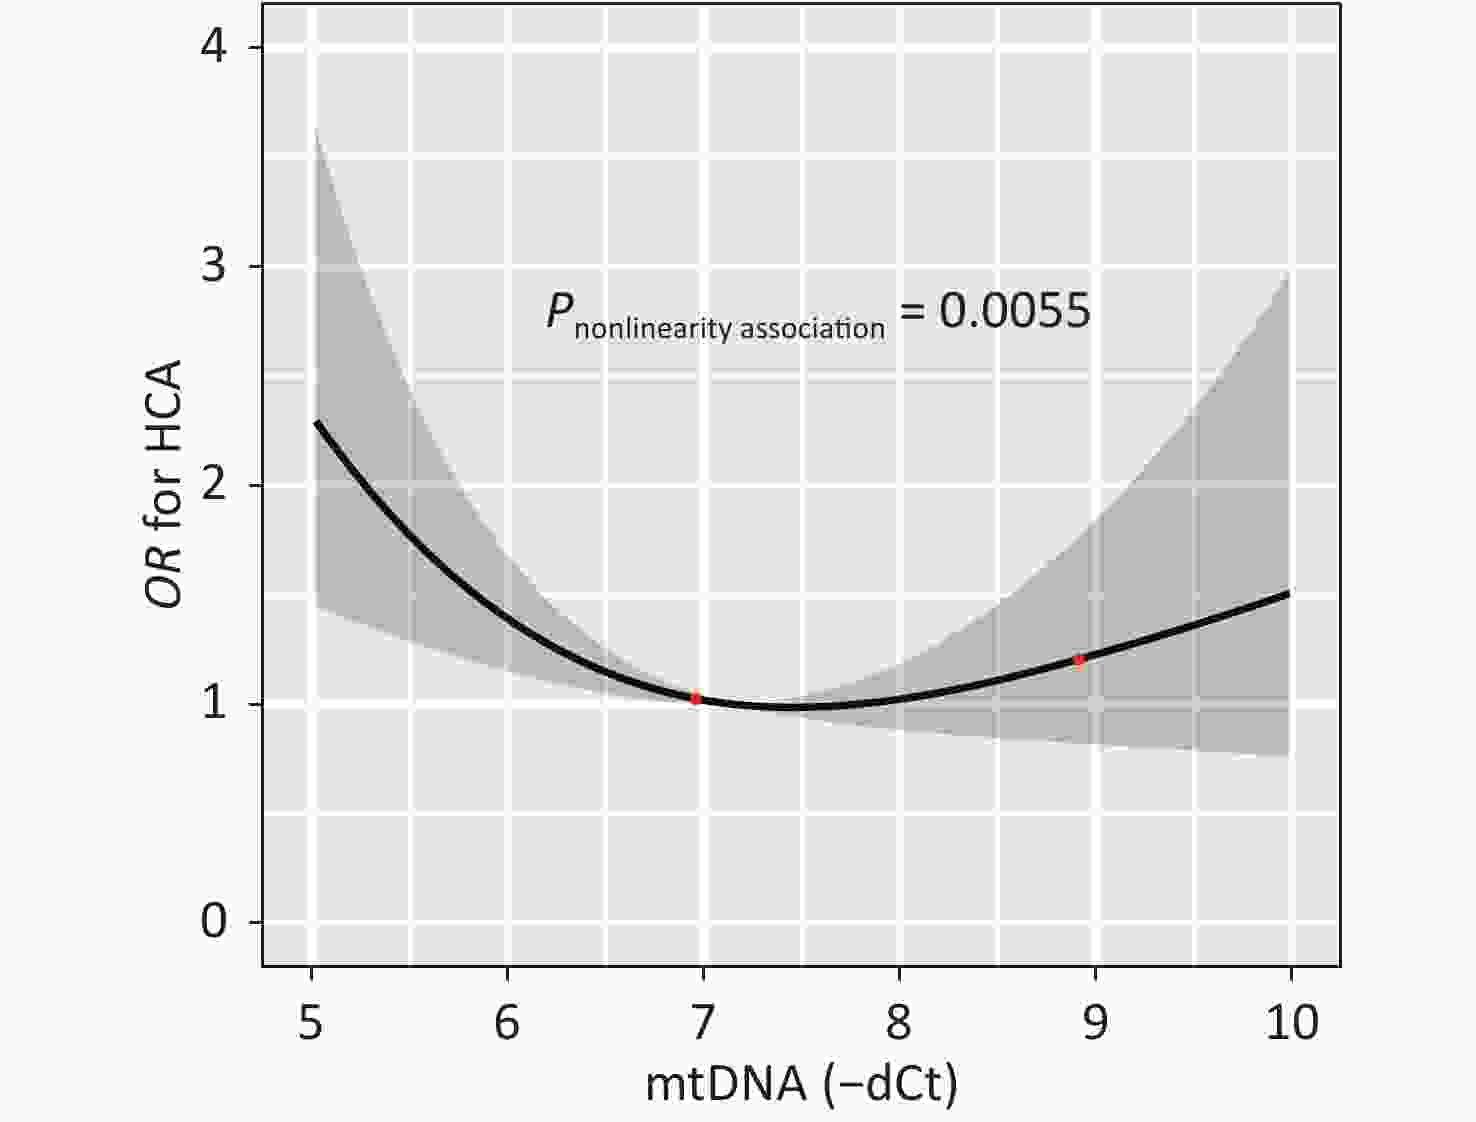
Figure 2. The dose-response relation between the mtDNA-CN and the risk of HCA. The result from the restricted cubic spline analysis with three knots (25th, 50th, and 75th percentiles) at 5.63, 6.96, and 8.08 for mtDNA-CN tested the non-linear association between the mtDNA-CN and HCA was showed (P-nonlinearity = 0.0055). HCA, hypertension combined with albuminuria
There are two major findings of the current study: 1) By using a cross-sectional study, we found the significantly association between mtDNA-CN and the increased HCA risk, but not with hypertension and hyperalbuminuria. 2) A non-linear relationship was also found between mtDNA-CN and HCA. The alteration of mtDNA-CN may reflect the reduced compensatory ability of mtDNA. Mitochondrial oxidative metabolism is an important determinant of intra-renal oxygenation. Importantly, hypertension-induced kidney injury is characterized by the activation of several deleterious pathways, including renin - angiotensin - aldosterone system, oxidative stress, and renal remodeling, all of which may damage mitochondrial integrity and function[2]. Our study selected the ACR as a marker for renal injury. Albumin has a high molecular weight and is easy to quantify in the urine, and may serve as an early sign of kidney damage. The present results indicated that mtDNA-CN is linked to glomerular injury combined with hypertension. Studies concerning the association between mtDNA-CN and HCA are limited. It has been speculated that low mtDNA-CN may be an early manifestation of the pathological changes that lead to HCA. The decreased mtDNA-CN can affect the calcium signal regulation of cells, thus leading to the disruption of cytoplasmic calcium homeostasis, and further exacerbating pathological cellular damage. More and more evidence shows that ROS induced by mitochondrial dysfunction will increase the accumulation of mitochondrial Ca2+[1], which may be a potential mechanism of hyperalbuminuria and hypertension. In our present study, we didn’t find significant alternation in mtDNA-CN between healthy controls and those with hypertension and hyperalbuminuria. One explanation for our results lies in the ‘threshold hypothesis of mtDNA-CN’, which means that the results were regulated by mtDNA-CN thresholds[8]. Hypertension and albuminuria are relatively less severe than HCA. We postulate that hypertension or albuminuria experienced by our study participants might not be serious enough to break the mtDNA-CN threshold that triggers the changes in mtDNA. The underlying mechanism of the mtDNA-CN in the pathogenesis of HCA has not yet been elucidated. In studying the role of mtDNA in the pathogenesis of HCA, hypertension and hyperalbuminuria, the curvilinear relationship between mtDNA-CN and HCA should be considered. And a U-shaped association between mtDNA-CN and the risk of HCA was found. The low number of mtDNA-CN may also reflect the reduced capacity of compensatory response of mtDNA to the damage caused by oxidative stress and environmental exposures. High relative mtDNA-CN is thought to be the result of compensatory response to the cumulative exposures to oxidative stress and cumulative accumulation of mtDNA mutations over time. This study has several strengths to consider. First, the sample size of this study is large enough to ensured sufficient power to detect statistical significance, especially between the HCA and control groups compared to others previous study[1]. Second, we have also carefully measured and analyzed comprehensive information about potential confounders, thus minimizing the possibility of residual confounding. The third advantage is that we reported the dose-response relationship of mtDNA-CN with risk HCA. And allowed the continuous exposure to be modeled with the continuous outcome.
The present study entails a few limitations. The main limitation is its retrospective cross-sectional design. While the association between mtDNA-CN and HCA is noted, prevent us from determining whether mtDNA-CN alteration causes HCA or results from it. An ongoing prospective follow-up study will be further evaluated the association between mtDNA-CN and the risk of three diseases. Second, we had a relatively small number of hyperalbuminuria cases and even fewer cases of hypertension. Further studies should expand the sample size of hypertension and hyperalbuminuria to verify the conclusions of our study. Third, our research subjects were coal miners, not a random sample selected from the general population, which may affect the extrapolation of our findings to the general population. Fourth, due to the shortage of funds and limited biological samples, this study did not conduct urine mtDNA-CN level testing to analyze its relationship with the three diseases. It is possible that the urine mtDNA-CN has a different relationship with the three diseases, and we will further improve it in future research.
In summary, there is a dose-response relationship between mtDNA-CN and HCA. Whether changes in mtDNA-CN correlate with glomerular mitochondrial ultrastructural alterations in individuals with HCA need to be addressed in future studies. Therefore, further animal studies or interventional trials are needed to reveal the association between mtDNA-CN and HCA in more detail.
Variables Variables assignments HCA 1 = Yes, 2 = No Hypertension 1 = Yes, 2 = No Hyperalbuminuria 1 = Yes, 2 = No Age Continuous values Sex 1 = male, 2 = female Education College or higher = 1, Senior middle school = 2, Junior middle school = 3, Primary school and less than primary school = 4 Family monthly incoming 0– yuan = 1; 4,000– yuan = 2; 6,000– yuan = 3; 8,000– yuan = 4 BMI Continuous value Tobacco smoking 0 = no, 1 = yes Alcohol drinking 0 = no, 1 = yes Workplace Underground = 1, Underground auxiliary = 2, ground = 3, Office workers = 4 Workshift 0 = no, 1 = yes mtDNA-CN < 5.63 = 1, 5.64−6.96 = 2, 6.97−8.08 = 3, ≥ 8.09 = 4 Table S4. Variable assignment for logistic regression analysis
Disclosure Statement The authors declare that there is no conflict of interest.
Acknowledgements We thank all interviewers for their assistance with data collection. We also thank all the coal miners who participated in our study. We thank to Daniel Culpepper from the State University of New York (SUNY) for reviewing this manuscript.
Author Contributions ZHANG Wen Ping and LEI Li Jian conceived the idea, designed, and led the study, contributed to interpretation of results, finalized, and submitted the manuscript. ZHANG Yi Fan, HAN Zhi Chao, ZHANG Ying Ying, GAO Yuan Yuan, GUO Jian Yong, SHI Xiu Jing, and HU Xiao Qin performed the DNA extraction and qPCR experiments. ZHANG Wen Ping, HAN Zhi Chao, and ZHOU Yun performed data analyses. LEI Li Jian, ZHANG Wen Ping, ZHANG Yi Fan, and HAN Zhi Chao drafted the manuscript. ZHANG Ying Ying, ZHANG Yi Fan collected the biological samples and subjects information, and revised the manuscript. ZHOU Yun contributed to study design, the sample collection and quality control. MU Li Na reviewed and edited the manuscript. All authors read and approved the final manuscript.
HTML
Reference

 Quick Links
 DownLoad: