


-
Cancer is a serious threat to public health and the economy worldwide. Statistical data from the World Health Organization (WHO) in 2018 have demonstrated that lung cancer is the most commonly diagnosed cancer (11.6% of the total cases) and the leading cause of cancer death (18.4% of the total cancer deaths), closely followed by gastric cancer (5.7% and 8.2%), and liver cancer (4.7% and 8.2%)[1]. The situation is similar for these three types of cancer in the Hubei province of China[2]. Interleukin-22 (IL22), a member of the IL-10 family, is regarded as a link between inflammation and cancer. Recent studies have shown that IL22 acts as a tumor promoter and may promote carcinogenesis rather than function in antitumor immunity[3]. Interestingly, evidence of IL22 involvement in carcinogenesis manifests as dysregulation of IL22 expression in patients with many common cancers, including those of the stomach, liver, lung, stoma gut, and skin[4]. Therefore, it is hypothesized that individuals carrying certain genetic variants in the IL22 gene are vulnerable to the challenge of dysimmunity and are more susceptible to cancer. To test this hypothesis, we adopted a two-stage case-control approach to explore the potential contribution of IL22 gene promoter polymorphisms to cancer susceptibility in a Chinese Han population of Hubei province, and further elucidated the specific mechanism underlying the contribution of associated polymorphisms to cancer susceptibility.
A total of 1,490 cancer patients (liver/lung/gastric cancer: 480/550/460) and 800 healthy controls were enrolled in this study. All cancer patients were confirmed histopathologically and recruited from Hubei Cancer Hospital and Wuhan Xinzhou District People’s Hospital. Normal controls were selected from cancer-free individuals who visited Wuhan Xinzhou District People’s Hospital for regular physical examinations. All participants were biologically unrelated Han Chinese living in the Hubei province of China, and signed informed consent was obtained from all participants. Ethics approval for this study was granted by the ethics committee of Wuhan University of Technology.
To focus on single nucleotide polymorphisms (SNPs) in the IL22 gene promoter region, we first retrieved the SNP list within 2,000 bp upstream of the IL22 gene in the NCBI dbSNP website (
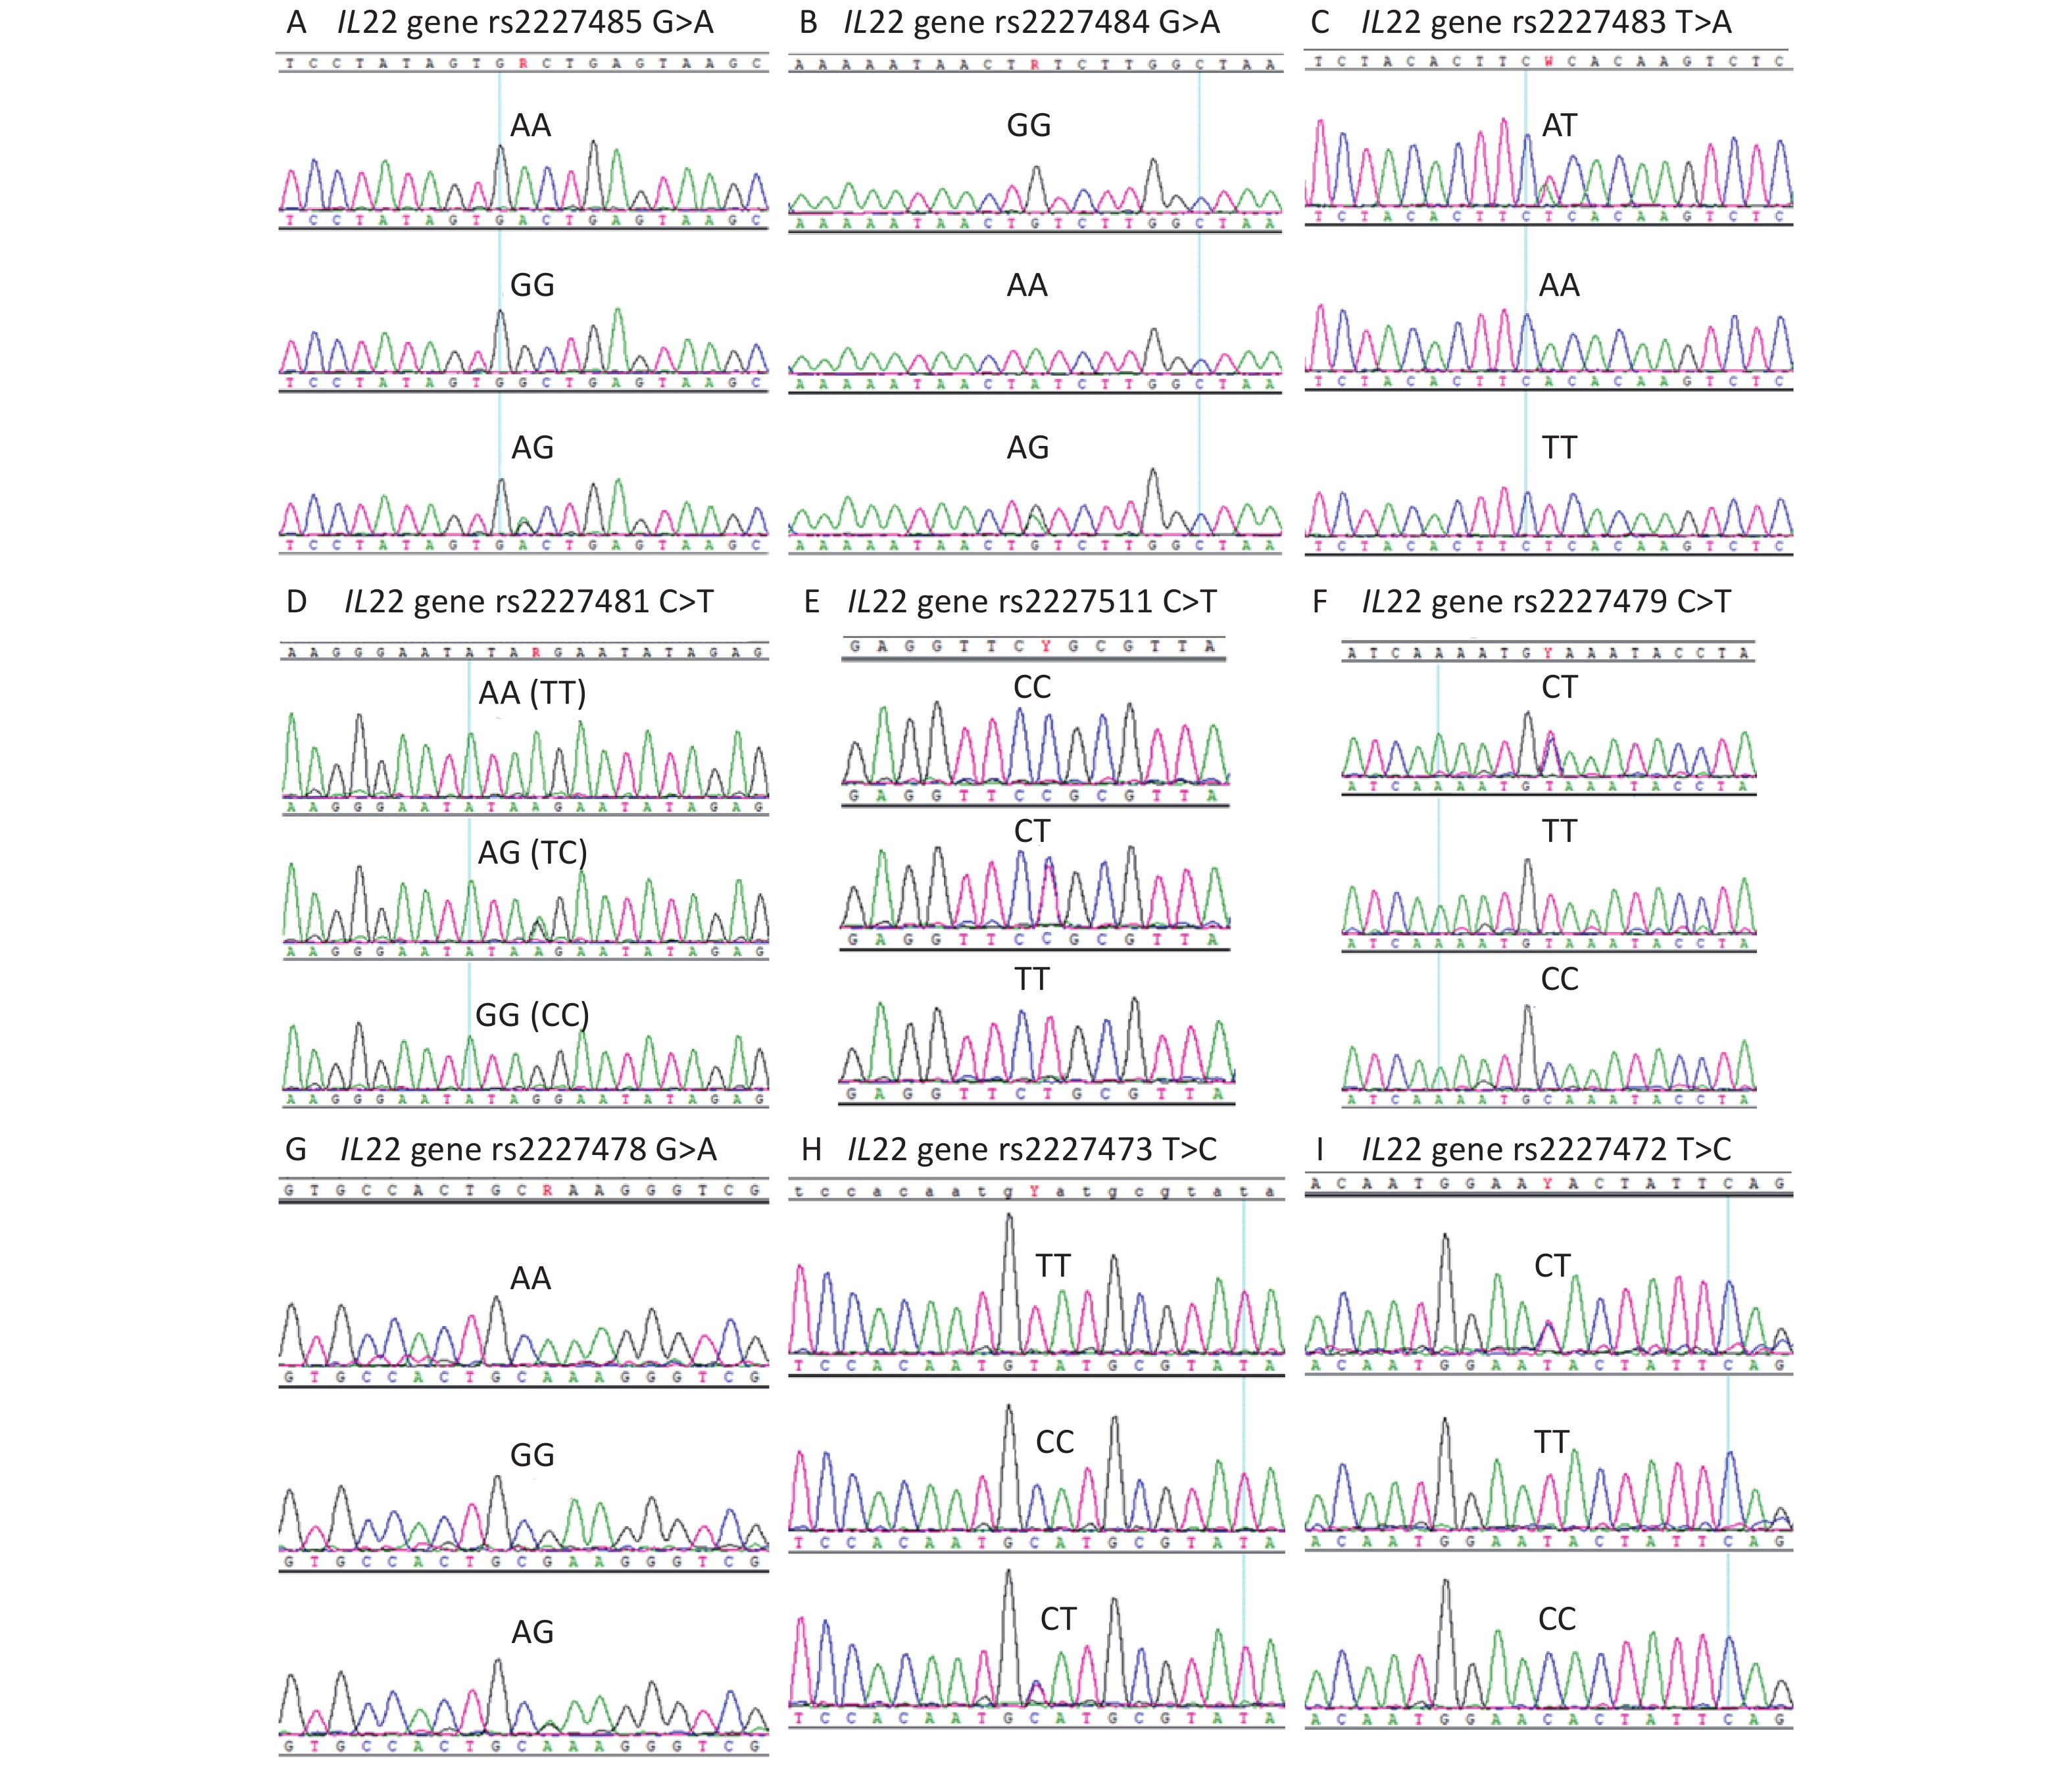
https://www.ncbi.nlm.nih.gov/snp ). The potentially functional SNPs were screened out from the list using SNPinfo software (https://snpinfo.niehs.nih.gov/ ). Then, the SNPs in the second step, which were further confirmed using Alibaba2 software (http://gene-regulation.com/pub/programs/alibaba2/index.html? ), were selected for genotyping in our experimental cohort using Sanger sequencing (Supplementary Table S1, available in www.besjournal.com). The sequencing diagrams of the selected SNPs are shown in Supplementary Figure S1 (available in www.besjournal.com).No. SNP ID Chromosome Position Allele Region Distance to
TSS (bp)Genotyping assay (Sanger sequencing) 1 rs2227487 12 66933859 C/A promoter 311 Amplification primer:
5’-AGATTCTGCTTGTGACGG-3’ (Forward)
5’-ATAGTTGTTGTAGGATTATTTGG-3’ (Reverse)
Sequencing primer: 5’-AGATTCTGCTTGTGACGG-3’2 rs2227486 12 66933971 G/A promoter 423 3 rs2227485 12 66933980 A/G promoter 432 4 rs2227484 12 66934196 G/A promoter 648 5 rs2227483 12 66934443 A/T promoter 895 Amplification primer:
5’-GGCAACCACCATTCTACTCTT-3’ (Forward)
5’-CACGGACTCACTTTCCTACCA-3’ (Reverse)
Sequencing primer: 5’-TAAGTTTGTCAATACTAATGC-3’6 rs2227482 12 66934487 T/G promoter 939 7 rs2227481 12 66934608 C/T promoter 1,060 8 rs2227511 12 66934623 C/T promoter 1,075 9 rs2227479 12 66934713 C/T promoter 1,165 10 rs2227478 12 66934889 A/G promoter 1,341 11 rs2227474 12 66935253 T/C promoter 1705 Amplification primer:
5’-TGTAACAGAACACCGAAAT-3’ (Forward)
5’-TACCCAAAGGATACAACAT-3’ (Reverse)
Sequencing primer: 5’-TACCCAAAGGATACAACAT-3’12 rs2227473 12 66935305 C/T promoter 1757 13 rs2227472 12 66935400 T/C promoter 1852 Table S1. Detailed information of the IL22 gene polymorphisms included in the present study
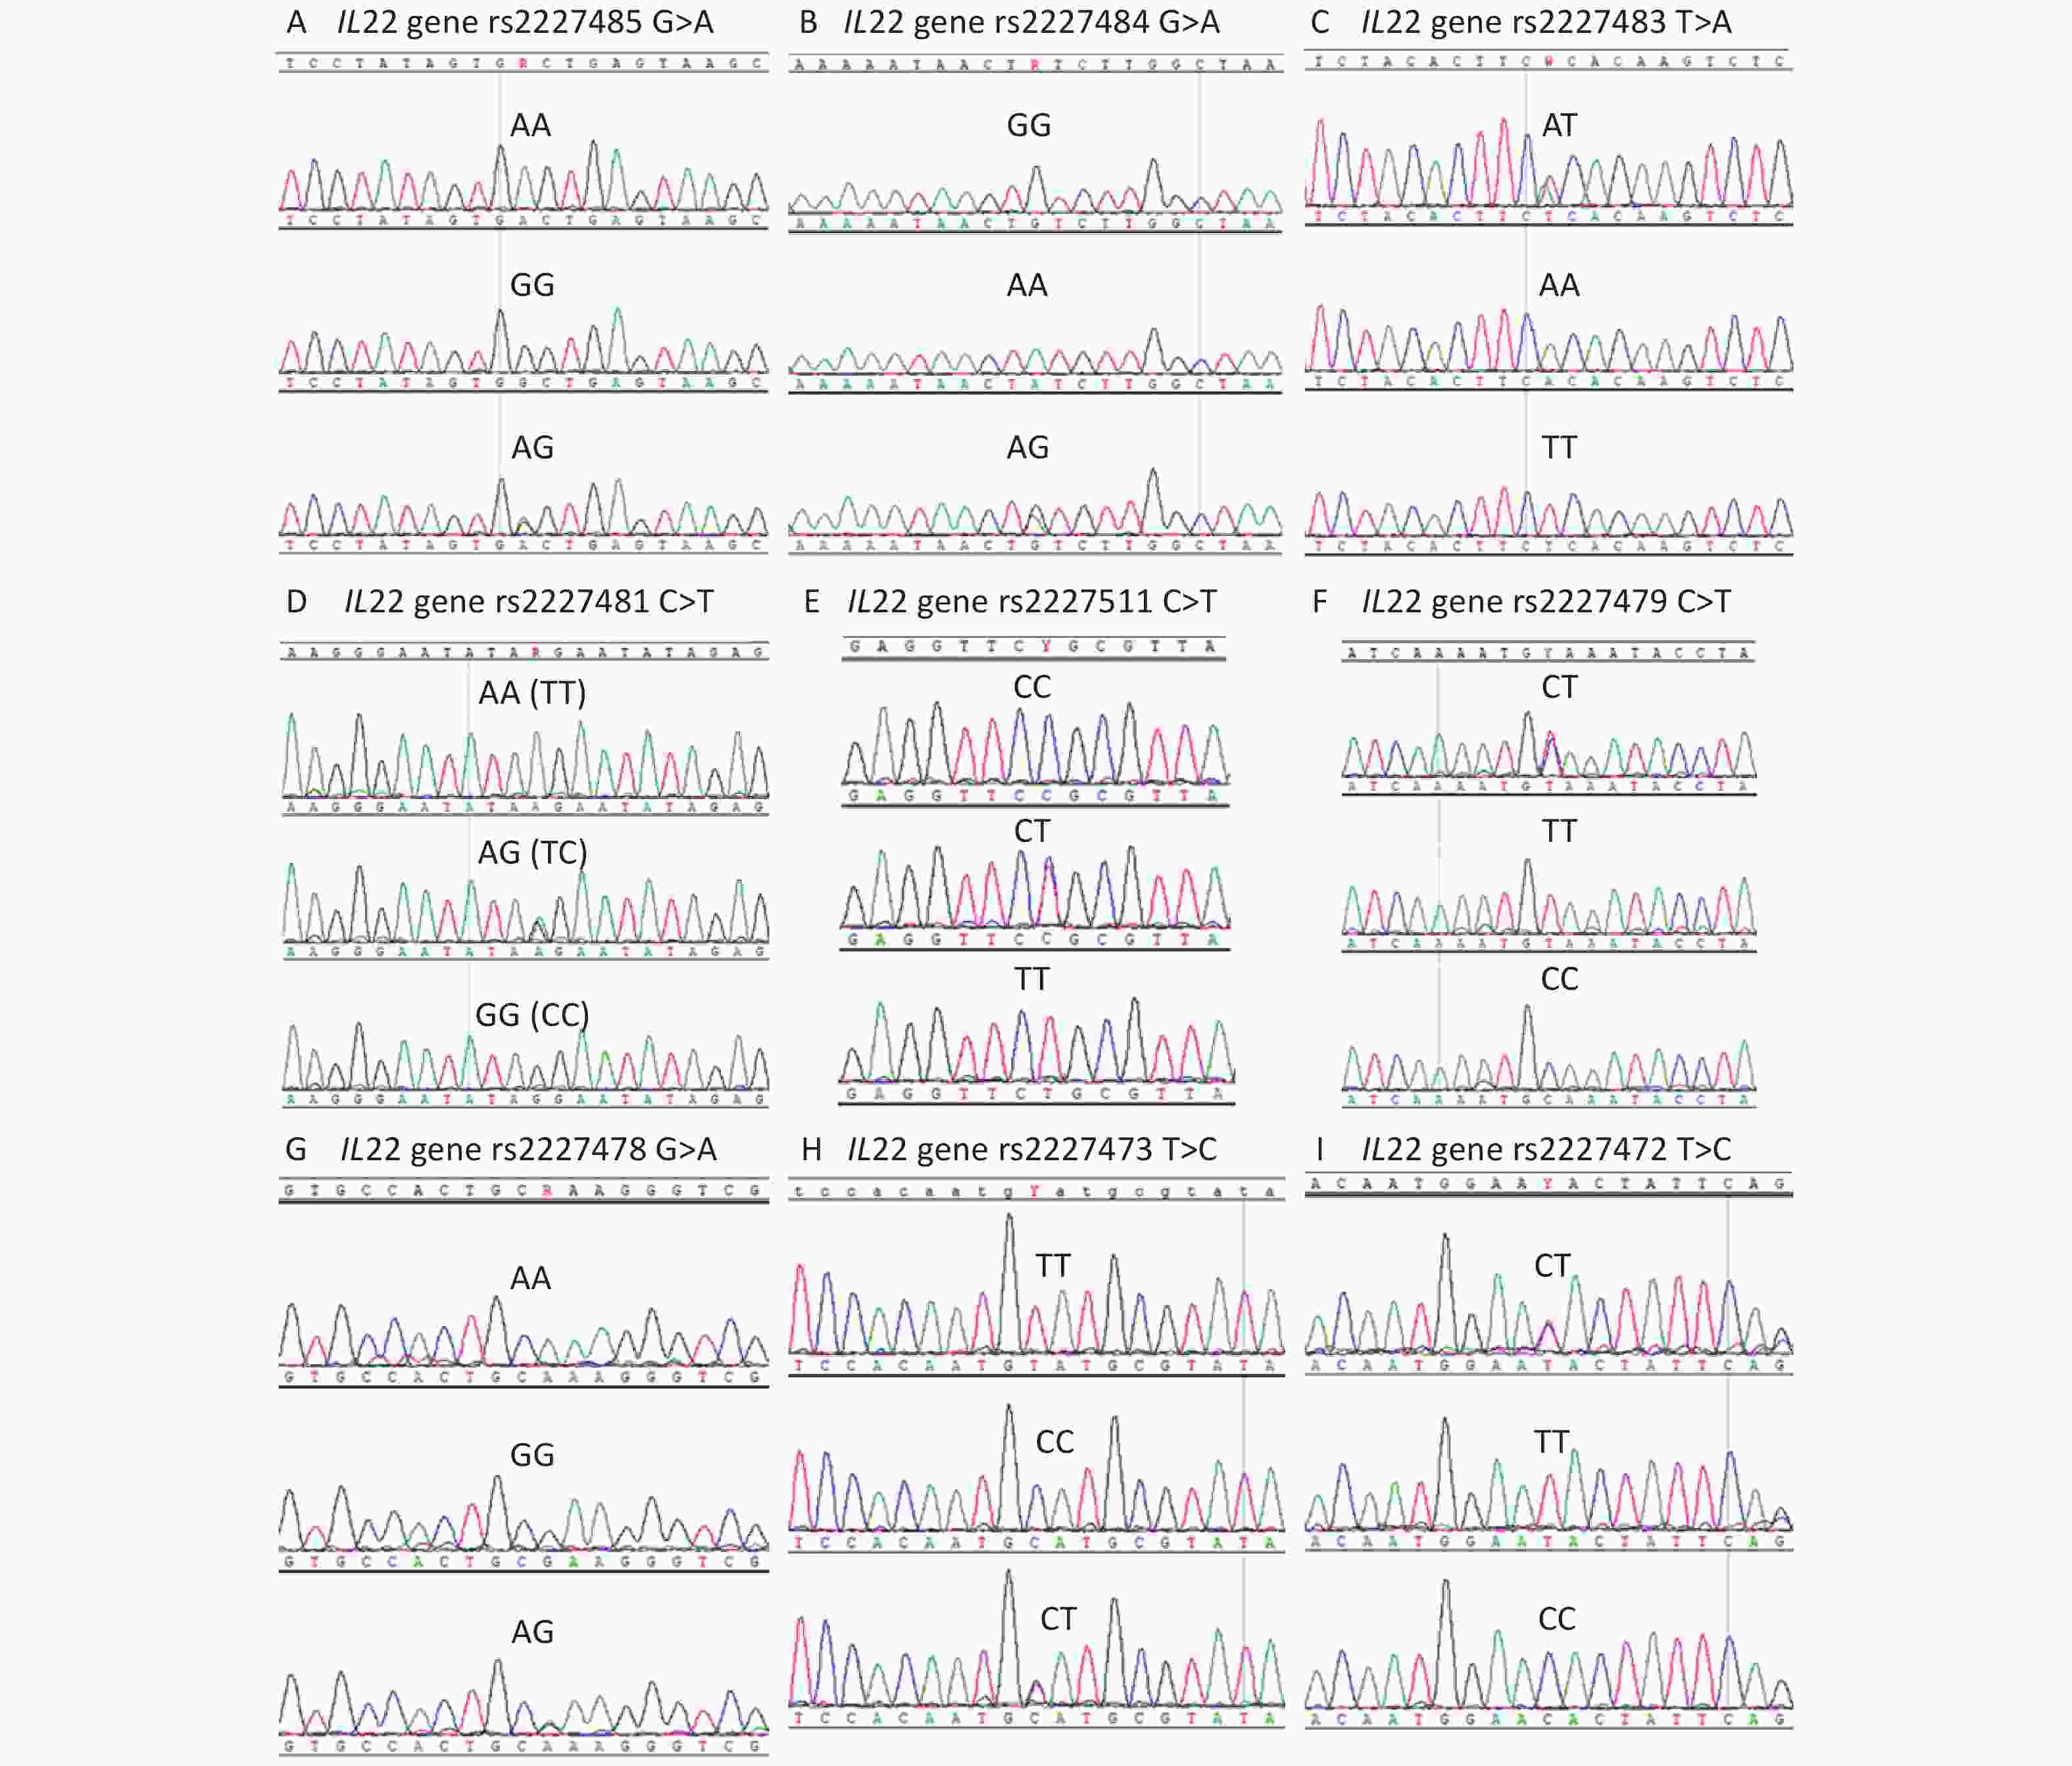
Figure S1. The genotyping diagrams of IL22 gene polymorphisms. (A) rs2227485, (B) rs2227484, (C) rs2227483, (D) rs2227481, (E) rs2227511, (F) rs2227479, (G) rs2227478, (H) rs2227473, and (I) rs2227472.
After identifying an association between the rs2227481 polymorphism and cancer risk, we performed a functional study to elucidate the molecular mechanisms underlying the contribution of rs2227481 to cancer susceptibility. A dual luciferase assay was conducted to test the effect of rs2227481 on IL22 transcriptional activity. Quantitative real-time RT-PCR was performed to examine the effects of the rs2227473 genotype on IL22 mRNA expression. Surface plasma resonance (SPR) analysis and chromatin immunoprecipitation (ChIP) assays were conducted to test the POU2F3 (Oct-11) binding capacity of the rs2227481 alleles. These assays have been described in our previous study[5], and the primers used are presented in Supplementary Table S2, available in www.besjournal.com.
Assays Primer information Dual luciferase assay pGL3-C allele (reporter plasmid): IL22 gene promoter fragment was amplified with 5’-CTAGCTAGCCACGTTATTGCAAATG-3’ (forward) and 5’-CCCAAGCTTTTAGAGCCCGGAGGGT-3’ (reverse), then the PCR products were inserted into the NheI and HindIII restriction sites of the pGL3-basic vector.pGL3-T allele (reporter plasmid): Site-directed mutagenesis of pGL3-C allele (reporter plasmid) Quantitative real-time RT-PCR IL22 gene: 5’-TGACGACCAGAACATCCAGA-3’ (forward)
5’-AATCGCCTTGATCTCTCCAC-3’ (reverse)
GAPDH gene: 5’-TGCACCACCAACTGCTTAGC-3’ (forward)
5’-GGCATGGACTGTGGTCATGAG-3’ (reverse).SPR (surface plasma resonance) analysis rs2227481 [C] probe: 5’-ACCTCTATATTCCTATATTCCCTTC-3’ (forward)
5’-GAAGGGAATATAGGAATATAGAGGT-3’
(reverse)rs2227481 [T] probe: 5’-ACCTCTATATTCTTATATTCCCTTC-3’ (forward)
5’-GAAGGGAATATAAGAATATAGAGGT-3’ (reverse)ChIP (chromatin immunoprecipitation) assay Identification of IL22 gene fragment: 5’-TTTTTAAATAATTTGAAGGTA-3’ (forward)
5’-ATTTCCAAATAATCCTATAAC-3’ (reverse)Table S2. Information of the primers used in the functional analysis of rs2227481
All statistical analyses were performed using SPSS software (version 15.0; SPSS Inc., Chicago, IL). Differences in age, sex, smoking status, and alcohol status between cancer patients and normal controls were compared using a two-sided χ2 test. Other differences were evaluated using the Student’s t-test
. Data are expressed as mean ± standard deviation (SD) from at least three independent experiments. The association between IL22 gene polymorphisms and cancer risk was estimated using logistic regression analysis. The level of significance was set at P < 0.05, and Bonferroni correction was applied for multiple comparisons (P < 0.008, 0.05/6). The characteristics of the participants are shown in Table 1. Regular smoking was defined as smoking at least one cigarette per day on average over one year or having quit smoking for less than one year. Regular drinking was defined as drinking at least 100 mL of alcohol per day on average over one year or having quit drinking for less than one year. The distributions of age, sex, smoking status, and drinking status were not significantly different between cancer patients and normal controls (P > 0.05). These results suggest that cancer patients and normal controls could be used for comparison for study purposes.
Group Age, n (%) Gender, n (%) Smoking status, n (%) Drinking status, n (%) P-value1 ≤ 60 years > 60 years Male Female Ever Never Ever Never Liver cancer
patients
(n = 480)280 (58.3) 200 (41.7) 343 (71.5) 137 (28.5) 140 (29.2) 340 (70.8) 158 (32.9) 322 (67.1) 0.154 0.517 0.237 0.217 Lung cancer
patients
(n = 550)306 (55.6) 244 (44.4) 373 (67.9) 177 (32.1) 150 (27.3) 400 (72.7) 170 (31.0) 380 (69.0) 0.615 0.451 0.639 0.613 Gastric cancer
patients
(n = 460)252 (54.8) 208 (45.2) 323 (70.3) 137 (29.7) 132 (28.8) 328 (71.2) 148 (32.1) 312 (67.9) 0.855 0.862 0.323 0.344 Normal controls
(n = 800)434 (54.3) 366 (45.7) 558 (69.7) 242 (30.3) 209 (26.1) 591 (73.9) 237 (29.6) 563 (70.4) Note. 1Two-sided χ2 test for the distributions of age (1st column), gender (2nd column), smoking status (3rd column), and drinking status (4th column) between liver/lung/gastric cancer patients and normal controls. Table 1. Characteristics of participants in the present study
In stage I, the 13 selected IL-22 gene promoter polymorphisms were genotyped in 300 cancer patients and 150 normal controls. Of the 13 SNPs, rs2227487, rs2227486, rs2227482, and rs2227474 did not show polymorphism. Among the remaining nine SNPs, only rs2227481 was significantly associated with the risk of liver, lung, and gastric cancer (Table 2). Specifically, the T allele was associated with a decreased risk of liver, lung, and gastric cancer susceptibility at P-values of 0.007, 0.001, and 0.003, respectively, with OR (95% CI) of 0.55 (0.35–0.85), 0.46 (0.29–0.72), and 0.51 (0.33–0.80), respectively, and TT+CT genotypes were associated with a lower risk of lung cancer than the CC genotype (P = 0.003, OR = 0.44, 95% CI = 0.26–0.75). Since there was no significant association between the other eight SNPs (rs2227485, rs2227484, rs2227483, rs2227511, rs2227479, rs2227478, rs2227473, and rs2227472) and cancer risk, they were eliminated in the stage II study (Supplementary Table S3, available in www.besjournal.com).
Groups n Allele and genotype
(frequency, %)Logistic regression analysis
[P, OR (95% CI)]1T C TT CT CC T vs. C TT vs. CC TT vs. CT CT vs. CC TT+CT vs. CC TT vs. CT+CC Stage I Liver cancer 100 36
(18.0)164
(82.0)1
(1.0)34
(34.0)65
(65.0)0.007, 0.55
(0.35–0.85)0.027, 0.10
(0.01–0.77)0.076, 0.15
(0.02–1.22)0.103, 0.64
(0.38–1.09)0.026, 0.55
(0.33–0.93)0.040, 0.12
(0.02–0.91)Lung cancer 100 31
(15.5)169
(84.5)1
(1.0)29
(29.0)70
(70.0)0.001, 0.46
(0.29–0.72)0.023, 0.09
(0.01–0.71)0.105, 0.18
(0.02–1.44)0.015, 0.51
(0.29–0.88)0.003, 0.44
(0.26–0.75)0.040, 0.12
(0.02–0.91)Gastric cancer 100 34
(17.0)166
(83.0)1
(1.0)32
(32.0)67
(67.0)0.003, 0.51
(0.33–0.80)0.025, 0.10
(0.01–0.75)0.086, 0.16
(0.02–1.30)0.051, 0.59
(0.34–1.00)0.011, 0.51
(0.30–0.86)0.040, 0.12
(0.02–0.91)Normal controls 150 86
(28.7)214
(71.3)12
(8.0)62
(41.3)76
(50.7)Stage II Liver cancer 380 166
(21.8)594
(78.2)17
(4.5)132
(34.7)231
(60.8)0.005, 0.74
(0.60–0.92)0.029, 0.52
(0.29–0.93)0.233, 0.70
(0.39–1.26)0.037, 0.75
(0.58–0.98)0.136, 1.20
(0.95–1.52)0.066, 0.59
(0.33–1.04)Lung cancer 450 200
(22.2)700
(77.8)18
(4.0)164
(36.4)268
(59.6)0.006, 0.76
(0.62–0.92)0.011, 0.48
(0.27–0.84)0.077, 0.60
(0.33–1.06)0.092, 0.81
(0.63–1.04)0.023, 0.75
(0.59–0.96)0.022, 0.52
(0.30–0.91)Gastric cancer 360 155
(21.5)565
(78.5)18
(5.0)119
(33.1)223
(61.9)0.004, 0.73
(0.59–0.90)0.056, 0.58
(0.33–1.01)0.503, 0.82
(0.46–1.47)0.012, 0.70
(0.53–0.92)0.004, 0.68
(0.53–0.89)0.144, 0.66
(0.38–1.15)Normal controls 650 356
(27.4)944
(72.6)48
(7.4)260
(40.0)342
(52.6)Stage I+II (pooled data) Liver cancer 480 202
(21.0)758
(79.0)18
(3.8)166
(34.5)296
(61.7)< 0.001, 0.70
(0.58–0.84)0.002, 0.42
(0.25–0.73)0.058, 0.58
(0.33–1.02)0.009, 0.73
(0.57–0.93)0.001, 0.68
(0.54–0.86)0.008, 0.48
(0.28–0.82)Lung cancer 550 231
(21.0)869
(79.0)19
(3.5)193
(35.0)338
(61.5)< 0.001, 0.70
(0.58–0.84)0.001, 0.39
(0.23–0.67)0.022, 0.53
(0.31–0.91)0.010, 0.74
(0.59–0.93)0.001, 0.69
(0.55–0.86)0.002, 0.44
(0.26–0.75)Gastric cancer 460 189
(20.5)731
(79.5)19
(4.1)151
(32.8)290
(63.1)< 0.001, 0.68
(0.56–0.82)0.004, 0.46
(0.27–0.78)0.163. 0.68
(0.39–1.17)0.002, 0.68
(0.53–0.86)0.000, 0.64
(0.51–0.81)0.019, 0.53
(0.31–0.90)Normal controls 800 442
(27.6)1158
(72.4)60
(7.5)322
(40.3)418
(52.2)Note. 1The OR (95% CI) and the corresponding P-value were calculated using logistic regression analysis, and adjusted for age, gender, smoking, and drinking status. Table 2. The association between IL22 gene rs2227481 polymorphism and risk of liver, lung, and gastric cancer
Groups n Allele and genotype (frequency, %) Logistic regression analysis [P, OR (95% CI)]1 1 2 11 12 22 1 vs. 2 11 vs. 22 11 vs. 12 12 vs. 22 11+12 vs. 22 11 vs. 12+22 rs2227485 A/G (1-A, 2-G) Liver cancer 100 94
(47.0)106
(53.0)22
(22.0)50
(50.0)28
(28.0)0.422, 0.86
(0.60–1.24)0.422, 0.74
(0.36–1.53)0.817, 0.93
(0.49–1.75)0.477, 0.80
(0.44–1.48)0.406, 0.78
(0.44–1.40)0.627, 0.86
(0.47–1.57)Lung cancer 100 103
(51.5)97
(48.5)26
(26.0)51
(51.0)23
(23.0)0.855, 1.03
(0.72–1.48)0.857, 1.07
(0.52–2.21)0.818, 1.08
(0.58–1.99)0.988, 1.00
(0.53–1.88)0.951, 1.02
(0.56–1.86)0.812, 1.07
(0.60–1.92)Gastric cancer 100 95
(47.5)105
(52.5)23
(23.0)49
(49.0)28
(28.0)0.488, 0.88
(0.62–1.26)0.492, 0.78
(0.38–1.60)0.974, 0.99
(0.53–1.86)0.439, 0.79
(0.43–1.45)0.406, 0.78
(0.44–1.40)0.762, 0.91
(0.50–1.66)Normal 150 152
(50.7)148
(49.3)37
(24.7)78
(52.0)35
(23.3)rs2227484 G/A (1-G, 2-A) Liver cancer 100 177
(88.5)23
(11.5)78
(78.0)21
(21.0)1
(1.0)0.865, 1.05
(0.60–1.83)0.810, 1.35
(0.12–15.09)0.939, 1.03
(0.55–1.91)0.829, 1.31
(0.11–15.41)0.813, 1.34
(0.12–14.95)0.901, 1.04
(0.57–1.91)Lung cancer 100 180
(90.0)20
(10.0)81
(81.0)18
(18.0)1
(1.0)0.488, 1.23
(0.69–2.19)0.787, 1.40
(0.13–15.66)0.510, 1.24
(0.65–2.36)0.787, 1.40
(0.13–15.66)0.813, 1.34
(0.12–14.95)0.488, 1.25
(0.67–2.34)Gastric cancer 100 179
(89.5)21
(10.5)80
(80.0)19
(19.0)1
(1.0)0.605, 1.16
(0.66–2.06)0.794, 1.38
(0.12–15.47)0.644, 1.16
(0.62–2.19)0.891, 1.19
(0.10–13.99)0.813, 1.34
(0.12–14.95)0.616, 1.17
(0.63–2.18)Normal 150 264
(88.0)36
(12.0)116
(77.3)32
(21.4)2
(1.3)rs2227483 A/T (1-A, 2-T) Liver cancer 100 109
(54.5)91
(45.5)30
(30.0)49
(49.0)21
(21.0)0.634, 1.09
(0.76–1.56)0.656, 1.18
(0.57–2.43)0.587, 1.18
(0.65–2.13)1.000, 1.00
(0.52–1.92)0.851, 1.06
(0.57–1.97)0.565, 1.18
(0.67–2.06)Lung cancer 100 111
(55.5)89
(44.5)31
(31.0)49
(49.0)20
(20.0)0.487, 1.14
(0.79–1.63)0.507, 1.28
(0.62–2.65)0.513, 1.22
(0.68–2.20)0.885, 1.05
(0.54–2.03)0.705, 1.13
(0.61–2.11)0.457, 1.24
(0.71–2.16)Gastric cancer 100 107
(53.5)93
(46.5)29
(29.0)49
(49.0)22
(22.0)0.798, 1.05
(0.73–1.50)0.820, 1.09
(0.53–2.24)0.669, 1.14
(0.63–2.07)0.888, 0.96
(0.50–1.82)1.000, 1.00
(0.54–1.84)0.686, 1.12
(0.64–1.97)Normal 150 157
(52.3)143
(47.7)40
(26.7)77
(51.3)33
(22.0)rs2227511 C/T (1-C, 2-T) Liver cancer 100 167
(83.5)33
(16.5)69
(69.0)29
(29.0)2
(2.0)0.726, 0.92
(0.56–1.49)0.671, 0.65
(0.09–4.73)0.837, 0.94
(0.54–1.65)0.719, 0.69
(0.09–5.19)0.683, 0.66
(0.09–4.78)0.778, 0.92
(0.53–1.60)Lung cancer 100 168
(84.0)32
(16.0)70
(70.0)28
(28.0)2
(2.0)0.841, 0.95
(0.58–1.55)0.682, 0.66
(0.09–4.80)0.974, 0.99
(0.56–1.74)0.694, 0.67
(0.09–5.01)0.683, 0.66
(0.09–4.78)0.910, 0.97
(0.56–1.69)Gastric cancer 100 170
(85.0)30
(15.0)71
(71.0)28
(28.0)1
(1.0)0.919, 1.03
(0.62–1.69)0.813, 1.34
(0.12–15.05)0.987, 1.01
(0.57–1.77)0.818, 1.33
(0.12–15.41)0.813, 1.34
(0.12–14.95)0.955, 1.02
(0.58–1.77)Normal 150 254
(84.7)46
(15.3)106
(70.7)42
(28.0)2
(1.3)rs2227479 C/T (1-C, 2-T) Liver cancer 100 182
(91.0)18
(9.0)82
(82.0)18
(18.0)0
(0)0.595, 0.84
(0.44–1.60)— 0.577, 0.83
(0.42–1.62)— — 0.577, 0.83
(0.42–1.62)Lung cancer 100 186
(93.0)14
(7.0)86
(86.0)14
(14.0)0
(0)0.780, 1.10
(0.55–2.20)— 0.771, 1.11
(0.54–2.28)— — 0.771, 1.11
(0.54–2.28)Gastric cancer 100 184
(92.0)16
(8.0)84
(84.0)16
(16.0)0
(0)0.892, 0.96
(0.49–1.86)— 0.887, 0.95
(0.47–1.91)— — 0.887, 0.95
(0.47–1.91)Normal 150 277
(92.3)23
(7.7)127
(84.7)23
(15.3)0
(0)rs2227478 A/G (1-A, 2-G) Liver cancer 100 163
(81.5)37
(18.5)68
(68.0)27
(27.0)5
(5.0)0.301, 0.78
(0.48–1.25)0.192, 0.38
(0.09–1.63)0.747, 0.91
(0.51–1.62)0.255, 0.42
(0.09–1.89)0.202, 0.39
(0.09–1.66)0.498, 0.83
(0.48–1.43)Lung cancer 100 165
(82.5)35
(17.5)70
(70.0)25
(25.0)5
(5.0)0.455, 0.83
(0.51–1.35)0.206, 0.39
(0.09–1.68)0.970, 1.01
(0.56–1.82)0.217, 0.39
(0.08–1.75)0.202, 0.39
(0.09–1.66)0.732, 0.91
(0.52–1.58)Gastric cancer 100 165
(82.5)35
(17.5)69
(69.0)27
(27.0)4
(4.0)0.455, 0.83
(0.51–1.35)0.345, 0.48
(0.10–2.21)0.785, 0.92
(0.52–1.64)0.415, 0.52
(0.11–2.51)0.357, 0.49
(0.11–2.24)0.609, 0.87
(0.50–1.51)Normal 150 255
(85.0)45
(15.0)108
(72.0)39
(26.0)3
(2.0)rs2227473 C/T (1-C, 2-T) Liver cancer 100 182
(91.0)18
(9.0)83
(83.0)16
(16.0)1
(1.0)0.710, 1.12
(0.61–2.08)0.791, 0.69
(0.04–11.12)0.596, 1.20
(0.61–2.36)0.699, 0.57
(0.03–9.77)0.773, 0.66
(0.04–10.75)0.641, 1.17
(0.60–2.27)Lung cancer 100 181
(90.5)19
(9.5)82
(82.0)17
(17.0)1
(1.0)0.854, 1.06
(0.58–1.94)0.784, 0.68
(0.04–10.99)0.746, 1.12
(0.57–2.17)0.730, 0.61
(0.04–10.36)0.773, 0.66
(0.04–10.75)0.792, 1.09
(0.57–2.10)Gastric cancer 100 179
(89.5)21
(10.5)80
(80.0)19
(19.0)1
(1.0)0.856, 0.95
(0.53–1.71)0.771, 0.66
(0.04–10.72)0.937, 0.97
(0.51–1.86)0.788, 0.68
(0.04–11.53)0.773, 0.66
(0.04–10.75)0.897, 0.96
(0.51–1.81)Normal 150 270
(90.0)30
(10.0)121
(80.7)28
(18.6)1
(0.7)rs2227472 T/C (1-T, 2-C) Liver cancer 100 114
(57.0)86
(43.0)30
(30.0)54
(54.0)16
(16.0)0.557, 1.11
(0.78–1.60)0.473, 1.32
(0.62–2.83)0.854, 0.95
(0.53–1.69)0.349, 1.40
(0.70–2.80)0.356, 1.37
(0.70–2.66)0.910, 1.03
(0.59–1.80)Lung cancer 100 112
(56.0)88
(44.0)33
(33.0)46
(46.0)21
(21)0.714, 1.07
(0.75–1.53)0.780, 1.11
(0.54–2.26)0.498, 1.22
(0.68–2.19)0.769, 0.91
(0.47–1.76)0.949, 0.98
(0.53–1.83)0.539, 1.19
(0.69–2.05)Gastric cancer 100 113
(56.5)87
(43.5)32
(32.0)49
(49.0)1919.0) 0.633, 1.09
(0.76–1.57)0.646, 1.19
(0.57–2.46)0.717, 1.11
(0.62–1.99)0.853, 1.07
(0.54–2.09)0.747, 1.11
(0.59–2.10)0.653, 1.13
(0.66–1.96)Normal 150 163
(54.3)137
(45.7)44
(29.3)75
(50.0)31
(20.7)Note. 1The OR (95% CI) and the corresponding P-value were calculated by logistic regression analysis, and adjusted for age, gender, smoking, and drinking status. Table S3. The association between IL22 gene polymorphisms and cancer risk in stage I
For that rs2227483, rs2227482, rs2227481, rs2227511, rs2227479, and rs2227478 were simultaneously genotyped, we obtained the genotype data of these six SNPs in stage II (1,190 cancer patients and 650 normal controls). Of note, rs2227481, but not other SNPs, was still significantly associated with the risk of liver, lung, and gastric cancer in stage II as well as in stage I+II (Supplementary Table S4, available in www.besjournal.com). As shown in Table 2, the rs2227481 T allele conferred a reduced risk of liver, lung, and gastric cancer at P-values of 0.005, 0.006, and 0.004, respectively, with OR (95% CI) of 0.74 (0.60–0.92), 0.76 (0.62–0.92), and 0.73 (0.59–0.90), respectively, and CT+TT genotypes were associated with a lower risk of gastric cancer than the CC genotype (P = 0.004, OR = 0.68, 95% CI = 0.53–0.89). The pooled data (I+II) revealed an even more significant association between the rs2227481 T allele and lower risk of liver, lung, and gastric cancer, with P-values less than 0.001. Moreover, the rs2227481 T allele genotypes were significantly associated with a lower susceptibility to liver cancer (TT vs. CC, TT vs. CC+CT, and TT+CT vs. CC), lung cancer (TT vs. CC, TT vs. CC+CT, and TT+CT vs. CC), and gastric cancer (TT vs. CC, CT vs. CC, and TT+CT vs. CC).
Groups n Allele and genotype (frequency, %) Logistic Regression analysis [P, OR (95% CI)]1 1 2 11 12 22 1 vs. 2 11 vs. 22 11 vs. 12 12 vs. 22 11+12 vs. 22 11 vs. 12+22 rs2227483 A/T (1-A, 2-T) in stage II Liver cancer 380 401
(52.8)359
(47.2)102
(26.9)197
(51.8)81
(21.3)0.476, 0.94
(0.78–1.12)0.570, 0.90
(0.63–1.29)0.131, 0.80
(0.59–1.07)0.453, 1.13
(0.82–1.57)0.797, 1.04
(0.77–1.42)0.182, 0.83
(0.62–1.09)Lung cancer 450 475
(52.8)425
(47.2)123
(27.3)229
(50.9)98
(21.8)0.457, 0.94
(0.79–1.11)0.534, 0.90
(0.64–1.26)0.180, 0.82
(0.62–1.09)0.591, 1.09
(0.80–1.48)0.930, 1.01
(0.76–1.36)0.219, 0.85
(0.65–1.10)Gastric cancer 360 364
(50.6)356
(49.4)90
(25.0)184
(51.1)86
(23.9)0.099, 0.86
(0.72–1.03)0.120, 0.75
(0.52–1.08)0.069, 0.75
(0.55–1.02)0.984, 1.00
(0.72–1.38)0.492, 0.90
(0.66–1.22)0.053, 0.75
(0.56–1.00)Normal controls 650 707
(54.4)593
(45.6)200
(30.8)307
(47.2)143
(22.0)rs2227483 A/T (1-A, 2-T) in stage I+II Liver cancer 480 510
(53.1)450
(46.9)132
(27.5)246
(51.2)102
(21.3)0.667, 0.97
(0.82–1.13)0.751, 0.95
(0.69–1.31)0.261, 0.86
(0.66–1.12)0.501, 1.11
(0.83–1.48)0.753, 1.05
(0.79–1.38)0.340, 0.89
(0.69–1.14)Lung cancer 550 586
(53.3)514
(46.7)154
(28.0)278
(50.5)118
(21.5)0.710, 0.97
(0.83–1.13)0.781, 0.96
(0.70–1.30)0.353, 0.89
(0.69–1.14)0.591, 1.08
(0.82–1.43)0.811, 1.03
(0.79–1.34)0.427, 0.91
(0.71–1.15)Gastric cancer 460 471
(51.2)449
(48.8)119
(25.9)233
(50.6)108
(23.5)0.175, 0.89
(0.76–1.05)0.199, 0.81
(0.58–1.12)0.148, 0.82
(0.62–1.07)0.939, 0.99
(0.74–1.32)0.545, 0.92
(0.70–1.21)0.118, 0.81
(0.63–1.05)Normal controls 800 864
(54.0)736
(46.0)240
(30.0)384
(48.0)176
(22.0)rs2227511 C/T (1-C, 2-T) in stage II Liver cancer 380 641
(84.3)119
(15.7)271
(71.3)99
(26.1)10
(2.6)0.767, 1.04
(0.81–1.33)0.769, 1.12
(0.52–2.45)0.821, 1.03
(0.77–1.38)0.838, 1.09
(0.49–2.43)0.785, 1.11
(0.51–2.42)0.771, 1.04
(0.79–1.38)Lung cancer 450 778
(86.4)122
(13.6)337
(74.9)104
(23.1)9
(2.0)0.095, 1.23
(0.97–1.56)0.284, 1.55
(0.69–3.48)0.159, 1.22
(0.92–1.62)0.573, 1.27
(0.55–2.91)0.342, 1.48
(0.66–3.29)0.107, 1.25
(0.95–1.64)Gastric cancer 360 615
(85.4)105
(14.6)264
(73.3)87
(24.2)9
(2.5)0.352, 1.13
(0.88–1.46)0.634, 1.22
(0.54–2.73)0.371, 1.15
(0.85–1.55)0.888, 1.06
(0.46–2.44)0.695, 1.17
(0.53–2.62)0.333, 1.15
(0.86–1.54)Normal controls 650 1090
(83.8)210
(16.2)458
(70.5)173
(26.6)19
(2.9)rs2227511 C/T (1-C, 2-T) in stage I+II Liver cancer 480 808
(84.2)152
(15.8)340
(70.9)128
(26.6)12
(2.5)0.911, 1.01
(0.81–1.26)0.884, 1.06
(0.51–2.17)0.924, 1.01
(0.78–1.31)0.914, 1.04
(0.50–2.19)0.891, 1.05
(0.51–2.16)0.899, 1.02
(0.79–1.30)Lung cancer 550 946
(86.0)154
(14.0)407
(73.9132
(24.1)11
(2.0)0.155, 1.17
(0.94–1.45)0.396, 1.38
(0.66–2.89)0.229, 1.17
(0.91–1.50)0.668, 1.18
(0.55–2.53)0.457, 1.32
(0.63–2.77)0.177, 1.18
(0.93–1.51)Gastric cancer 460 785
(85.3)135
(14.7)335
(72.8)115
(25.1)10
(2.2)0.376, 1.11
(0.88–1.39)0.571, 1.25
(0.58–2.68)0.436, 1.11
(0.85–1.45)0.772, 1.12
(0.51–2.47)0.619, 1.21
(0.57–2.60)0.379, 1.12
(0.87–1.45)Normal controls 800 1344
(84.0)256
(16.0)564
(70.5)215
(26.9)21
(2.6)rs2227479 C/T (1-C, 2-T) in stage II Liver cancer 380 722
(95.0)38
(5.0)342
(90.0)38
(10.0)0
(0)0.195, 0.75
(0.49–1.16)0.342, 4.21
(0.22–81.8)0.316, 1.23
(0.82–1.86)0.418, 3.43
(0.17–68.2)0.350, 4.11
(0.21–79.9)0.234, 1.28
(0.85–1.93)Lung cancer 450 858
(95.3)42
(4.7)408
(90.7)42
(9.3)0
(0)0.319, 0.81
(0.53–1.23)0.286, 5.02
(0.26–97.5)0.156, 1.33
(0.90–1.98)0.382, 3.79
(0.19–75.1)0.295, 4.87
(0.25–94.5)0.107, 1.38
(0.93–2.05)Gastric cancer 360 670
(93.1)50
(6.9)310
(86.1)50
(13.9)0
(0)0.002, 0.53
(0.35–0.80)0.376, 3.82
(0.20–74.1)0.403, 0.85
(0.58–1.24)0.323, 4.50
(0.23–89.0)0.369, 3.90
(0.20–75.7)0.518, 0.88
(0.60–1.29)Normal controls 650 1216
(93.5)84
(6.5)569
(87.5)78
(12.0)3
(0.5)rs2227479 C/T (1-C, 2-T) in stage I+II Liver cancer 480 904
(94.2)56
(5.8)424
(88.3)56
(11.7)0
(0)0.392, 1.16
(0.83–1.62)0.338, 4.27
(0.22–82.8)0.596, 1.10
(0.78–1.56)0.371, 3.90
(0.20–76.8)0.341, 4.22
(0.22–81.8)0.485, 1.13
(0.80–1.60)Lung cancer 550 1044
(94.9)56
(5.1)494
(89.8)56
(10.2)0
(0)0.088, 1.34
(0.96–1.86)0.289, 4.97
(0.26–96.4)0.162, 1.28
(0.91–1.81)0.371, 3.90
(0.20–76.8)0.298, 4.83
(0.25–93.7)0.116, 1.32
(0.93–1.86)Gastric cancer 460 854
(92.8)66
(7.2)394
(85.7)66
(14.3)0
(0)0.642, 0.93
(0.68–1.28)0.363, 3.97
(0.20–77.0)0.400, 0.87
(0.62–1.21)0.316, 4.59
(0.23–90.2)0.356, 4.04
(0.21–78.4)0.500, 0.89
(0.64–1.24)Normal controls 800 1493
(93.3)107
(6.7)696
(87.0)101
(12.6)3
(0.4)rs2227478 A/G (1-A, 2-G) in stage II Liver cancer 380 635
(83.6)125
(16.4)262
(69.0)111
(29.2)7
(1.8)0.993, 1.00
(0.79–1.27)0.266, 1.64
(0.69–3.93)0.468, 0.90
(0.68–1.20)0.188, 1.82
(0.75–4.45)0.236, 1.69
(0.71–4.04)0.684, 0.95
(0.72–1.24)Lung cancer 450 746
(82.9)154
(17.1)304
(67.5)138
(30.7)8
(1.8)0.688, 0.96
(0.76–1.20)0.229, 1.67
(0.73–3.83)0.201, 0.84
(0.64–1.10)0.114, 1.98
(0.85–4.64)0.184, 1.75
(0.77–4.02)0.359, 0.89
(0.68–1.15)Gastric cancer 360 605
(84.0)115
(16.0)257
(71.3)91
(25.4)12
(3.3)0.775, 1.04
(0.81–1.33)0.867, 0.94
(0.45–1.95)0.621, 1.08
(0.80–1.45)0.723, 0.87
(0.41–1.86)0.824, 0.92
(0.45–1.91)0.680, 1.06
(0.80–1.41)Normal controls 650 1086
(83.5)214
(16.5)456
(70.1)174
(26.8)20
(3.1)rs2227478 A/G (1-A, 2-G) in stage I+II Liver cancer 480 798
(83.1)162
(16.9)330
(68.7)138
(28.8)12
(2.5)0.650, 0.95
(0.77–1.18)0.752, 1.12
(0.55–2.28)0.431, 0.90
(0.70–1.16)0.561, 1.24
(0.60–2.58)0.691, 1.15
(0.57–2.34)0.509, 0.92
(0.72–1.18)Lung cancer 550 911
(82.8)189
(17.2)374
(68.0)163
(29.6)13
(2.4)0.495, 0.93
(0.76–1.14)0.651, 1.17
(0.59–2.35)0.246, 0.87
(0.68–1.10)0.403, 1.35
(0.67–2.75)0.567, 1.22
(0.61–2.44)0.327, 0.89
(0.70–1.13)Gastric cancer 460 770
(83.7)150
(16.3)326
(70.9)118
(25.6)16
(3.5)0.939, 0.99
(0.80–1.24)0.578, 0.83
(0.43–1.60)0.752, 1.04
(0.80–1.36)0.509, 0.80
(0.41–1.57)0.552, 0.82
(0.43–1.57)0.890, 1.02
(0.79–1.31)Normal controls 800 1341
(83.8)259
(16.2)564
(70.5)213
(26.6)23
(2.9)Note. 1 The OR (95% CI) and the corresponding p-value were calculated by logistic regression analysis, and adjusted for age, gender, smoking, and drinking status. Table S4. The association between IL22 gene polymorphisms and cancer risk in stage II and pooled data (I+II)
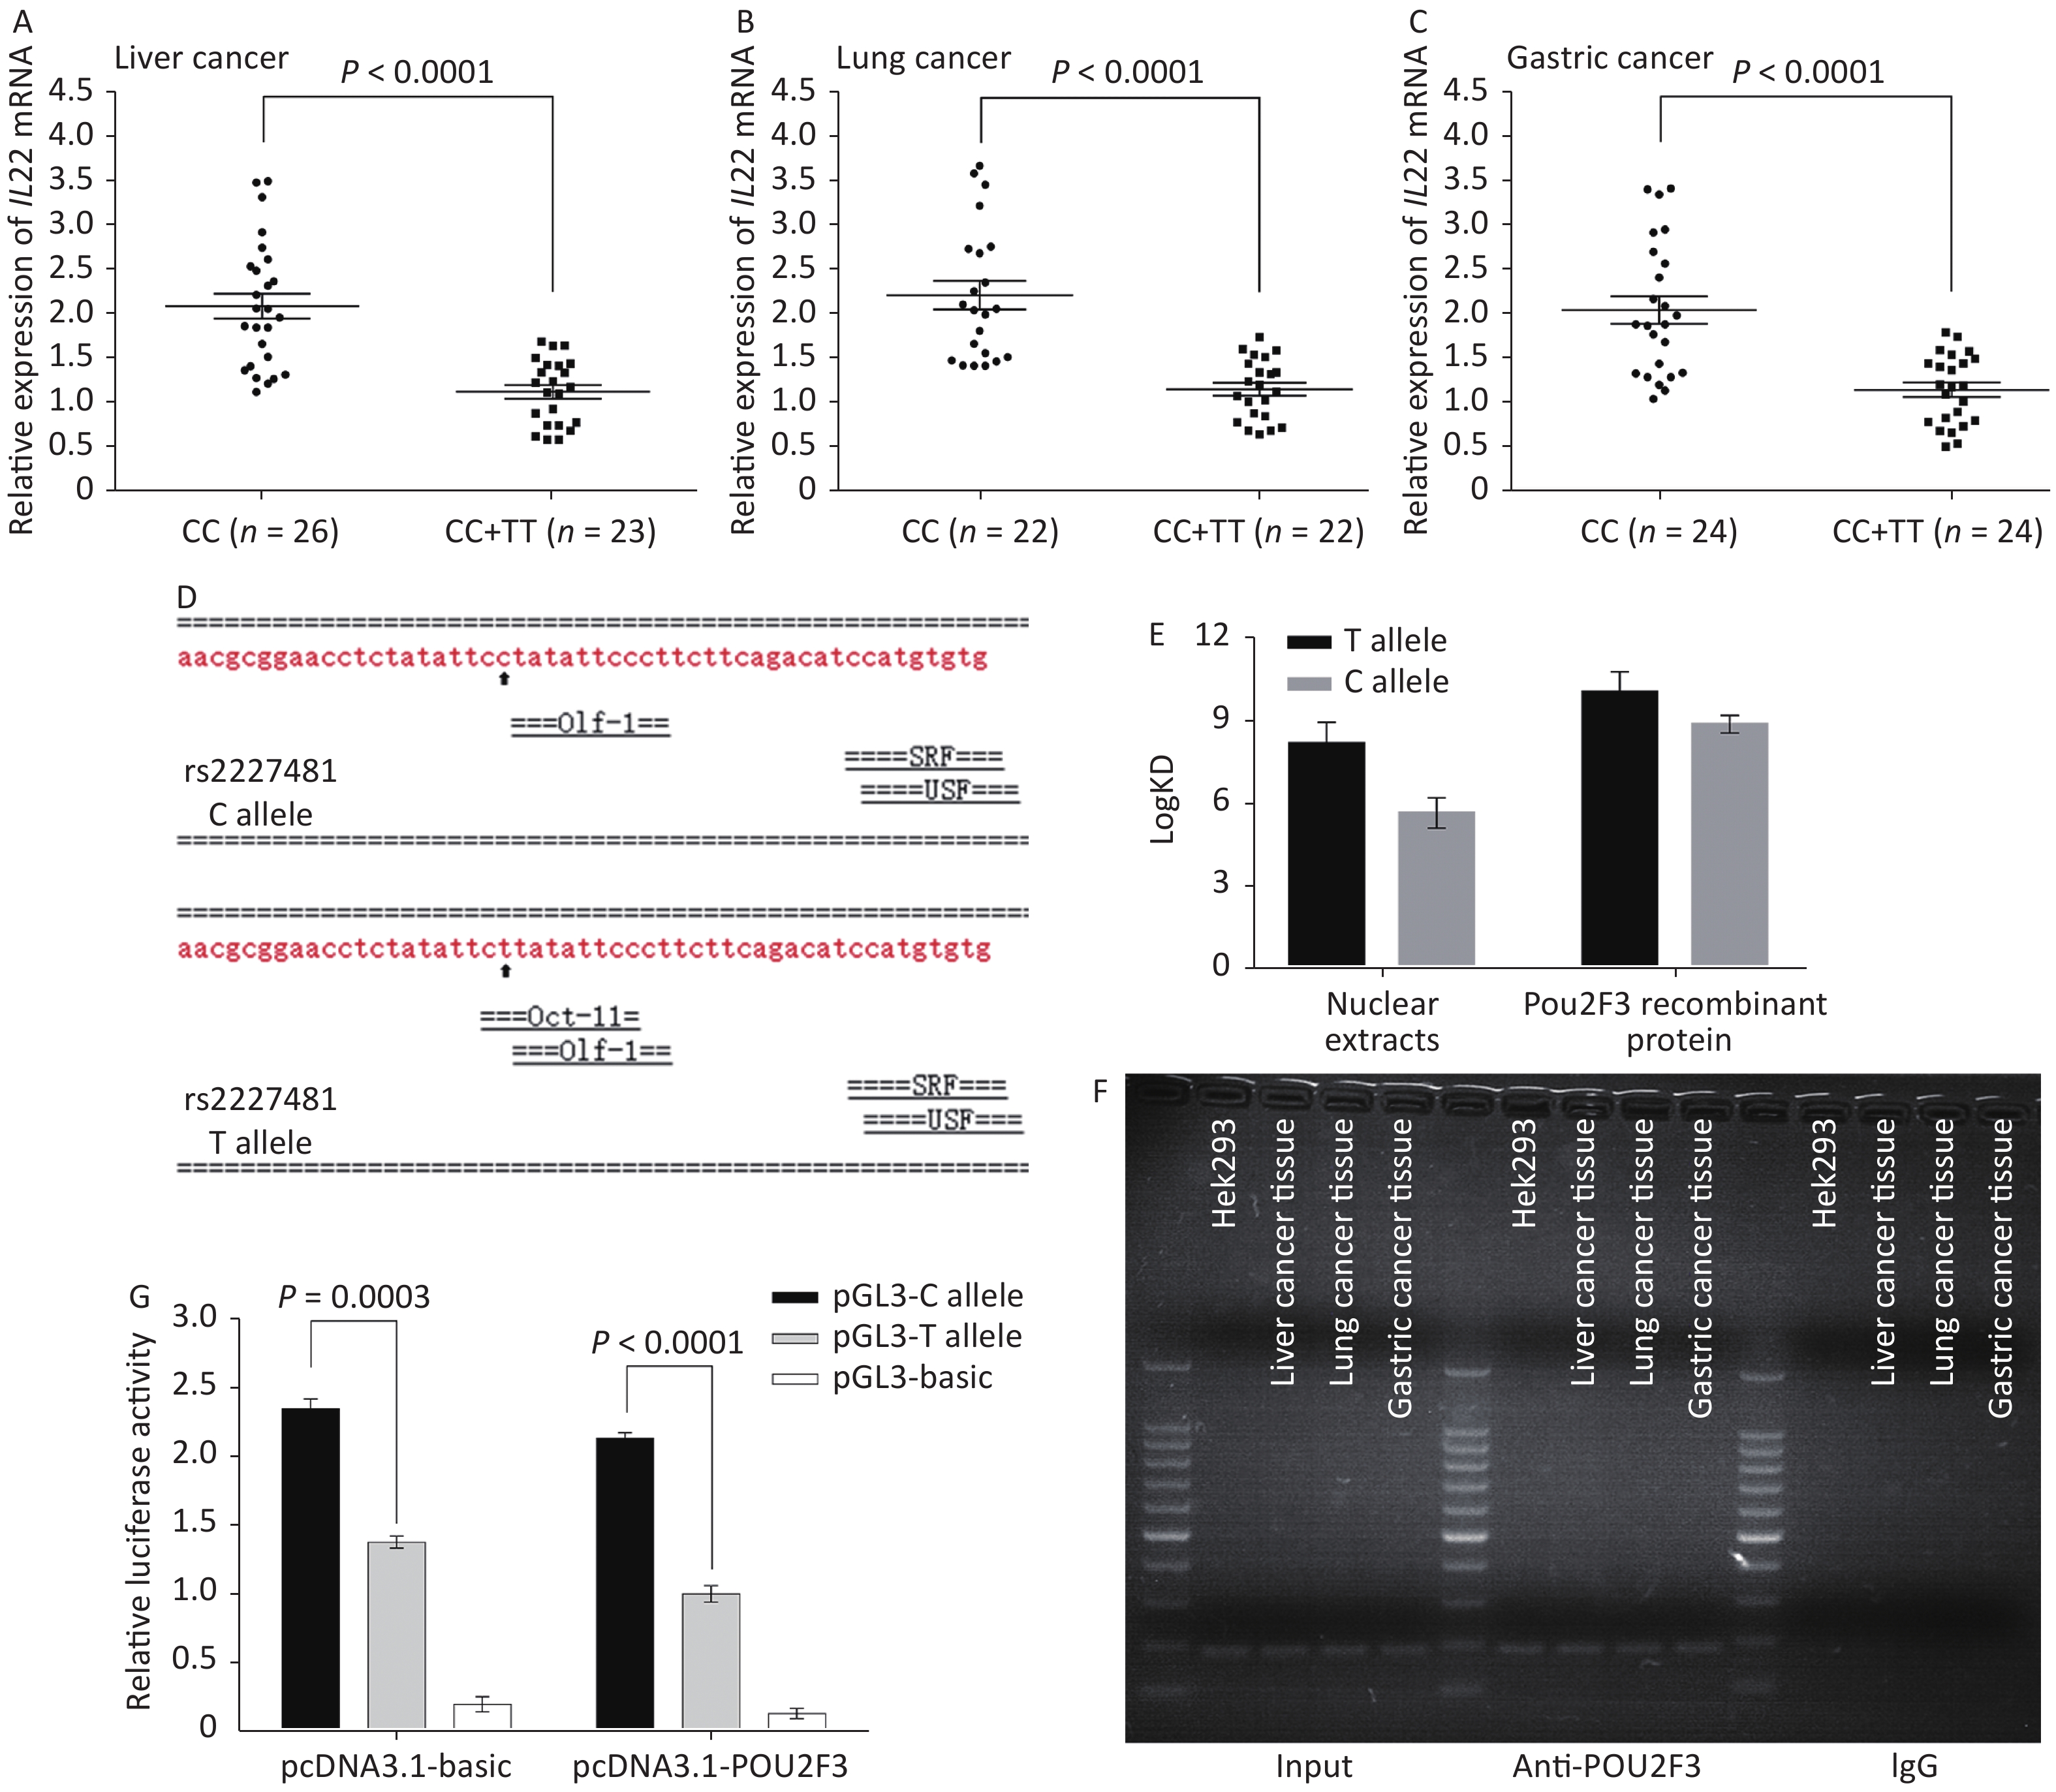
Our two-stage case-control study consistently showed that the rs2227481 C>T polymorphism was significantly associated with a reduced risk of liver, lung, and gastric cancer. The interesting question is why rs2227481 affects individual susceptibility to cancer. In this study, we examined the IL22 mRNA levels in clinical liver, lung, and gastric cancer tissue samples with different rs2227481 genotypes and found that IL22 was upregulated in CC samples compared to combined CT and TT samples (Figure 1A–C). These results suggest that maintenance of an inadequate amount of IL22 mRNA may promote the development of liver, lung, and gastric cancers. Evidence from in vitro studies and xenograft models strongly supports our hypothesis. Tumor-infiltrating cells of hepatocellular carcinoma (HCC) are enriched in IL22+ cells, and IL22 expression is positively correlated with the progression and staging of HCC[6]. Similarly, IL22 was found to be elevated in lung cancer tissues compared to matched peritumoral tissues, and overexpression of IL22 protected lung cancer cell lines from serum starvation-induced and chemotherapeutic drug-induced apoptosis[7]. Of note, IL22 is a more unambiguously pro-tumor cytokine in gastric cancer. Gastric cancer patients had higher circulating frequencies of IL22-producing T cells compared to healthy controls, which positively correlated with tumor stage and negatively correlated with patient survival[8].
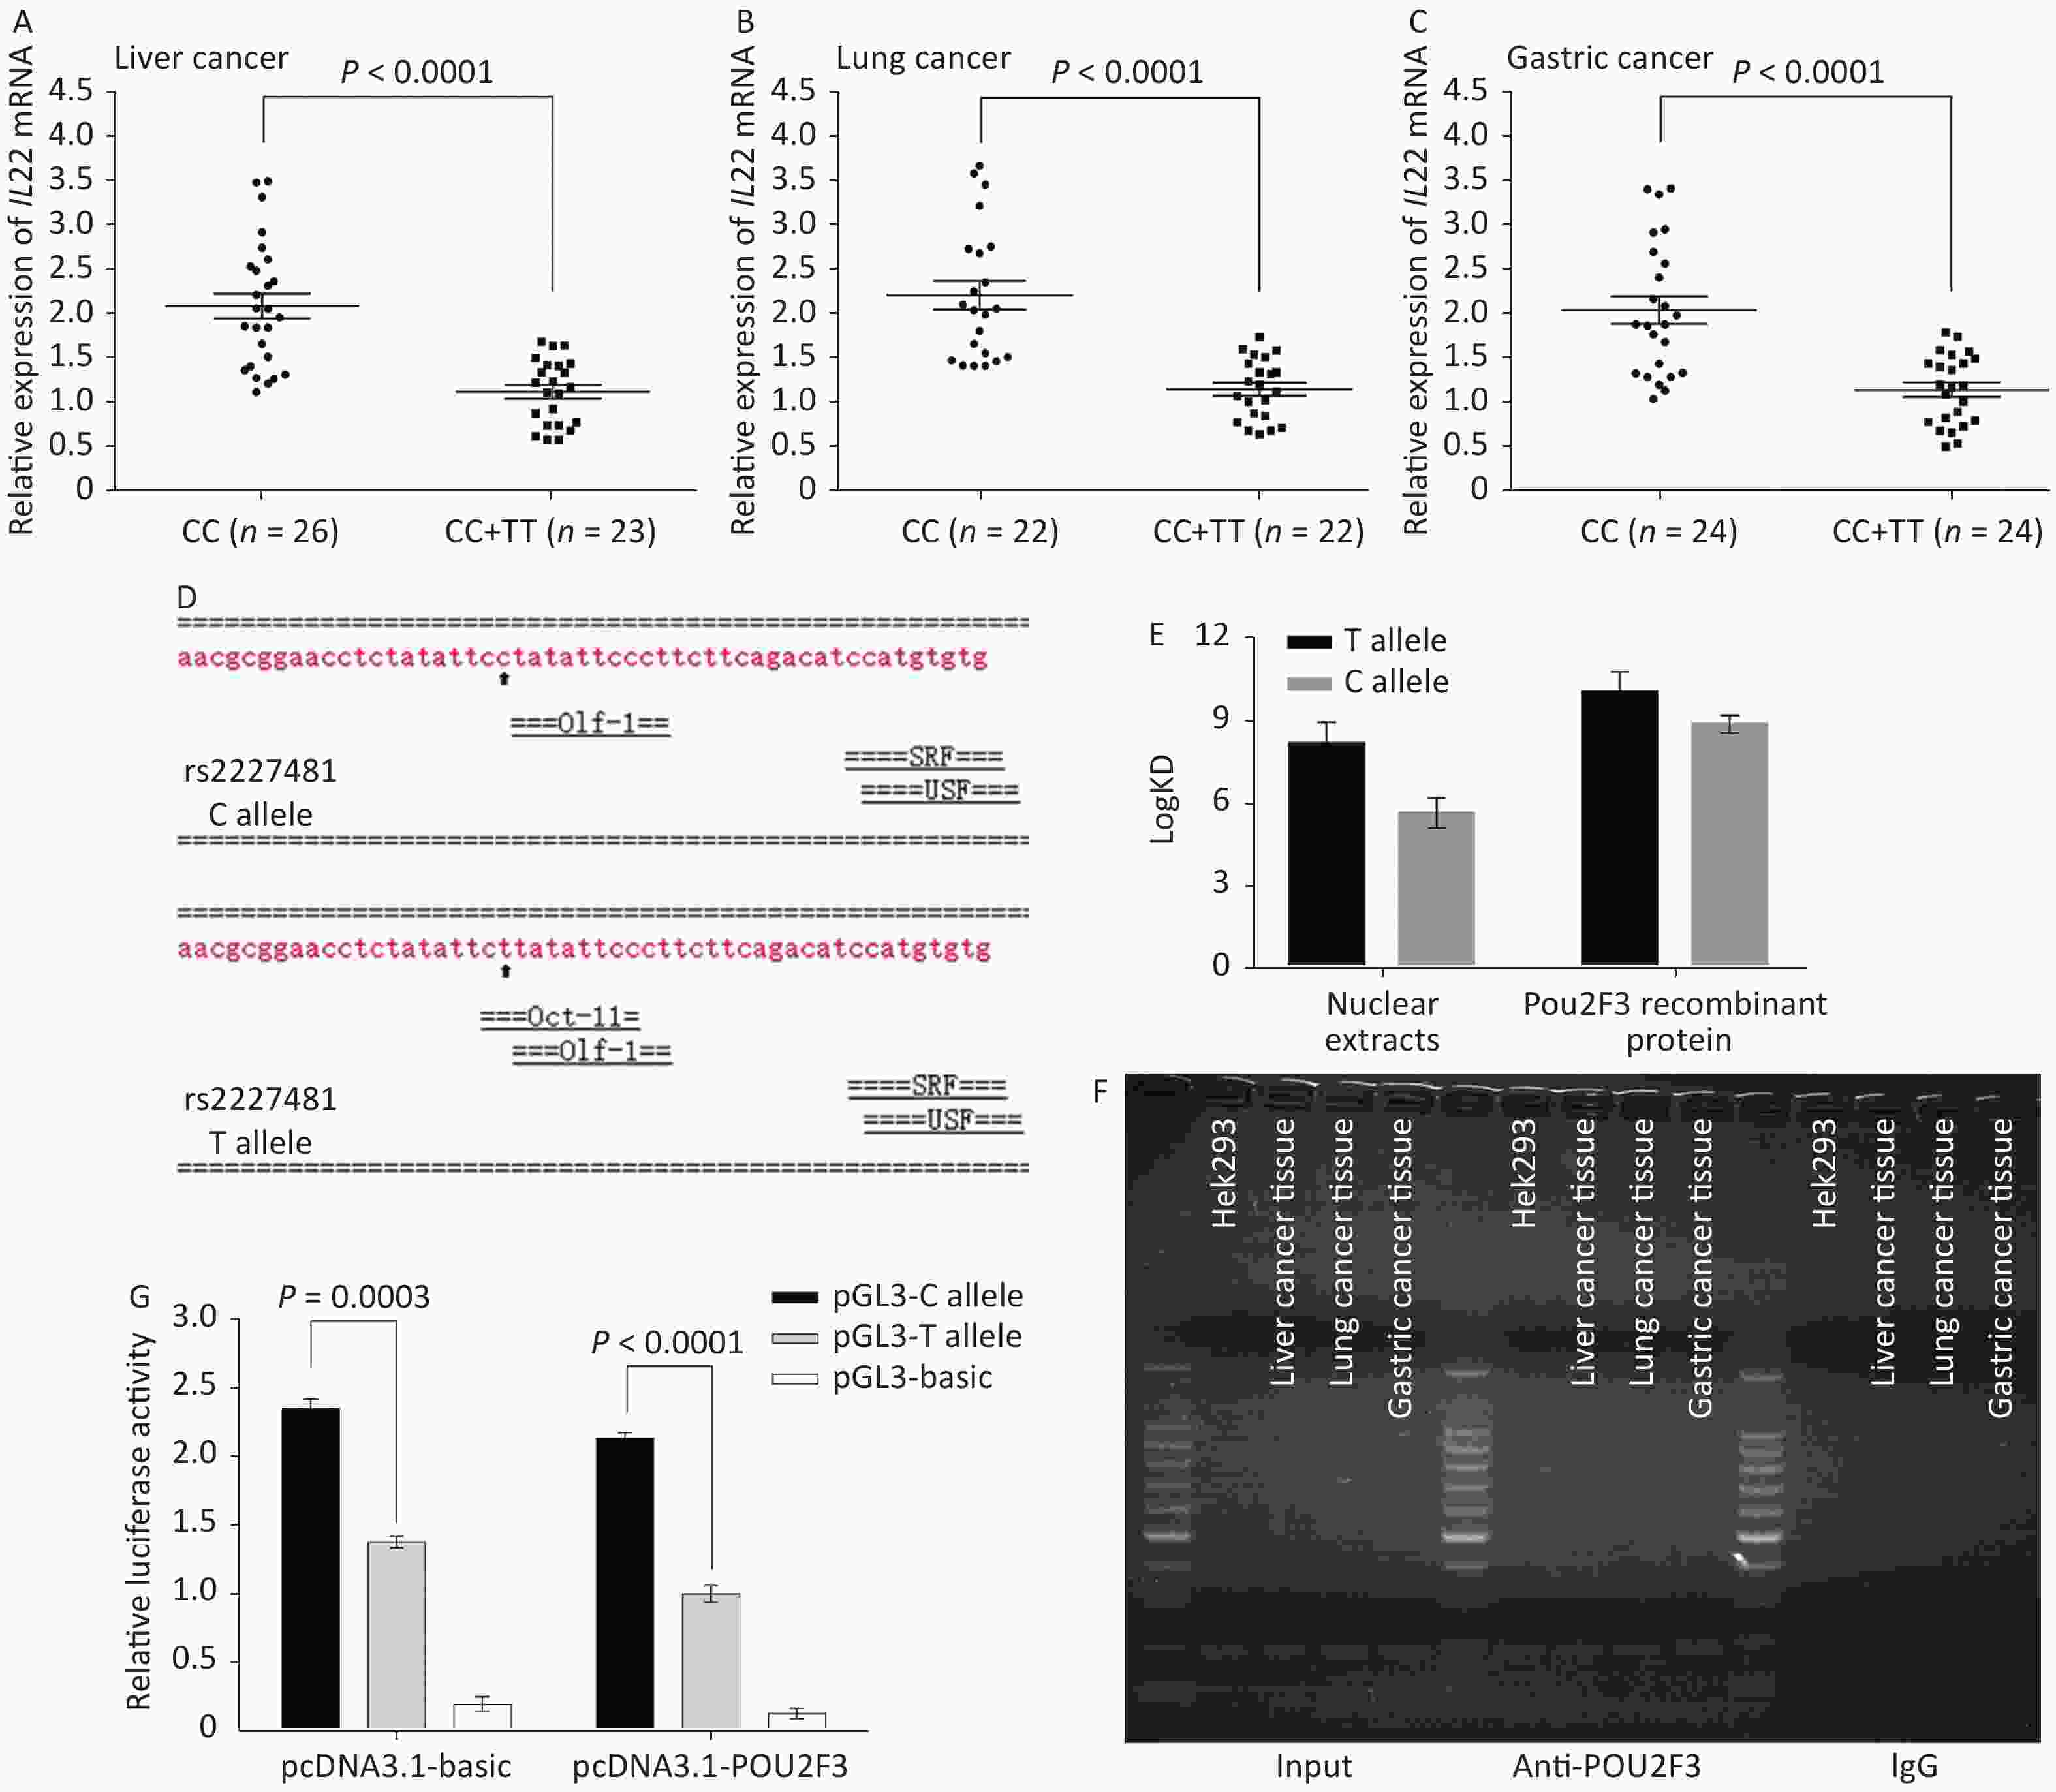
Figure 1. The rs2227481 C>T polymorphism decreases IL22 gene expression by increasing the binding affinity of the transcription repressor POU2F3. Quantitative real-time RT-PCR analysis of in vivo IL22 mRNA levels in 49 liver cancer tissue samples (A), 44 lung cancer tissue samples (B), and 48 gastric cancer tissue samples (C) with different genotypes. (D) Bioinformatics analysis predicted transcription factors for the rs2227481 C>T polymorphism. (E) SPR analysis comparing the binding affinity of HEK293 nuclear extracts or POU2F3 recombinant protein to DNA probes containing either the rs2227481 T or C alleles. (F) ChIP assays using HEK293 cells and one liver cancer tissue sample. The presence of POU2F3 binding to IL22 gene promoter was verified by PCR. (G) A luciferase construct containing either the C or T allele of rs2227481 was co-transfected with pcDNA3.1-basic vector or pcDNA3.1-POU2F3 expression vector in HEK293 cells.
Next, we used the Alibaba2 software to predict that the rs2227481 C>T polymorphism creates a transcription factor binding site for POU2F3 (Oct-11) (Figure 1D). POU2F3, a member of the POU domain family, acts to both stimulate and repress transcription in a general and cell type-specific mode[9]. Interestingly, the SPR analysis revealed that, compared with the C allele oligonucleotide probe, the T allele oligonucleotide probe had a higher binding affinity to HEK293 nuclear proteins or purified recombinant POU2F3 protein (Figure 1E). Moreover, the ChIP assay results demonstrated that the IL22 promoter fragment with the rs2227481 site was occupied by POU2F3 (Figure 1F). The co-transfection experiment showed that ectopic POU2F3 expression generally decreased the luciferase activities of the plasmids containing the rs2227481 C allele or T allele, and the rs2227481 polymorphism amplified the promoter function disparity (Figure 1G). Taken together, our results demonstrate that POU2F3 acts as a transcription repressor of the IL22 gene, and compared with the C allele, the rs2227481 T allele increases the binding affinity of POU2F3 to the IL22 gene promoter, which finally contributes to the decreased IL22 expression level, thereby reducing cancer susceptibility.
The present study is the first to demonstrate a significant association between the IL22 rs2227481 C>T polymorphism and a reduced risk of liver, lung, and gastric cancer in a Han Chinese population. Meanwhile, it was also revealed that the IL22 gene rs2227481 C>T polymorphism decreases IL22 expression by increasing the binding affinity of the transcriptional suppressor POU2F3. Our findings emphasize and reinforce the role of IL22 in the carcinogenesis of liver, lung, and gastric cancer, and the results reported here may initiate a novel strategy for the prediction and prevention of liver, lung, and gastric cancer. However, further confirmatory studies with cohort expansion are needed in other ethnic groups and Chinese populations from other regions.
The authors declare that there are no conflicts of interest.
HTML
Reference

 Quick Links
 DownLoad: