


-
Aquatic products can provide meat with low fat and energy and plenty of protein and vitamins[1, 2] and have received increasing demand in China, for consumption[3]. Heavy metals — such as Pb, Cd, Hg, and metalloid As — are widely distributed throughout the Earth’s crust. Although arsenic is a non-metallic element, its source and potential for harm are similar to heavy metals and thus it is usually listed as a heavy metal. Some of these substances may occur naturally in the environment but, increasingly, pollution sources from industries or transportation account for an important proportion. These heavy metals can find their way into the food chain and pose serious threats to consumers’ health[2]. Aquatic products often have higher occurrences of Pb, Cd, Hg, and As due to water pollution and bioaccumulation. Therefore, heavy metal contamination in aquatic products is a common food safety issue across the world and is commonly monitored by many countries.
Studies have shown that Pb, Cd, Hg (especially the methyl form)[4], and As (especially the inorganic form)[5] can cause multisystem damage to humans; in particular, neurotoxicity and nephrotoxicity[5,6]. However, inorganic Hg (iHg) can cause more serious kidney damage than methyl Hg (MeHg). The nervous system damage from these heavy metals is mainly IQ (intelligence quotient) reduction or cognitive impairment. Studies also demonstrated that the four heavy metals had potential nephrotoxicity. They can damage renal tubules[7, 8, 9] and may affect the filtration ability of the nephrons, damaging the function of tubules and other kidney functions[10].
Most studies on food safety risk assessment have focused on the risk of single chemical exposure. However, in real life, humans are usually simultaneously exposed to a variety of chemicals through food and the environment. These chemicals may interact through a variety of mechanisms and lead to an increased or reduced cumulative risk to health. Therefore, joint effects need to be considered when conducting exposure assessment. However, studies on cumulative risk assessment of harmful heavy metals are limited [11]. In this study, the cumulative exposure of the Chinese population to Pb, Cd, Hg, and iAs in aquatic products was estimated via a relative potency factor approach.
Cumulative risk assessment is a comprehensive assessment of the overall health effects or risks of simultaneous exposure to different chemicals. However, the lack of toxicological data has slowed the development and wider use of cumulative assessment methods. Although the exact mechanisms of the adverse health effects are still unclear, they are probably similar among heavy metals as they affect the same cellular processes[11]. EFSA suggested that if the mechanisms of action were unclear but the compounds could cause harm to the same system or organ, these compounds should also be evaluated for cumulative risk based on the assumption of dose addition[12].
The relative potential factor (RPF) method is an accumulative assessment method based on dose addition. In the RPF method, one chemical is used as an indicator chemical (IC) and the critical effect dose of other chemicals is compared with that of the indicator to obtain a relative efficacy factor of the target chemical, thus standardizing the exposure of each chemical and obtaining the relative indication. The total exposure of chemicals is then compared with the health guidance value of the indicator chemical to characterize risk. Indicator chemicals are usually the better-studied chemicals in the same group, which have a large amount of available toxicity information and the lowest uncertainty coefficient[13]. The theoretical basis of the RPF method is that all chemicals have the same action mechanism [13]. This method has been predominantly used in the cumulative assessment of pesticide residues[14, 15], but in a recent study, has also been used in the cumulative assessment of heavy metals[11]. Considering that the mechanisms of Pb, Cd, Hg, and iAs on neurotoxicity and nephrotoxicity are similar, we estimated the cumulative exposure of Chinese people to these heavy metals through aquatic products via the RPF method for the two toxicology aspects, providing a more comprehensive characterization of the health risks caused by cumulative exposure to heavy metals.
-
Food Selection The concentration data of Pb, Cd, Hg, and As in aquatic products were obtained from the China national food contamination monitoring program during 2013–2017. Aquatic products were categorized into 12 groups, including freshwater shrimps, freshwater crabs, seawater shrimps, seawater crabs, cephalopods, bivalves, gastropods, carnivorous fish, non-carnivorous fish, dried aquatic products, cooked aquatic products, and canned aquatic products. All food samples were collected from retail stores, supermarkets, grocery stores, wholesale markets, and restaurants via a multistage stratified random sampling method from all 31 provinces of China.
-
All samples were crushed and homogenized and subsequently analyzed using atomic absorption spectrometry (AAS) or inductively coupled plasma-mass spectrometry (ICP-MS) techniques by qualified regional laboratories of the local Center for Disease Prevention and Control (CDC). The data obtained by both analysis methods were sufficiently accurate for risk assessment and all analyses followed the standard operating procedure (SOP) verified by the organizer. In brief, 1.0 g (accurate to 0.0001 g) of the sample was accurately weighed into the high-pressure digestion tank, 5 mL HMO3 was added, and the blank experiment was simultaneously performed. The acid was dried at 100 °C via the acid drying device until a large amount of yellow smoke was exhausted, the outer tank was screwed and digested at 100 °C for 2 h, 140 °C for 2 h, and 160 °C for 2 h. After digestion, the digested liquid was fed with acid at 100 °C until the liquid was less than 1 mL. After attaining a constant volume, the digested liquid was determined according to the SOP.
Uniform quality controls are given by the organizer of the national monitoring program. Each laboratory was required to comply with the demands of quality control, including simultaneous analysis of certified reference material with samples. All data were finally sent to the organizer and rechecked before they could be used.
-
Conversion factors were used to deduce iAs from the total As data and to deduce MeHg or iHg levels from the total Hg data. According to a Joint FAO/WHO Expert Committee on Food Additives (JECFA) report, the conversion factors for total As to iAs in freshwater fish and seafood range from 2%–4%[5]. To be conservative, we chose 4% for all aquatic products. To assess dietary exposure to methyl mercury, it was assumed that the methyl mercury accounted for 80% of the total Hg in crustaceans, mollusks, and amphibians, and 100% for other food categories[16]. Otherwise, we conservatively chose 30% for all aquatic products to assess iHg in nephrotoxicity[4].
-
The consumption data of aquatic products by Chinese inhabitants were derived from the China National Food Consumption Survey conducted in 2014, using a 24-h recall method to construct a food diary over three inconsecutive days. A total of 25,847 respondents were obtained by stratified random sampling, including 12,546 males and 13,301 females, aged 2 years and above. Sample sizes for different age groups are presented in Table 1. Respondents were asked to recall all of the food they ate out and at home within 24 h and to record the weight of the consumed food. The aquatic product consumption data were classified into 12 food categories to match the 12 food categories for contaminant data.
Years Number of
peopleMean (± SD) exposure, μg−1·(kg·bw)−1 per day High exposure (P95), μg−1·(kg·bw)−1 per day Pb Cd MeHg iHg iAs Pb Cd MeHg iHg iAs 2–6 1,239 0.080 ± 0.125 0.090 ± 0.31 0.190 ± 0.298 0.006 ± 0.010 0.020 ± 0.054 0.300 0.561 0.730 0.024 0.111 7–17 2,942 0.050 ± 0.090 0.070 ± 0.260 0.130 ± 0.229 0.004 ± 0.008 0.020 ± 0.049 0.230 0.421 0.571 0.018 0.080 18–40 7,971 0.050 ± 0.072 0.070 ± 0.200 0.120 ± 0.182 0.004 ± 0.006 0.020 ± 0.039 0.190 0.432 0.461 0.015 0.080 41–65 11,520 0.050 ± 0.065 0.060 ± 0.180 0.120 ± 0.166 0.004 ± 0.005 0.010 ± 0.034 0.170 0.390 0.430 0.014 0.070 > 65 2,175 0.040 ± 0.058 0.050 ± 0.170 0.090 ± 0.141 0.003 ± 0.005 0.010 ± 0.032 0.130 0.271 0.351 0.012 0.051 Overall
population25,847 0.050 ± 0.082 0.060 ± 0.230 0.120 ± 0.202 0.004 ± 0.006 0.010 ± 0.041 0.190 0.411 0.461 0.015 0.080 Table 1. Estimated exposure to Pb, Cd, Hg, and iAs in aquatic products of different age groups in China[17]
-
Single Heavy Metal Risk Assessment The exposures of single heavy metals via aquatic products have been obtained in our previous study [17]. The results, with some supplementary data, are presented in Tables 1 and 2[17]. A simple distribution assessment model, which is a semi-probabilistic method, was used for the exposure assessment. The average heavy metal content in aquatic products was multiplied by the consumption of various aquatic products of a single individual and divided by the bodyweight of each individual to obtain the individual distribution of heavy metal exposure in aquatic products.
Food
categoryMean (± SD) exposure, μg−1·(kg·bw)−1 per day High exposure (P95), μg−1·(kg·bw)−1 per day iAs Cd MeHg iHg Pb iAs Cd MeHg iHg Pb Freshwater
shrimps2.710 × 10−5 ± 0.000 6.672 × 10⁻⁴ ± 0.004 1.490 × 10⁻³ ± 0.000 7.758 × 10⁻⁵ ± 0.004 7.130 × 10⁻⁴ ± 0.004 0.000 0.000 0.000 0.000 0.000 Freshwater
crabs5.120 × 10−5 ± 0.000 1.000 × 10⁻³ ± 0.012 1.980 × 10⁻³ ± 0.003 7.740 × 10⁻⁵ ± 0.001 5.840 × 10⁻⁴ ± 0.007 0.000 0.000 0.000 0.000 0.000 Seawater
shrimps1.270 × 10−3 ± 0.005 3.620 × 10⁻³ ± 0.014 6.771 × 10⁻³ ± 0.004 3.601 × 10⁻⁴ ± 0.001 3.681 × 10⁻³ ± 0.015 9.659 × 10⁻³ 8.280 × 10⁻¹ 5.151 × 10⁻² 2.740 × 10⁻³ 2.805 × 10⁻² Seawater
crabs7.031 × 10−3 ± 0.032 3.891 × 10⁻² ± 0.180 1.090 × 10⁻² ± 0.007 2.190 × 10⁻⁴ ± 0.001 4.100 × 10⁻³ ± 0.019 5.331 × 10⁻² 8.861 × 100 8.291 × 10⁻² 1.661 × 10⁻³ 3.110 × 10⁻² Cephalopods 2.200 × 10⁻⁴ ± 0.000 1.000 × 10⁻³ ± 0.023 3.920 × 10⁻⁴ ± 0.001 3.160 × 10⁻⁶ ± 0.000 2.020 × 10⁻⁴ ± 0.006 0.000 0.000 0.000 0.000 0.000 Bivalves 4.270 × 10⁻⁴ ± 0.000 8.670 × 10⁻³ ± 0.065 2.470 × 10⁻³ ± 0.003 3.752 × 10⁻⁵ ± 0.000 3.560 × 10⁻³ ± 0.026 0.000 0.000 0.000 0.000 0.000 Gastropods 2.200 × 10⁻⁴ ± 0.000 2.000 × 10⁻³ ± 0.018 5.410 × 10⁻⁴ ± 0.001 2.080 × 10⁻⁶ ± 0.000 5.050 × 10⁻⁴ ± 0.003 0.000 0.000 0.000 0.000 0.000 Carnivorous
fish2.660 × 10−3 ± 0.006 5.300 × 10⁻³ ± 0.012 5.380 × 10⁻² ± 0.017 2.261 × 10⁻³ ± 0.005 1.921 × 10⁻² ± 0.043 1.291 × 10⁻² 7.711 × 10⁻¹ 2.611 × 10⁻¹ 1.101 × 10⁻² 9.312 × 10⁻² Non-carnivorous
fish7.340 × 10−4 ± 0.000 2.000 × 10⁻³ ± 0.042 3.070 × 10⁻² ± 0.010 9.570 × 10⁻⁴ ± 0.002 2.000 × 10⁻² ± 0.033 0.000 2.900 × 10⁻¹ 1.601 × 10⁻¹ 0.000 8.001 Dried aquatic
products7.330 × 10−4 ± 0.000 6.670 × 10⁻⁴ ± 0.010 1.420 × 10⁻³ ± 0.002 2.607 × 10⁻⁶ ± 0.000 5.36 × 10⁻⁴ ± 0.007 0.000 0.000 0.000 0.000 0.000 Cooked aquatic
products4.520 × 10−4 ± 0.000 1.330 × 10⁻³ ± 0.009 1.120 × 10⁻² ± 0.011 3.010 × 10⁻⁵ ± 0.000 2.080 × 10⁻³ ± 0.014 0.000 0.000 0.000 0.000 0.000 Canned aquatic
products0.000 8.92 × 10⁻⁴ ± 0.078 2.090 × 10⁻⁵ ± 0.000 7.725 × 10⁻⁸ ± 0.000 1.030 × 10⁻⁵ ± 0.001 0.000 0.000 0.000 0.000 0.000 Note. iAs is Inorganic arsenic. Cd is cadmium. Pb is lead. MeHg is Methylmercury. Table 2. Exposure of Pb, Cd, Hg, and iAs to different kinds of aquatic products[17]
-
The cumulative exposures of iAs, Cd, Hg, and Pb in aquatic products were estimated using the RPF model[15]. RPF was used to calibrate the exposure of each of the four heavy metals based on one indicator chemical:
$${\rm{Ex}}{{\rm{p}}_{{\rm{cum}}}} = \sum\limits_{i = 1}^n {Ex{p_i}} \times RP{F_i}$$ where Expcum denotes cumulative exposure of Pb, Cd, Hg, and iAs μg−1·(kg·bw)−1 per day. Expi denoted the exposure of one of the four heavy metals μg−1·(kg·bw)−1 per day. RPFi is the relative potency factor of the corresponding heavy metal. Expi used the data listed in Table 1 and Table 2; mean exposure and high exposure represented the exposure for the average food consumers and high percentile (P95) food consumers, respectively.
RPFs were calculated by comparing the No Observed Adverse Effect Level (NOAEL) or lower confidence limit of benchmark doses (BMDL) on the neurotoxicity or nephrotoxicity of a specific metal to that of an index metal. Corresponding dose-response relationships on neurotoxicity and nephrotoxicity of the four heavy metals have been reported in many studies [6, 7, 18]. If human data were available, the relative potency factors were calculated by comparing the derived BMDL directly. In the absence of human values, NOAEL or BMDL derived from animal experiment data were used. An uncertainty factor of 100 was used for animal-to-human conversion[11]. The NOAEL values have always been considered equal to BMDL values, although they have some slight differences[7].
-
In this study, we adopted the RPFs derived in the study by Johanna Suomi, with small modifications for iAs to improve their suitability for the Chinese population[11]. The RPF results of neurotoxicity and nephrotoxicity are presented in Tables 3 and 4, respectively. For neurotoxicity, Pb was chosen as the IC because its toxicology data were derived from a population epidemiological survey[12] and its neurotoxicity potential was highest among the four heavy metals. The RPF of Pb was set as 1 and the RPFs of the other three heavy metals were set according to their toxic potentials, indicated by their dose-response values. The toxicological data of iAs was determined according to the Chinese people and thus we did not use uncertainty factors for the variability in humans. Based on the same principle, the RPF values for nephrotoxicity were established. Cd, which had the highest nephrotoxicity potential, was set as the IC, and the RPFs were set according to their relative toxic potentials.
Compound Type of value Adverse effect Uncertainty factor Value, μg−1·(kg·bw)−1 per day RPF Pb BMDL01, human Intelligence decrease 1 0.5 1 Cd NOAEL, rats Increased passive avoidance 100* 2 0.25 MeHg BMDL05, human Intelligence decrease 1 1.2 0.42 iAs NOAEL, human numbness of the extremities 1 30 0.02 Note. *Animal-to-human conversion uncertain factor of 10 was used, the other uncertain factor[11] of 10 was used to compensate for the short duration of the research. BMDL01 is a 1% benchmark response rate, a point of departure value. BMDL05 is a 5% benchmark response rate, a point of departure. #RPF means relative potential factor. NOAEL is No Observed Adverse Effect Level. Table 3. RPF# values of four heavy metals for neurotoxicity
Compound Type of value Studied endpoint Uncertainty factor Value, μg−1·(kg·bw)−1 per day RPF Pb BMDL10, human Filtration rate of nephrons 1 0.63 0.646 Cd BMDL10, human Beta-2-microglobuline in urine 1 0.41 1.000 iHg NOAEL, rat Rat kidney weight 10* 6 0.068 iAs BMDL10, human Beta-2-microglobuline in urine 1 50 0.00828 Note. *An animal-to-human conversion uncertain factor of 10 was used[11]. BMDL10 is a 10% benchmark response rate, a point of departure. NOAEL is No Observed Adverse Effect Level. #RPF means relative potential factor. Table 4. RPF# values of four heavy metals for nephrotoxicity
-
The health guidance values of the four heavy metals have been re-evaluated since 2009 by JECFA or EFSA. A provisional tolerable monthly intake (PTMI) of 25 μg/kg bw for Cd was established based on renal toxicity[19]. The risk should be of concern if the exposure exceeded the PTMI. At present, no PTMI could be derived for Pb and hence a BMDL01 of 0.5 μg/kg bw was adopted for risk assessment of Pb based on its developmental neurotoxicity[18]. The margin of exposure (MOE) method should be used in this situation. In the cumulative assessment, the MOE method was used for neurotoxicity evaluation, by which the BMDL01 of Pb as an IC was divided by the estimated daily cumulative exposure (Expcum) of the four heavy metals. The risk should be of concern if the MOE values were lower than 1. The ratio of the estimated cumulative exposure to the PTMI (divided by 30 to convert to daily value) of Cd was used to evaluate the health risk of nephrotoxicity. The risk should be of concern if the ratio exceeded 100%.
-
The average detection rates of Pb, Cd, Hg, and As were 66.17%, 80.74%, 81.32%, and 80.37%, respectively. According to the WHO guidelines[20], concentration data less below the limit of detection (LOD) were calculated by 1/2 LOD. Estimation of cumulative exposure to the studied heavy metals and their percentile distribution were performed using the statistical software SPSS 17.0 (Inc., Chicago, IL, USA) and EXCEL.
-
Based on the respective RPFs for neurotoxicity and nephrotoxicity, the cumulative exposures of Pb, Cd, Hg (MeHg for neurotoxicity and iHg for nephrotoxicity), and iAs in different aquatic products were calculated. The results demonstrated that carnivorous fish, non-carnivorous fish, and seawater crabs were the top three food for on mean cumulative exposure, both for neurotoxicity and nephrotoxicity; however, seawater crabs ranked first, with a cumulative exposure of 0.0416 μg/kg bw for nephrotoxicity, compared to their rank of third for neurotoxicity, with a cumulative exposure of 0.0146 μg/kg bw (Table 5).
Food category N Neurotoxicity Nephrotoxicity Mean (± SD),
μg−1·(kg·bw)−1 per dayP95,
μg−1·(kg·bw)−1 per dayMean (± SD),
μg−1·(kg·bw)−1 per dayP95,
μg−1·(kg·bw)−1 per dayFreshwater shrimps 4,526 1.67 × 10⁻⁴ ± 0.0079 0.00 6.67 × 10⁻⁴ ± 0.0079 0.00 Freshwater crabs 3,195 2.50 × 10⁻⁴ ± 0.011 0.00 1.00 × 10⁻³ ± 0.016 0.00 Seawater shrimps 3,993 5.02 × 10⁻³ ± 0.020 3.82 × 10⁻² 6.02 × 10⁻³ ± 0.024 8.46 × 10⁻¹ Seawater crabs 2,919 1.46 × 10⁻² ± 0.068 1.11 × 10⁻¹ 4.16 × 10⁻² ± 0.19 8.88 Cephalopods 2,262 2.17 × 10⁻³ ± 0.012 0.00 1.00 × 10⁻³ ± 0.027 0.00 Bivalves 489 5.00 × 10⁻⁴ ± 0.044 0.00 8.67 × 10⁻³ ± 0.082 0.00 Gastropods 1,239 2.50 × 10⁻⁴ ± 0.008 0.00 2.00 × 10⁻³ ± 0.020 0.00 Carnivorous fish 6,739 2.38 × 10⁻² ± 0.053 1.15 × 10⁻¹ 1.78 × 10⁻² ± 0.040 8.32 × 10⁻¹ Non-carnivorous fish 4,723 2.23 × 10⁻² ± 0.048 9.19 × 10⁻² 1.49 × 10⁻² ± 0.063 3.42 × 10⁻¹ Dried aquatic products 481 1.67 × 10⁻⁴ ± 0.010 0.00 6.67 × 10⁻⁴ ± 0.014 0.00 Cooked aquatic products 302 9.29 × 10⁻⁴ ± 0.021 0.00 1.33 × 10⁻³ ± 0.018 0.00 Canned aquatic products 354 6.36 × 10⁻⁵ ± 0.0018 0.00 8.99 × 10⁻⁴ ± 0.0036 0.00 Table 5. Cumulative exposure levels of Pb, Cd, Hg, and iAs in different aquatic products for neurotoxicity and nephrotoxicity
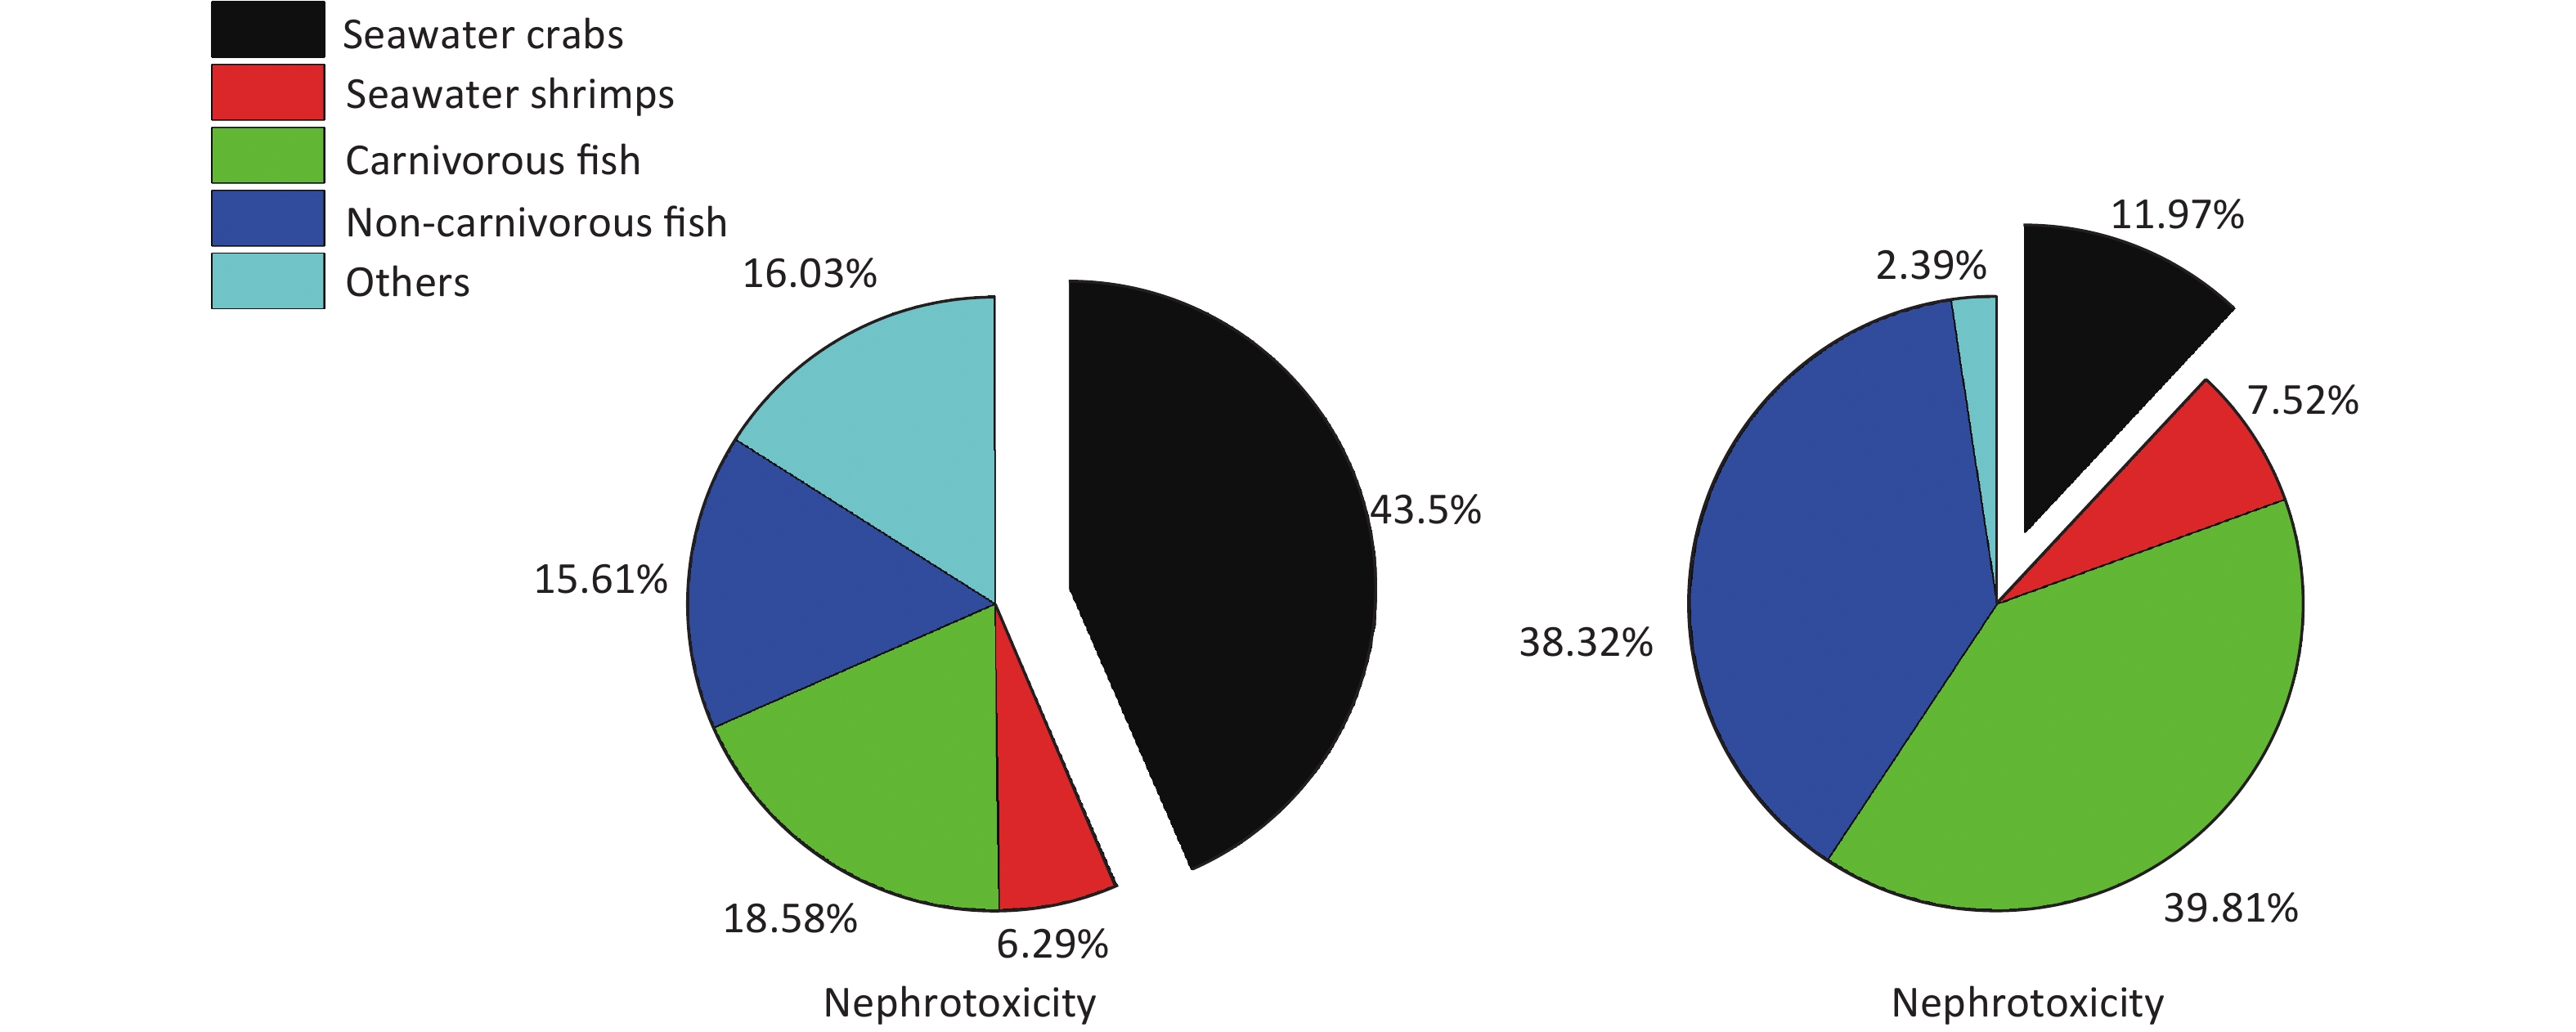
As shown in Figure 1, carnivorous fish, non-carnivorous fish, and seawater crabs accounted for nearly 90% of the cumulative exposure of Pb, Cd, Hg, and iAs from aquatic products for neurotoxicity and approximately 78% for nephrotoxicity. Meanwhile, the contributions from carnivorous fish and non-carnivorous fish for neurotoxicity (78.13%) were far higher than those for nephrotoxicity (34.2%). Fish were the main source of cumulative exposure to neurotoxicity. Seawater crabs were the main source of cumulative exposure to nephrotoxicity.

Figure 1. Contributions of iAs, Cd, Hg, and Pb to cumulative exposure in different aquatic products to nephrotoxicity and neurotoxicity
Tables 6 and 7 present the cumulative exposures at different age groups. The exposures of the youngest population group (2–6 years) were the highest among all of the subgroups, regardless of whether they were neurotoxic or nephrotoxic.
Population group (years) Mean exposure High exposure (P95) Cumulative amount (± SD),
μg−1·(kg·bw)−1 per dayMOE* Cumulative amount,
μg−1·(kg·bw)−1 per dayMOE 2–6 0.11 ± 2.49 4.35 0.49 1.03 7–17 0.08 ± 2.13 6.17 0.44 1.13 18–40 0.08 ± 1.64 6.62 0.44 1.14 41–65 0.07 ± 1.48 7.16 0.42 1.18 > 65 0.05 ± 1.40 9.13 0.39 1.28 Overall population 0.07 ± 1.82 6.77 0.43 1.16 Note. *MOE means the margin of exposure. Table 6. Cumulative exposure of four heavy metals (mean and P95) in aquatic products in different age groups and comparison with their benchmark doses for neurotoxicity
Population group (years) Mean exposure High exposure (P95) Cumulative amount,
μg−1·(kg·bw)−1 per dayPTMI#/30(%) Cumulative amount,
μg−1·(kg·bw)−1 per dayPTMI/30 (%) 2–6 0.090 ± 0.31 17.55 0.76 91.24 7–17 0.002 ± 0.26 12.81 0.58 69.01 18–40 0.002 ± 0.20 12.29 0.56 66.93 41–65 0.002 ± 0.18 11.20 0.50 60.00 > 65 0.002 ± 0.17 8.77 0.36 42.78 Overall population 0.002 ± 0.23 11.76 0.53 63.85 Note. #PTMI means provisional tolerable monthly intake. Table 7. Cumulative exposure of four heavy metals (mean and P95) in aquatic products in different age groups and comparison with their health guidance values for nephrotoxicity
For neurotoxicity, the mean cumulative exposure levels of the studied heavy metals in different sub-population groups ranged from 0.05 to 0.11 μg−1·(kg·bw)−1 per day and the MOEs ranged from 9.13 to 4.35; high cumulative exposure levels ranged from 0.39 to 0.49 μg−1·(kg·bw)−1 per day and the corresponding MOEs ranged from 1.28 to 1.03. However, the MOEs of cumulative exposures for neurotoxicity in high-exposure populations, especially in the 2–6 year-old group, were close to 1 (Table 6).
For nephrotoxicity, the mean cumulative exposure levels of the studied heavy metals in different sub-population groups ranged from 0.09 to 0.16 μg−1·(kg·bw)−1 per day and accounted for 9.49% to 17.52% of the PTMI of Cd as an index chemical. The high cumulative exposure levels ranged from 0.36 to 0.76 μg−1·(kg·bw)−1 per day and accounted for 42.88% to 90.86% of the PTMI. Regarding neurotoxicity, the cumulative exposure in the 2–6 age group was very close to the PTMI, accounting for 90.21% of the total exposure (Table 7).
For neurotoxicity, Pb predominantly contributed to cumulative exposure (82%), followed by that of Hg (represented by MeHg) with 11.7%–12.4%. Cd contributed no more than 6% and iAs contributed less than 1%. As the majority contributor to the neurotoxic effect, limiting the exposure to Pb would have a much stronger effect on protecting consumers from nervous system damage by heavy metals.
Regarding nephrotoxicity, Cd was the main contributing factor to cumulative exposure. The contribution of Pb for the different age groups varied between 32.0% and 35.3% of the total exposure. The iAs and Hg (represented by iHg) comprised a minimal portion of the cumulative exposure. This could be a result of both the lower intake of these two heavy metals and the smaller RPF values. The mean exposures of the different population age groups to iAs or Hg are only approximately half of their exposures to Pb and Cd (Figure 2).
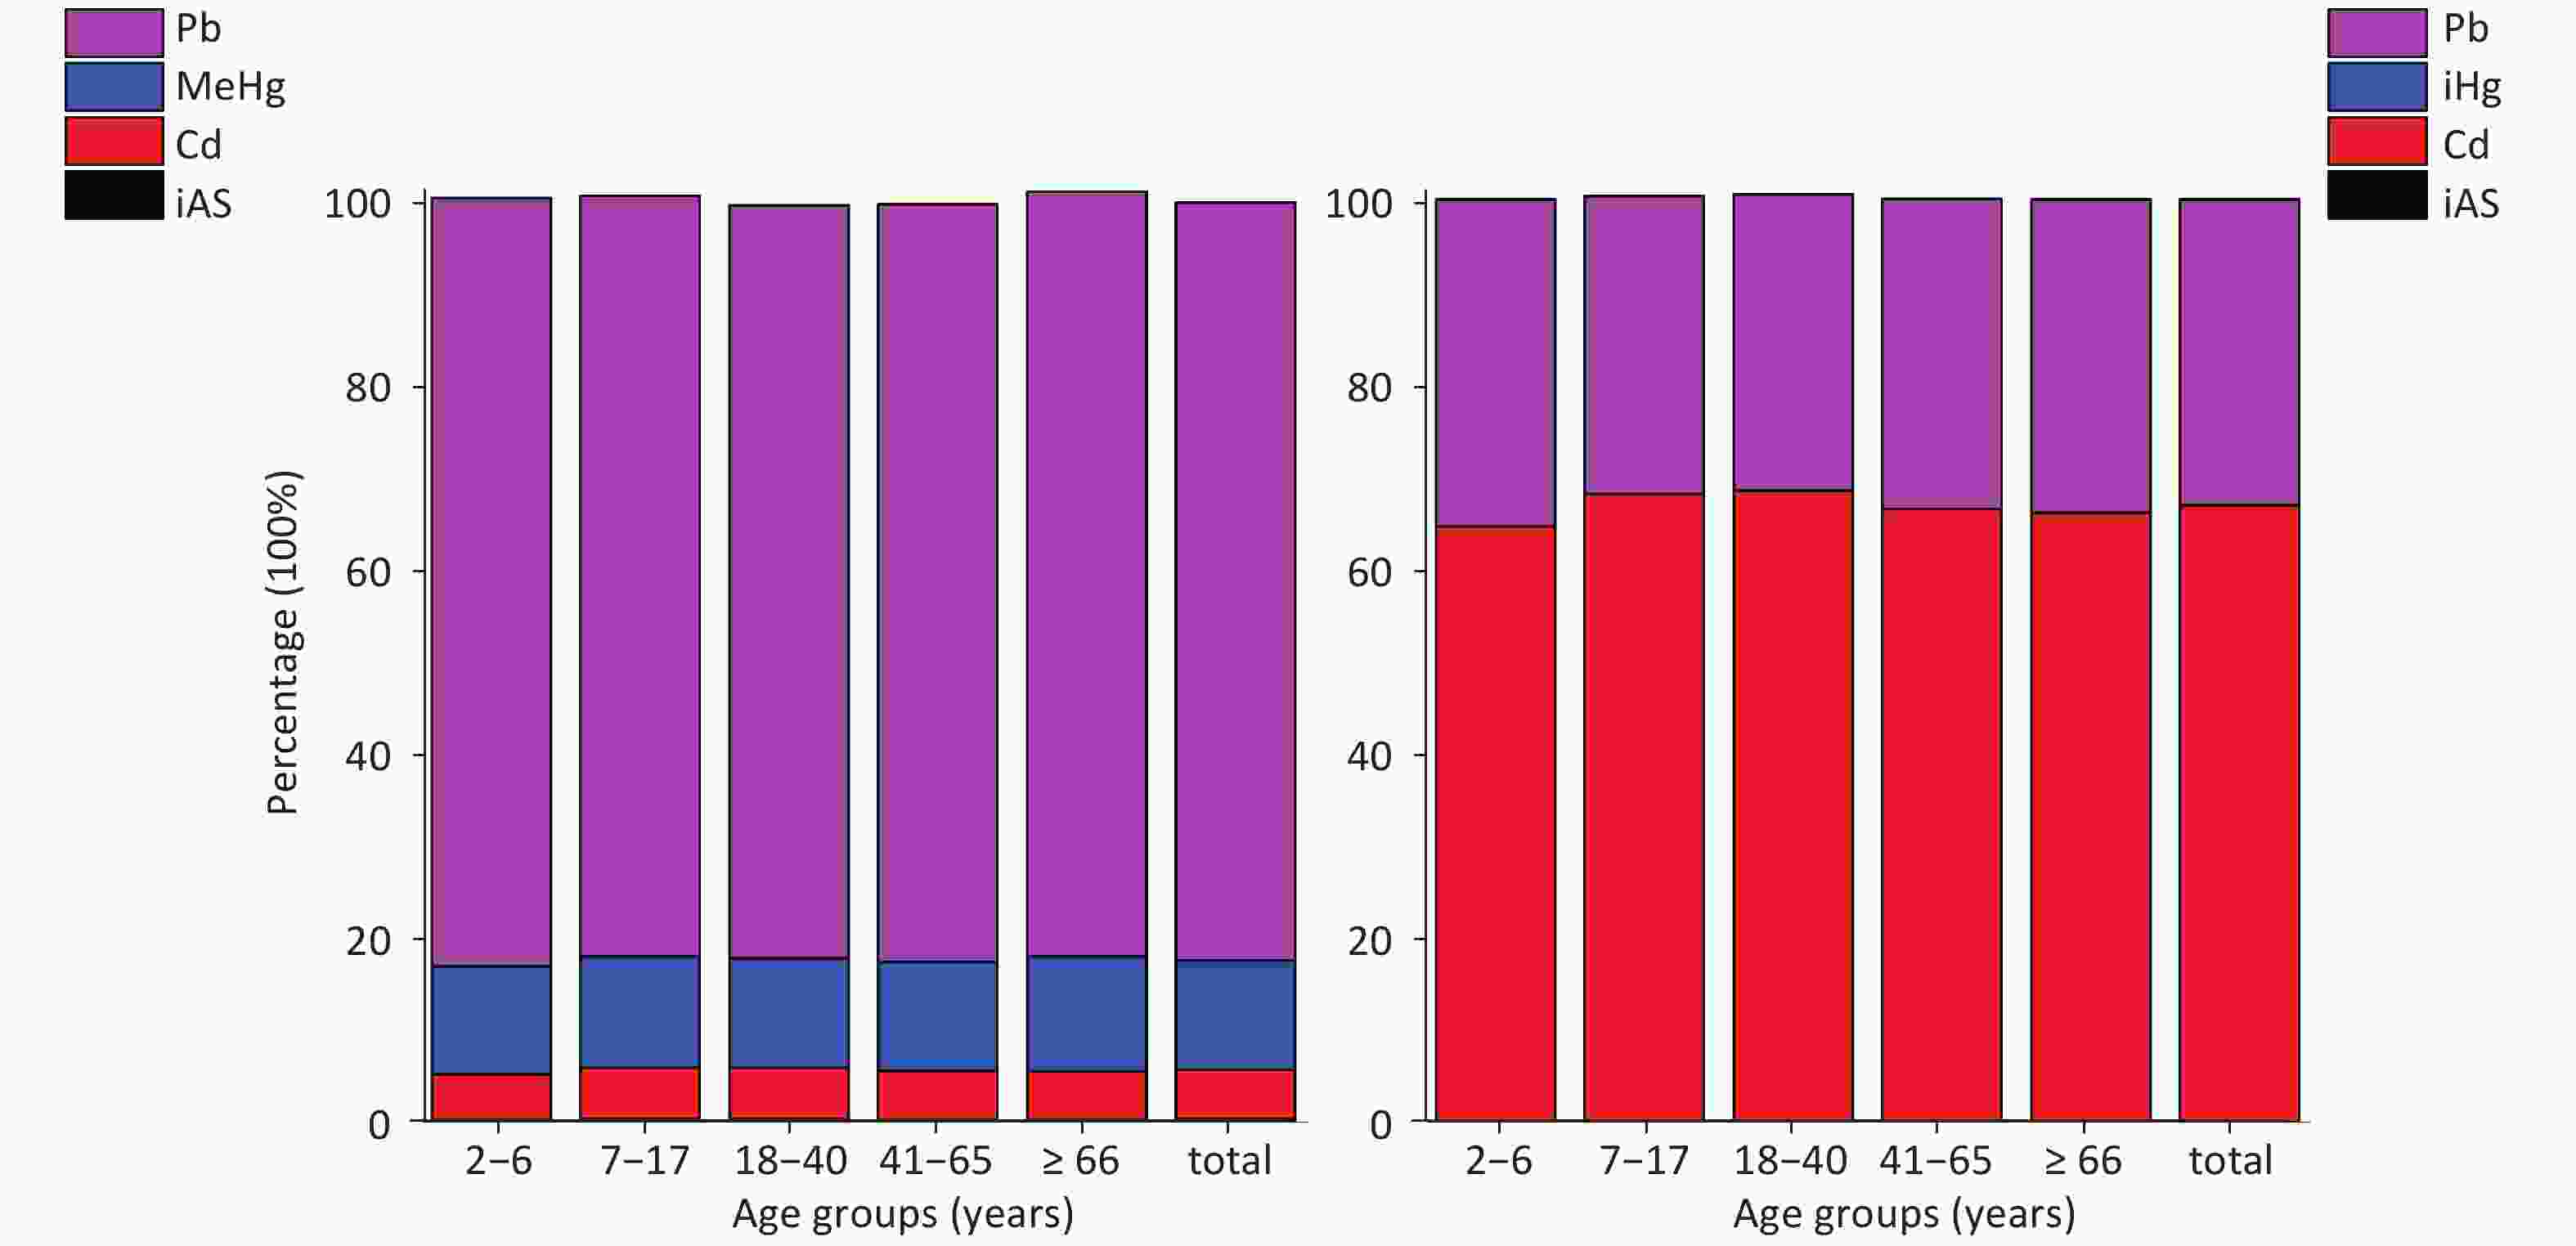
Figure 2. Contributions of heavy metals to neurotoxicity and nephrotoxicity in different population groups.
-
The cumulative risk of exposure to Pb, Cd, Hg, and iAs through aquatic products was assessed in this study. The results demonstrate that the cumulative exposures based on neurotoxicity are below the lower confidence limit on BMDL01, which acts as an index chemical, in both the general population and the high-exposure populations. The cumulative exposures based on nephrotoxicity are all lower than the provisional tolerable monthly intake (PTMI) of the index chemical Cd. However, for the 2–6 year-old group, the cumulative exposure is very close to the safety threshold value, regardless of neurotoxicity or nephrotoxicity. Compared to previous studies on the risk assessment for single metals in China[17,21,22], this study provided more details on the risk characterization of heavy metal exposure through ingestion of aquatic products.
However, studies on the cumulative risk assessment of these heavy metals via aquatic products are rare [11]. A recent study that probabilistically estimated the interactive hazard index (HIINT) of Pb, Cd, Hg, and iAs demonstrated that all 50th percentile HIINT estimates in all age populations for neurological and renal effects were lower than 1. However, the 97.5th percentile HIINTs had the potential to exceed 1. This study also demonstrated that toddlers and preschoolers had higher neurological risk than other age populations[23]. The results are similar to our study, which indicated a potential neurological risk in the younger population due to cumulative exposure to heavy metals.
Our study also demonstrated that the contaminant partner of heavy metals in seawater crabs was more likely to cause kidney damage and heavy metal contamination in fish was more likely to lead to nervous system damage. Most seawater fish are rich in healthy fatty acids, such as DHA, and hence the WHO still recommends that children eat a certain amount of seawater fish every week. Considering that the risk of cumulative exposure to heavy metals in common aquatic products is low, fish are still a safe and healthy food source for most of the Chinese population. However, the cumulative health risk should be of concern for a high number of consumers of a small amount of aquatic products, given that the cumulative exposure is very close to the BMDL01, and there are other dietary sources of these heavy metals.
To date, many methods have been developed to assess the cumulative risk of chemicals in food, such as the hazard index (HI), relative potency factor (RPF), reference point index (RPI), combined margin of exposure (MOET), cumulative risk index (CRI), and target-organ toxicity dose method (TTD)[24]. The HI method is a simple and quick method that is most commonly used in studies on cumulative exposure to heavy metals. However, the health guidance values that are needed are mostly not based on the same observation endpoint. The RPF method has already been well used in the cumulative assessment of pesticides. The toxicity of the same group of chemicals is standardized according to a selected indicator chemical and hence the RPF method is relatively transparent and accurate. The set of RPFs largely depends on the sufficiency of toxicological data of the chemicals and the choice of indicator chemical. The toxicology of Pb, Cd, Hg, and iAs has been studied for decades and there are plenty of inter-comparable dose-response data for heavy metals to set RPFs. Suomi et al. have tried to use RPF methods to make a preliminary assessment of the cumulative exposure to heavy metals among Finnish preschool children[11]. Although the RPF method is not necessarily better than the HI methods, studies have shown that if the same set of chemicals is estimated using the same endpoint, species, and uncertainty coefficient, the results will be the same [24].
Both the HI method and RPF method are based on the assumption of "dose addition" Although some studies have indicated that there may be a synergistic or antagonistic effect between different heavy metals [25, 26] and some methods that try to integrate the toxic interactions to improve assessment accuracy [23], there is still insufficient evidence of the interaction and it may result in more uncertainty from the more complex models. Now that the exact interaction effects are still far from clear, The Agency for Toxic Substances and Disease Registry (ATSDR) also suggested that dose addition is the most appropriate method for cumulative risk assessment of simultaneous exposure of chemicals with a similar toxic mechanism. Conversely, more efforts are needed to understand the interaction mechanisms between heavy metals and establish more accurate cumulative assessment methods.
-
The cumulative exposures of Pb, Cd, Hg, and iAs through aquatic products by the Chinese population were estimated to be lower than the corresponding safety threshold for neurotoxicity or nephrotoxicity. However, the cumulative exposure of the 2–6 year-old group was the highest among different age groups and was close to the safety thresholds for both health effects. Given that there are still other food sources for these four heavy metals, it is necessary to more closely study their cumulative health effects. Pb was not only a major contributor to neurotoxicity but also the main contributor to nephrotoxicity. Meanwhile, Cd predominantly contributed to nephrotoxicity.
-
The authors declare no conflict of interest.

Cumulative Exposure Levels of Heavy M
Funds:
This project was funded by the Ministry of Science and Technology of the People’s Republic of China [No. 2018YFC1603104]; Chinese Academy of Medical Science Research Unit Program [No.2019-12M-5-024]

 Quick Links
 DownLoad:
