


-
At present, metabolic syndrome (MetS) is becoming a global public health concern. Early detection and timely prevention and intervention are integral steps in the optimal pathway to reducing the incidence of MetS. Serum ferritin (SF), a marker used to evaluate iron storage in the human body, was found to be involved in elevated inflammatory environments and the occurrence of metabolic diseases[1], such as cardiovascular disease[2], diabetes[3], and kidney disease[4]. Chronic inflammation and oxidative stress play essential roles in the development of MetS. However, conflicting evidence exists on the association between MetS and SF. Previous epidemiological evidence has shown that SF levels are positively associated with MetS[5-7] and may be used as a biomarker to predict the occurrence of MetS[8]. Nevertheless, some recent studies have shown that SF is irrelevant to the development of MetS[9,10]. A meta-analysis based on literature obtained from a few studies[11] showed a positive association between SF and MetS. However, the results were highly variable (OR = 1.20, 95% CI: 0.69–1.71, I2 = 96%). We speculate that due to physiological variations, the SF levels of the two sexes differ greatly. Therefore, the variability in the results arose because male and female data were used for the meta-analysis.
In addition, the dose-response relationship is of paramount importance in epidemiological investigations. Recent meta-analyses did not discuss the dose-response relationship between SF and MetS[12,13]. Only one study on the dose-response relationship was reported, and it was based on four limited cohort studies[14]. Therefore, more evidence is urgently needed to investigate the association between MetS and SF comprehensively. The purpose of this study is to perform a meta-analysis of SF and MetS based on updated evidence from the available literature and explore the dose-response relationship between the marker and the disease for different populations (males, females, and postmenopausal females) to confirm the association between SF level and MetS further.
-
We searched PubMed, the Cochrane Library, EMBASE, and the Web of Science databases from 1950 to February 14, 2020. The Cochrane Library search terms used for the title, abstract, and keywords were (‘metabolic syndrome’ or ‘insulin resistance syndrome’ or ‘syndrome X’) and (‘serum ferritin’ or ‘SF’). Similar search terms were used for the other literature databases. No language restrictions were set in the process of literature searching, but only papers written in English were included in this meta-analysis. No literature type or other related restrictions were used in our search. Unpublished reports were excluded. Three reviewers independently screened the potential publication titles and abstracts and reviewed the eligible articles’ full texts.
-
Studies included in the meta-analysis had to meet the following criteria: 1) observational studies on SF and MetS; 2) studies that directly provide adjusted effect size (adjustment factors including age, sex, smoking, drinking, family history, others) between SF and MetS, such as relative risk (RR), OR, 95% CI, or sufficient data to calculate the corresponding results; and 3) studies published in English.
The exclusion criteria for the meta-analysis were as follows: 1) non-original research (reviews, other types); 2) non-population experiments; 3) a study population that included juveniles and pregnant women; 4) subjects with other complications that can affect SF detection; 5) incomplete data and inability to obtain the required data by contacting the corresponding author; and 6) duplicate study populations; if more than one study was conducted on the same population, only the data set including the larger number of individuals or the most comprehensive data (i.e., research results of different sex groups) was included on a case-by-case basis, depending on the analysis performed.
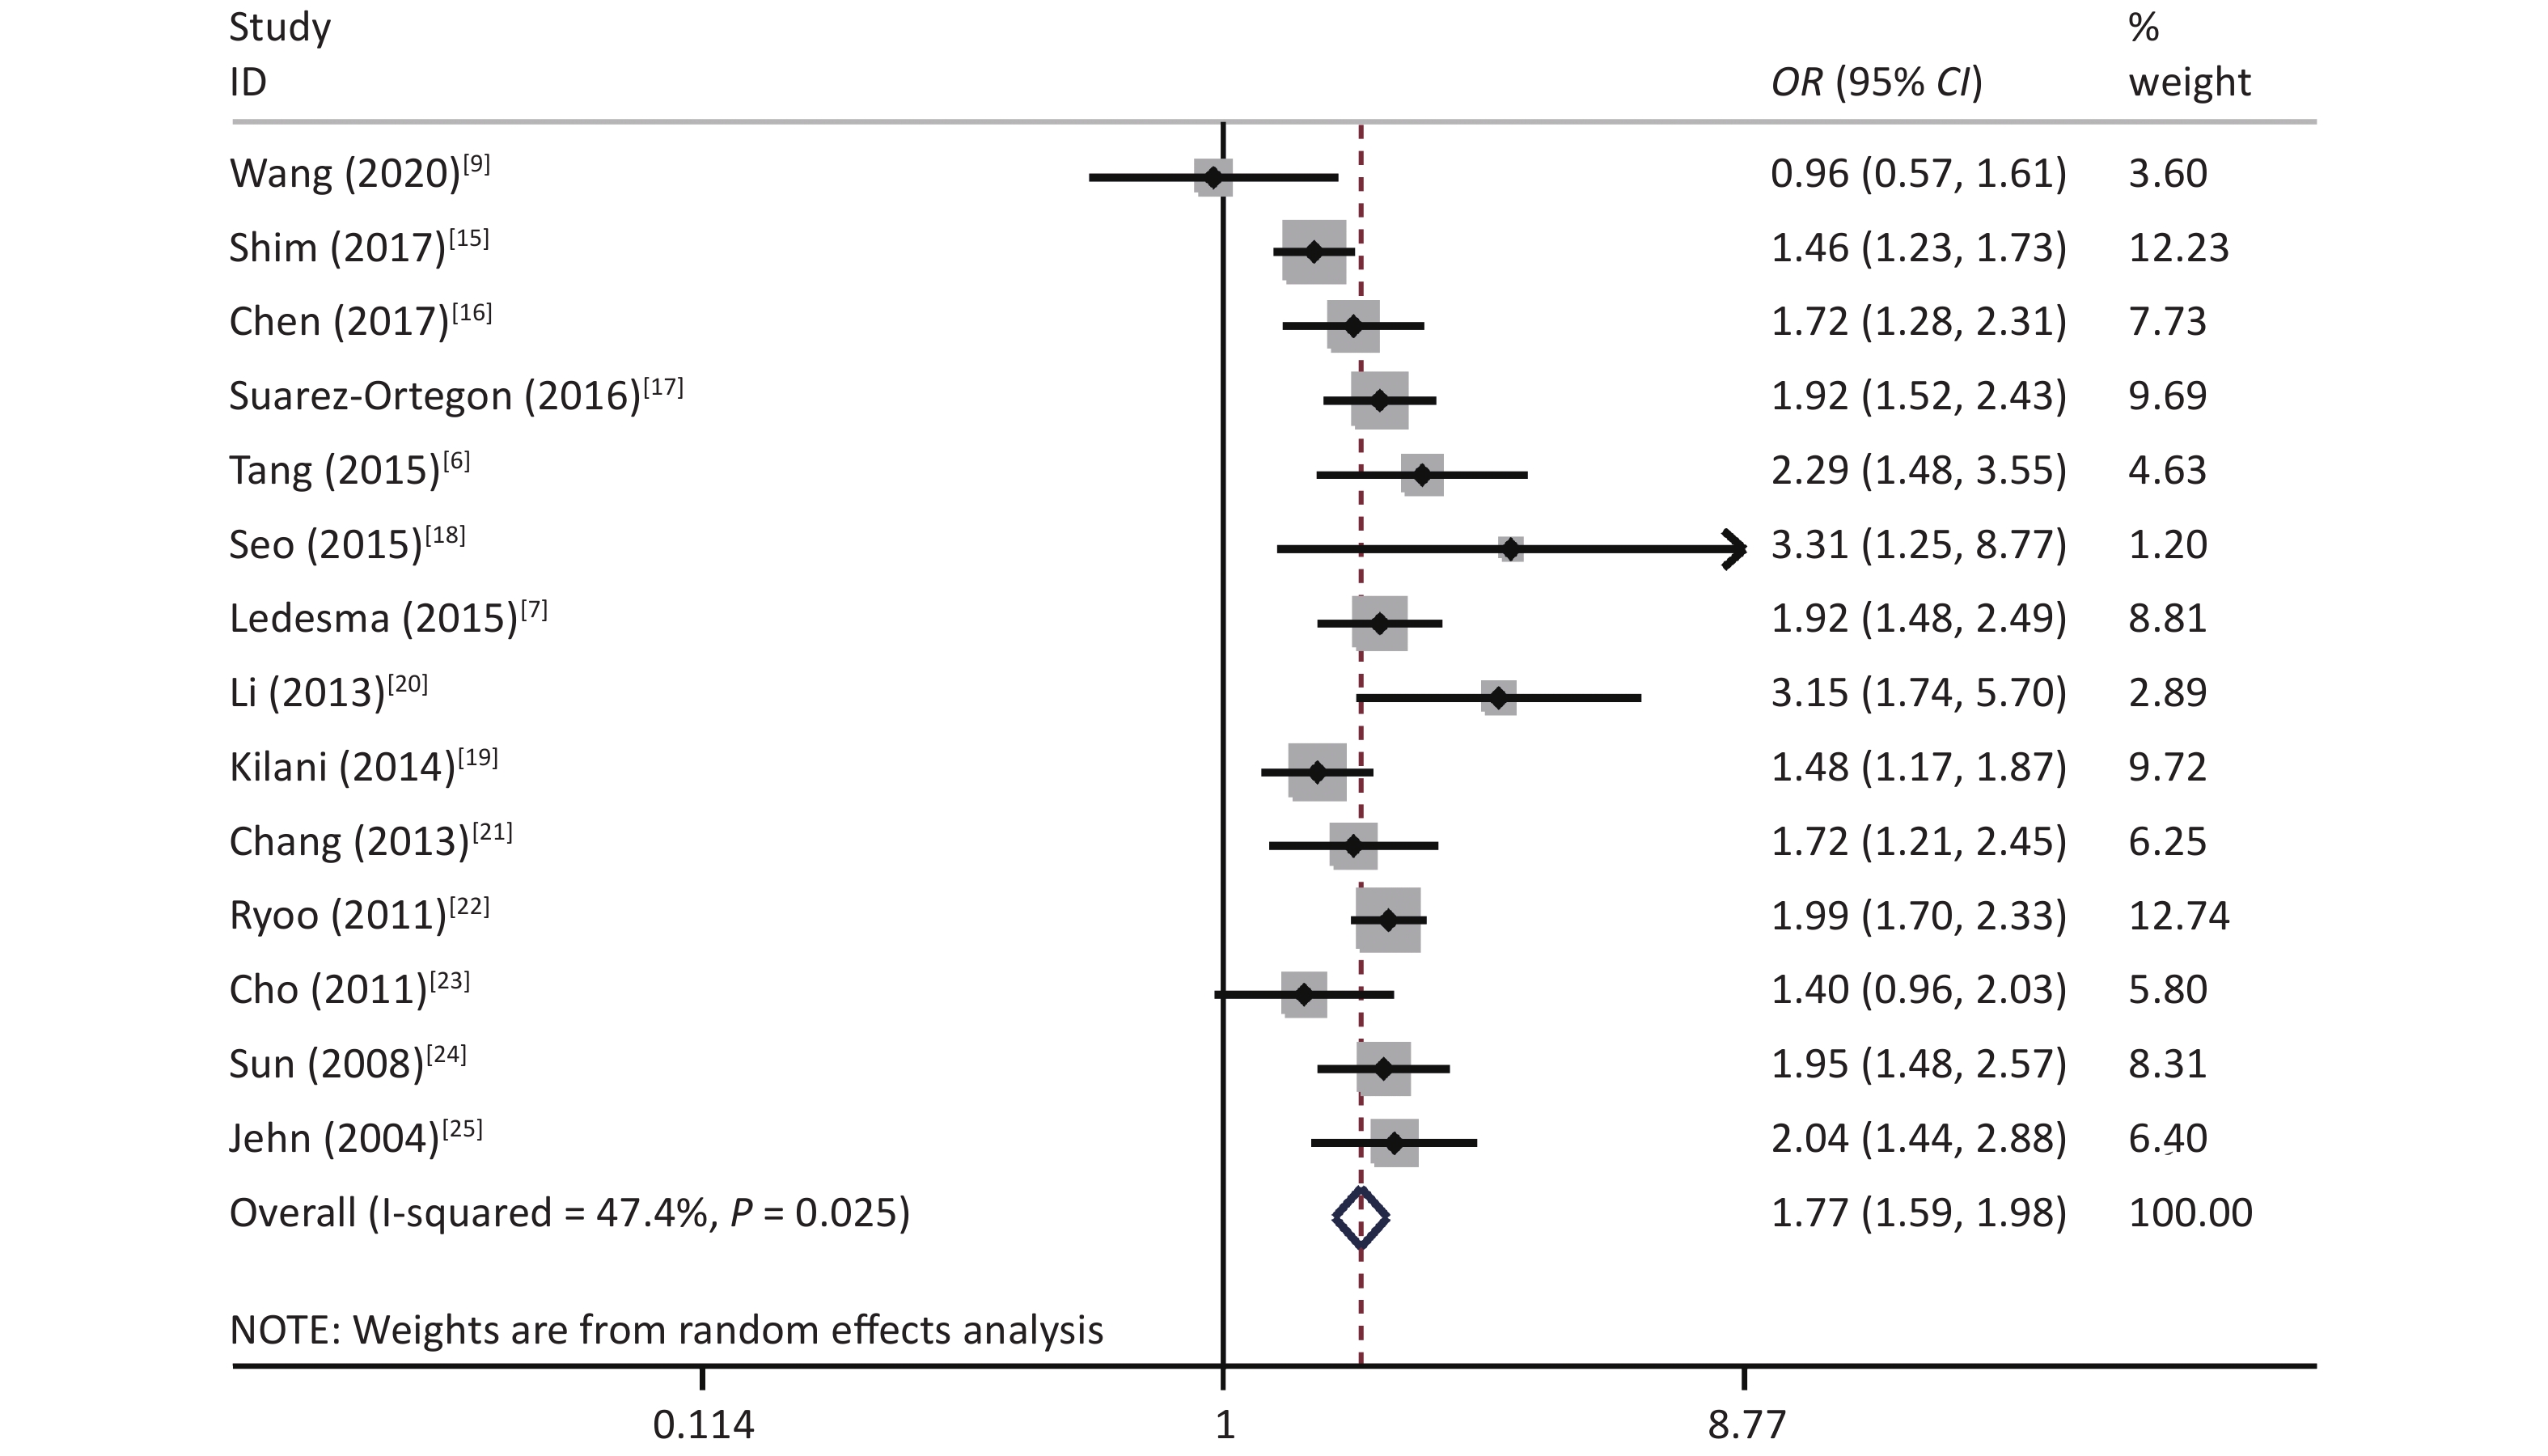
A total of 2,096 potentially relevant studies were identified in our initial literature search. First, we excluded articles by screening their titles and abstracts. Full texts were reviewed when the abstract met the needs of the research. Only 18 articles provided Pearson’s correlation coefficients with nonadjusted ORs and 95% CIs. Thereafter, 14 articles[6, 7, 9, 15-25] were included for further analysis (Figure 1).
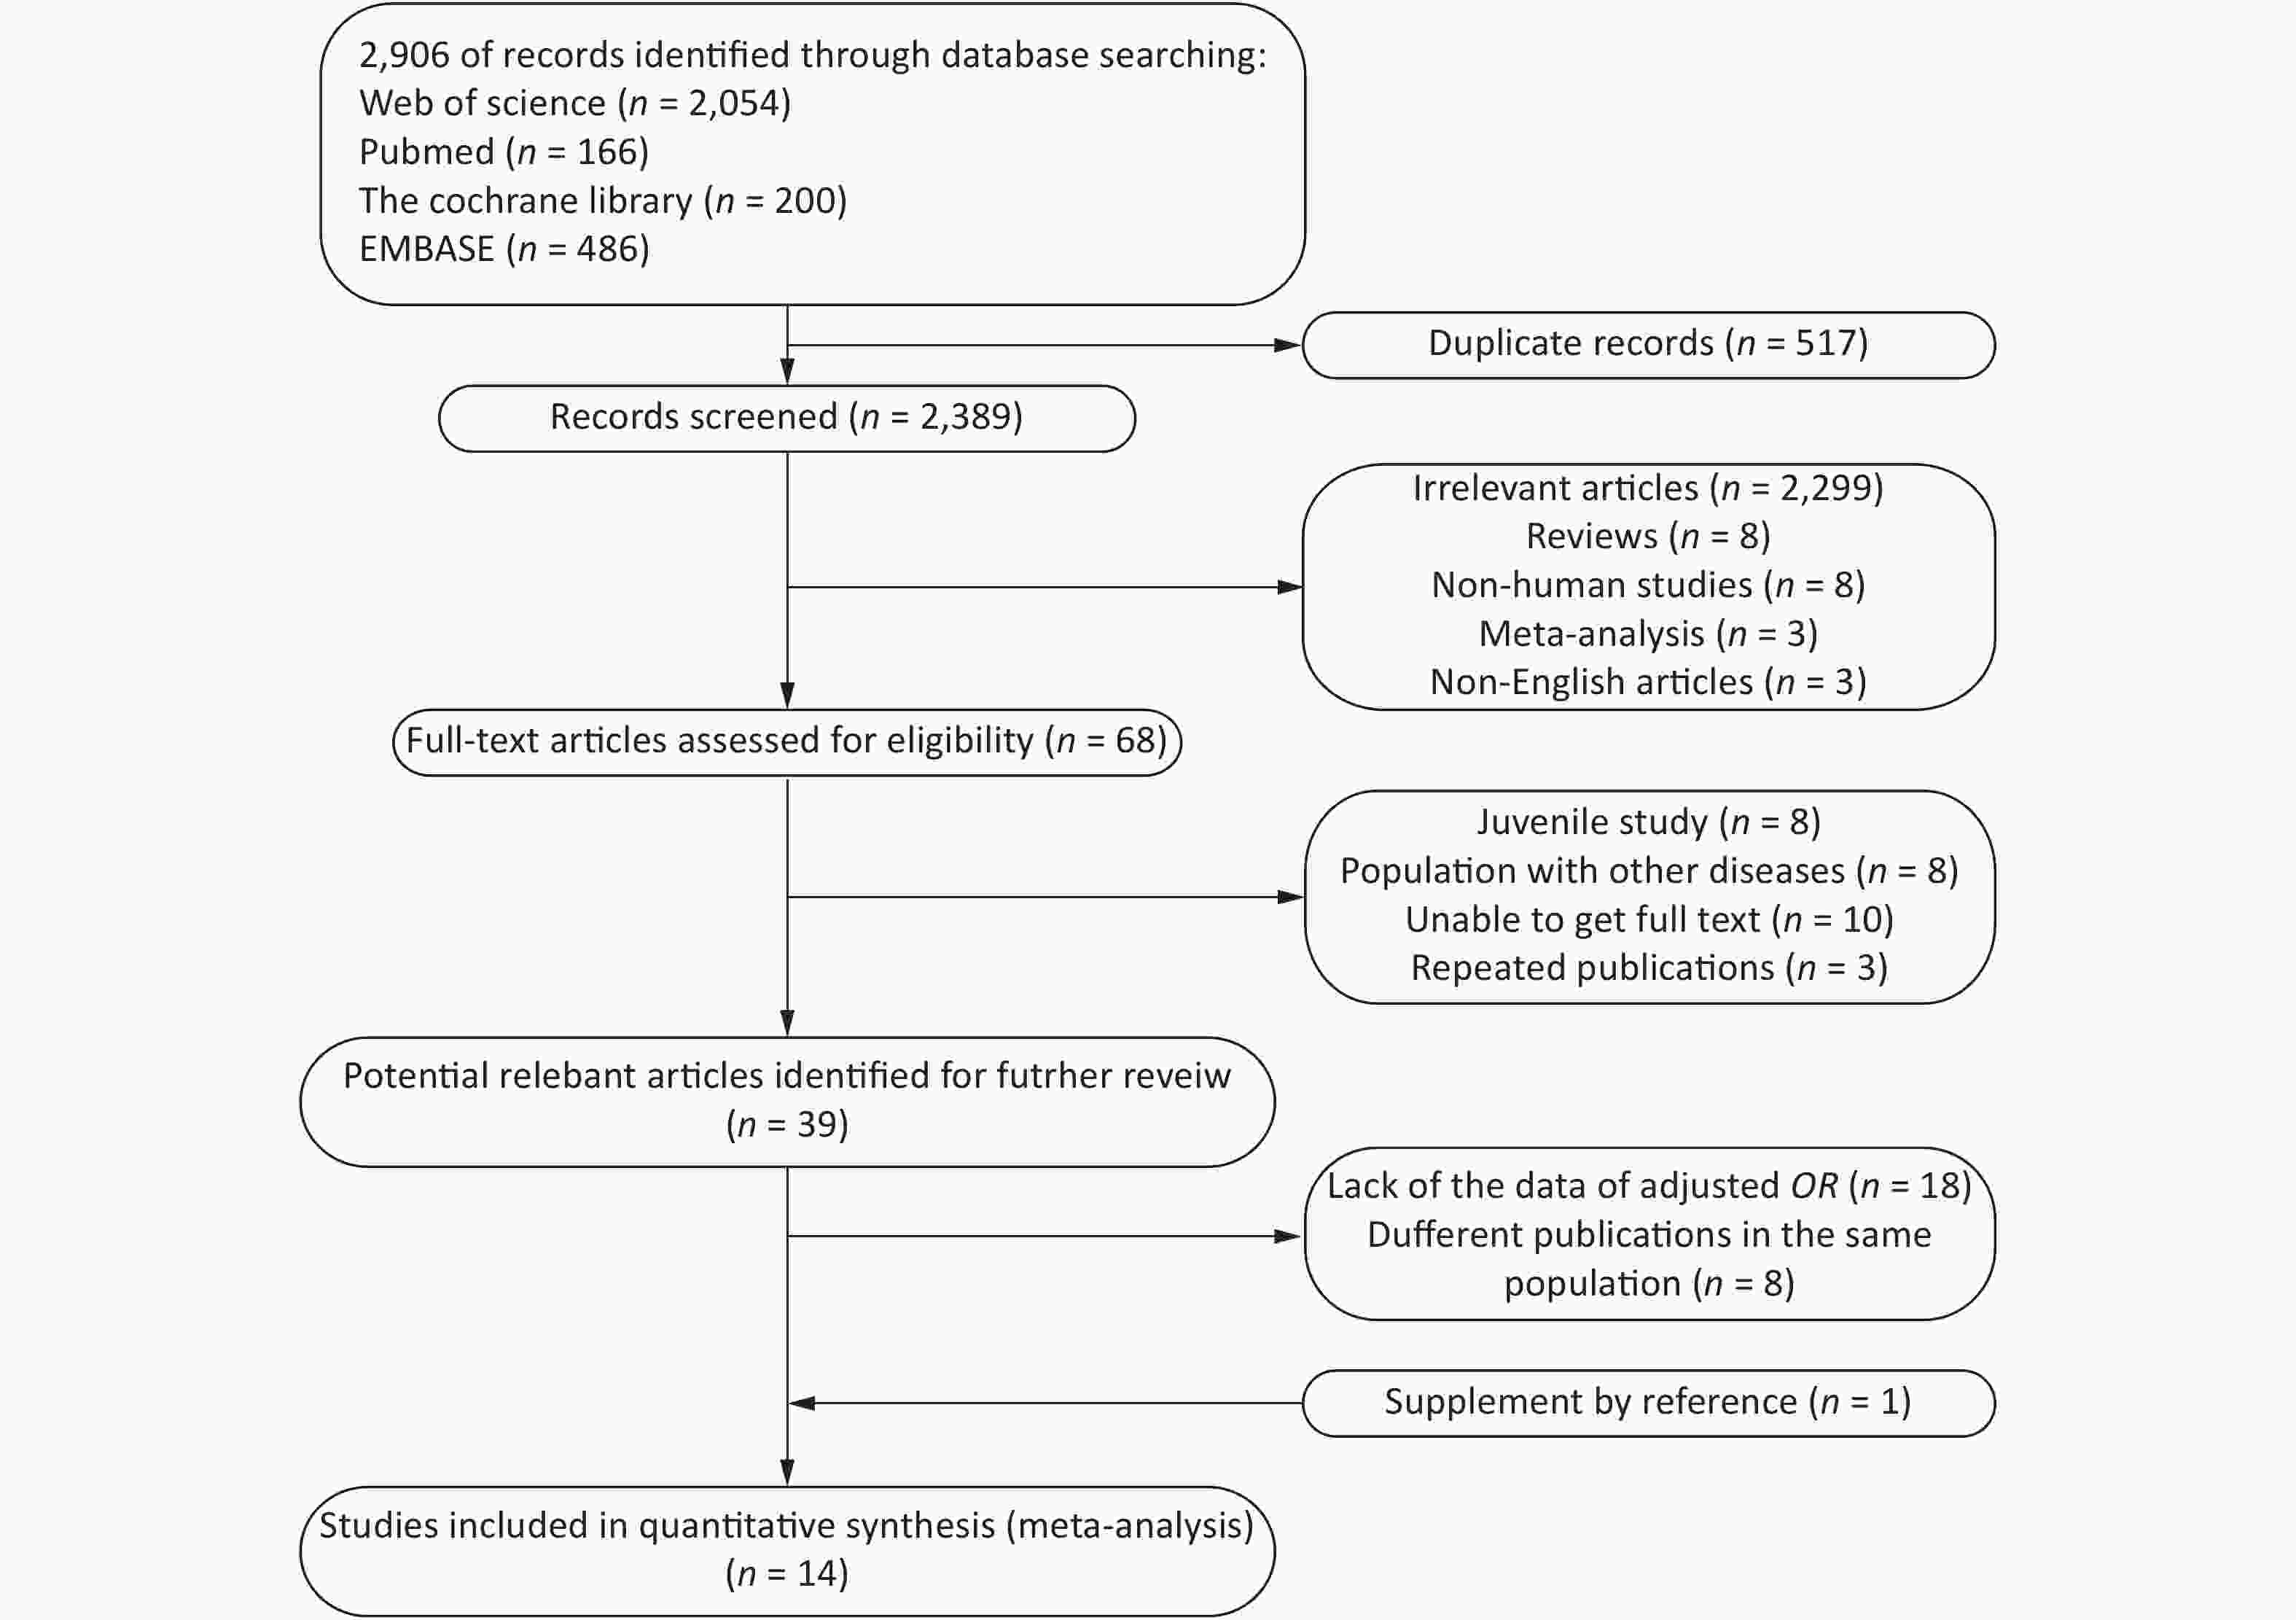
Figure 1. Flow diagram of the search strategy and study selection process
-
For the studies fulfilling the inclusion criteria, two independent reviewers extracted the data according to a predesigned form; if differences of opinion arose between the reviewers, a third author made the final decision. The extracted content included the first author, year of publication, type of study, country, subject age and sex, diagnostic criteria for MetS, SF detection method, sample size, number of cases, SF level, and effect sizes in multivariable analysis (RR, OR, others) and their 95% CI.
-
The quality of each study was independently assessed by two researchers, and differences of opinion were adjudicated by a third author. Since the studies included in this article were cross-sectional studies, they were evaluated using the American Institute for Health Care Research and Quality (AHRQ) scale[26]. The recommended evaluation criteria included 11 items. The evaluation result was given 1 point for ‘yes’ and 0 points for ‘no’ or ‘unclear’. A score of 0–3 indicated a low-quality study, 4–7 indicated a medium-quality study, and 8–11 indicated a high-quality study.
-
In the current meta-analysis, the OR of MetS and its components and their 95% CIs were used to calculate the logarithmic OR and its standard error. First, we performed a meta-analysis of the highest quartile (tertile, quartile, and quintile) and the lowest or reference quantile. The heterogeneity between studies was evaluated by the I2 statistic. If the heterogeneity was not statistically significant (I2 < 50% and P > 0.10), the Mantel–Haenszel fixed-effects model was used[27]. Otherwise, the DerSimonian and Laird random-effects model was used[28]. We explored potential sources of heterogeneity by conducting a subgroup analysis to determine whether the results were different because of geographical area (Asia, Europe, and America), MetS diagnostic criteria [International Diabetes Foundation (IDF), Adult Treatment Panel (ATP) III, Chinese Diabetes Society (CDS)], ferritin assay (chemiluminescence, immunoradiometric, immunoturbidimetric, not reported), and literature quality (middle and high). We used sensitivity analysis to assess each study’s relative impact on the total effect size by successively omitting one study when assessing the effect size. Subsequently, the methods developed by Greenland and Longnecker were used in this study[29].
For this method, the level of SF, the number of cases, number of participants, OR, and 95% CI of at least three quantitative exposure categories were extracted. For each study, the median or mean level of SF for each category was assigned to each corresponding risk estimate. When the median or mean level per category was not provided, each category’s midpoint of the upper and lower boundaries was assigned as the mean level. If the highest category was open, we assumed that the interval width was the same as that of the second-highest category[30]. We used restricted cubic splines (four knots at fixed percentiles of 5%, 35%, 65%, and 95% of the distribution) to evaluate the potential linear or nonlinear association between SF and MetS. If the dose-response relationship was not nonlinear, we conducted a meta-analysis of the linear dose-response relationship to explore the potential linear trend and the correlation between an increase in SF by 50 μg/L and the risk of MetS in different sexes. Egger's test and Begg's test were used to detect publication bias[31]. All statistical analyses were conducted with Stata 14.0. A P-value less than 0.05 was considered statistically significant unless explicitly stated otherwise.
-
Table 1 summarizes the characteristics and study quality of the included studies. All studies were cross-sectional, and a total of 74,710 samples were included. The studies were conducted in different countries (China, Korea, America, Croatia, Switzerland, and Spain) and published before 2003, with participants ranging in age from 18 to 80 years. Regarding MetS diagnostic criteria, nine studies used the ATP III guidelines, four studies referenced the IDF guidelines, and one referenced the CDS guidelines. For the SF assay, five studies used chemiluminescence, five studies used immunoradiation, two studies used immunoturbidimetry, and two studies did not describe the specific methods used. According to the AHRQ scale, all included studies were of high or medium quality.
First author, Year Country Study design Age (years) Sex Criteria Ferritin assay Sample size AHRQ score Jehn, 2004[25] America Cross-sectional > 20 Both ATP Ⅲ RIA 5,949 9 Sun, 2008[24] China Cross-sectional 50–70 Both ATP Ⅲ TIA 3,289 7 Cho, 2011[23] Korea Cross-sectional 50a Female ATP Ⅲ RIA 3,082 8 Ryoo, 2011[22] Korea Cross-sectional 41a Male ATP Ⅲ CLIA 18,581 8 Chang, 2013[21] China Cross-sectional > 19 Both ATP Ⅲ NR 2,654 9 Li, 2013[20] China Cross-sectional ≥ 18 Both ATP Ⅲ RIA 8,441 8 Kilani, 2014[19] Switzerland Cross-sectional 53a Both ATP Ⅲ NR 5,498 8 Ledesma, 2015[7] Spain Cross-sectional 19–65 Male ATP Ⅲ TIA 3,386 7 Seo, 2015[18] Korea Cross-sectional 58a Female ATP Ⅲ RIA 280 7 Tang, 2015[6] China Cross-sectional 20–73 Male ATP Ⅲ CLIA 2,417 8 Suarez-Ortegon, 2016[17] Croatia Cross-sectional ≥ 18 Both ATP Ⅲ CLIA 725 8 Shim, 2017[15] Korea Cross-sectional 16–80 Both IDF RIA 15,963 8 Chen, 2017[16] China Cross-sectional 25–74 Both IDF CLIA 2,786 9 Wang, 2020[9] China Cross-sectional 18–75 Both CDS CLIA 1,659 8 Note. ATP III, National Cholesterol Education Program Adult Treatment Panel III; IDF, International Diabetes Federation; CDS, the Guidelines for the Prevention and Treatment of Type 2 Diabetes by Chinese Diabetes Society; CLIA, chemiluminescence immunoassay; RIA, immunoradiometric assay; TIA, immunoturbidimetric assay; NR, Not reported; amean age. Table 1. Characteristics of studies investigating the association between SF and MetS
-
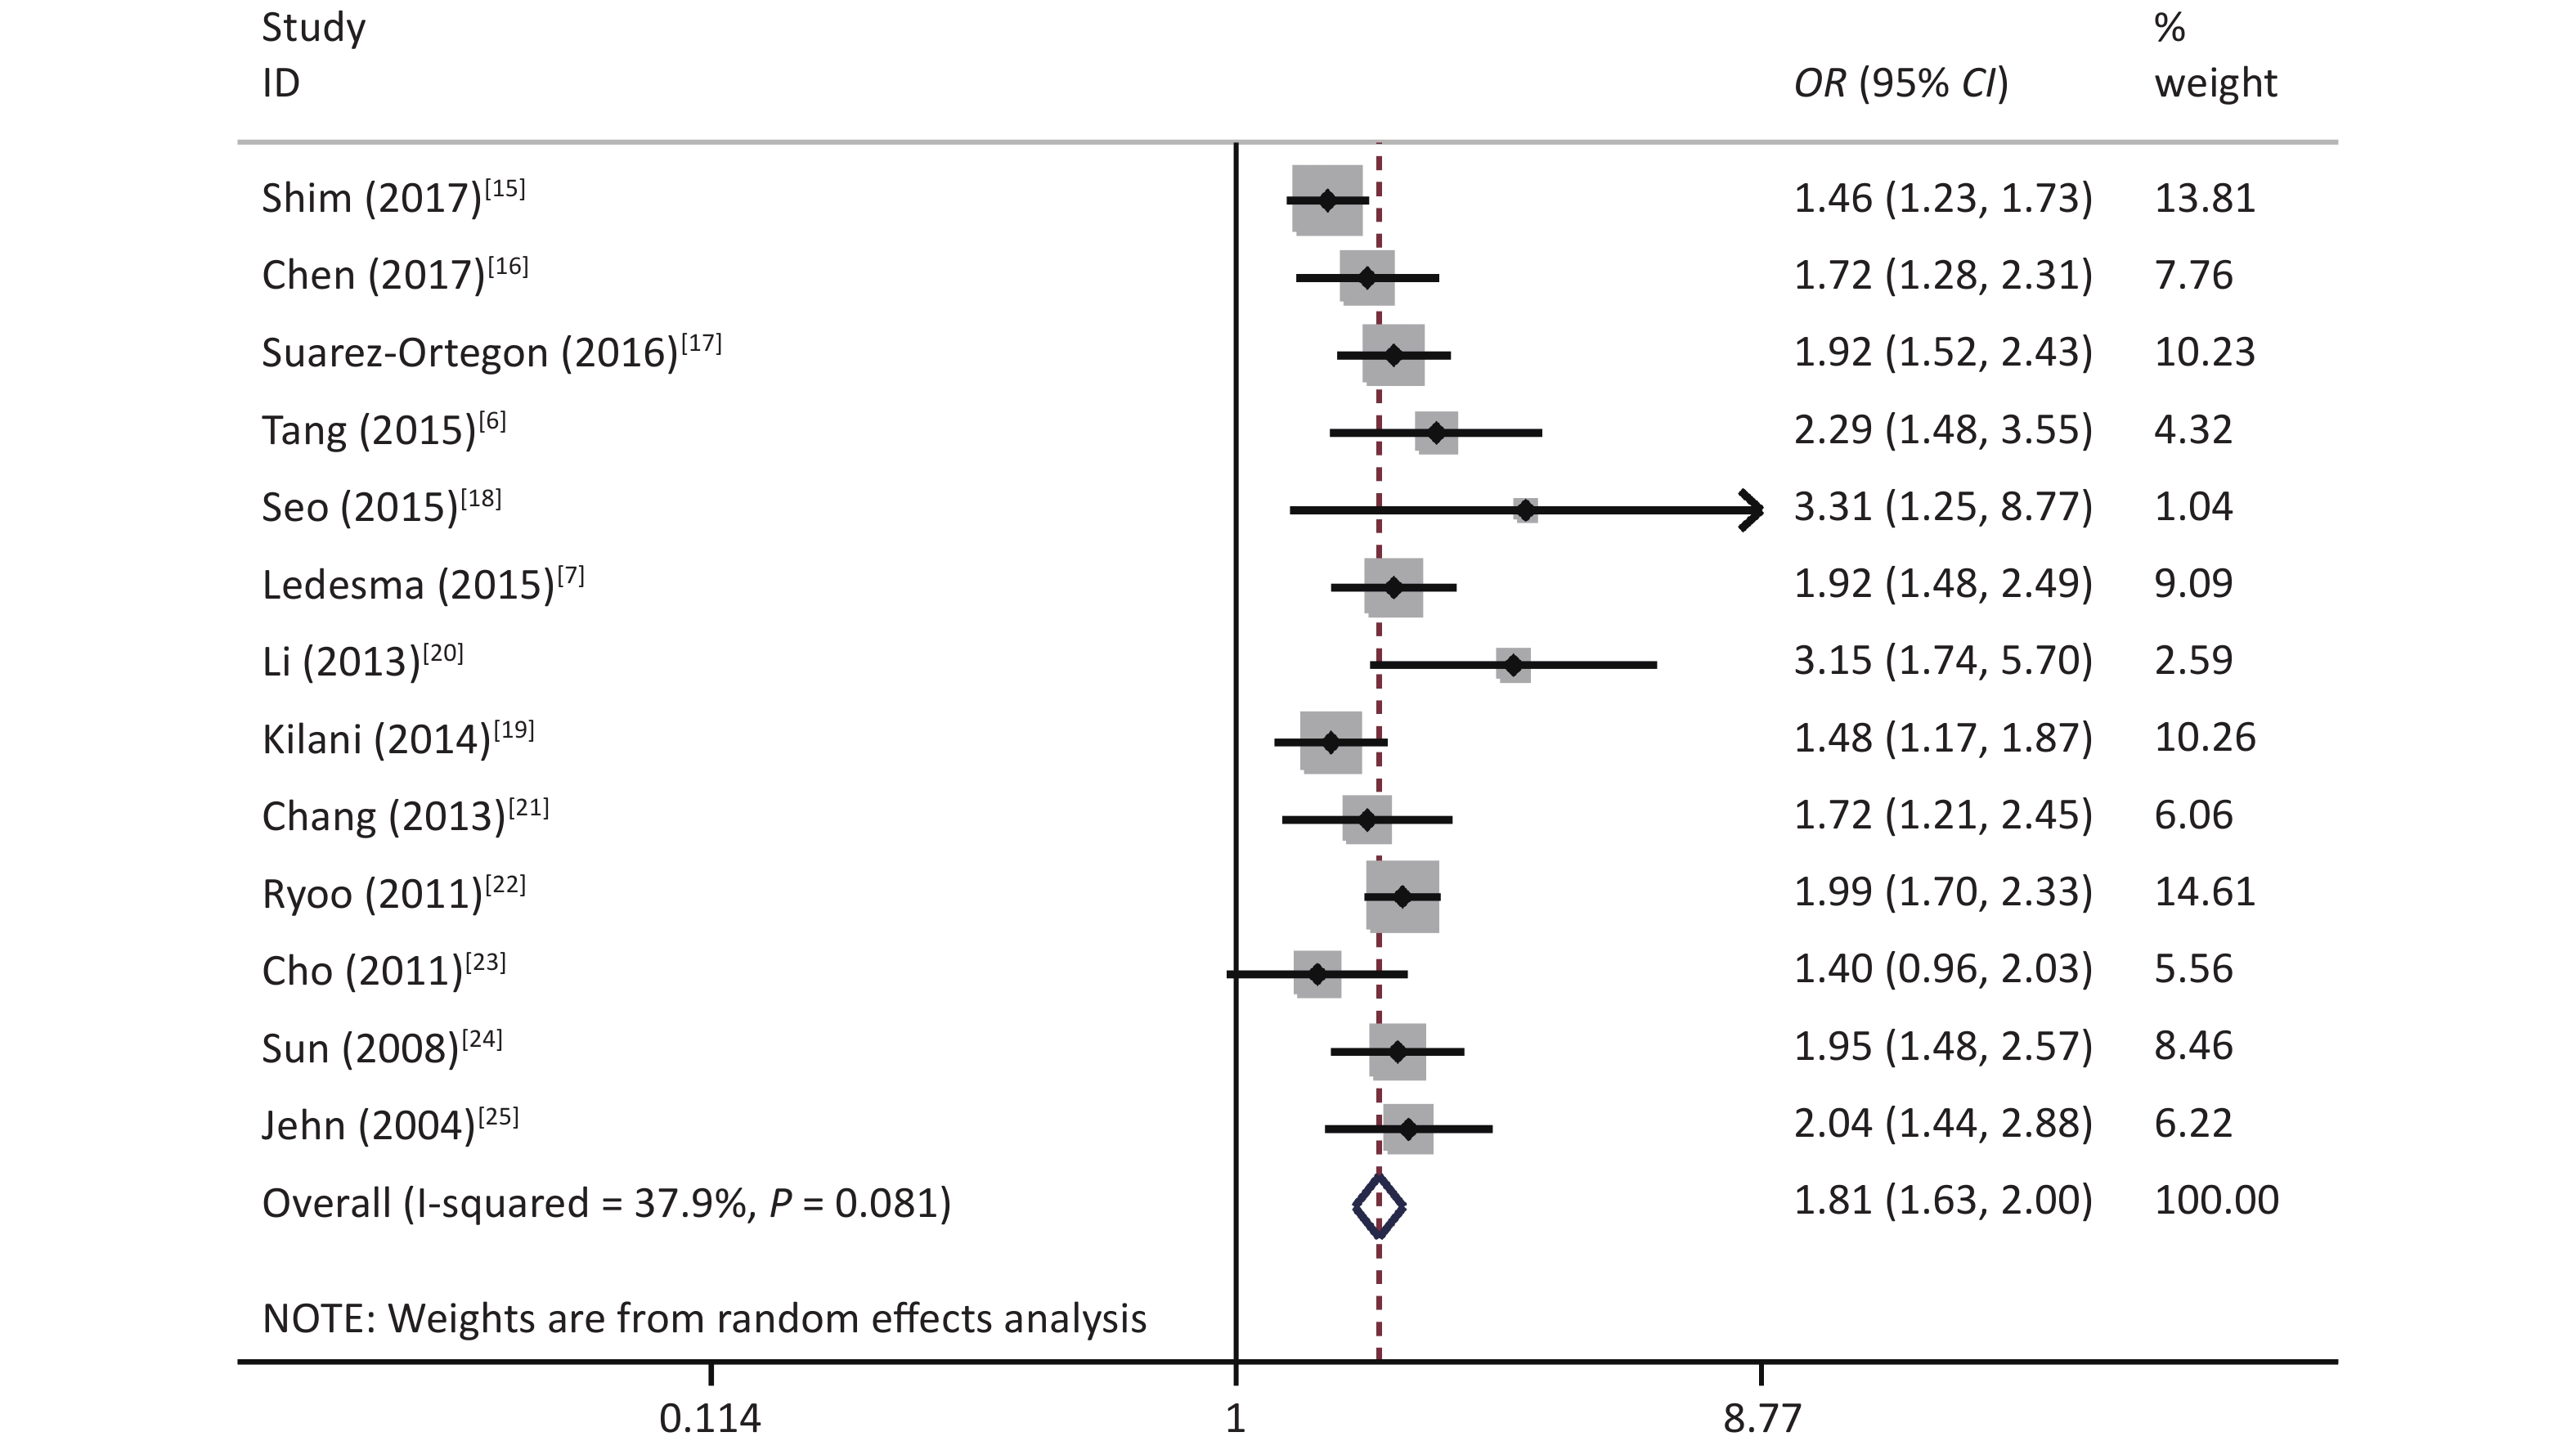
The results showed that some heterogeneity existed among the 14 studies (χ2 = 24.69, P = 0.025, I2 = 47.4%). Therefore, a random-effects model was used to combine the effect values. The results showed that SF was positively associated with MetS (OR = 1.77, 95% CI: 1.59–1.98) (Figure 2).

Figure 2. A meta-analysis of the association between SF with MetS.
-
Subgroup analysis was performed according to the study area, diagnostic criteria, and SF detection method; however, there were significant differences in the subgroups of diagnostic criteria. There were no significant differences for the other subgroups, which indicated that SF could increase the risk of MetS (Table 2).
Subgroup Number of studies OR (95% CI) I2 (%) P-value Region Asia 10 1.75 (1.60–1.91) 57.0 0.782 Europe and America 4 1.79 (1.57–2.04) 19.1 Criteria CDS 1 0.96 (0.50–1.41) − 0.003 IDF 2 1.52 (1.31–1.76) 0 ATP III 13 1.88 (1.73–2.05) 19.8 Ferritin assay CLIA 5 1.88 (1.68–2.11) 50.7 0.140 RIA 5 1.62 (1.41–1.85) 62.3 TIA 2 1.93 (1.60–2.34) 0 NR 2 1.55 (1.28–1.88) 0 Study quality High 11 1.72 (1.59–1.87) 54.3 0.193 Middle 3 1.97 (1.64–2.38) 0 Note. CDS, the Guidelines for the Prevention and Treatment of Type 2 Diabetes by Chinese Diabetes Society; ATP III, National Cholesterol Education Program Adult Treatment Panel III; IDF, International Diabetes Federation; CLIA, chemiluminescence immunoassay; RIA, immunoradiometric assay; TIA, immunoturbidimetric assay; NR, Not reported. Table 2. Subgroup analysis for the association between SF and MetS
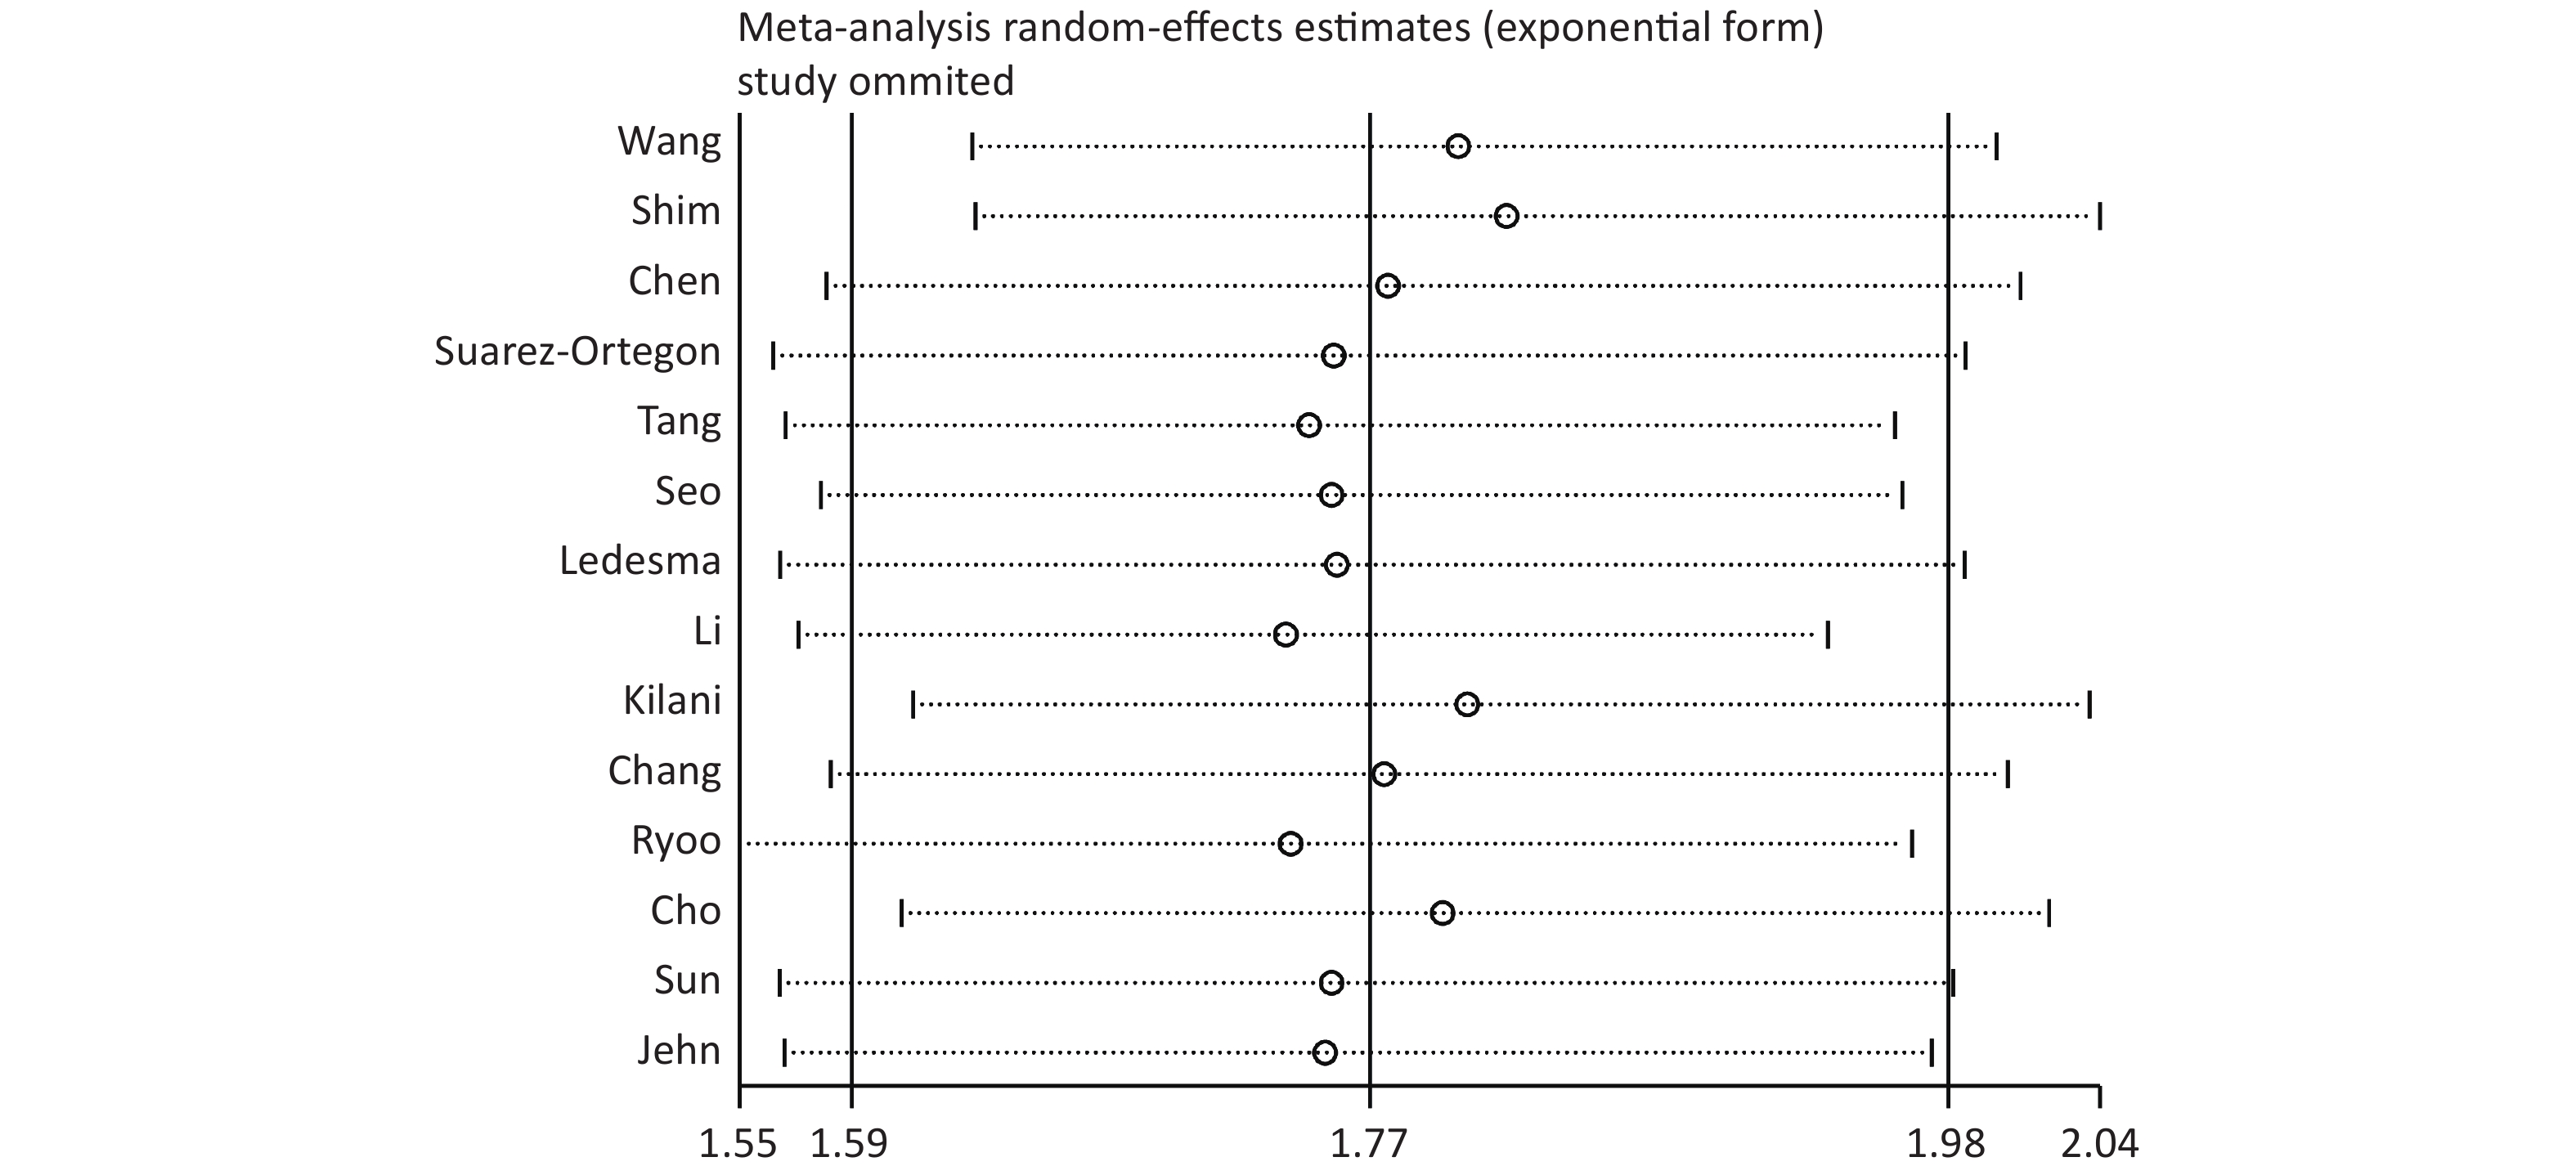
The sensitivity analysis showed that the pooled effect sizes obtained for the association of SF with the risk of MetS did not depend on a particular study or group of studies. This finding suggested that the results obtained in this meta-analysis were stable (Supplementary Figure S1 available in www.besjournal.com).

Figure S1. Sensitivity analysis of serum ferritin and metabolic syndrome
-
Since only eight articles provided data on SF and the components of MetS, a meta-analysis of the components was performed for these eight studies[7,9,15,17,20-22,25]. The results showed that SF was positively associated with abdominal obesity (I2 = 52.6%, OR = 1.42, 95% CI: 1.24–1.62), elevated fasting plasma glucose (FPG) (I2 = 78.1%, OR = 1.84, 95% CI: 1.50–2.25), elevated blood pressure (BP) (I2 = 18.4%, OR = 1.17, 95% CI: 1.08–1.26), elevated triglyceride (TG) (I2 = 75.6%, OR = 2.09, 95% CI: 1.72–2.54), and reduced high-density lipoprotein cholesterol (HDL-C) (I2 = 44.4%, OR = 1.33, 95% CI: 1.19–1.49) (Table 3).
Components OR (95% CI) I2 (%) P-value Abdominal obesity 1.42 (1.24–1.62) 52.6 0.039 Elevated FPG 1.84 (1.50–2.25) 78.1 < 0.001 Elevated BP 1.17 (1.08–1.26) 18.4 0.284 Elevated TG 2.09 (1.72–2.54) 75.6 < 0.001 Reduced HDL-C 1.33 (1.19–1.49) 44.4 0.083 Note. FPG, fasting plasma glucose; BP, blood pressure; TG, triglyceride; HDL-C, high-density lipoprotein cholesterol. Table 3. Estimates of risk for the association between SF and the components of MetS from the meta-analysis
-
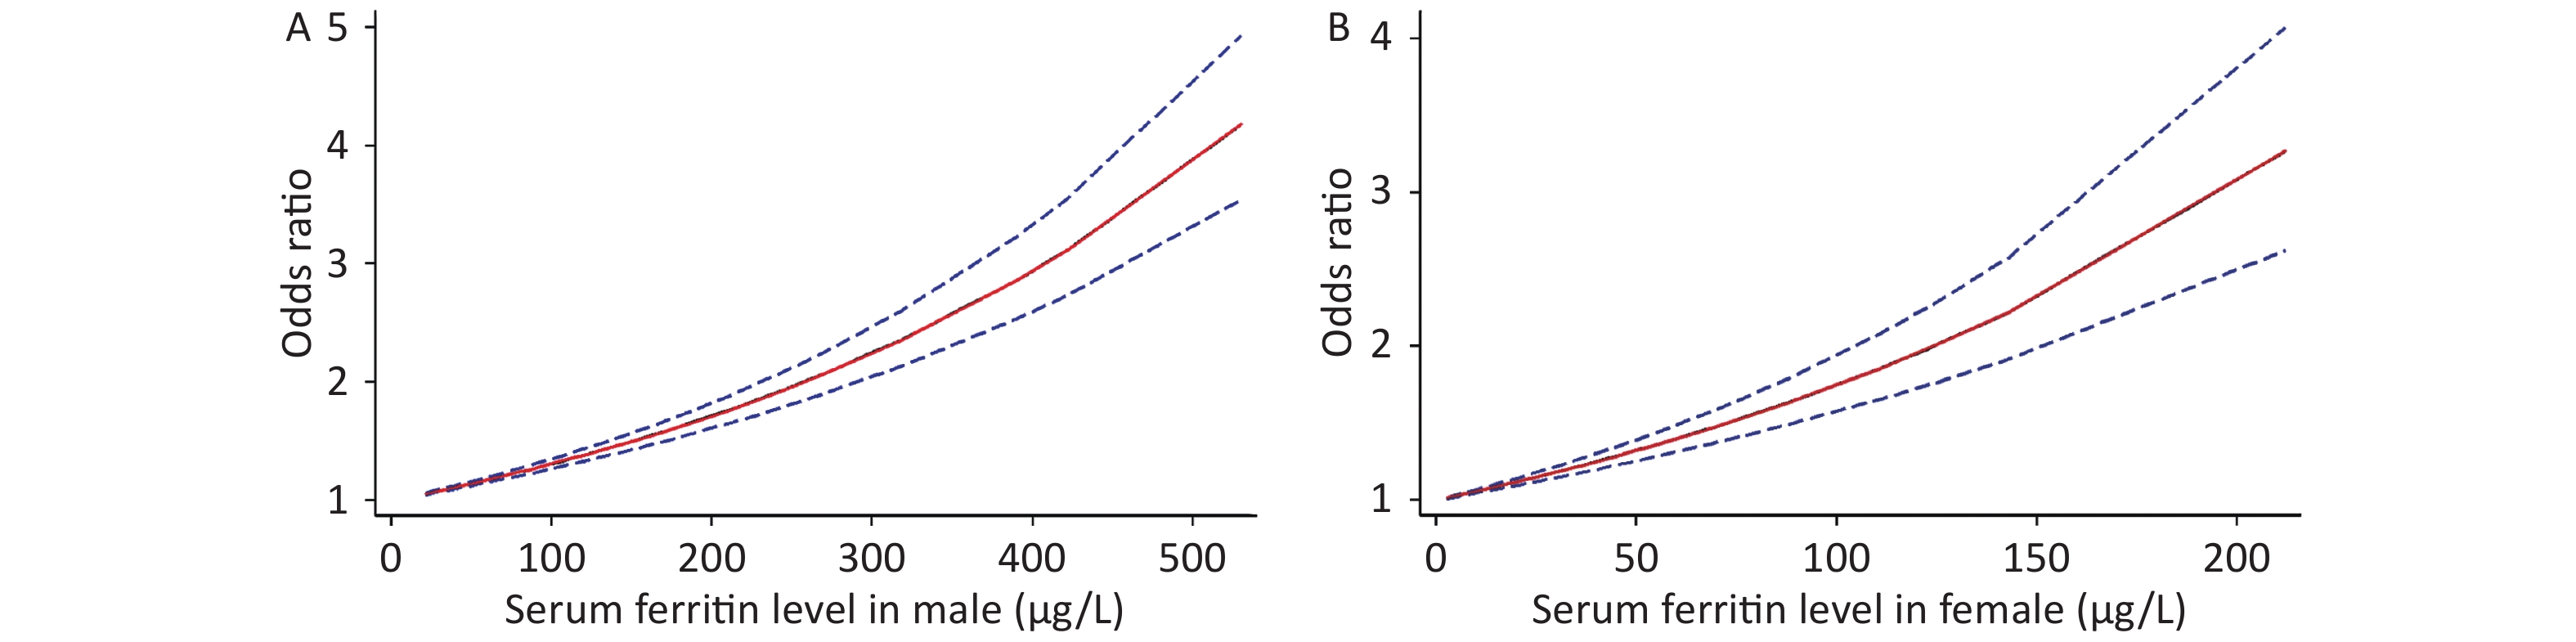
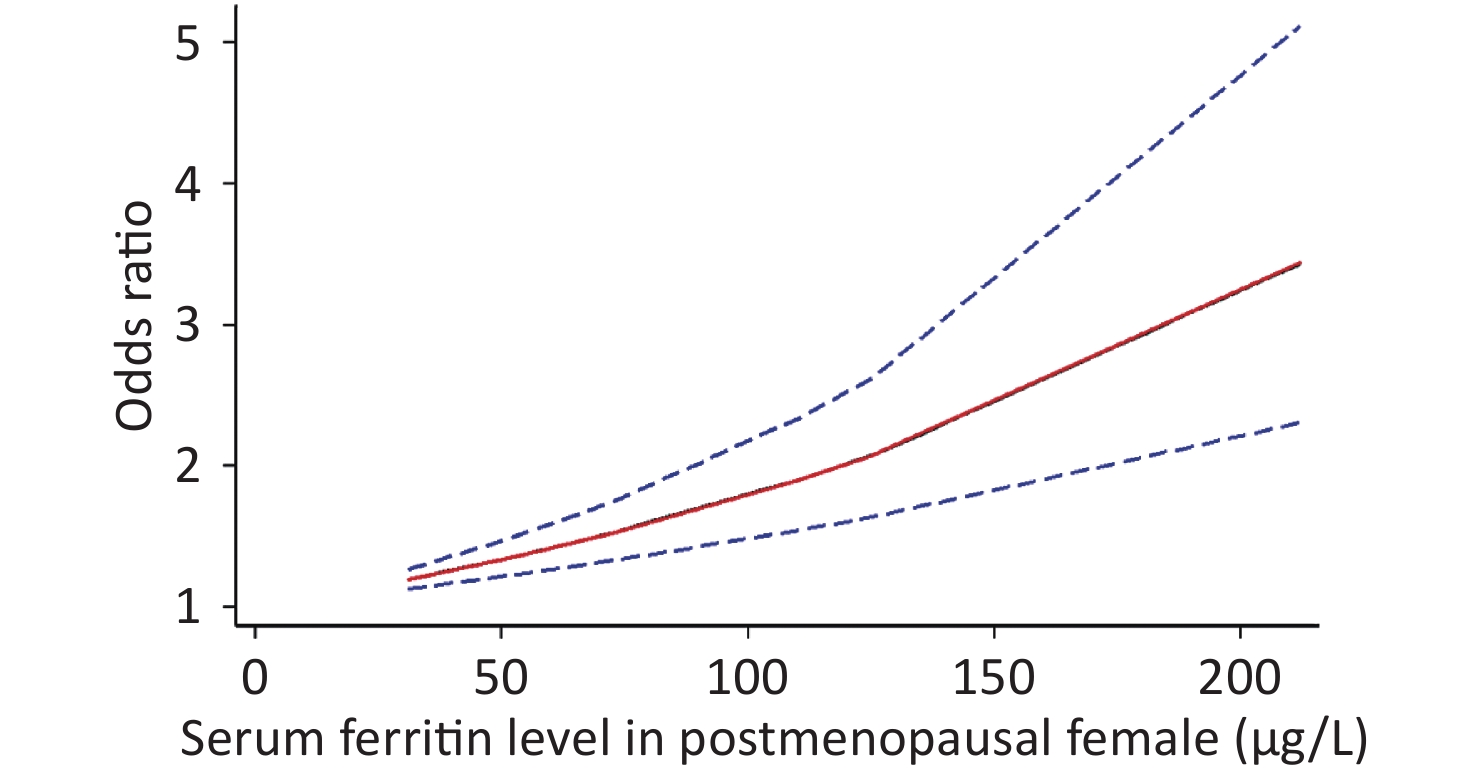
Because of the limited literature available for the dose-response meta-analysis, only seven articles[6,15,16,18,20,22,25] were included. The dose-response relationship between SF and MetS for different sexes is shown in Figure 3. A linear dose-response relationship was found between the two populations (male: P < 0.001, P-nonlinearity = 0.5326, female: P < 0.001, P-nonlinearity = 0.2984). Each 50 μg/L increase in SF in males was associated with a 1.14-fold higher risk of MetS (95% CI: 1.13–1.16). For females, each 50 μg/L increase in SF was associated with a 1.32-fold higher risk of MetS (95% CI: 1.26–1.39). Similar results were obtained for postmenopausal females (P < 0.0001, P-nonlinearity = 0.0673, OR = 1.34, 95% CI: 1.22–1.47) (Supplementary Figure S2 available in www.besjournal.com).
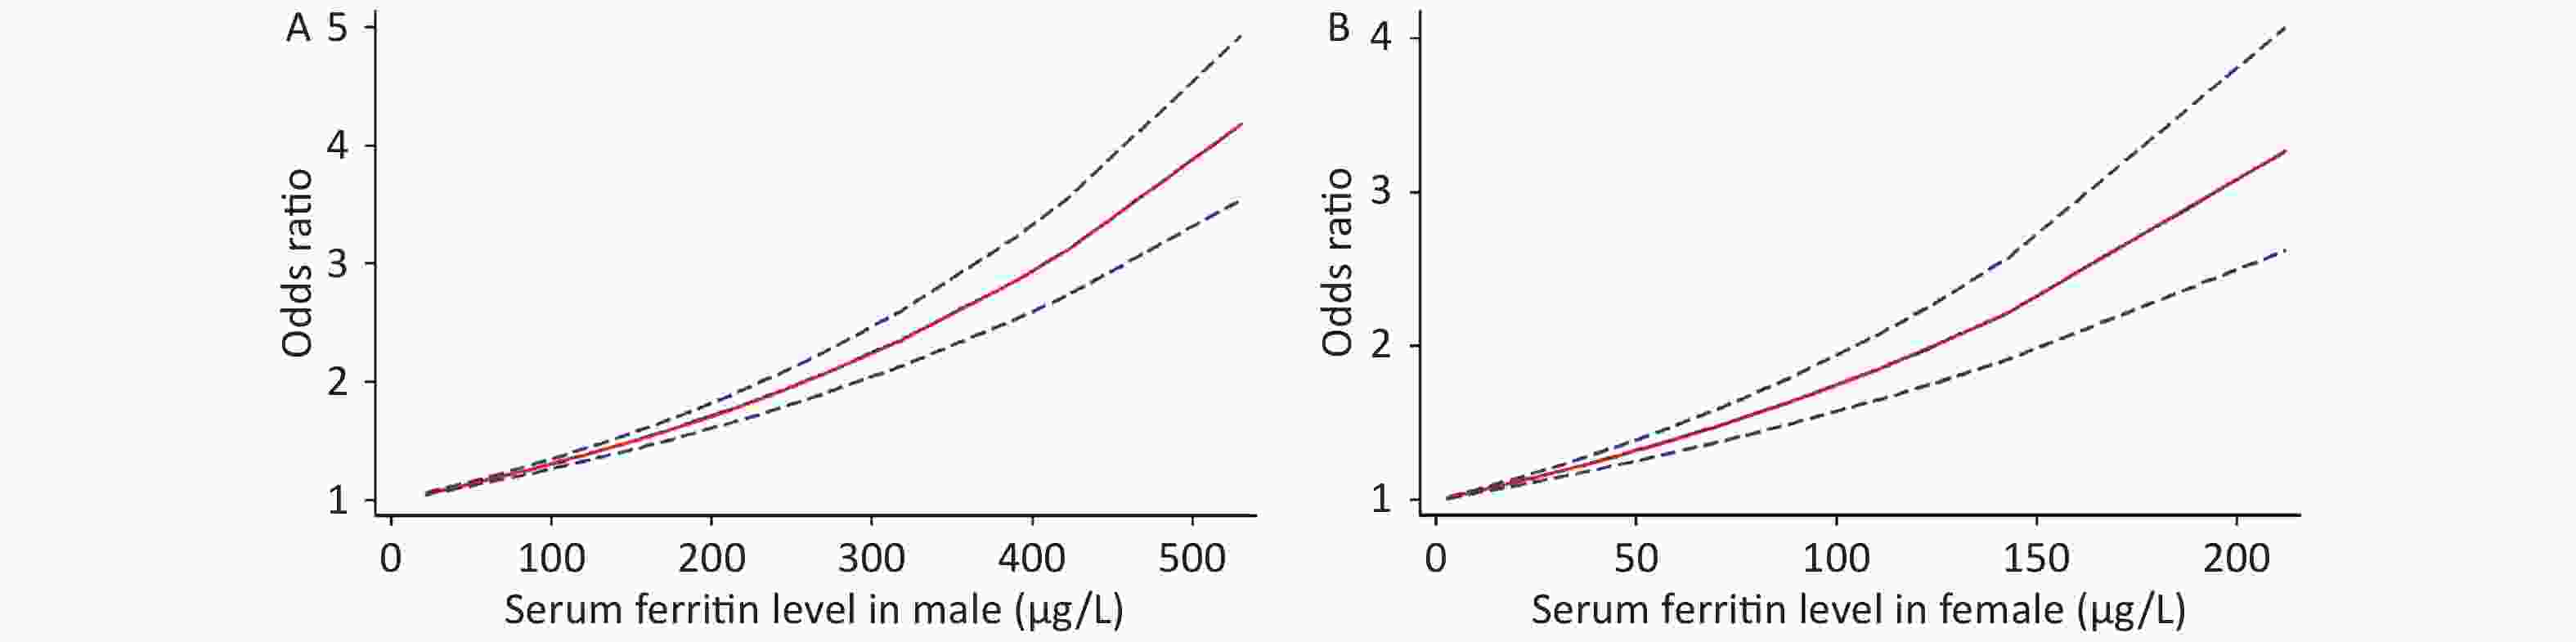
Figure 3. Risk between SF and MetS estimates from dose-response meta-analysis. (A) Male. (B) Female.
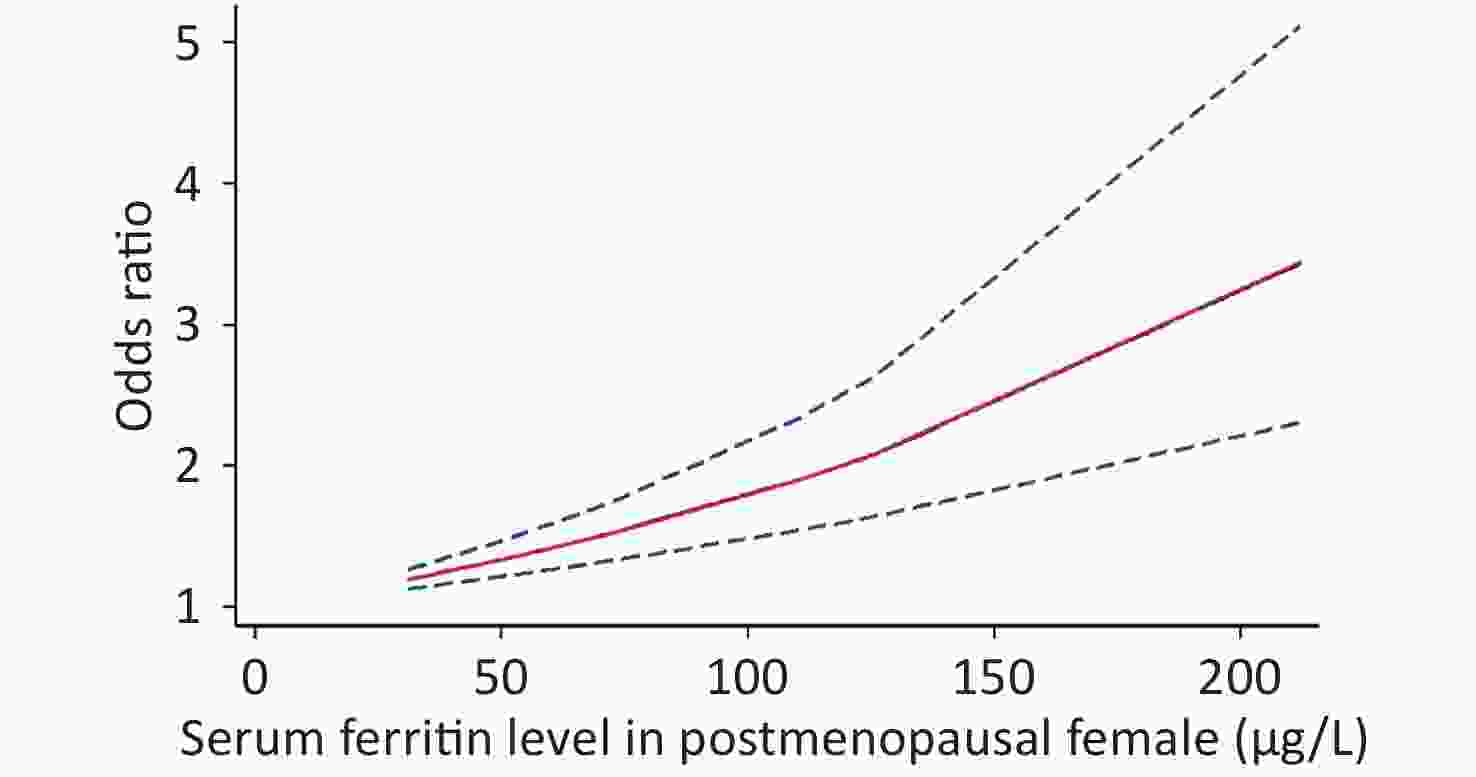
Figure S2. Risk between SF and MetS estimates from dose-response meta-analysis in postmenopausal females
-
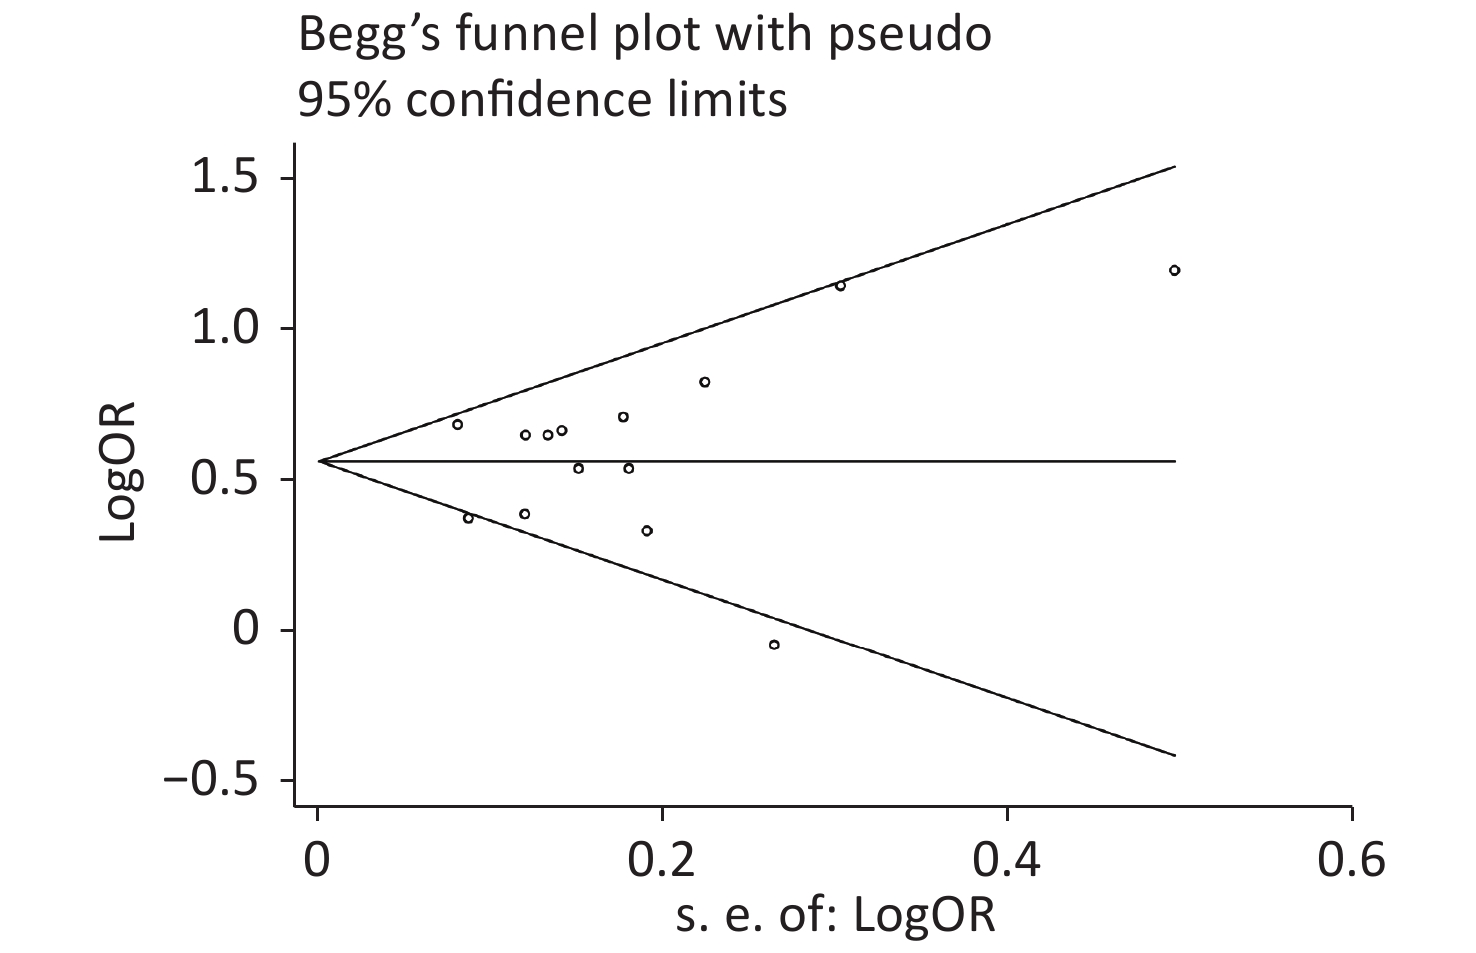
Publication bias was evaluated by Begg’s rank correlation method and Egger’s regression test. The P-values in the Begg’s test (Figure 4) and the Egger’s test (Figure 5) were 0.381 and 0.512, respectively. These results indicated that the difference was not statistically significant, and publication bias was not evident in the entire study.
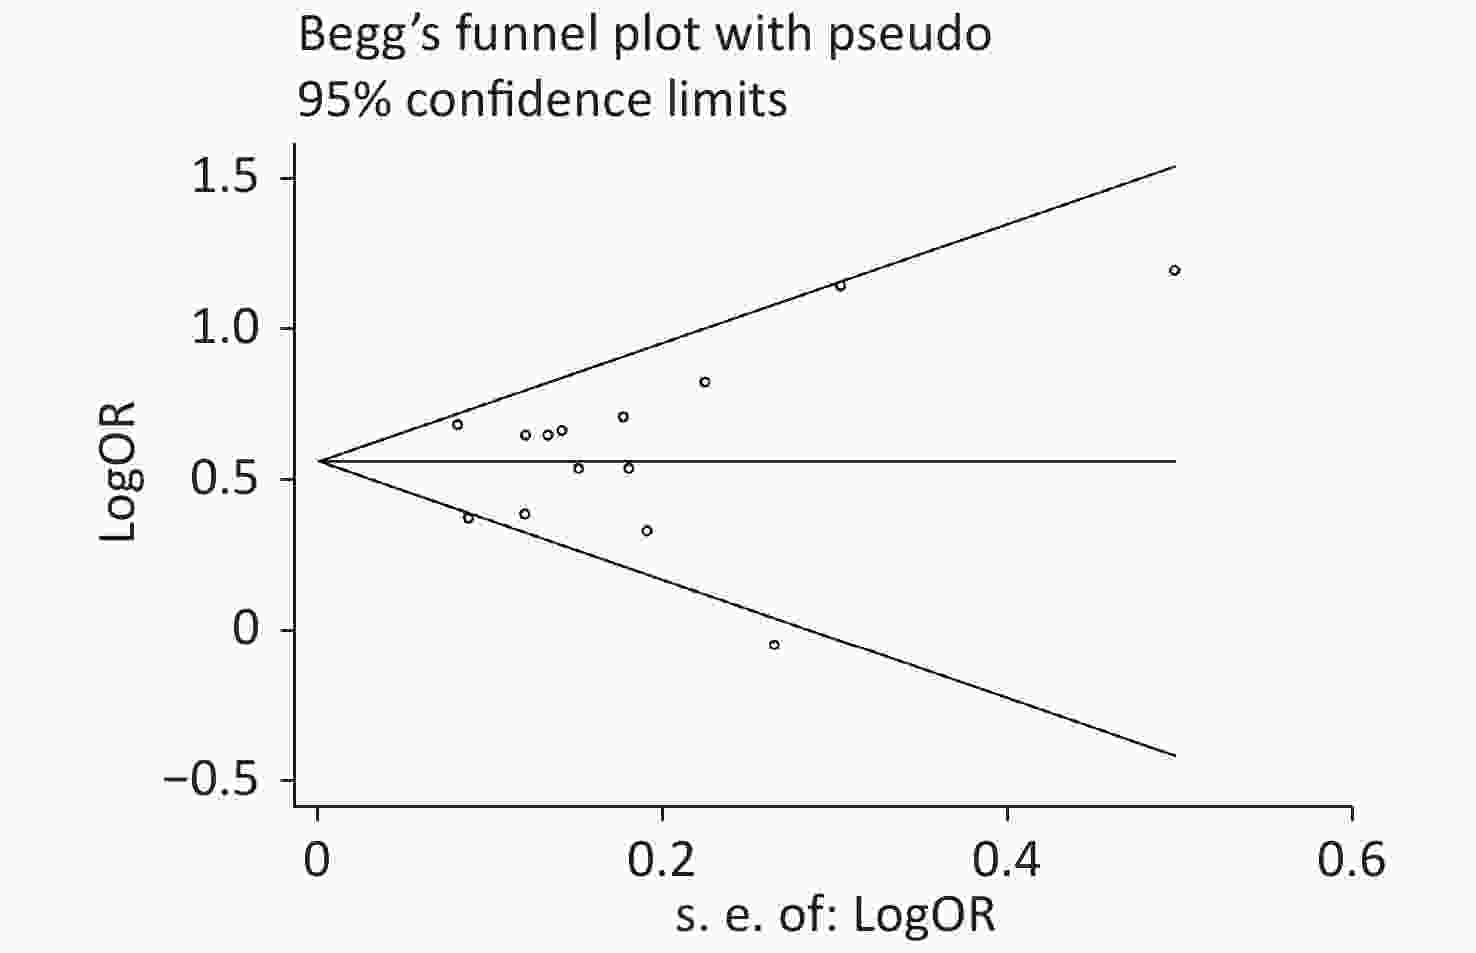
Figure 4. Results of the Begg’s test.
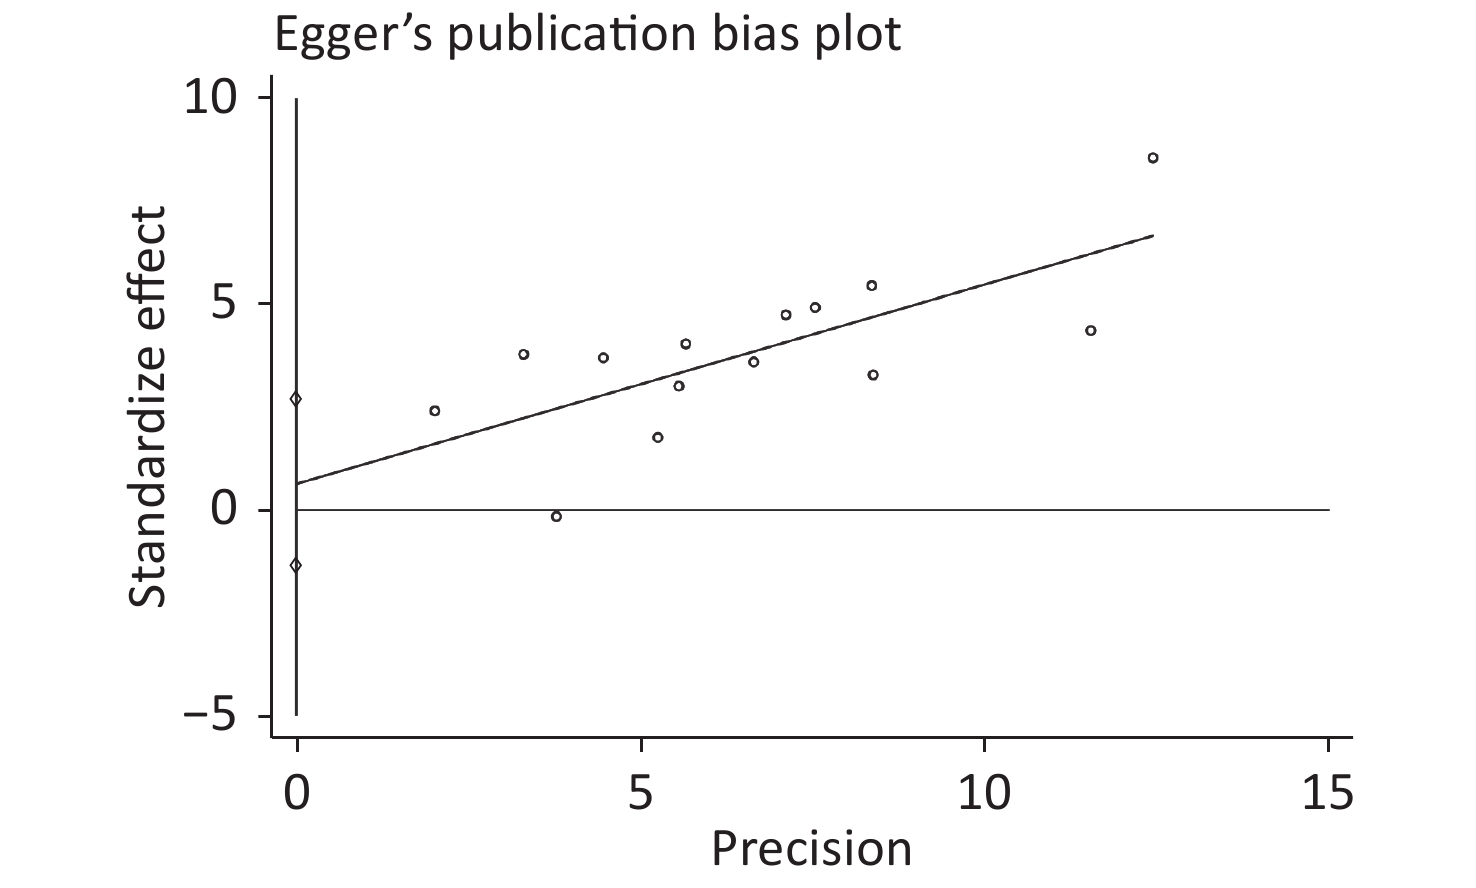
Figure 5. Results of the Egger’s test.
-
Based on published observational studies from 2004 to 2020, this meta-analysis revealed a strong association between SF and the risk of MetS (OR = 1.77, 95% CI: 1.59–1.98). A linear dose-response relationship was observed between SF level and MetS. The association between the SF level and MetS was examined by sex because females’ SF levels are significantly decreased during the postmenopausal period. With each 50 μg/L increase in SF in the body, the risk of disease increased by 14% in males (95% CI: 1.13–1.16) and 32% in females (95% CI: 1.26–1.39). The mechanism underlying the association between SF and MetS may be multifactorial. MetS is a complex accumulation of risk factors, including hypertension, high blood glucose, central obesity, and dyslipidemia. The association between SF and MetS is related to the influence of SF on risk factors for MetS. SF is widely used as a biomarker to evaluate iron storage levels in humans. Many studies have shown that SF is involved in the occurrence and development of various metabolic diseases, such as cardiovascular disease[32,33], type 2 diabetes[34], and chronic kidney disease[35]. A cohort study involving 17,812 men in South Korea found that elevated SF was a risk factor for obesity after five years of follow-up (RR = 1.24, 95% CI: 1.09–1.41)[36]. Ellidag et al. found that SF was positively correlated with triglycerides (r = 0.234, P < 0.01) and negatively correlated with high-density lipoprotein (r = −0.247, P < 0.01)[37]. Nakamura concluded that the highest quartile of SF was associated with a 1.24-fold (95% CI: 1.15–1.33) increase in the risk of insulin resistance in Japanese men[38]. A retrospective study in South Africa demonstrated that elevated SF levels were significantly related to a higher risk of hypertension (OR = 2.20, 95% CI: 1.24–4.04)[39].
Nevertheless, the pathophysiology of SF-related disease is not entirely understood. However, it might be explained by SF’s role as a signaling factor and direct mediator of the immune system[40]. Ferritin is thought to play a proinflammatory role through the actions of the nuclear factor kappa B (NF-κB) pathway[41]. Cells treated with ferritin may be an independent pathway for activating T-cell immunoglobulin mucin 2, leading to the activation of NF-κB, which increases the production of some proinflammatory mediators. The most common is interleukin (IL)-1β, which causes the body to produce an inflammatory response[42]. Chronic inflammation is considered one of the primary mechanisms underlying MetS[43]. Cai et al. proposed that activation of NF-κB is the core molecular basis of MetS’ pathological process[44].
Furthermore, ferritin can actively participate in the generation of reactive oxygen species[45], which affects the components of MetS. Elevated SF results in an excessive free radical generation that changes into highly cytotoxic hydroxyl groups, leading to tissue damage, lipid peroxidation, and eventually, abnormal lipid metabolism, leading to obesity and hypertriglyceridemia[46,47]. The mechanism by which ferritin affects blood glucose may involve insulin resistance[38]. Excessive reactive oxygen species can reduce insulin receptors’ affinity through the hydroxylation of phenylalanine residues, which affects the level of insulin delivery in the muscle and liver[48]. In addition, elevated ferritin may cause microbial activation and the production of inflammatory substances, such as lipopolysaccharides and lipoteichoic acid, which can damage islet β cells[49]. Insulin resistance is also related to hypertension[50]. In addition, iron overload can also cause vascular oxidative stress and adversely affect vascular activity[51].
The effect of sex on the association between SF level and MetS risk was investigated. The increase in the risk of MetS in males was slightly lower than that in females when SF increased by the same level. Some studies have shown that the SF concentration in males is above 400 μg/L[6,20], although the SF range in males is large. The SF concentration in most females is below 200 μg/L[15,16]. This result suggests that men are at greater risk of MetS than women.
Women of different ages had different SF levels due to physiological factors. We also explored the association between SF level and MetS in the postmenopausal female population. It was found that postmenopausal females had a similar MetS risk as to the total female population. However, a previous study reported that SF in postmenopausal women was not associated with the risk of metabolic disease[52]. The limited number of studies available involving premenopausal women resulted in the difference in the MetS risk in postmenopausal women.
The source of heterogeneity may be explained through our subgroup analysis. No significant differences were found among the different groups divided according to the area of the study population, SF detection method, or study quality. However, significant differences were revealed in the subgroup analysis based on the MetS diagnostic criteria because Wang’s study used criteria from the CDS for diagnosis. Among the three diagnostic criteria groups, the main difference was in the waist circumference. IDF[53] and ATP III[54] define the waist cut point for the Chinese female population as 80 cm, while the CDS waist cut point is 85 cm. Compared with those of other studies, the women in Wang’s study might have been flagged more likely because of false negatives due to this cut point difference. Since the female population accounts for approximately two-thirds of the total study sample size, this may have biased the results. In addition, we removed Wang’s study and reanalyzed the meta-analysis. Although the effect size did not change significantly, the heterogeneity was reduced (I2 = 37.9%) (Supplementary Figure S3 available in www.besjournal.com). It was concluded that Wang’s study caused some heterogeneity due to the difference in the diagnostic criteria.
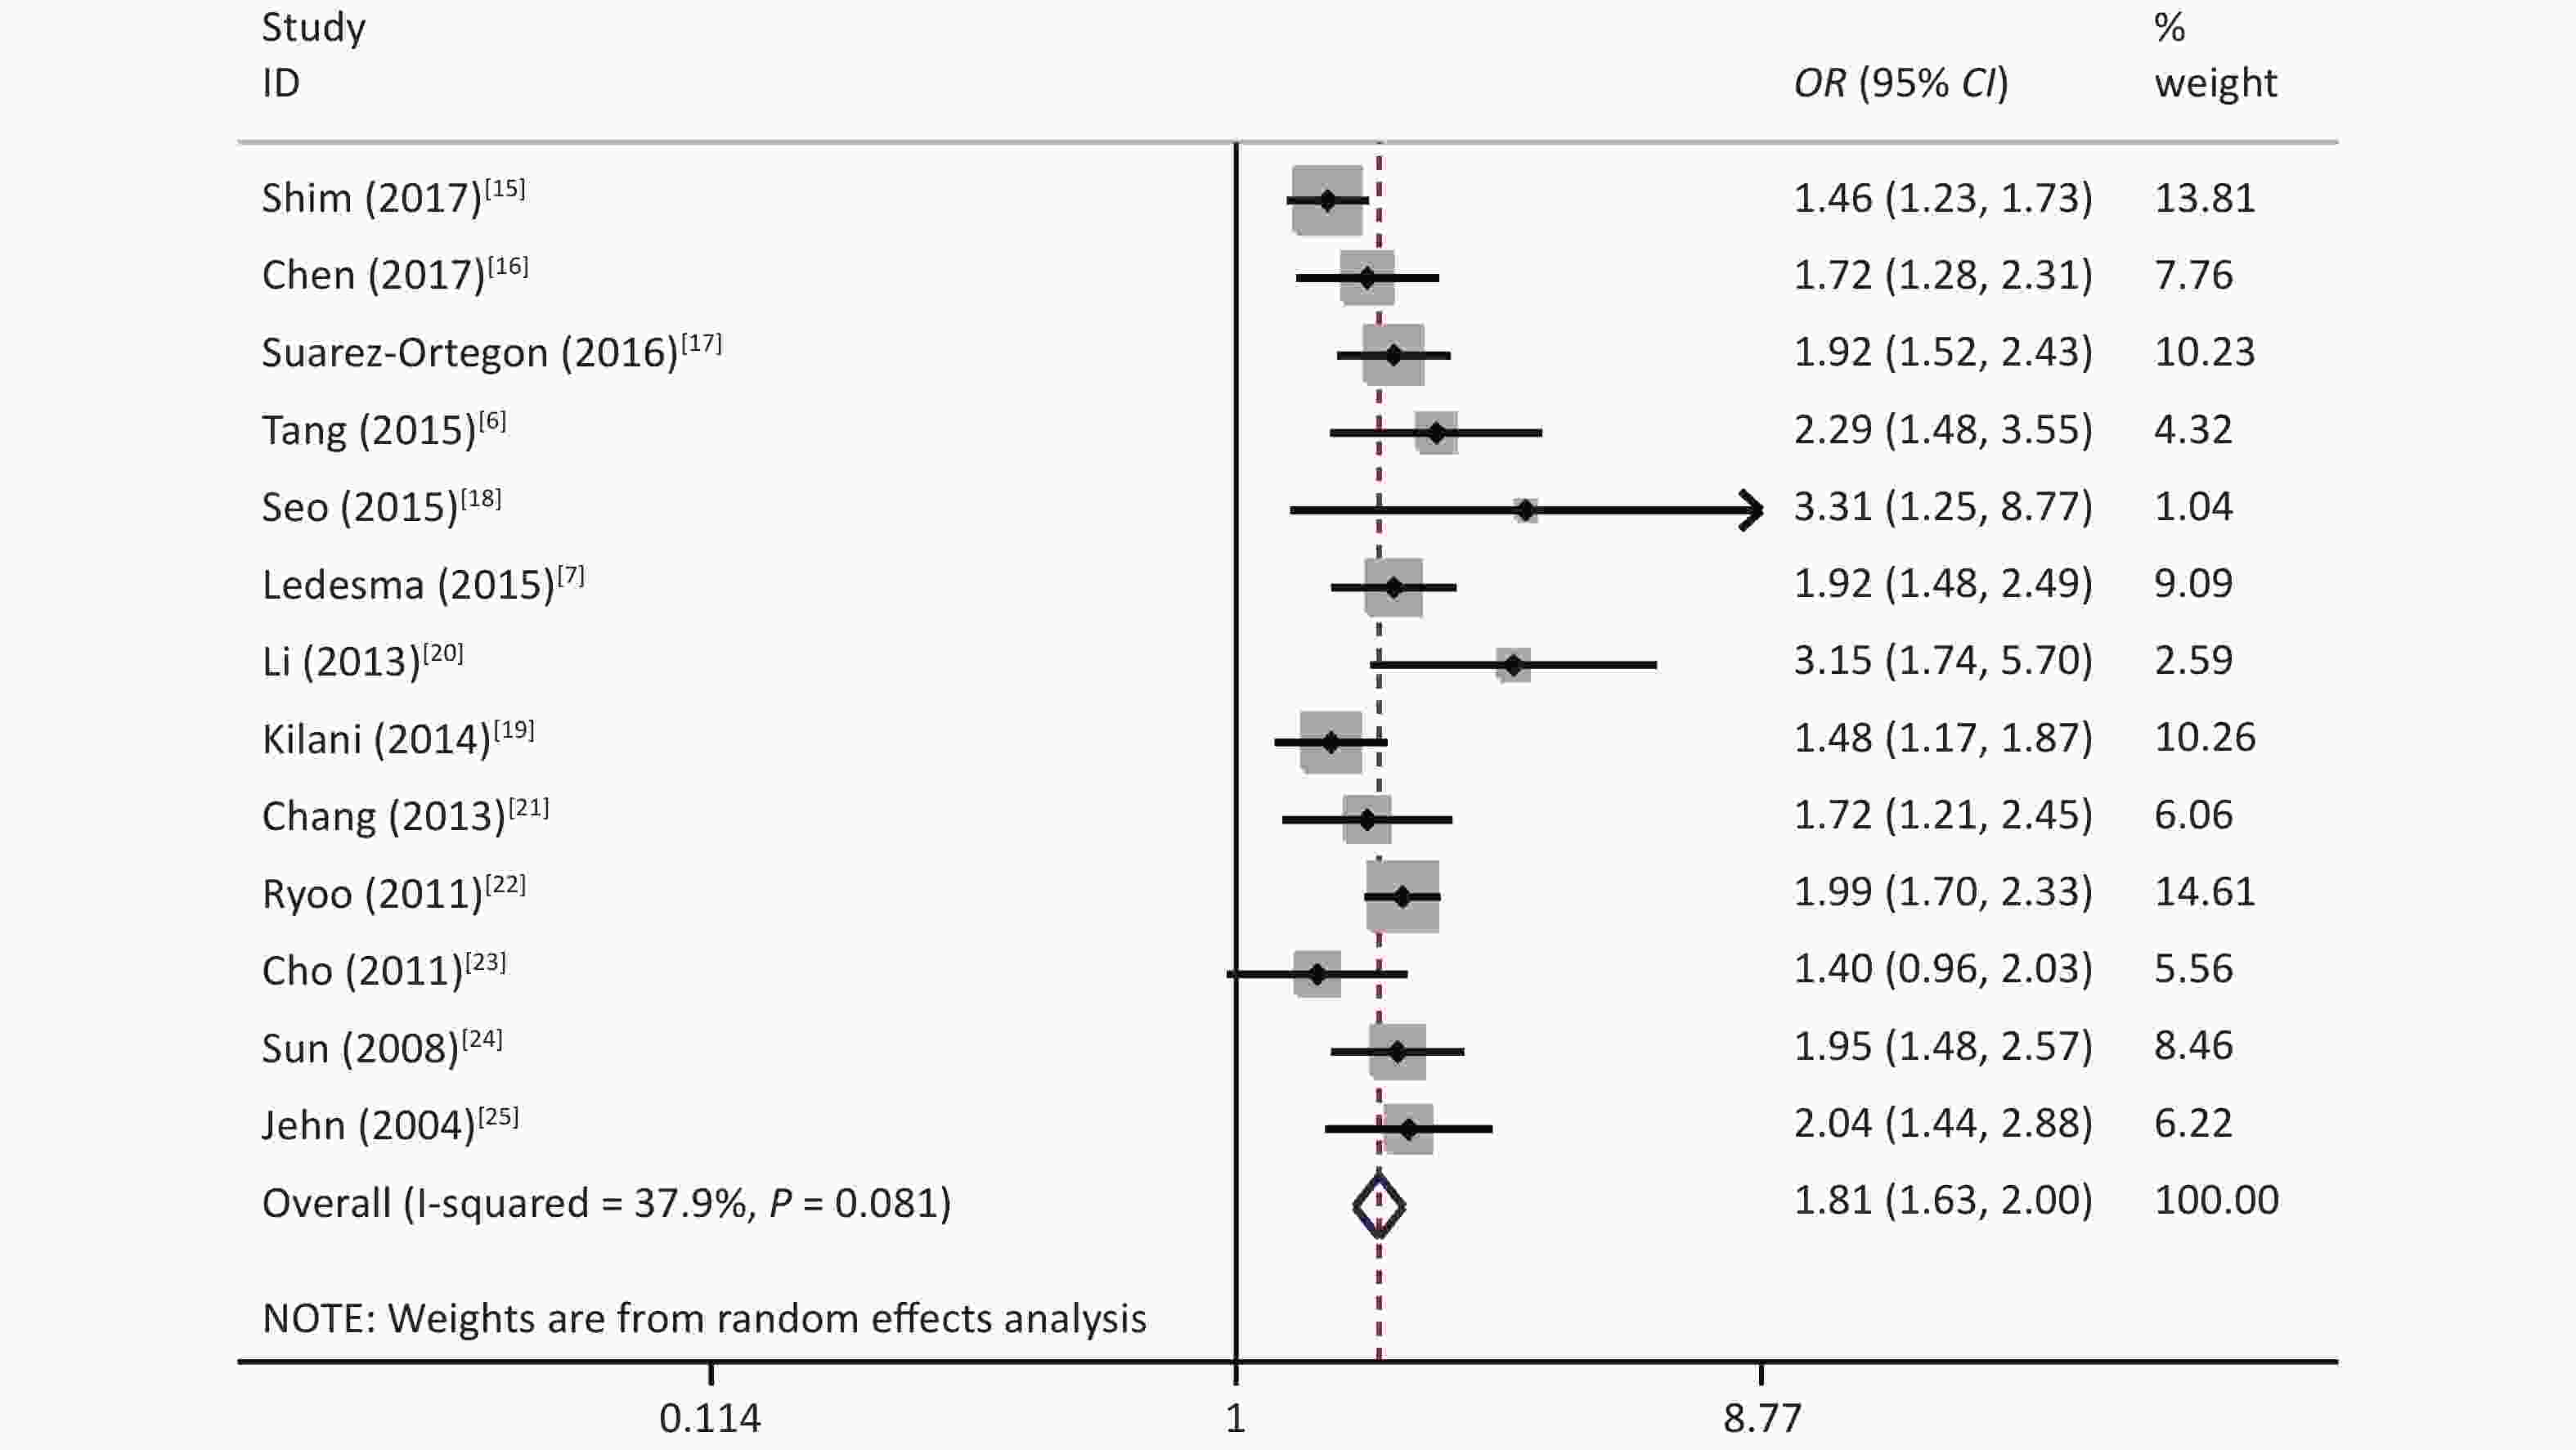
Figure S3. Meta-analysis of 13 studies with Wang’s study excluded
The advantages of this meta-analysis should be acknowledged in this report. All selected articles met the inclusion criteria. The overall study quality was high, which provided a sufficient basis for evaluating relevance. In addition, this study was the first to report the dose-response relationship between male and female populations, increasing the authenticity and reliability of SF in the development of MetS. The results meta-analysis results were robust, but there were some limitations in this study. This systematic review mainly evaluated cross-sectional studies due to the lack of randomized controlled trials and longitudinal studies. Second, because of the limitation that required specific data, only 14 articles were included. Since the literature was too limited to analyze the association in premenopausal women, it was impossible to compare the risk of MetS caused by SF in females during different physiological periods. In addition, the results of this meta-analysis showed some heterogeneity. However, the subgroup analysis revealed that this might be because of different diagnostic criteria.
-
In summary, SF and the prevalence of MetS showed a linear dose-response relationship within a specific range. It was concluded that the risks of MetS differed between the sexes.
Funds:
This study was supported by the National Natural Science Foundation of China [No. U1736201 and 2167701]

 Quick Links
 DownLoad: