


-
Diabetes has become a serious public health concern worldwide, and China is the epidemic center. In China, the prevalence of type 2 diabetes (T2D) was 11.6% among adults aged ≥ 18 years[1]. Cardiovascular disease (CVD) occurs earlier and with greater severity in patients with T2D than in individuals without T2D[2]. Thus, potential risk factors for screening T2D are needed to prevent such poor clinical outcomes. Conventionally, bilirubin is considered a metabolic product of hemoglobin catabolism, participating as anti-inflammatory and anti-oxidant in vivo. Otherwise, oxidative stress and inflammation have been implicated in the underlying pathogenesis of T2D. However, epidemiological studies investigating the relationship between serum total bilirubin levels and T2D in a prospective cohort are limited in the Chinese population, and the findings remain inconsistent. Yang et al. found that low levels of serum total bilirubin were associated with a significantly increased risk of T2D after a 3-year follow-up[3]. Meanwhile, the findings of Wang et al. did not support the protective association of serum total bilirubin levels with incident T2D[4]. Considering the inconsistent results from previous studies, this study aimed to prospectively investigate the relationship between baseline serum total bilirubin levels and risk of progressing T2D with an average follow-up of 4.4 years in middle-aged and older Chinese individuals.
The study population was recruited from Jia Ding, Shanghai, China. Briefly, all participants were invited to go through a comprehensive investigation immediately, which included a face-to-face questionnaire, anthropometric and biochemical measurements, and a standard 75-g oral glucose tolerance test (OGTT). A total of 10,375 eligible residents aged ≥ 40 years were recruited at baseline (from March to August 2010), and 2,374 participants were excluded based on the following conditions: 1) history of liver cancer, liver cirrhosis, hepatitis, and autoimmune disease (n = 378); 2) missing data of OGTT 0 or 2 hours, or participants with known T2D (n = 1,588); 3) serum aspartate aminotransferase (AST), alanine aminotransferase (ALT), or γ-glutamyltransferase (GGT) equals to or higher than triple the normal upper limit (AST or ALT ≥ 192 U/L, GGT ≥ 150 U/L) and serum total bilirubin ≥ 34.2 μmol/L to rule out clinical jaundice (n = 138); and (4) missing data of serum total bilirubin (n = 3). From August 2014 to May 2015, all eligible participants at baseline were invited to attend a follow-up visit, which included a 75-g OGTT and a standard questionnaire to collect information on the history of diseases and medications. Then, 3,002 baseline participants who died during the follow-up, did not attend the follow-up visit, or had missing data of the OGTT at 0 or 2 hours during follow-up were further excluded. Finally, 4,999 participants were included in this analysis.
In this study, those who smoked cigarettes or consumed alcohol regularly in the past 6 months were defined as current smokers or drinkers. The International Physical Activity Questionnaire was used to assess physical activity, and average weekly energy expenditure was estimated by calculating the metabolic equivalent (MET)[5]. Vigorous physical activity was defined as ≥ 600 MET-min per week.
Anthropometric measurements included body weight and height, and body mass index (BMI) was calculated by weight (kg)/height2 (m2). Blood pressure (BP), including systolic BP (SBP) and diastolic BP (DBP), was measured three times, and the three records were averaged for final analysis.
Fasting plasma glucose (FPG) and 2-hour plasma glucose (2h-PG) from OGTT were measured by the glucose oxidize method using Modular P800 (Roche, Basel, Switzerland). Serum total bilirubin, AST, ALT, GGT, total cholesterol (TC), low-density lipoprotein cholesterol (LDL-c), high-density lipoprotein cholesterol (HDL-c), and triglycerides (TG) were evaluated by the chemiluminescence method, using Modular E170 (Roche, Basel, Switzerland). Following the 1999 World Health Organization criteria, T2D was defined as FPG ≥ 7.0 mmol/L or 2h-PG ≥ 11.1 mmol/L or the use of antidiabetic medications.
The study was performed according to the Declaration of Helsinki. The study protocol was approved by the Medical Ethics Committee of the Rui Jin Hospital affiliated with Shanghai Jiao Tong University School of Medicine (Ethics committee reference no. No.14, 2011). All participants signed an informed consent form.
Baseline characteristic data of the study population are presented as the mean ± standard deviation (SD) or as the median (interquartile range) for skewed variables, while categorical data are shown in proportions. Continues variables were compared with a one-way analysis of variance, and categorical variables were compared with χ2 test. The study population was divided into four groups according to quartiles of baseline serum total bilirubin levels. The cut-off points were 1.1 μmol/L ≤ Q1 ≤ 9.8 μmol/L, 9.8 μmol/L < Q2 ≤ 12.4 μmol/L, 12.4 μmol/L < Q3 ≤ 15.8 μmol/L, and 15.8 μmol/L < Q4 ≤ 34.1 μmol/L, respectively. Pfor trends through baseline serum total bilirubin quartiles were calculated in the regression model using baseline serum total bilirubin quartiles as an ordinal variable. Logistic regression analysis was used to evaluate the association of baseline serum total bilirubin with the risk of progressing T2D in men and women separately. Potential confounders were measured at baseline and were adjusted for in the analysis. Model 1 was unadjusted. Model 2 was adjusted for age, BMI, smoking and drinking status (current or not), education level (above high school or not), and physical activity (vigorous or not). Model 3 was further adjusted for SBP, TC, and TG based on model 2. In addition, stratified analysis was performed on the association of baseline serum total bilirubin with incident T2D according to different glucose metabolism states at baseline. All P values were two-sided, and all statistical analyses were performed using SAS version 9.4 (SAS Institute Inc., Cary, NC).
The mean baseline age of this study population was 57 ± 9 years, and 1,707 (34.15%) participants were men. The mean level of baseline serum total bilirubin was 13.34 ± 5.04 μmol/L, and a statistical difference of serum total bilirubin at baseline was observed between normal glucose tolerance and T2D (13.20 ± 5.01 μmol/L vs. 13.80 ± 5.22 μmol/L; P = 0.0082). Then, the study population was divided into four groups according to quartiles of baseline serum total bilirubin levels; the mean serum total bilirubin levels were 8.03 ± 1.37 μmol/L, 11.15 ± 0.74 μmol/L, 14.00 ± 0.97 μmol/L, and 20.32 ± 4.01 μmol/L from quartile 1 to quartile 4, respectively (Table 1). With the increment of baseline serum total bilirubin quartiles, participants tended to be older, with higher levels of SBP, DBP, ALT, AST, GGT, and HDL-c and lower levels of TC, TG, and LDL-c (all Pfor trend < 0.05; Table 1). Moreover, the proportion of men, current smokers, current drinkers, and participants with vigorous physical activity also increased with serum total bilirubin quartiles (all Pfor trend < 0.05). No significant trend differences were found between baseline serum total bilirubin quartiles and BMI, FPG, 2h-PG, proportion of high school or above, and family history of T2D (all Pfor trend > 0.05).
Variables Total (n = 4,999) Serum total bilirubin (μmol/L) Pfor trend Q1 (n = 1,261) Q2 (n = 1,267) Q3 (n = 1,230) Q4 (n = 1,241) Serum total bilirubin, μmol/L 13.34 ± 5.04 8.03 ± 1.37 11.15 ± 0.74 14.00 ± 0.97 20.32 ± 4.01 − Age, years 57 ± 9 56 ± 9 57 ± 8 58 ± 9 59 ± 9 < 0.0001 Men, n (%) 1,707 (34.15) 282 (22.36) 353 (27.86) 459 (37.32) 613 (49.40) < 0.0001 BMI, kg/m2 24.95 ± 3.14 24.94 ± 3.15 24.89 ± 3.15 25.01 ± 3.15 24.99 ± 3.10 0.5025 SBP, mmHg 140 ± 19 138 ± 19 140 ± 20 140 ± 19 140 ± 20 0.0178 DBP, mmHg 83 ± 10 82 ± 10 83 ± 10 83 ± 10 83 ± 10 0.0107 High school or above, n (%) 980 (19.69) 251 (20.00) 235 (18.64) 253 (20.65) 241 (19.50) 0.9199 Family history of DM, n (%) 447 (8.96) 112 (8.88) 116 (9.18) 106 (8.62) 113 (9.13) 0.9607 Current smoker, n (%) 928 (18.56) 197 (15.62) 208 (16.42) 227 (18.46) 296 (23.58) < 0.0001 Current drinker, n (%) 461 (9.22) 75 (5.95) 110 (8.68) 108 (8.78) 168 (13.54) < 0.0001 Vigorous physical activity,
n (%)2,953 (59.07) 700 (55.51) 749 (59.12) 751 (61.06) 753 (60.68) 0.0050 ALT, U/L 17.6 (13.6–23.9) 16.8 (13.2–22.3) 17.2 (13.5–23.2) 18.1 (13.7–25.0) 18.2 (14.1–25.0) < 0.0001 AST, U/L 21.5 (18.4–25.2) 21.0 (18.0–24.4) 21.6 (18.5–25.2) 21.5 (18.7–25.2) 21.9 (18.7–25.7) < 0.0001 GGT, U/L 20 (14–30) 19 (14–28) 19 (14–30) 21 (14–32) 22 (15–33) < 0.0001 TC, mmol/L 5.34 ± 0.99 5.40 ± 1.13 5.41 ± 0.97 5.34 ± 0.91 5.23 ± 0.92 < 0.0001 TG, mmol/L 1.32 (0.95–1.87) 1.41 (0.99–2.08) 1.30 (0.95–1.82) 1.29 (0.94–1.82) 1.31 (0.94–1.83) < 0.0001 LDL-C, mmol/L 3.20 ± 0.84 3.20 ± 0.92 3.26 ± 0.86 3.21 ± 0.77 3.12 ± 0.80 0.0074 HDL-C, mmol/L 1.34 ± 0.32 1.30 ± 0.31 1.37 ± 0.31 1.36 ± 0.33 1.35 ± 0.32 0.0010 FPG, mmol/L 5.10 ± 0.57 5.09 ± 0.55 5.12 ± 0.56 5.10 ± 0.57 5.11 ± 0.58 0.7319 2h-PG, mmol/L 6.66 ± 1.74 6.55 ± 1.65 6.73 ± 1.80 6.66 ± 1.74 6.69 ± 1.76 0.1267 Note. Data are expressed as mean ± SD, median (interquartile range) or as n (%). Serum total bilirubin quartiles cut-off points: 1.1 μmol/L ≤ Q1 ≤ 9.8 μmol/L, 9.8 μmol/L < Q2 ≤ 12.4 μmol/L, 12.4 μmol/L < Q3 ≤ 15.8 μmol/L, 15.8 μmol/L < Q4 ≤ 34.1 μmol/L. Pfor trend was calculated from CMH chi-square tests for categorical variables and linear regression analysis for continuous variables. Abbreviation: BMI, body mass index; SBP, systolic blood pressure; DBP, diastolic blood pressure; DM, diabetes mellitus; ALT, alanine transaminase; AST, aspartate transaminase; GGT, γ-glutamyltransferase; TC, total cholesterol; TG, triglycerides; LDL-C, low-density lipoprotein; HDL-C, high-density lipoprotein; FPG, fasting plasma glucose; 2h-PG, 2-h post-load plasma glucose. Table 1. Baseline characteristics of the study participants according to serum total bilirubin quartiles
During an average 4.4 years of follow-up, of 4,999 participants without known T2D at baseline, 615 (12.30%) progressed to T2D. In men, from the lowest to the highest baseline serum total bilirubin quartile, the prevalence of T2D was 9.93%, 13.03%, 14.16%, and 14.36%, respectively (Table 2), and the serum total bilirubin levels had no significant association with increased risk of T2D neither in the unadjusted model nor in the fully adjusted one. In women, from the lowest to the highest baseline serum total bilirubin quartile, the prevalences of T2D were 10.11%, 12.80%, 11.54%, and 13.22% (Table 2). Similar to the data in men, serum total bilirubin was not significantly associated with the risk of progressing T2D in women. When adjusted for age, BMI, education level, smoking and drinking status, and physical activity, similar results were observed. However, after further adjustment for SBP, TC, and TG, based on model 2, the results showed statistical significance. The odds ratios (ORs) and 95% confidence interval (95% CIs) for baseline serum total bilirubin quartile 2 to quartile 4 vs. quartile 1 as the reference were 1.377 (1.024–1.851), 1.206 (0.879–1.653), and 1.448 (1.048–2.002) in women, respectively (Table 2). Thus, our study found that elevated baseline serum total bilirubin was significantly associated with incident T2D in women, even after adjusting the traditional risk factors. By contrast, Yang et al. found that in patients with impaired fasting glucose (IFG) and impaired glucose tolerance, lower serum total bilirubin was associated with a significantly increased risk of T2D after a 3-year follow-up in a Chinese population[3]. Age and race might be the major explanation for the inconsistent results. Previous studies have discovered that serum total bilirubin levels were increased in older people[6,7]. In our study, the mean age of the study population was relatively older (mean age, 57 ± 9 years). In addition, the serum total bilirubin levels of our study population were obviously higher than those in a Dutch study (the mean serum total bilirubin levels were 13.34 ± 5.04 μmol/L in our study vs. 7.7 ± 3.6 μmol/L in the Dutch study)[7]. Furthermore, in the Dutch study, 95% of the participants had serum total bilirubin levels lower than 10 μmol/L[7], while in our study, 75% of the participants had serum total bilirubin levels above 10 μmol/L (1.1 μmol/L ≤ serum total bilirubin Q1 ≤ 9.8 μmol/L). Therefore, the results from the Dutch population could not be directly applied to a Chinese cohort.
Variables Serum total bilirubin, odds ratios (95% confidence interval) Pfor trend Q1 Q2 Q3 Q4 Men No. of case/participants 28/282 46/353 65/459 88/613 − Prevalence (%) 9.93 13.03 14.16 14.36 0.0849 Model 1 1.00 1.359 (0.826–2.237) 1.497 (0.935–2.395) 1.521 (0.969–2.387) 0.0854 Model 2 1.00 1.296 (0.777–2.160) 1.413 (0.871–2.293) 1.421 (0.892–2.265) 0.1685 Model 3 1.00 1.263 (0.754–2.115) 1.394 (0.855–2.273) 1.397 (0.872–2.237) 0.1851 Women No. of case/participants 99/979 117/914 89/771 83/628 − Prevalence (%) 10.11 12.80 11.54 13.22 0.1081 Model 1 1.00 1.305 (0.982–1.734) 1.160 (0.857–1.571) 1.354 (0.992–1.847) 0.1083 Model 2 1.00 1.318 (0.985–1.765) 1.151 (0.843–1.572) 1.370 (0.996–1.883) 0.1126 Model 3 1.00 1.377 (1.024–1.851) 1.206 (0.879–1.653) 1.448 (1.048–2.002) 0.0581 Note. Model 1: unadjusted. Model 2: adjusted for age, body mass index, education level, smoking, and drinking status, and physical activity. Model 3: further adjusted for systolic blood pressure, total cholesterol, and triglycerides. Table 2. Risk of progressing diabetes according to baseline serum total bilirubin quartiles by sex
The association of increased serum total bilirubin levels with incident T2D may be attributed to the heme oxygenase (HO) system, and HO-1 has been reported as a strong positive predictor of metabolic inflammation among insulin-resistant and obese animals[8]. Meanwhile, evidence from population studies revealed that HO-1 levels were increased in new-onset T2D[9]. Thus, the elevated levels of serum total bilirubin might be an indicator of oxidative stress and inflammation in new-onset T2D. However, in chronic T2D, HO may be adapted to the long-term oxidative stress, induced by the persistent state of hyperglycemia, and finally resulted in a decrease of HO-1 expression[10]. Therefore, chronic T2D might make up for the lower levels of serum total bilirubin levels. This could partially explain why serum total bilirubin levels were negatively associated with risk of T2D in most cross-sectional studies.
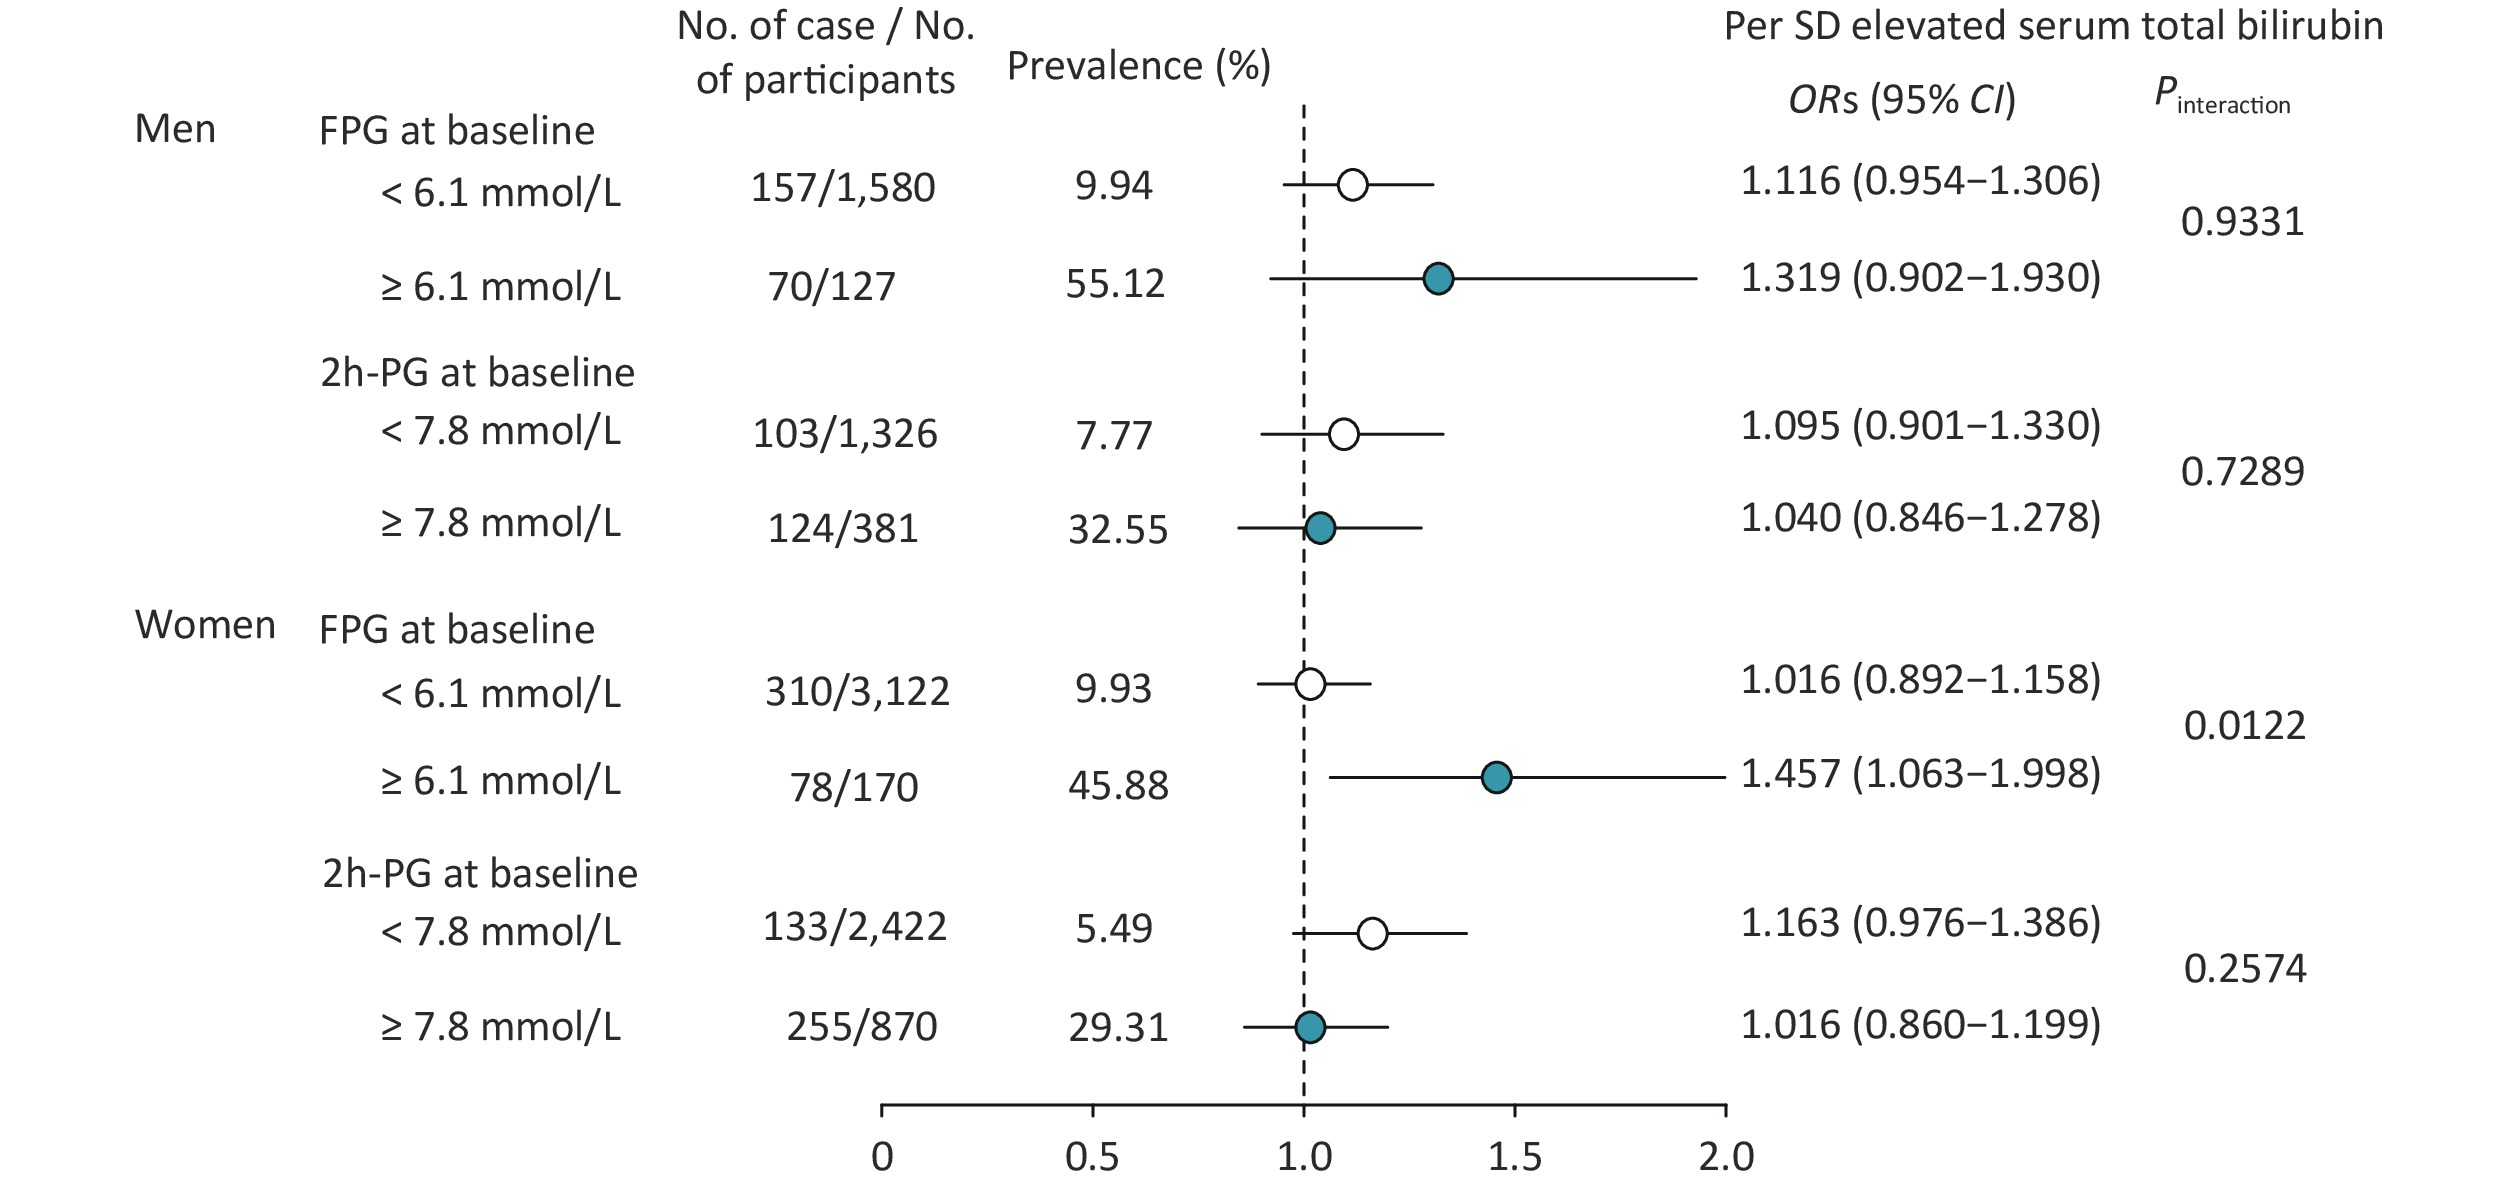
Stratified analysis was also conducted for baseline serum total bilirubin levels and risk of progressing T2D according to baseline glucose tolerance status in men and women separately (Figure 1). After full adjustment for age, BMI, education levels, smoking and drinking status, physical activity, SBP, TC, and TG, a significant interaction was found between FPG level at baseline in women (Pinteraction = 0.0122; Figure 1), but not in men, and no interaction was found between the 2h-PG level at baseline neither in men nor in women. With per SD (5.04 mmol/L) increment of baseline serum total bilirubin, the risk of T2D increased 45.7% in women [OR (95% CIs): 1.457 (1.063–1.998); Figure 1]. Thus, in this study, we also found that baseline glucose status would influence the relationship of serum total bilirubin and the risk of progressing T2D in women; this means that those who had both IFG and higher serum total bilirubin at baseline had a relatively higher risk of incident T2D.
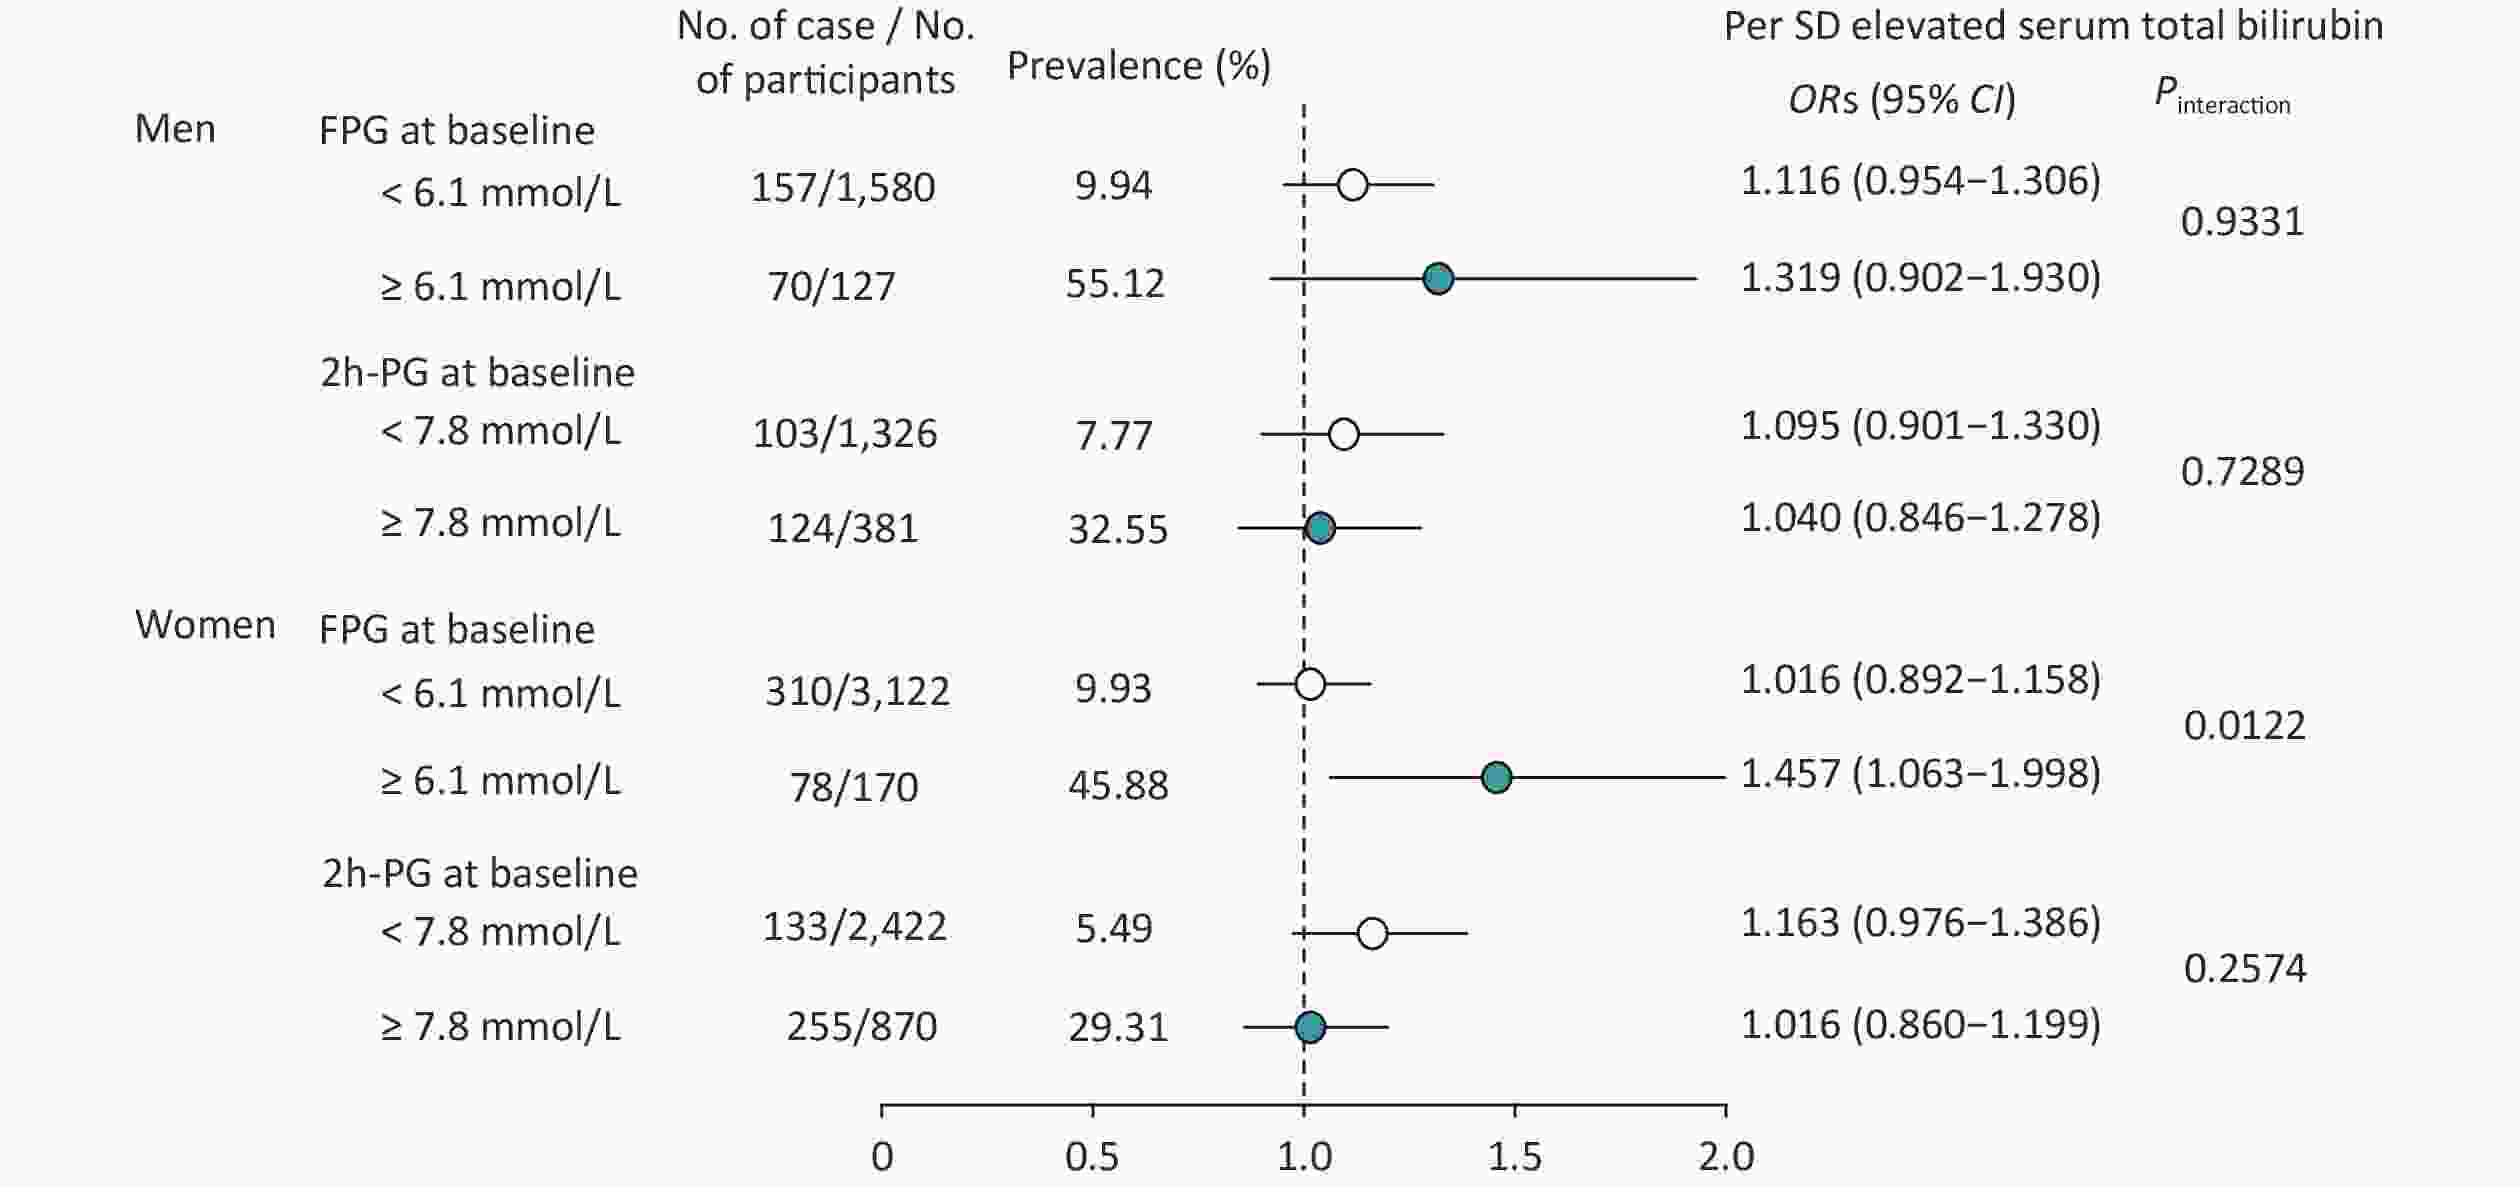
Figure 1. Risk of progressing diabetes according to per SD elevated baseline serum total bilirubin and glucose tolerance status by sex. The model was adjusted for age, body mass index, education level, smoking and drinking status, physical activity, systolic blood pressure, total cholesterol, and triglycerides. Abbreviation: ORs (95% CI), odds ratios (95% CI); FPG, fasting plasma glucose; 2h-PG, 2-h post-load plasma glucose.
In conclusion, with a 4.4-year follow-up, we observed that elevated baseline serum total bilirubin levels showed a significant positive association with the risk of progressing T2D in middle-aged and older Chinese women, especially in those who had elevated FPG at baseline. This positive association remained significant even after adjustment for conventional risk factors, highlighting that serum total bilirubin may play a crucial role in the development of T2D. These findings provided new evidence that middle-aged and older Chinese individuals should pay more attention to their serum total bilirubin level to prevent T2D.
Acknowledgments We thank all the study participants for their participation and contribution.
Conflict of Interest The authors declare no conflict of interest.
Author Contributions JZ, YZ, and YC had access to all data and take responsibility for its integrity and analysis. JZ and JL conceived the hypotheses and analyses. JZ drafted the paper and provided statistical analysis. CH, YZ, HQ, and LL collected the data. YZ, YX, JL, YB, WW, YC, and GN refined the interpretation and the final manuscript. All authors were involved in writing the paper and had final approval of the submitted and published versions.
HTML
Reference

 Quick Links
 DownLoad: