


-
With a global prevalence of 7.7 million, ischemic stroke (IS) is one of the leading causes of death and disability worldwide. In China, IS alone contributed to 69.6% of stroke events and accounted for 37.1% of the mortality/disability rate[1]. IS is a complex disease that is known to be associated with various genetic variants and clinical and lifestyle risk factors[2]. Genome‐wide association studies (GWAS) provided evidence for the occurrence of more than 160 IS‐associated single nucleotide polymorphisms (SNPs). In terms of clinical risk factors, patients with a history of chronic diseases like hypertension, dyslipidemia, and diabetes mellitus, display a higher risk of developing IS. Among the various lifestyle components, leading a sedentary lifestyle, smoking, and having an unhealthy diet are known to be associated with the risk of IS. Thus, integration of various genetic, clinical, and lifestyle variables might prove to be highly beneficial in the prediction and prevention of IS at the individual level[3].
The present study aimed to construct a risk prediction model for IS by simultaneous incorporation of both genetic variants and clinical/lifestyle indicators. The study involved a prospective cohort of the Southern Chinese population. It is expected that the proposed model could be validated externally, and the obtained significant features would assist in the interpretation of IS risk in the Chinese population, with a particular focus on IS risk prediction at the individual level.
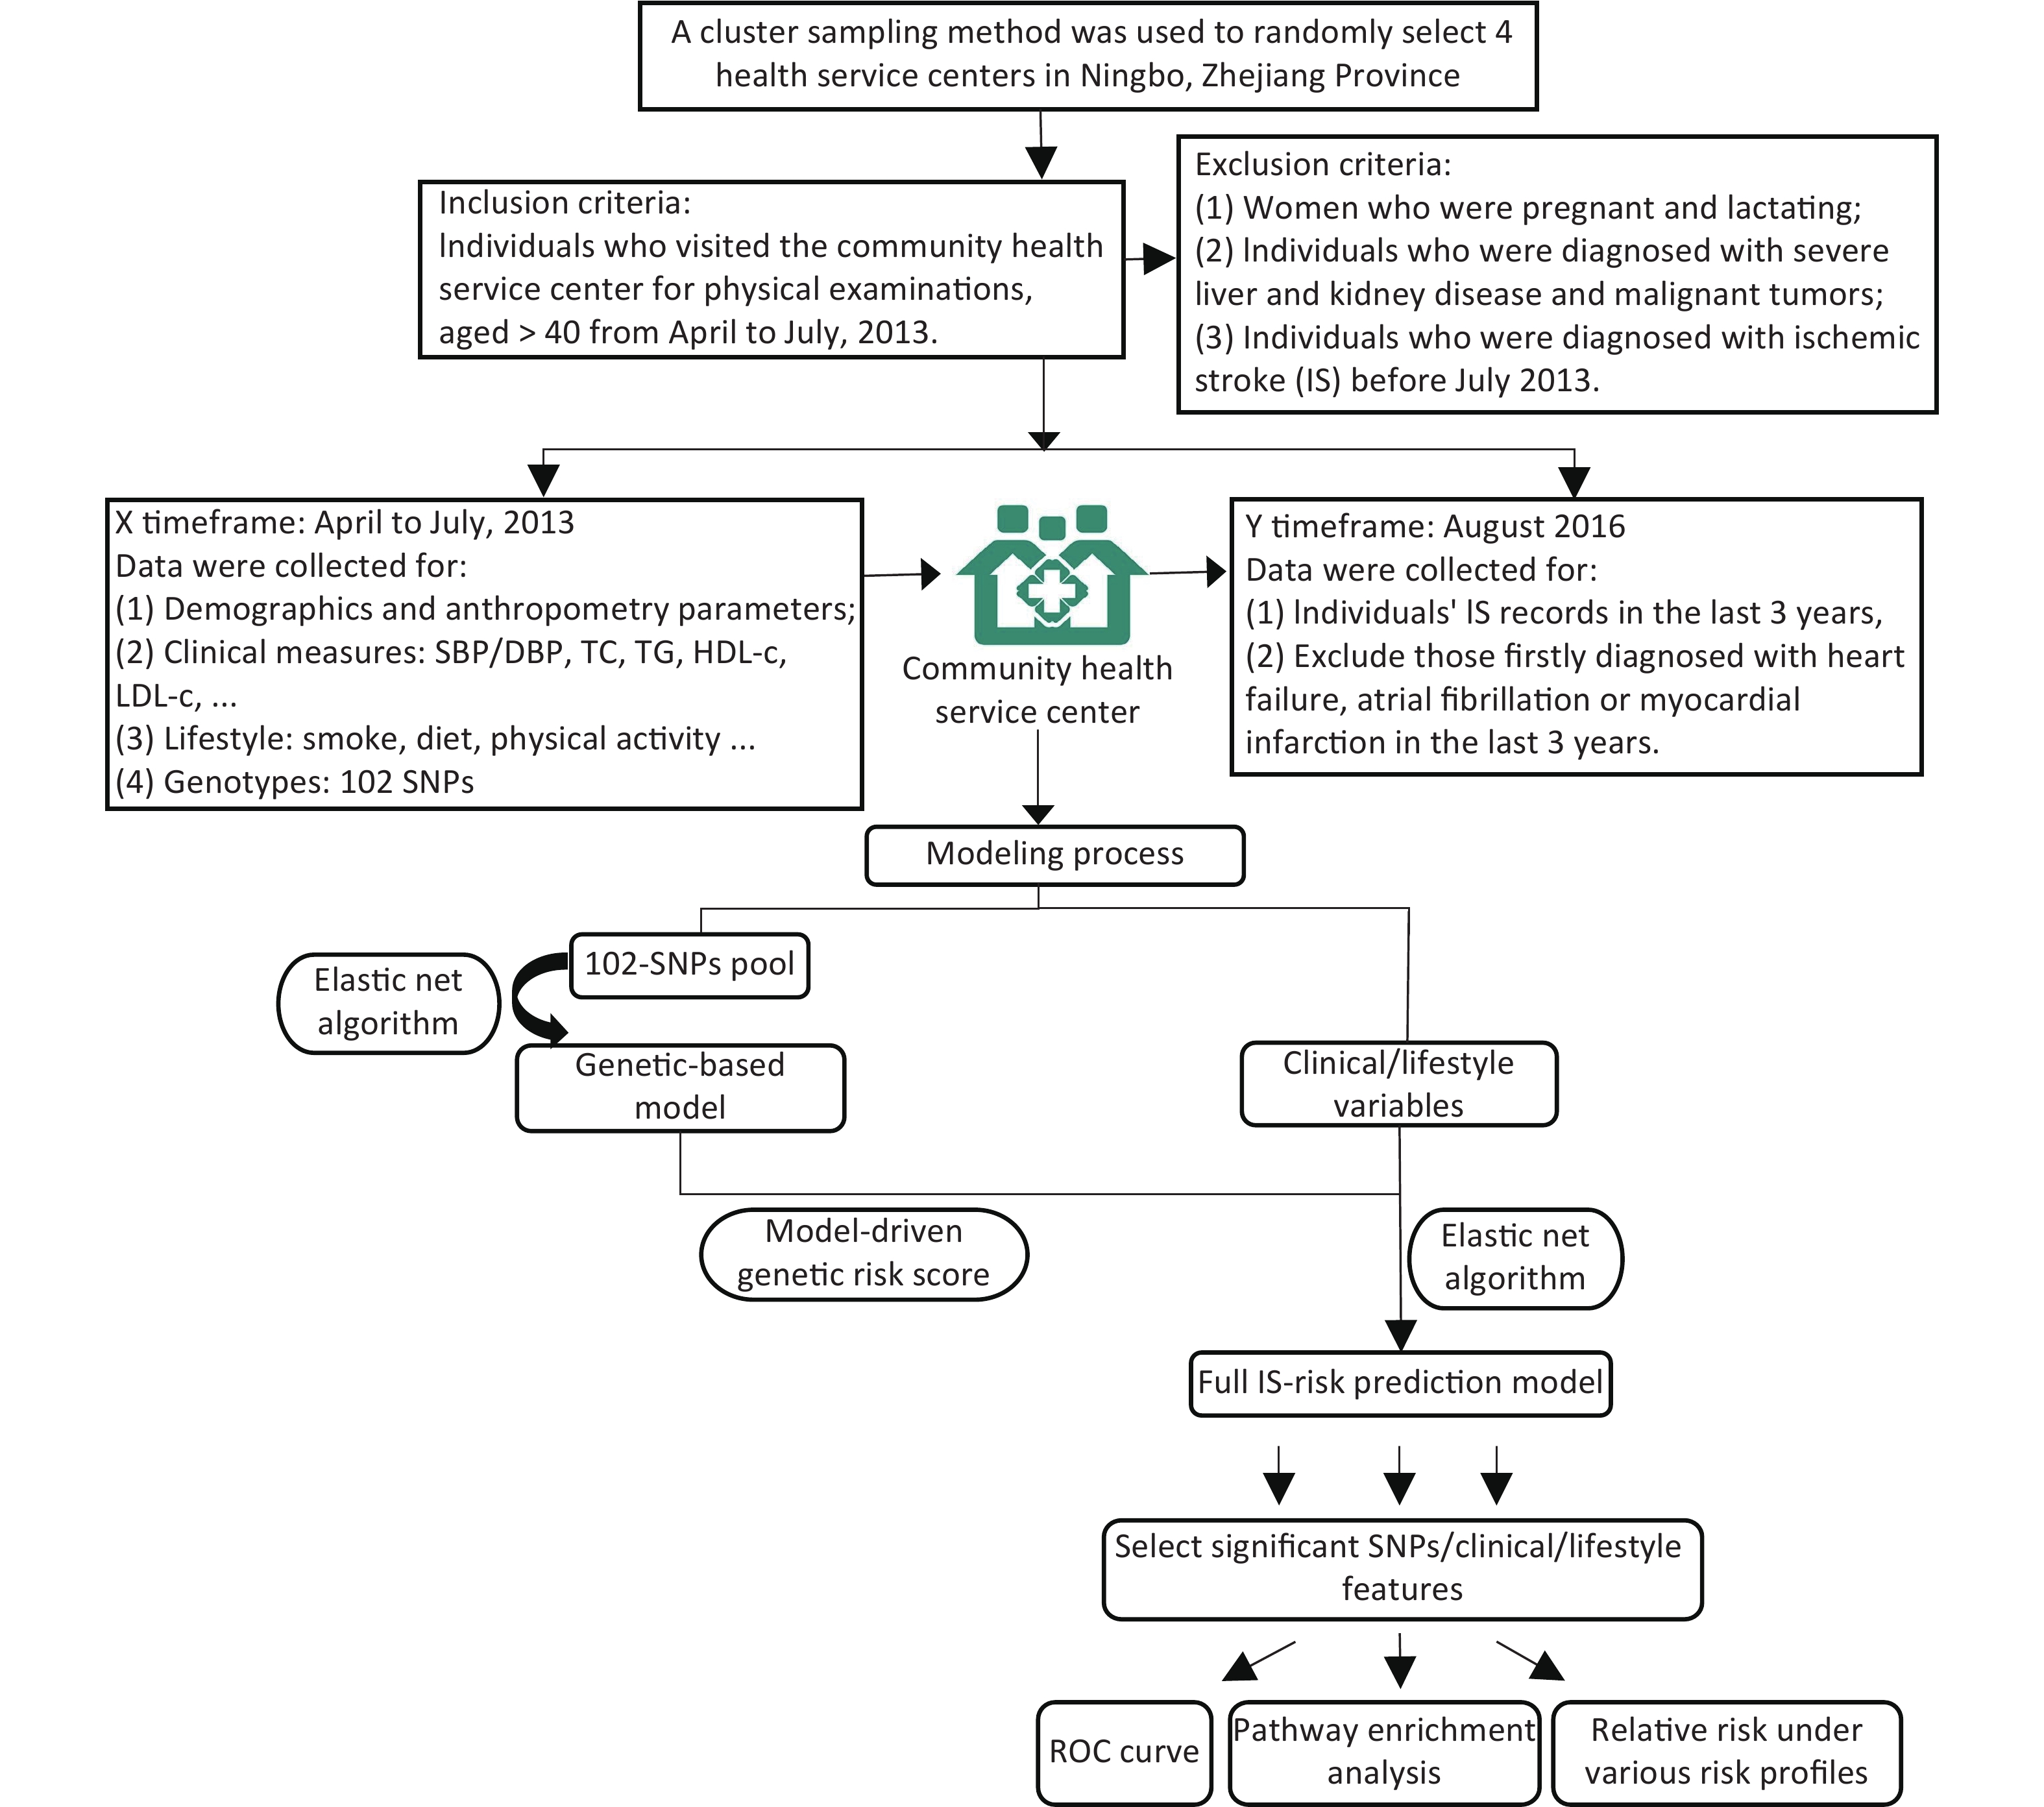
The study was conducted on subjects belonging to four community health service centers in the Ningbo City of Zhejiang Province. Initially, a total of 2,349 participants aged ≥ 40 years without any history of IS were recruited from April–July 2013. Detailed inclusion and exclusion criteria followed in the present study are described in Supplementary Figure S1 (available in www.besjournal.com). The clinical and physical parameters included in the present study were strictly defined. The information regarding the demographic and lifestyle characteristics of the subjects was collected using a standard questionnaire. The salient features of the questionnaire are demonstrated in Supplementary Table S1 (available in www.besjournal.com). After a follow up period of three years, the updated records for each participant containing information regarding the occurrence of any IS incidence were obtained from the electronic health record database. During this 3-year follow up, the individuals that were first diagnosed with heart failure, atrial fibrillation, or myocardial infarction were excluded from the study as such diagnoses might lead to significant changes in their lifestyles, which might further act as confounding factors in the present study. Consequently, 236 participants were excluded, and a total of 2,113 individuals were included in the study.
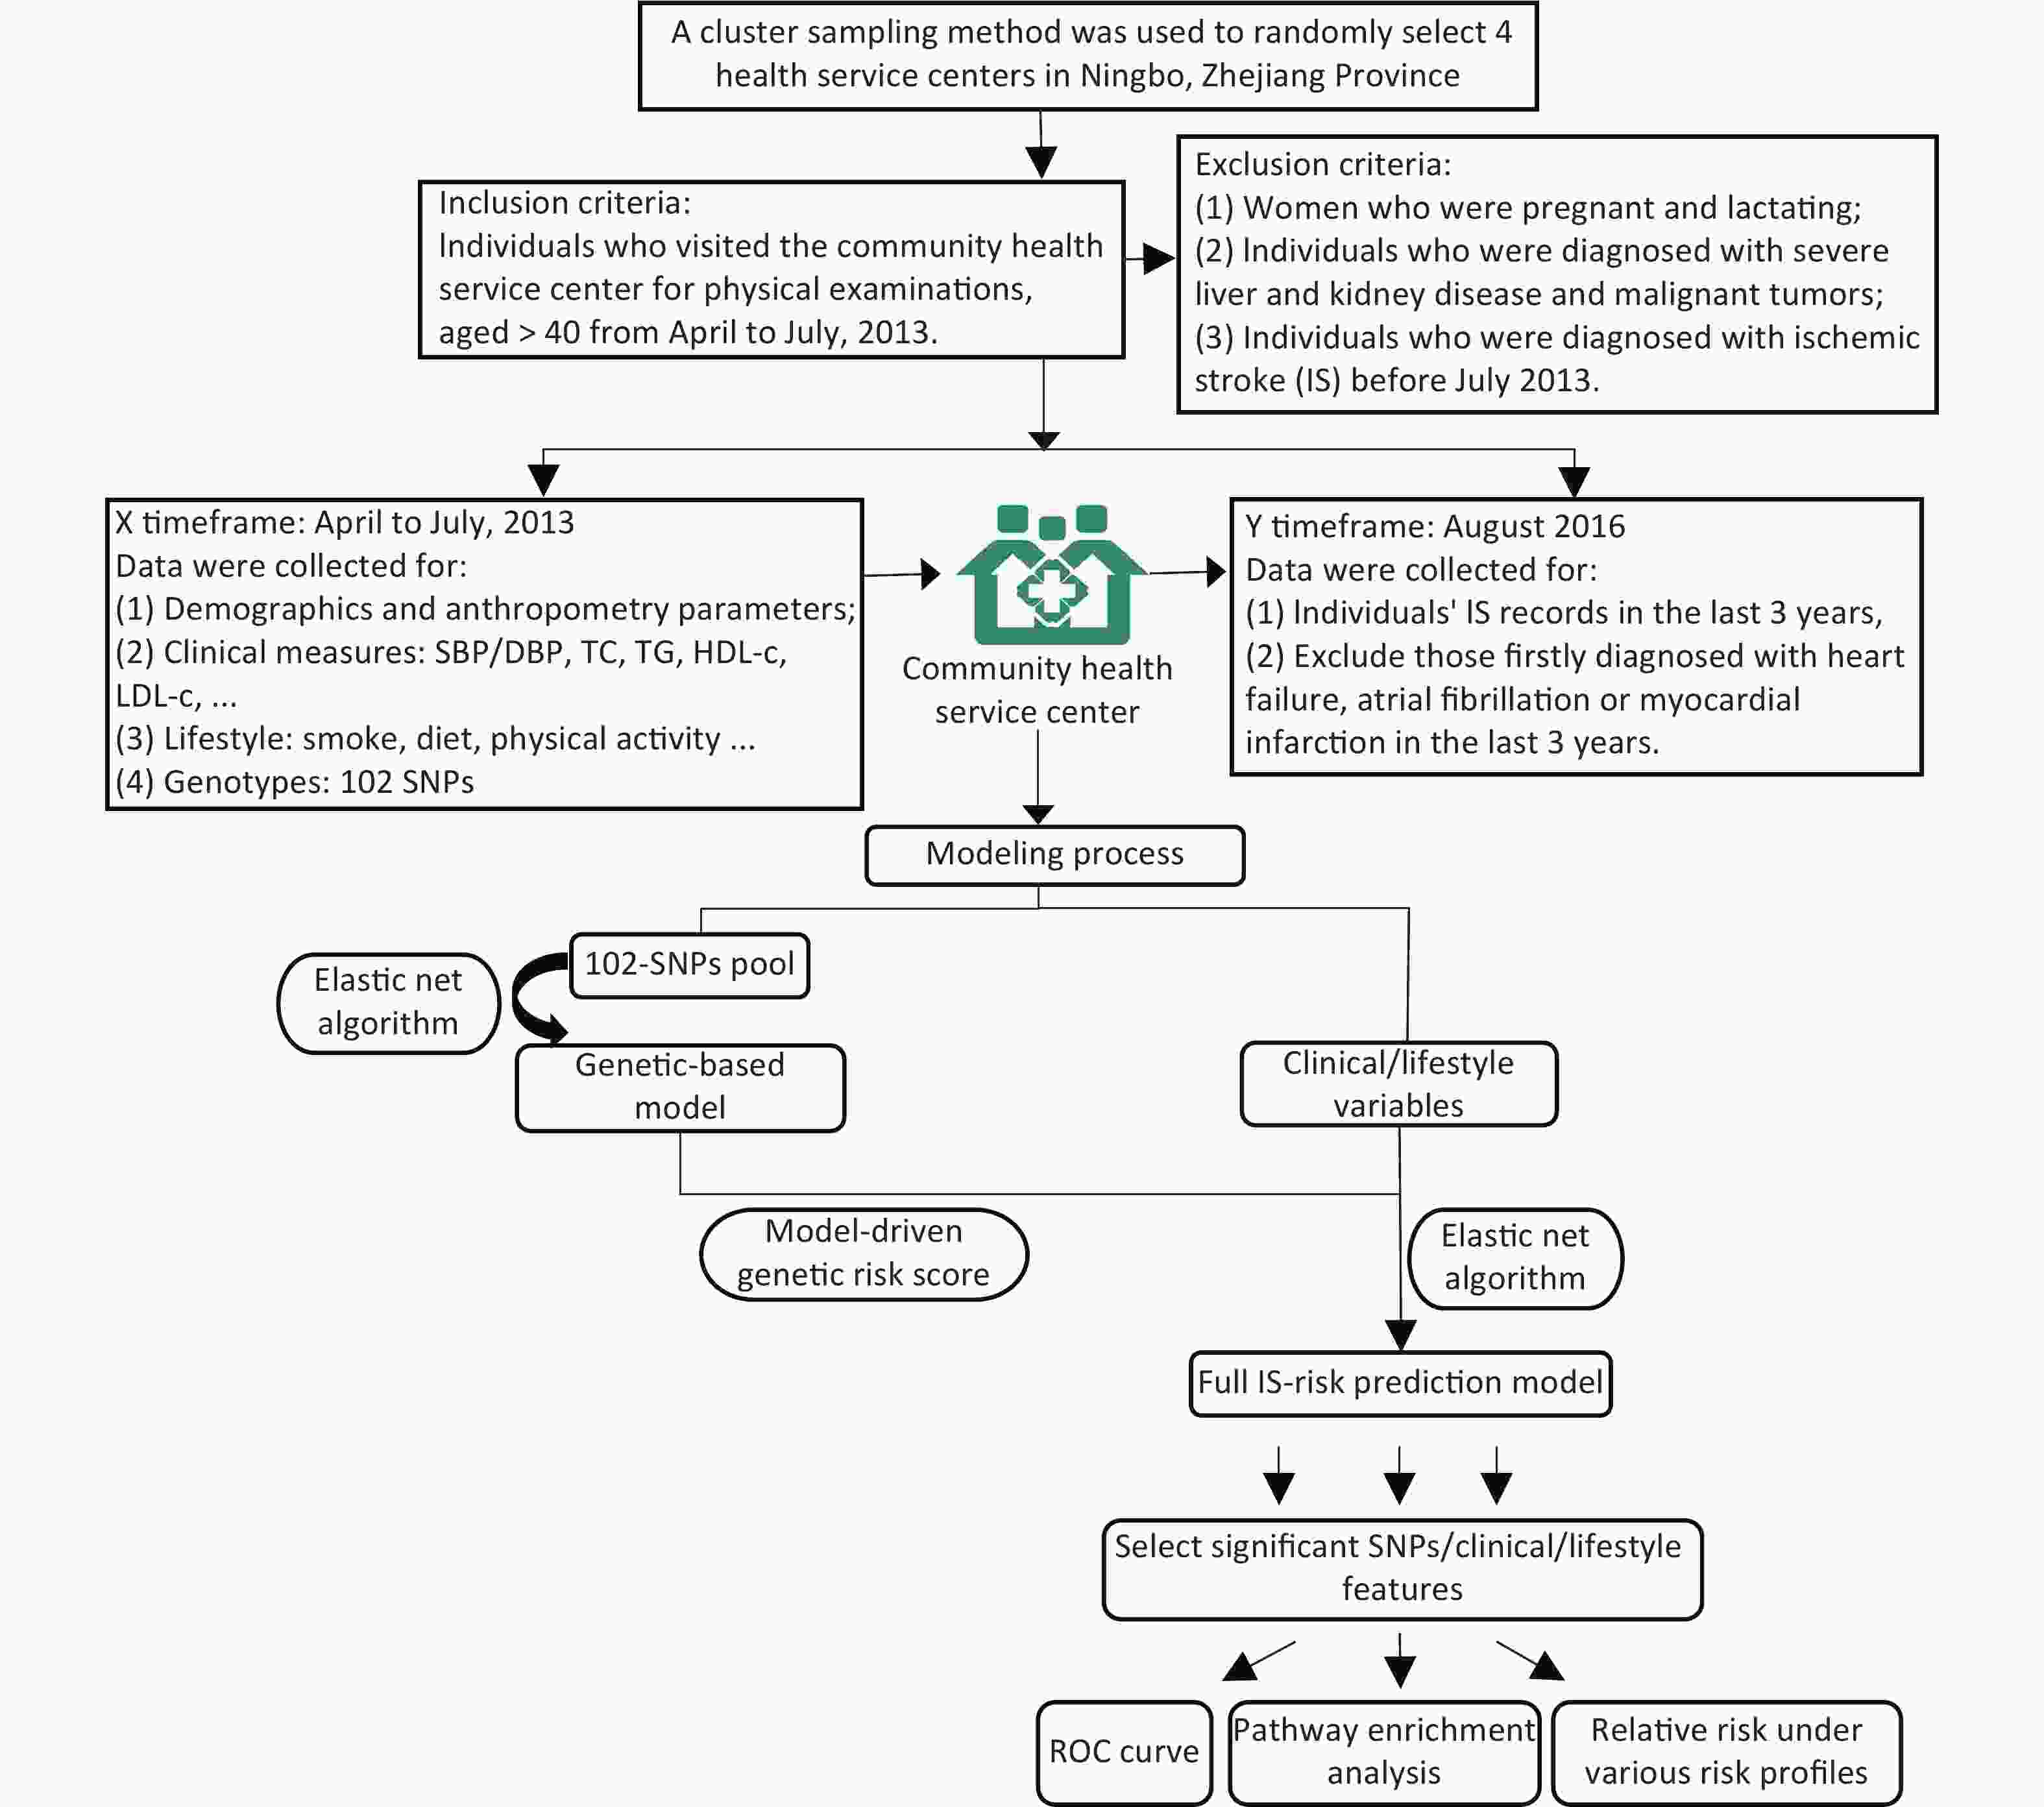
Figure S1. Study design.
Features Definition/Classification Ischemic Stroke Diagnostic criteria from the American Heart Association/American Stroke Association in 2013; Diagnostic tools: brain computerized tomography (CT) and/or magnetic resonance imaging (MRI) and clinical characterization. Anthropometry parameters Height, weight and waist circumference were measured by regular methods during physical examination; Body Mass Index (BMI) = weight (kg)/height square (m2). Systolic/diastolic blood
pressure (SBP/DBP)Measured by regular methods during physical examination. Plasma concentrations of
TC, TG, HDL-c and LDL-cMeasured by a Hitachi 7180 biochemistry automatic analyzer. Dyslipidemia Determined by one of the following four criteria: 1.Low density lipoprotein cholesterol (LDL-c) ≥ 3.37mmol/L; 2.High density lipoprotein cholesterol (HDL-c) ≤ 1.04mmol/L’ 3.Total cholesterol (TC) ≥ 5.18mmol/L; 4.Triglyceride (TG) ≥ 1.7mmol/L. Hypertension Systolic blood pressure (SBP) ≥ 140 mmHg or diastolic blood pressure (DBP) ≥ 90 mmHg or having a history of antihypertensive-drug consumption. Smoking “Yes”: Smoke ≥ 1cigarette or more per day in the last 12 months. “No”: Smoke < 1 cigarette per day in the last 12 months. Egg intake 3 levels: Eat < 1/week; 1-4/week; > 5/week in the last 12 months. Salt intake 3 levels: Intake < 6g/day; 6-9g/day; > 9g/day in the last 12 months. Fruit/vegetable intake “Seldom”: consuming less than 50g/day in the last 12 months. “Regular”: consuming 50g/day in the last 12 months. Mile/soymilk intake “Seldom”: consuming less than 200ml/day in the last 12 months; “Regular”: consuming 200ml/day in the last 12 months. Red meat/fish/chicken/
dessert intake“Seldom”: consuming this food less than once a week in the last 12 months. “≥ 1 times/week”: consuming this food at least once a week in the last 12 months. Physical activity “Sedentary”: occupations that require little exercise at work, such as office workers; “Light”: occupations that need to stand for a relatively long time at work, such as salesmen, waiters and teachers; “Moderate”: occupations that required long hours of walking, pushing or pulling at work, such as cleaning services; “Heavy”: occupations that required strenuous effort and extensive total body movements such as dancers, construction workers. Table S1. Definition and classification of features collected in our study
Initially, the target SNPs were identified and selected from IS-related genetic studies using common databases. A standard SNP selection process was implemented, which was previously established by Li et al.[4]. For genotyping, a total of 102 SNPs were selected (Supplementary Table S2 available in www.besjournal.com). For blood sample collection, the participants were subjected to overnight fasting, and samples were drawn by venipuncture, collected in vials containing anticoagulant EDTA, and preserved at −80 ℃. DNA was extracted using Tiangen Blood Genomic DNA extraction kits. For genotyping, the polymerase chain reaction (PCR)/ligase detection reaction (LDR) were adopted. The PCR reactions contained 1 µL genomic DNA, 1.5 µL 10× PCR buffer, 1.5 µL MgCl2, 0.3 µL dNTPs, 0.15 µL each primer, and 0.2 µL Taq DNA polymerase in a total volume of 15 µL, and were performed in an ABI Prism 7000 Sequence Detection System with an initial melting at 94 °C for 3 min, 35 cycles of denaturation at 94 °C for 15 s, annealing at 55 °C for 15 s, extension at 72 °C for 30 s, and final extension at 72 °C for 3 min. Each ligation reaction included 3 µL PCR product, 1 µL 10× Taq DNA ligase buffer, 5 U Taq DNA ligase, and 0.01 µL each discriminating probe in a total volume of 10 µL, and was carried out in 30 cycles at 94 °C for 30 s and 56 °C for 3 min. Re‐sequencing results for 10% of the samples showed that the concordance rates were > 95% for all target SNPs.
SNP Associated with IS or IS-related
diseases/conditions (SNP)Gene Associated with IS or IS-related diseases/
conditions (Gene)rs11646692 — BCO1 Coronary atherosclerosis, dyslipidemia rs6564851 Carotenoid and tocopherol levels rs12934922 — BCO1 Coronary atherosclerosis, dyslipidemia rs7501331 — BCO1 Coronary atherosclerosis, dyslipidemia rs671 Coronary artery disease, Body mass index (BMI), triglycerides (TG) — — rs1229984 Cardiovascular disease, systolic blood pressure (SBP), — — rs2479409 Low density lipoprotein cholesterol levels (LDL-c), et al. — — rs17111503 LDL-c, total cholesterol levels (TC), at al. — — rs2483205 — PCSK9 Coronary atherosclerotic lesion
extension and calcificationrs662145 — PCSK9 Coronary atherosclerotic lesion
extension and calcificationrs11583680 — PCSK9 Coronary atherosclerotic lesion
extension and calcificationrs111563724 — PCSK9 Coronary atherosclerotic lesion
extension and calcificationrs2738466 — LDLR Coronary heart disease rs1003723 — LDLR, MIR6886 Coronary artery disease,
plasma lipid levelsrs6413504 — LDLR Coronary artery disease,
plasma lipid levelsrs17845226 — ANXA2 LDL-c, Coronary heart disease rs8025278 — SLC12A1, LOC107984755 Hypertension rs12438818 — SLC12A1, LOC107984755 Hypertension rs11643718 — SLC12A3 Coronary atherosclerotic lesion
extension and calcificationrs5805 — SLC12A3 Coronary atherosclerotic lesion
extension and calcificationrs3812963 — SLC12A3 Coronary atherosclerotic lesion
extension and calcificationrs4784733 — SLC12A3 Coronary atherosclerotic lesion
extension and calcificationrs3782724 Obesity (early onset extreme) rs2228576 — SCNN1A Insulin resistance rs7205273 — SCNN1B stroke rs7200183 — SCNN1G Hypertension rs675759 — KCNJ1 Serum Lipid Profile rs675388 — KCNJ1 Serum Lipid Profile rs2846679 — KCNJ1, LOC107984409 Serum Lipid Profile rs1148058 — KCNJ1 Serum Lipid Profile rs4299376 Coronary artery disease — — rs964184 Coronary artery disease — — rs693 TC, et al. — — rs515135 Coronary artery disease, LDL-c, et al. — — rs5167 TG, high density lipoprotein
cholesterol levels (HDL-c)— — rs4420638 Coronary artery disease, LDL-c, et al. — — rs3764261 HDL-c, TG, et al. — — rs10401969 LDL-c, et al. — — rs10889353 TG, et al. — — rs174547 HDL-c, TG, et al. — — rs4846914 HDL-c, et al. — — rs1260326 Cardiovascular disease risk factors, TG, et al. — — rs12654264 LDL-c, et al. — — rs1800961 HDL-c, et al. — — rs16942887 HDL-c, TG, et al. — — rs5929 — LDLR Coronary artery disease, plasma lipid levels rs2650000 LDL-c — — rs1800588 HDL-c, TG, et al. — — rs4939883 HDL-c, TC, et al. — — rs7241918 HDL-c, TC, et al. — — rs328 TG, HDL-c, et al. — — rs17145738 TG, et al. — — rs16996148 LDL-c, TG — — rs3812316 TG, et al. — — rs12130333 TG, TC — — rs17321515 TG, TC, et al. — — rs7493 Yu-Zhi constitution type in type 2 diabetes — — rs629301 LDL-c, et al. — — rs2954029 Coronary artery disease,
Coronary artery disease, et al.— — rs4149269 — ABCA1 Coronary artery disease rs2472433 — ABCA1 Coronary artery disease rs2740486 — ABCA1 Coronary artery disease rs2515616 Waist-to-hip ratio adjusted for BMI — — rs2472386 HDL-c — — rs2740479 C-reactive protein levels — — rs4149264 — ABCA1 Coronary artery disease rs4149339 — ABCA1 Coronary artery disease rs2515617 — ABCA1 Coronary artery disease rs2254884 — ABCA1 Coronary artery disease rs2065412 — ABCA1 Coronary artery disease rs2472377 — ABCA1 Coronary artery disease rs4149336 — ABCA1 Coronary artery disease rs2297406 — ABCA1 Coronary artery disease rs6479282 — ABCA1 Coronary artery disease rs4743764 — ABCA1 Coronary artery disease rs2740484 — ABCA1 Coronary artery disease rs11789818 — ABCA1 Coronary artery disease rs2575876 HDL-c in current drinkers,
TG in current drinkers, et al.— — rs2482433 — ABCA1 Coronary artery disease rs2515614 — ABCA1 Coronary artery disease rs4743763 — ABCA1 Coronary artery disease rs2000069 — ABCA1 Coronary artery disease rs10820743 — ABCA1 Coronary artery disease rs2472510 — ABCA1 Coronary artery disease rs4665273 — ADCY3 Carotid plaque formation, obesity rs1127568 — ADCY3 Carotid plaque formation, obesity rs6751537 — ADCY3 Carotid plaque formation, obesity rs7608976 — ADCY3 Carotid plaque formation, obesity rs11689546 — ADCY3 Carotid plaque formation, obesity rs7604576 — ADCY3 Carotid plaque formation, obesity rs7593130 — ADCY3 Carotid plaque formation, obesity rs2241759 — ADCY3 Carotid plaque formation, obesity rs2278485 — ADCY3, LOC105377626 Carotid plaque formation, obesity rs1344840 — ADCY3 Carotid plaque formation, obesity rs4077678 BMI, Childhood obesity — — rs10187348 — ADCY3 Carotid plaque formation, obesity rs10431036 — BCO2 Ischemic stroke rs11214109 — BCO2 Ischemic stroke rs12420476 — BCO2 Ischemic stroke rs13328843 — BCO2 Ischemic stroke rs11641677 — BCO1 Coronary atherosclerosis rs6939861 — TFEB, MIR10398 Cardiovascular diseases rs11759908 Estimated glomerular filtration rate, estimated
glomerular filtration rate in non-diabetics— — Table S2. The reported association between 102 SNPs or its genes and IS or IS-related diseases/conditions
In the present study, elastic net regression was adopted for the modeling process[5]. In particular, this method introduces ℓ2‐norm and ℓ1‐norm penalties into the regularization term to deal with high correlation variables and estimates a series of coefficients
$ {\widehat{\beta }}_{Elastic} $ as per the following Equation:$$\begin{split} {\widehat{\beta }}_{Elastic}=\;&{argmin}_{\beta }\left[ - \sum\limits_{i=1}^{n}\left\{{y}_{i}log\left({\pi }_{i}\right)+\left(1-{y}_{i}\right)log\left(1-{\pi }_{i}\right)\right\}+\right.\\ &\left.{\lambda}_{1}\sum\limits_{j=1}^{p}\left|{\beta }_{j}\right|+{\lambda}_{2}\sum\limits_{j=1}^{p}{\beta }_{j}^{2}\right] \end{split}$$ Here,
$ {y}_{i}\in \left\{\mathrm{0,1}\right\} $ denotes the response variable and${\pi }_{i}=p({y}_{i}=1\left|{x}_{i})\right.=\dfrac{\mathit{exp}\left({x}_{i}^{T}\beta \right)}{1+\mathit{exp}\left({x}_{i}^{T}\beta \right)},i=\mathrm{ }\mathrm{1,2},\cdots ,n.$ The tuning parameters λ1 and λ2 determine the regularized logistic regression solution and coefficient estimates. In this study, 102 SNPs and 27 clinical/lifestyle covariates were used in the construction of IS risk prediction model. Individuals’ final risk scores were obtained, and they were further classified into three IS risk categories (high/intermediate/low). In particular, positive predictive values (PPVs), sensitivity, and specificity were calculated. The discriminative ability of the constructed models was measured in terms of the area under curves (AUC). In terms of the given captured predictors, the impact of various risk profiles on IS was evaluated, and R software, version 3.6.1, was used for analysis. Further, for the identification of KEGG/Reactome pathways and gene ontology (GO) function interpretations, the enrichment analysis tool g:Profiler was adopted[6].Among 2,113 participants recruited in this study, 3.17% were newly diagnosed with IS by August 2016. Supplementary Table S3 (available in www.besjournal.com) summarizes the baseline features, which were statistically compared between cases and controls. Interestingly, age, height, SBP, clinical history of hypertension, and dietary habits involving the consumption of egg, red meat, chicken, and fish showed significant differences between cases and controls, with P < 0.05.
Characteristics Case (n = 67) Control
(n = 2,046)t/z/χ2 P value Age, Mean (IQR), y 70.7 (12) 58.6 (17) 8.88 < 0.001 Sex, n (%) 0.16 0.88 Male 30 (44.78) 936 (54.25) Female 37 (55.22) 1,110 (45.75) Education level, n (%) −1.92 0.05 ≤ Primary school 57 (85.07) 1,456 (71.16) Middle school 7 (10.45) 517 (25.27) ≥ High school 3 (4.48) 73 (3.57) Height, Mean (IQR), cm 157.6 (12.5) 160.4 (11) −2.76 0.005 Weight, Mean (IQR), kg 57.94 (12.5) 59.97 (13) −1.65 0.10 Waist, Mean (IQR), cm 82.4 (13) 81.3 (11) 1.13 0.26 BMI, Mean (IQR), kg/m2 23.3 (4.01) 23.3 (3.95) 0.08 0.93 SBP, Mean (IQR), mmHg 145.1 (26.5) 133.9 (28) 4.77 < 0.001 DBP, Mean (IQR), mmHg 83.4 (13) 81.66 (17) 1.14 0.25 TC, Mean (IQR), mmol/L 5 (1.445) 4.9 (1.238) 1.12 0.26 TG, Mean (IQR), mmol/L 1.4 (0.84) 1.4 (0.78) −0.18 0.85 HDL-c, Mean (IQR), mmol/L 1.2 (0.28) 1.3 (0.37) −1.5 0.13 LDL-c, Mean (IQR), mmol/L 3.2 (1.19) 3.1 (1.1) 0.91 0.36 Dyslipidemia, n (%) 38 (56.72) 1,163 (56.84) −0.02 0.98 Hypertension, n (%) 46 (68.66) 939 (45.9) 3.56 < 0.001 Smoking, n (%) 0.37 0.71 Yes 18 (26.87) 538 (26.3) No 49 (73.13) 1,508 (73.7) Egg intake, n (%) −2.09 0.04 < 1 /week 28 (41.8) 558 (27.3) 1–4 /week 31 (46.3) 1,206 (58.9) > 5 /week 8 (11.9) 282 (13.8) Salt intake, n (%) 1.2 0.23 < 6 g/day 39 (58.2) 1,389 (67.9) 6–9 g/day 25 (37.3) 546 (26.7) > 9 g/day 3 (4.5) 111 (5.4) Fruit intake, n (%) −1.78 0.07 Seldom (< 50 g/day) 29 (43.3) 671 (32.8) Regular (≥ 50 g/day) 38 (56.7) 1,375 (67.2) Vegetable intake, n (%) 0.02 0.99 Seldom (< 50 g/day) 28 (1.4) 0 (0) Regular (≥ 50 g/day) 2018 (98.6) 67 (100) Milk intake, n (%) 0.02 0.98 Seldom (< 200 mL/day) 42 (62.69) 1,312 (64.13) Regular (≥ 200 mL/day) 25 (37.31) 734 (35.87) Soymilk intake, n (%) −0.62 0.54 Seldom (< 200 mL/day) 50 (74.63) 1,514 (74) Regular (≥ 200 mL/day) 17 (25.37) 532 (26) Red meat intake, n (%) −4.13 < 0.001 Seldom 16 (23.88) 172 (8.4) ≥ 1 times/week 51 (76.12) 1,874 (91.6) Fish intake, n (%) −4.13 < 0.001 Seldom 13 (19.4) 149 (7.28) ≥ 1 times/week 54 (80.6) 1,897 (92.72) Chicken intake, n (%) −2.1 0.04 Seldom 27 (40.3) 581 (28.4) ≥ 1 times/week 40 (59.7) 1,465 (71.6) Dessert intake, n (%) −0.8 0.43 Seldom 24 (35.8) 639 (31.2) ≥ 1 times/week 43 (64.2) 1,407 (68.8) Physical activity, n (%) 0.12 0.90 Sedentary 13 (19.4) 259 (12.66) Light 34 (50.75) 1,182 (57.78) Moderate 9 (13.43) 426 (20.82) Heavy 11 (16.42) 179 (8.74) Table S3. Comparison of baseline features in individuals with or without IS
At the initial genetic‐based modeling stage, elastic net regression was applied on 102 SNPs selected from common databases. Further, the performance of all candidate models was evaluated using 10-fold cross‐validation, and the model with the highest fitted AUC value was recognized as the best model. As shown in Figure 1, the derived/resulting genetic model captured 15 SNPs and was characterized by a fitted AUC of 0.691 (95% CI: 0.627–0.755). Following this, the model‐driven genetic risk scores were calculated for each individual and utilized for the construction of the full model. In the next stage, 27 clinical/lifestyle covariates, including three demographic features, four anthropometric parameters, six clinical measurements, clinical history of two diseases, and 12 lifestyle variables, were used along with the model‐driven genetic risk scores for further modeling. Finally, a complete model for IS risk prediction was generated, with a fitted AUC of 0.846 (95% CI: 0.803–0.89). This model identified four parameters, including age, model‐driven genetic risk score, SBP, and fish intake, as important predictors of IS risk (Figure 1 and Supplementary Table S4 available in www.besjournal.com).
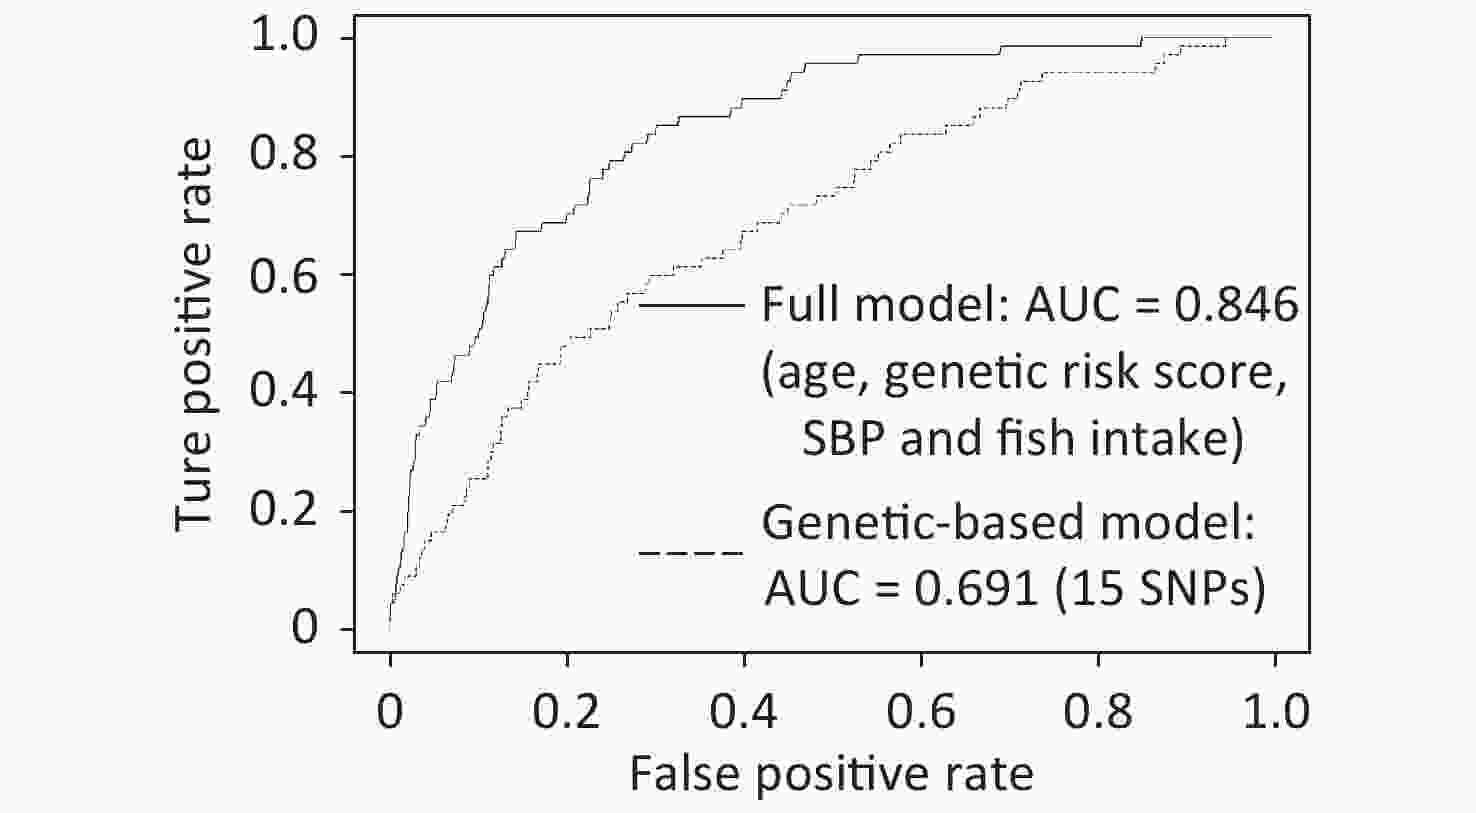
Figure 1. The ROC Curves of the genetic-based model and the full IS risk prediction model
Genetic-based IS-risk model SNP Coefficient Gene Associated with IS or IS-related diseases/ conditions PMID rs1800961 0.56226531 HNF4A IS 22403240 rs4299376 0.39578499 ABCG8 LDL-c 26043746 rs2278485 0.23077208 ADCY3 Cardiovascular disease 28985495 rs10889353 0.13749869 DOCK7 TG, LDL-c 26744084 rs2954029 0.10619992 TRIB1 IS 31250580 rs17321515 0.08371697 TRIB1 IS 30787327 rs5167 0.08041245 APOC2 Cardiovascular disease 29367937 rs10187348 0.02155788 ADCY3 Obesity 30704512 rs11583680 0.02063195 PCSK9 LDL-c 28577571 rs1229984 0.01210608 ADH1B Alcohol dependence 30994927 rs2575876 0.011446 ABCA1 IS 28865324 rs4939883 −0.14570917 LOC105372112 HDL-c 22174694 rs11643718 −0.10686348 SLC12A3 LDL-c 28166833 rs7493 −0.07784675 PON2 IS 28566152 rs693 −0.01463697 APOB IS 29416768 Full IS-risk model Features Coefficients PMID Age 0.427610541 30010821 Genetic risk score 0.332308739 —— SBP 0.00413839 28097354 Fish intake −0.004976849 15155968 Note. “——” Genetic risk score is a combined feature derived from the genetic-based IS-risk model, thus its PMID is not available. Table S4. The coefficients of 15 SNPs adopted by the genetic-based IS-risk model and 4 significant features identified by the full IS-risk model
The resulting full model was further used to calculate the IS-risk scores for each participant. Subsequently, the participants were classified into three risk categories (Supplementary Table S5 available in www.besjournal.com). Eventually, 68.34% of 2,113 participants corresponded to the low‐risk group, with only 0.76% of these participants developing IS during a 3-year follow up period. In comparison to this, the intermediate and high‐risk groups included 27.64% and 4.02% of the participants. Importantly, 5.82% and 25.88% of the subjects belonging to intermediate and high‐risk groups, respectively, developed IS within three years. Interestingly, the risk of developing IS was found to be 34-times higher in participants belonging to the high‐risk category as compared with those categorized into the low‐risk group. These results further highlighted that the generated model displayed a good discriminatory ability to identify patients with a high risk of IS.
Risk category Low risk Intermediate risk High risk Total Number of Observations 1444 584 85 2113 Cases 11 34 22 67 PPV 0.76% 5.82% 25.88% 3.17% Observation% 68.34% 27.64% 4.02% 100.00% Sensitivity 16.42% 50.74% 32.84% 100.00% Specificity 70.04% 26.88% 3.08% 100.00% Relative Risk 0.23 1.89 10.66 1 Table S5. The performance of the full IS-risk model in the three risk categories (high/intermediate/low)
Further, the results of the univariate analysis revealed that the four recognized features were independently associated with IS (Supplementary Table S6 available in www.besjournal.com). In particular, individuals aged ≥ 60 years (OR: 2.39, 95% CI: 1.39–4.95), having elevated SBP (regression coefficient: 11.30, 95% CI: 6.66–15.93), or those with increased genetic risk (regression coefficient: 0.71, 95% CI: 0.51–0.91) displayed inflated IS risk. On the contrary, the dietary intake of fish reduced the risk of IS (OR: 0.70, 95% CI: 0.57–0.86). In order to investigate the relative risk of IS, individuals were further classified into various risk profiles. For three captured features of age, SBP, and fish intake, the individuals were defined as “healthy” for clinical/lifestyle exposures if the individual were aged < 60 years, had < 140 mmHg SBP, and consumed fish at least once a week, whereas the subjects were categorized as “intermediate” healthy ones if they fulfilled only two of the three criteria defined for “healthy” exposures. In cases where the subjects fulfilled either one or none of the aforementioned criteria, these were categorized as “unhealthy”. Additionally, the derived genetic risk scores were used to generate three genetic risk strata, wherein the top third were treated as high genetic risk and the bottom third as low risk. As shown in Table 1, the relative risk of IS gradually increased as individuals’ clinical/lifestyle exposures changed from healthy to unhealthy status and genetic susceptibility changed from low to high. Thus, the subjects with “unhealthy” clinical/lifestyle status and “high” genetic risk displayed the highest relative risk of IS (RR: 15.60, 95% CI: 3.75–64.96) as compared to the reference group. Interestingly, the participants with “low” genetic risk but “unhealthy” clinical/lifestyle status displayed higher IS risk than the individuals with “high” genetic risk but “healthy” non‐genetic status (RR: 5.50, 95% CI: 1.20–25.20). These results highlighted a stronger cumulative impact of the non‐genetic exposures on IS risk than the genetic profiles.
Characteristics Case (N = 67) Control (N = 2,046) OR/Regression coefficient (95% CI) P Genetic risk score, Mean (IQR) 3.854 (1.161) 3.148 (0.95) 0.71 (0.51–0.91) < 0.001 Age, n (%) 40–49 3 (4.48) 546 (26.69) — — 50–59 3 (4.48) 565 (27.61) 0.97 (0.18–5.24) 0.97 60–69 19 (28.36) 604 (29.52) 2.39 (1.39–4.95) 0.01 > 70 42 (62.68) 331 (16.18) 2.85 (2.03–4.58) < 0.001 SBP, Mean (IQR) 145.1 (26.5) 133.9 (28) 11.30 (6.66–15.93) < 0.001 Fish intake, n (%) 0.70 (0.57–0.86) < 0.001 Never 13 (19.40) 149 (7.28) > 1 times/week 54 (80.60) 1,897 (92.72) Table S6. The univariate analysis results for the captured features.
Clinical/lifestyle exposure Genetic risk Low Intermediate High Healthy − − 1 (reference) Intermediate − 2.83 (0.55–14.42)
P = 0.216.74 (1.54–29.56)
P = 0.011Unhealthy 5.50 (1.20–25.20)
P = 0.0286.90 (1.56–30.51)
P = 0.01115.60 (3.75–64.96)
P < 0.001Table 1. Relative risk of IS for combined genetic and non-genetic profiles
Among the 15 captured SNPs, 6 SNPs or their genes, including rs1800961, rs2954029, rs17321515, rs2575876, rs7493, and rs693, were shown to be directly associated with IS, whereas the remaining 9 recognized SNPs or genes affected IS‐related conditions (Supplementary Table S4). In particular, rs4939883 was reported to be associated with HDL‐c level, rs10889353 contributed to variations in TG levels, and rs4299376, PCSK9 (rs11583680), and SLC12A3 (rs11643718) were LDL‐associated variants. Besides these, rs1229984 was a risk factor associated with alcohol dependence that may increase the risk of IS via alcohol‐induced sympathetic activation, whereas ADCY3 (rs10187348) was a risk factor linked to obesity.
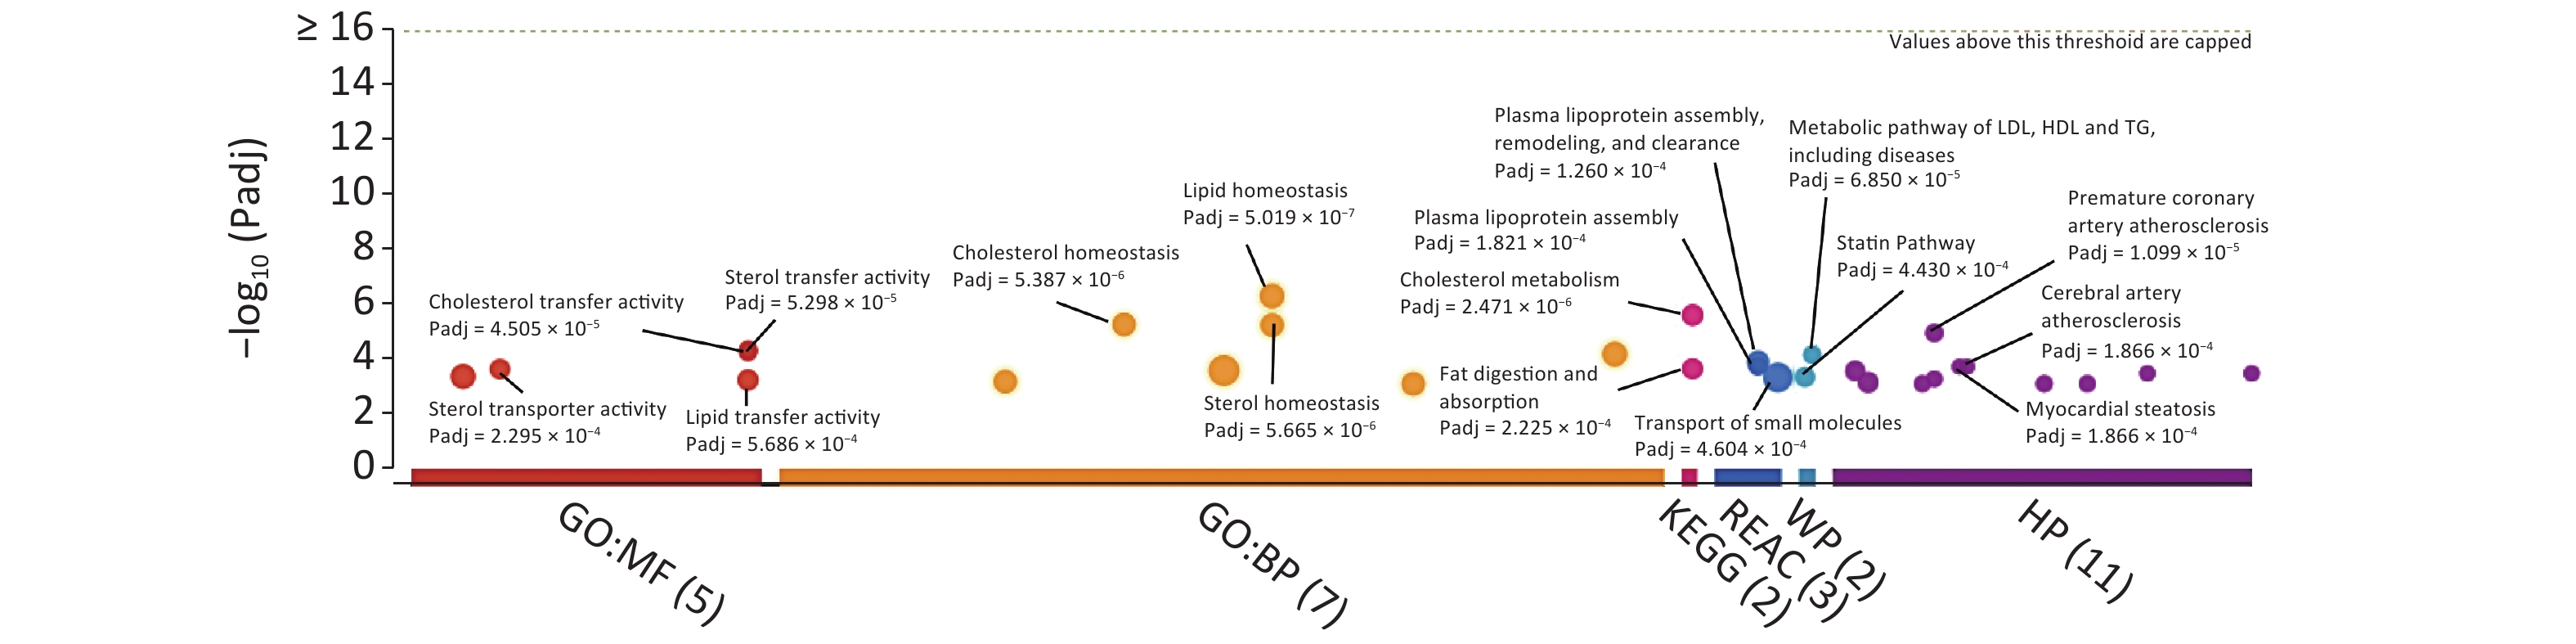
For the identification of KEGG/Reactome pathways and GO functional interpretations, enrichment analysis was performed for 15 captured SNPs via g:GOSt module of g:Profiler tool set (Figure 2)[6]. For multiple testing adjustments, g:SCS threshold was set to 0.001. Consequently, the captured SNPs were enriched to signaling pathways linked to cholesterol metabolism (KEGG: 04979, adjusted P = 2.471 × 10⁻⁶), fat digestion and absorption (KEGG:04975, Padjusted = 2.225 × 10⁻⁴), plasma lipoprotein assembly (REAC: R‐HSA‐8963898, Padjusted = 1.821 × 10⁻⁴), and transport of small molecules (REAC:R‐HSA‐382551, Padjusted = 4.604 × 10⁻⁴). In terms of the biological domain, the captured SNPs aggregated to cholesterol (GO: 0120020, Padjusted = 4.505 × 10⁻⁵), sterol (GO: 0120015, Padjusted = 5.298 × 10⁻⁵), and lipid (GO: 0120013, Padjusted = 5.686 × 10⁻⁴) transfer activities for molecular function (MF) domain. For the biological process (BP) domain, these SNPs functionally enriched to the lipid/cholesterol/sterol homeostasis (GO: 0055088, 0042632, 0055092, with Padjusted < 6 × 10⁻⁶). According to human phenotype ontology, the identified SNPs were found to be significantly related to certain diseases, including premature coronary artery atherosclerosis, myocardial steatosis, and cerebral artery atherosclerosis.
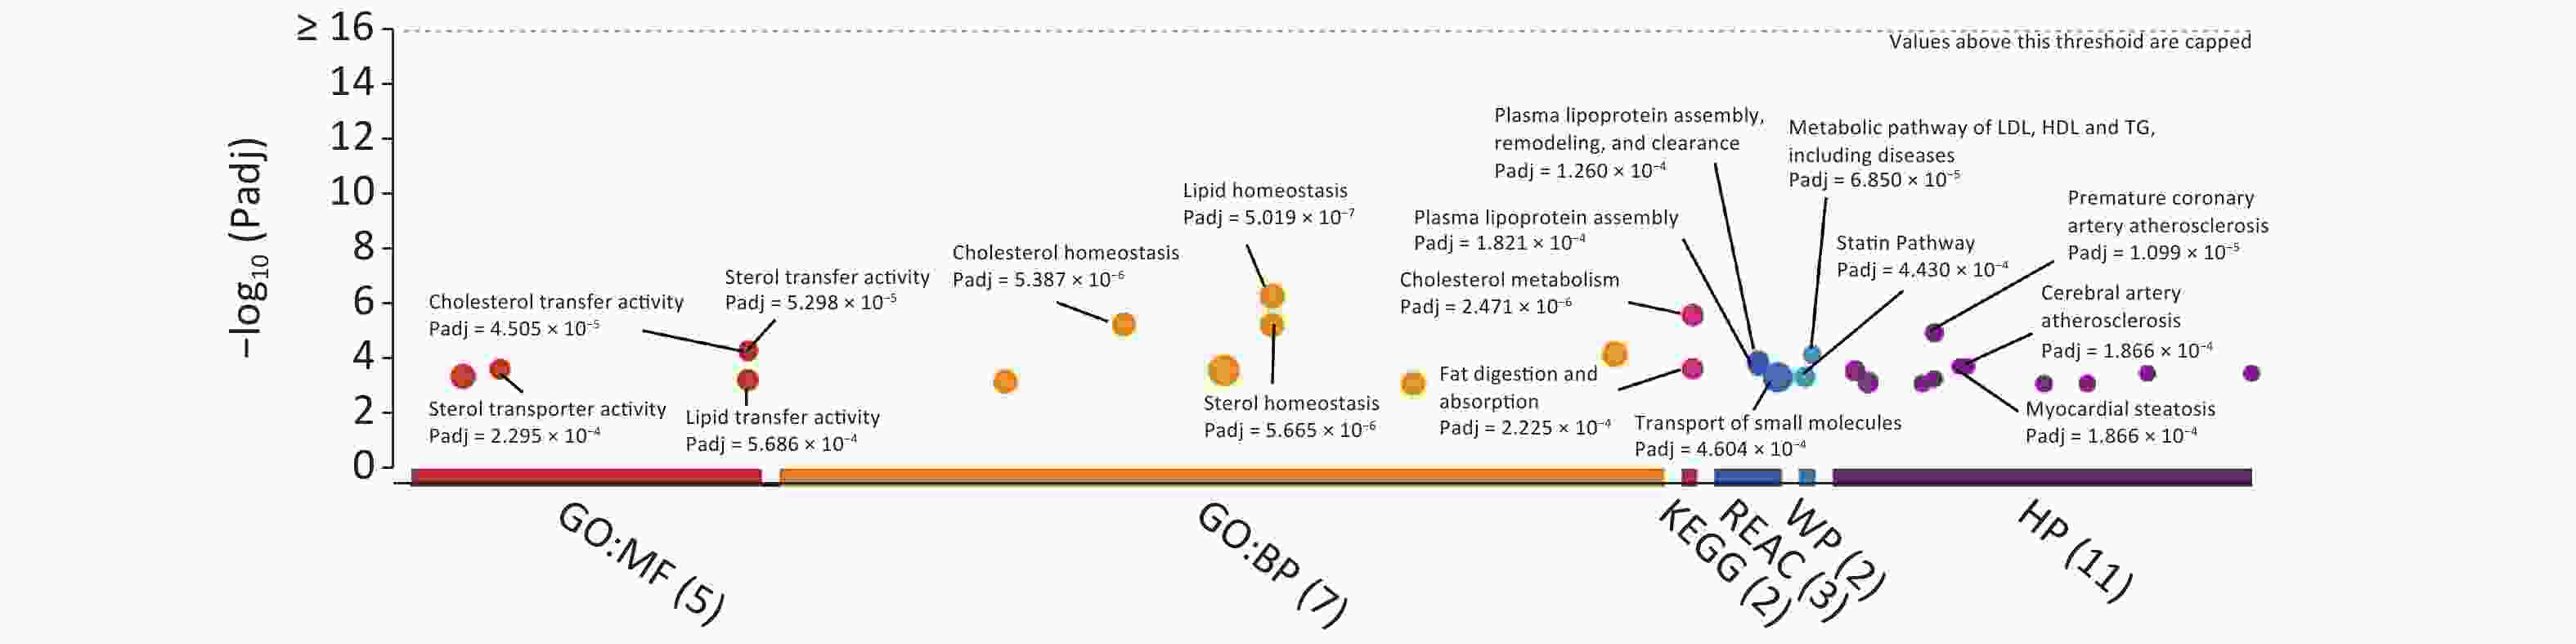
Figure 2. The P-value plot of enriched pathways and functional domains for the 15 captured SNPs
In research settings, when collinear predictors greatly outnumber the available number of samples (P > n), ordinary regression is subjected to overfitting and coefficient instability. Comparatively, the use of the elastic net regression model allows us to control the total number of involved variables using the penalty parameter λ and capture groups of potentially highly correlated variables to build a sparse model that is immune to overfitting[5]. The robustness of elastic net regression in addressing multicollinearity and overfitting has been previously established[7]. To verify the same in this study, the data were further divided into construction and validation sets at a ratio of 9:1, and the validation procedure was introduced. The newly generated IS-risk model achieved a fitted AUC of 0.835 on the construction set and a validated AUC of 0.81 on the validation set. These values were slightly lower than the fitted AUC of the original model (0.846). These variations might be attributed to a certain degree of overfitting. Besides this, the occurrence of an insufficient number of cases (n = 60) and samples in the construction set after splitting the data could also have acted as contributing factor, resulting in a less‐comprehensive prediction model that identified only a subset of important risk factors and had reduced power of prediction.
Several previous studies attempted the construction of risk prediction models for both “all‐stroke” and/or “IS‐only”. Similar to the present case, these tools were also developed using common lifestyles, medical conditions, or genetic variants involved in lipid/cholesterol metabolism, statin pathways, or cerebral artery atherosclerosis[3, 8, 9]. These findings highlighted that different subtypes of IS could be induced by similar lifestyle and genetic risk factors[2]. Recently, an atrial substrate model was proposed by Kamel et al.[10] illustrating that aging and other common vascular risk factors like unhealthy lifestyles may simultaneously be involved in distinct etiologies underlying different IS subtypes. In particular, these factors could induce an abnormal atrial tissue substrate to cause AF and thromboembolic stroke, and also trigger large‐artery atherosclerosis, ventricular systolic dysfunction, or in situ cerebral small‐vessel occlusion, leading to thrombotic stroke. Nevertheless, different subtypes of IS are still characterized by their unique triggers and pathological mechanisms. Therefore, to reveal the unique etiologies of IS subtypes, it is important and necessary to build specific predictive tools for each subtype of IS.
The present study had certain limitations. The original model derived in this study could not be validated owing to the limited number of cases and sample size. Thus, future studies should apply this model to an independent dataset to verify its accuracy. Additionally, the measurements or classifications of some lifestyle factors used in this study were not standardized, which might further limit the application of this model in external settings.
For fatal diseases that affect populations all across the globe, the development of robust, individualized disease risk assessment tools is the first step toward precision medicine and health care. In the present study, a new tool was generated for IS risk prediction, which involved 15 captured SNPs and three clinical/lifestyle predictors. The results of the study highlighted the suitability of this new tool in IS risk recognition in the Chinese population at the individual level. Additionally, this tool might assist in providing valuable information regarding the implications of various factors in IS etiology.
The authors thank the investigators and participants for their contribution to this study.
The authors declare no conflict of interest.
The study was approved by the Medical Ethics Committee of Hangzhou Normal University (No. 2013020).
HTML


Reference

 Quick Links
 DownLoad: