


-
Noise-induced hearing loss (NIHL) is a slowly progressive sensorineural hearing loss caused by long-term exposure to harmful levels of noise. The World Health Organization (WHO) estimates that approximately 22% of the hearing loss in adults is attributable to occupational and environmental noise exposure, and by 2030, almost 1 billion people will be at the risk of NIHL[1]. As a major occupational health risk, NIHL has become the second-largest occupational disease in China[2]. NIHL is thought to be a complex disease caused by genetic and environmental factors. The main factors include exposure to high levels of noise and individual susceptibility, such as age, gender, education level, smoking frequency, alcohol consumption, and usage practice of hearing protection devices[3-6]. Therefore, the single-locus method may not be appropriate to study common complex disorders such as NIHL.
Noise is the most common environmental factor leading to occupational hearing loss. The noise exposure metrics used in most previously published studies mainly concentrates on equivalent continuous sound level (Leq) and cumulative noise exposure (CNE). These metrics have been established based on the study of Gaussian noise and the equal-energy hypothesis (EEH), which assumes that the damage to the auditory system caused by noise exposure is proportional to the duration of exposure multiplied by the noise intensity. However, the EEH has been found unsuitable for “complex noise or non-Gaussian (non-G)” noise. Complex noise is ubiquitous in industrial and military environments. It is composed of a transient high-energy impulsive noise superimposed on stationary (Gaussian) background noise[7]. Both animal experiments and epidemiological studies have shown that the EEH underestimates the cochlear impact of complex-noise exposure. The impact of a complex noise on the auditory system was assessed using kurtosis first by Erdreich[8]. This method has simplified the time-domain variables of noise that affect hearing (e.g., pulse peak value, duration, and inter-pulse distribution) into one easy-to-calculate parameter (i.e., kurtosis), which is convenient for classifying the noise type. A high kurtosis indicates that the impulse of the complex noise was high[9]. To date, the efficacy of kurtosis in assessing complex noise has been preliminarily verified in human studies[10,11].
Increasing evidence has shown the association of susceptibility genes, such as catalase (CAT), heat shock protein70 (HSP70), cadherin-23 (CDH23), caspase (CASP), and NADPH oxidase3 (NOX3), with the development of NIHL[12-18]. Additionally, previous studies have demonstrated that smoking, stressful lifestyle, and physical exercise are associated with hearing loss[19-21]. However, multiple genetic loci may fail to reach genome-wide significance due to the limited power in most genetic studies, and few studies have analyzed the interaction between genetic variants, noise exposure (especially kurtosis), and lifestyle factors on modulating NIHL. Previous studies have never reported multidimensional interactions involving multiple (> 7) genes (especially NRN1 gene) and kurtosis. Therefore, the present study focused on the associations of multi-locus interactions with NIHL risk. In a case-control study with 307 NIHL patients and 307 age- and gender-matched healthy controls, a total of 18 variants (rs1049216, rs6948, rs3805789, rs2227956, rs1043618, rs2763979, rs3749930, rs12665231, rs12195525, rs3752752, rs3802711, rs1227049, rs12415607, rs1127687, rs564250, rs769214, rs769217, and rs7943316) in these 7 susceptibility genes (CAT, HSP70, CDH23, CASP3, CASP7, NOX3, and NRN1), three noise metrics (noise kurtosis, CNE, adj-CNE), and four lifestyle factors (smoking, video volume, physical exercise, working pressure) were included to explore the associations of gene-gene, gene-noise-metric, gene-lifestyle-factor, and noise-metric-lifestyle-factor interactions with the risk of NIHL, and identify the significant interaction model of gene-gene and gene-environment. Our results lay the foundation for a comprehensive prevention program against NIHL.
-
Subjects were continuously recruited between October 2017 and December 2018 from five manufacturing factories with high noise levels in the Zhejiang Province of East China. Inclusion criteria for the subjects were as follows: 1) individuals who had never worked in high noise-level environments from different enterprises, 2) the binaural hearing threshold difference was < 30 dB per frequency; 3) no history of military service; 4) no family history of hearing loss; 5) no history of an ear disease; 6) no history of ototoxic drugs; and 7) no history of diabetes. NIHL was diagnosed based on binaural high-frequency (3,000, 4,000, and 6,000 Hz) average hearing threshold > 25 dB. The subjects were divided into two groups—patients with NIHL and controls with normal hearing—who were matched for gender and age (± 3 years).
-
Sample size was determined using the following formula for the case-control study.
$${{n}} = \frac{{2{{\bar{{p}}\bar{{q}}}}\;{{\left( {{{{z}}_{{\alpha }}} + {{{z}}_{{\beta }}}} \right)}^2}}}{{{{\left( {{{{p}}_1} - {{{p}}_0}} \right)}^2}}}$$ α = 0.05, zα = 1.96; β = 0.1, zβ = 1.28; p0 was the minimum allele frequency in the control group, p0 = 0.123 (
https://www.ncbi.nlm.nih.gov/snp/ ); p1 was the minimum allele frequency in the case group,${{{p}}_1} = \dfrac{{{{{p}}_0}{{OR}}}}{{[1 + {{{p}}_0}({{OR}} - 1)]}} = 0.276$ , OR is odds ratio;$\overline {{p}}=\dfrac{{{p}}_{0}+{{p}}_{1}}{2}=0.200$ ,$ \overline {{q}}=1-\overline {{p}}=0.800 $ . A minimum of 143 samples were required for this study based on the above formula. Considering the interactions of gene-gene and gene-environment, a larger sample size was appropriate. In our study, a total of 614 subjects including 307 patients with NIHL and 307 controls with normal hearing were selected, which is sufficient based on the above calculation results for sample size. -
A questionnaire was designed for each subject based on the needs of the investigation. Collected information included the following: 1) general information (age, sex, etc.); 2) noise exposure factors (factory, work situation, duration of daily noise exposure, etc.); 3) lifestyle factors (smoking, video volume, physical exercise and working pressure). Variables were defined as follows: 1) smoking: smoking one or more cigarettes on average every day, and lasting for at least a year; 2) video volume: The 40% of the maximum volume served as the cutoff point is based on our previous study[17], high video volume is defined as higher than 40% of the maximum volume, and low video volume is defined as lower than 40% of the maximum volume; 3) regular physical exercise: physical exercise on average once a week or more, and lasting for one year or longer; 4) working pressure: a feeling of work-related hardness, frustration, distress, or tension, such as tension, anxiety, and unhappiness[22]. High working pressure is defined as very high and relatively high pressure, and low working pressure is defined as general, relatively low and very low pressure. Participants completed study questionnaires and met with trained investigators in a face-to-face interview. All the participants signed the informed consent form, and the study was approved by the Science Ethics Committee of Hangzhou Normal University (2017LL107).
-
A digital noise dosimeter (ASV5910-R, Hangzhou Aihua Instrument Co., Ltd.) that can operate continuously at a sampling rate of 48 kHz was used to record the noise for each subject for the entire shift duration. Eight-hour, continuous equivalent A-weighted sound levels (LAeq,8h) can be measured with a noise dosimeter, which was attached to the clothing of the participant at the shoulder by clips, with the microphone pointed up (
Supplementary Material 1 available in www.besjournal.com ). The measurement time was 8 h per shift. A sound level calibrator (Hangzhou Aihua Instrument, AWA6221B) was used to calibrate the noise dosimeter before and after each sampling cycle. MATLAB software (Natick, MA) was used to calculate the sampling kurtosis in a continuous 40-s window of the noise signals during the entire shift. The equation used to calculate kurtosis is shown in Formula 1.$$ {{\beta }} = \dfrac{{{{{m}}_4}}}{{{{{m}}_2}}} = \dfrac{{\dfrac{1}{{{n}}}\displaystyle\mathop \sum \nolimits_{{{i}} = 1}^{{n}} {{\left( {{{{x}}_{{i}}} - {\bar{{x}}}} \right)}^4}}}{{{{\left( {\dfrac{1}{{{n}}}\displaystyle\mathop \sum \nolimits_{{{i}} = 1}^{{n}} {{\left( {{{{x}}_{{i}}} - {\bar{{x}}}} \right)}^2}} \right)}^2}}} $$ (1) where,
${{{x}}_{{i}}}$ is the ith value,$ \overline {x} $ is the sample mean, and β is noise kurtosis. Theoretically, the kurtosis value of Gaussian noise is 3 (β = 3) and that of complex non-Gaussian noise is greater than 3. The larger the kurtosis value, the higher the impulsiveness of the complex noise. The selection of a 40-s window is acceptable for kurtosis measurement based on a 48-kHz sampling rate, as observed from previous animal data[23, 24]. The median kurtosis calculated in a 40-s window was used as the kurtosis value of the entire shift time. In this study, a median kurtosis of 4 was used as the boundary value between Gaussian and complex non-Gaussian noise.Both noise level and noise exposure time should be used to assess NIHL. Therefore, a comprehensive noise exposure metric (CNE) was used to quantify noise energy for each worker according to Formula 2[10]:
$$ {\rm{CNE}} = {{\rm{L}}_{{\rm{Aeq}},8{\rm{h}}}} + 10{{{\rm{log}}T}} $$ (2) where, T is the time of noise exposure in years. CNE is measured in dB (A) per year.
To incorporate kurtosis (β) into the evaluation of complex noise environments and unify CNE calculations for epidemiologic data, including both Gaussian and complex noise, the kurtosis- adjusted CNE (adj-CNE) was calculated according to Formula 3[10]:
$${\rm{adj}} - {\rm{CN}}{{\rm{E}}_{{\rm{Kurtosis}} - {\rm{adjusted}}}} = {{\rm{L}}_{{\rm{Aeq}},8{\rm{h}}}} + \frac{{\ln \left( {\rm{\beta }} \right) + 1.9}}{{{\rm{log}}\left( 2 \right)}}{\rm{logT}}$$ (3) When Gaussian noise has a kurtosis of β = 3, the term
$\left[\dfrac{{{\rm{ln}}\left( {\rm{\beta }} \right) + 1.9}}{{{\rm{log}}\left( 2 \right)}} \right]$ becomes equal to 10. Thus, for Gaussian noise, the adj-CNE equals the unadjusted CNE. Formula (3) shows that when LAeq,8h is fixed, the adj-CNE will be larger for complex noise (β > 3) than that for Gaussian noise (β = 3). -
Experienced audiologists performed pure-tone audiometry for the left and right ears of each participant at 500, 1,000, 2,000, 3,000, 4,000, 6,000, and 8,000 Hz in a sound-insulated room with background noise < 25 dB (A) (Supplementary Material 2 available in www.besjournal.com). All the subjects were required to be outside of their daily noise environment for at least 16 h before the test. The results of the pure-tone audiometry were adjusted according to gender and age by following the ISO 1999-2013 standard Table A.3. High-frequency NIHL (hNIHL) was diagnosed based on binaural high-frequency hearing threshold levels at 3, 4, and 6 kHz (HTL346) using Formula 4:
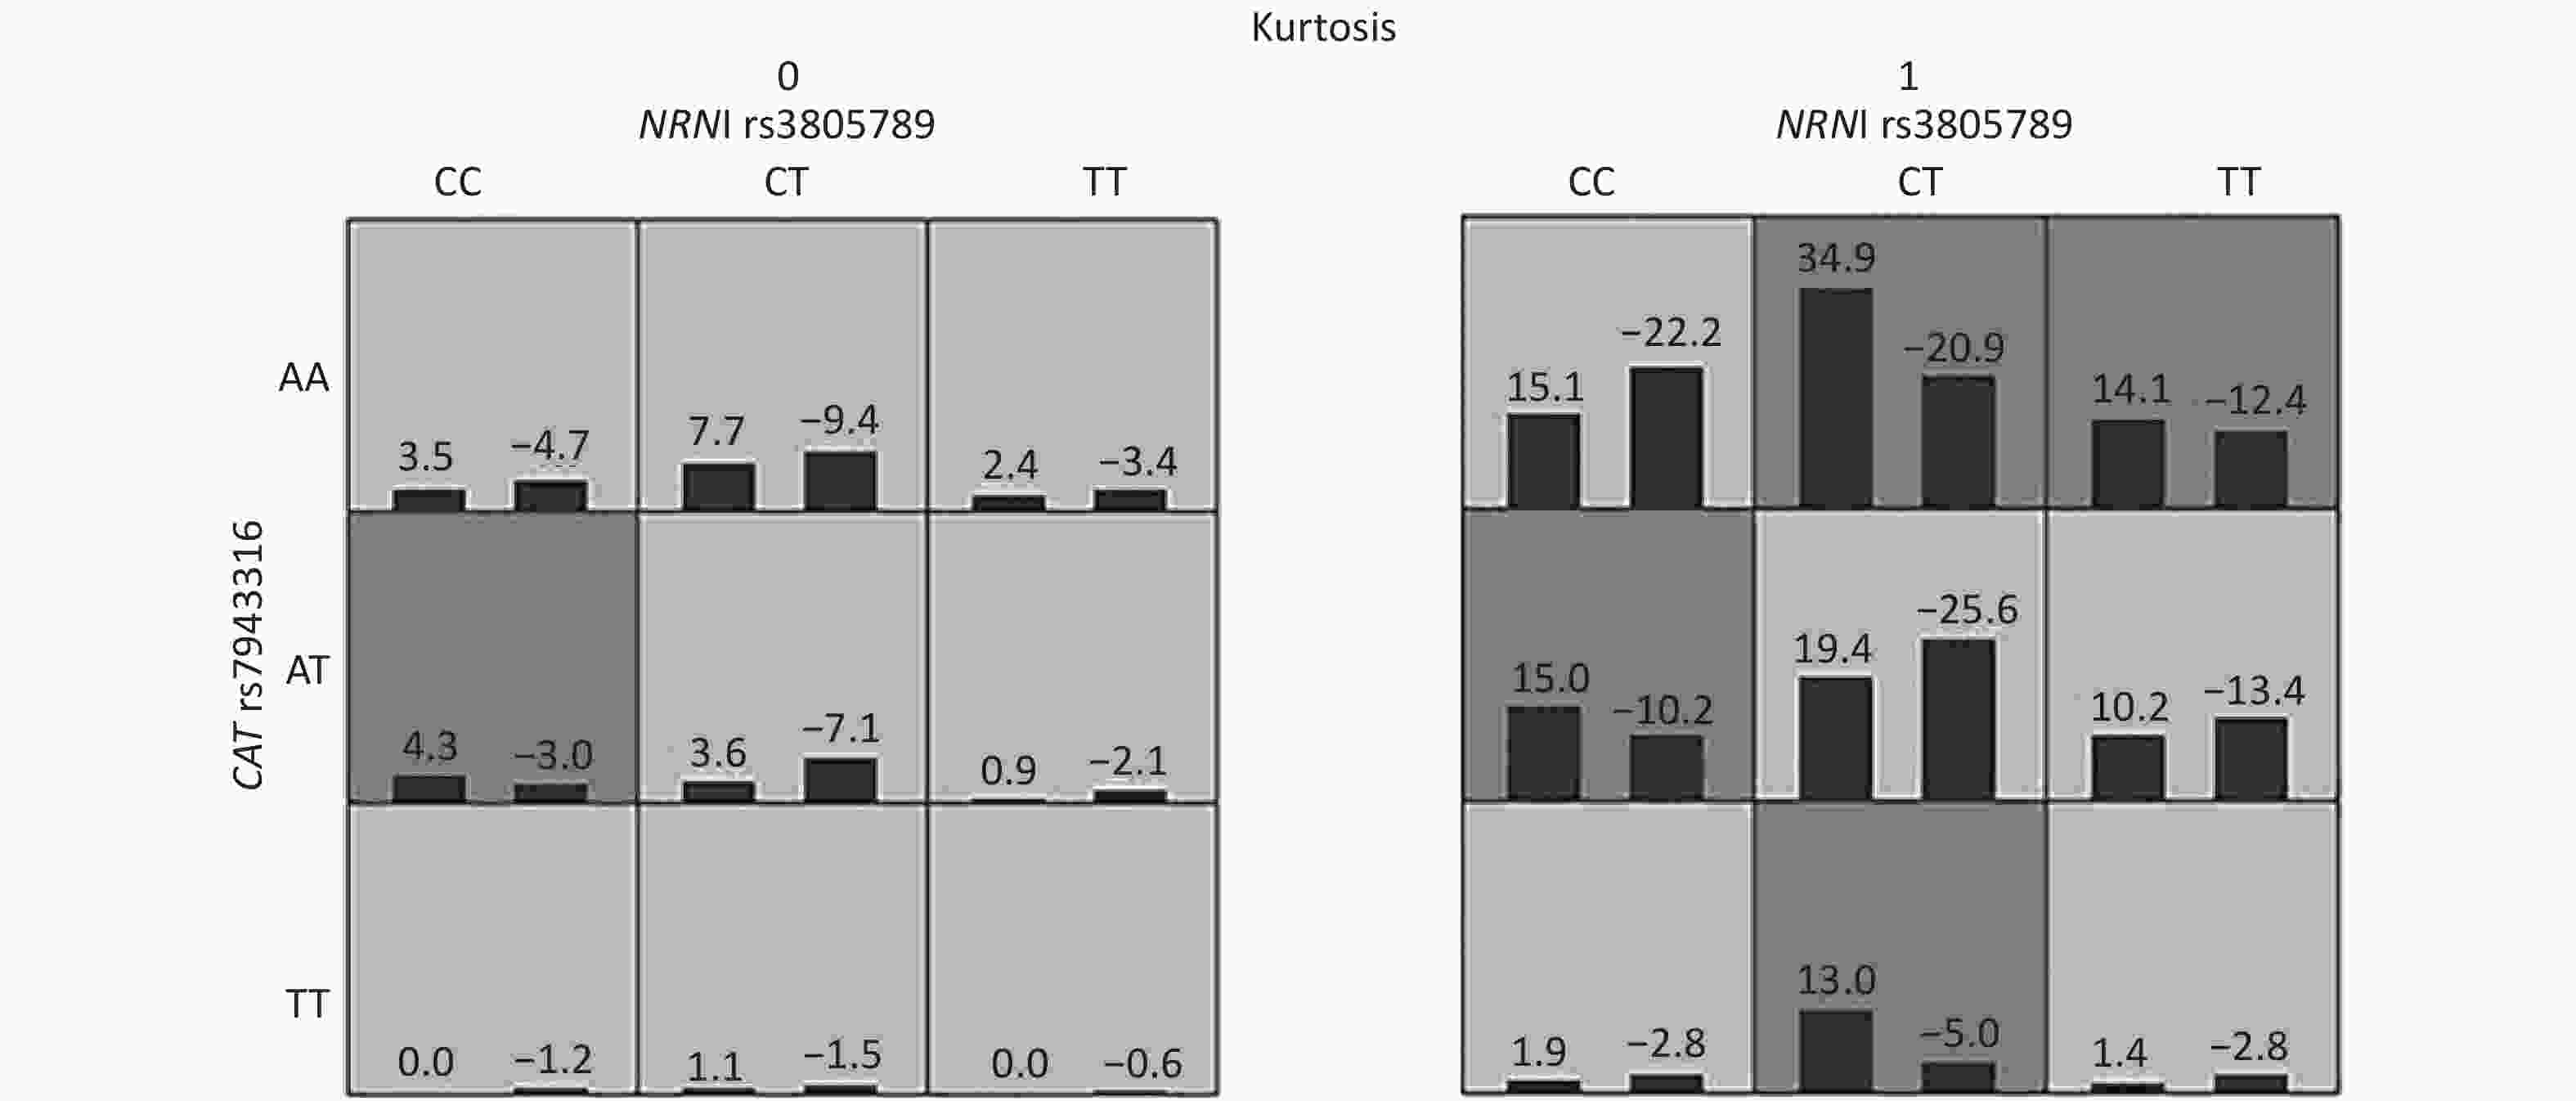
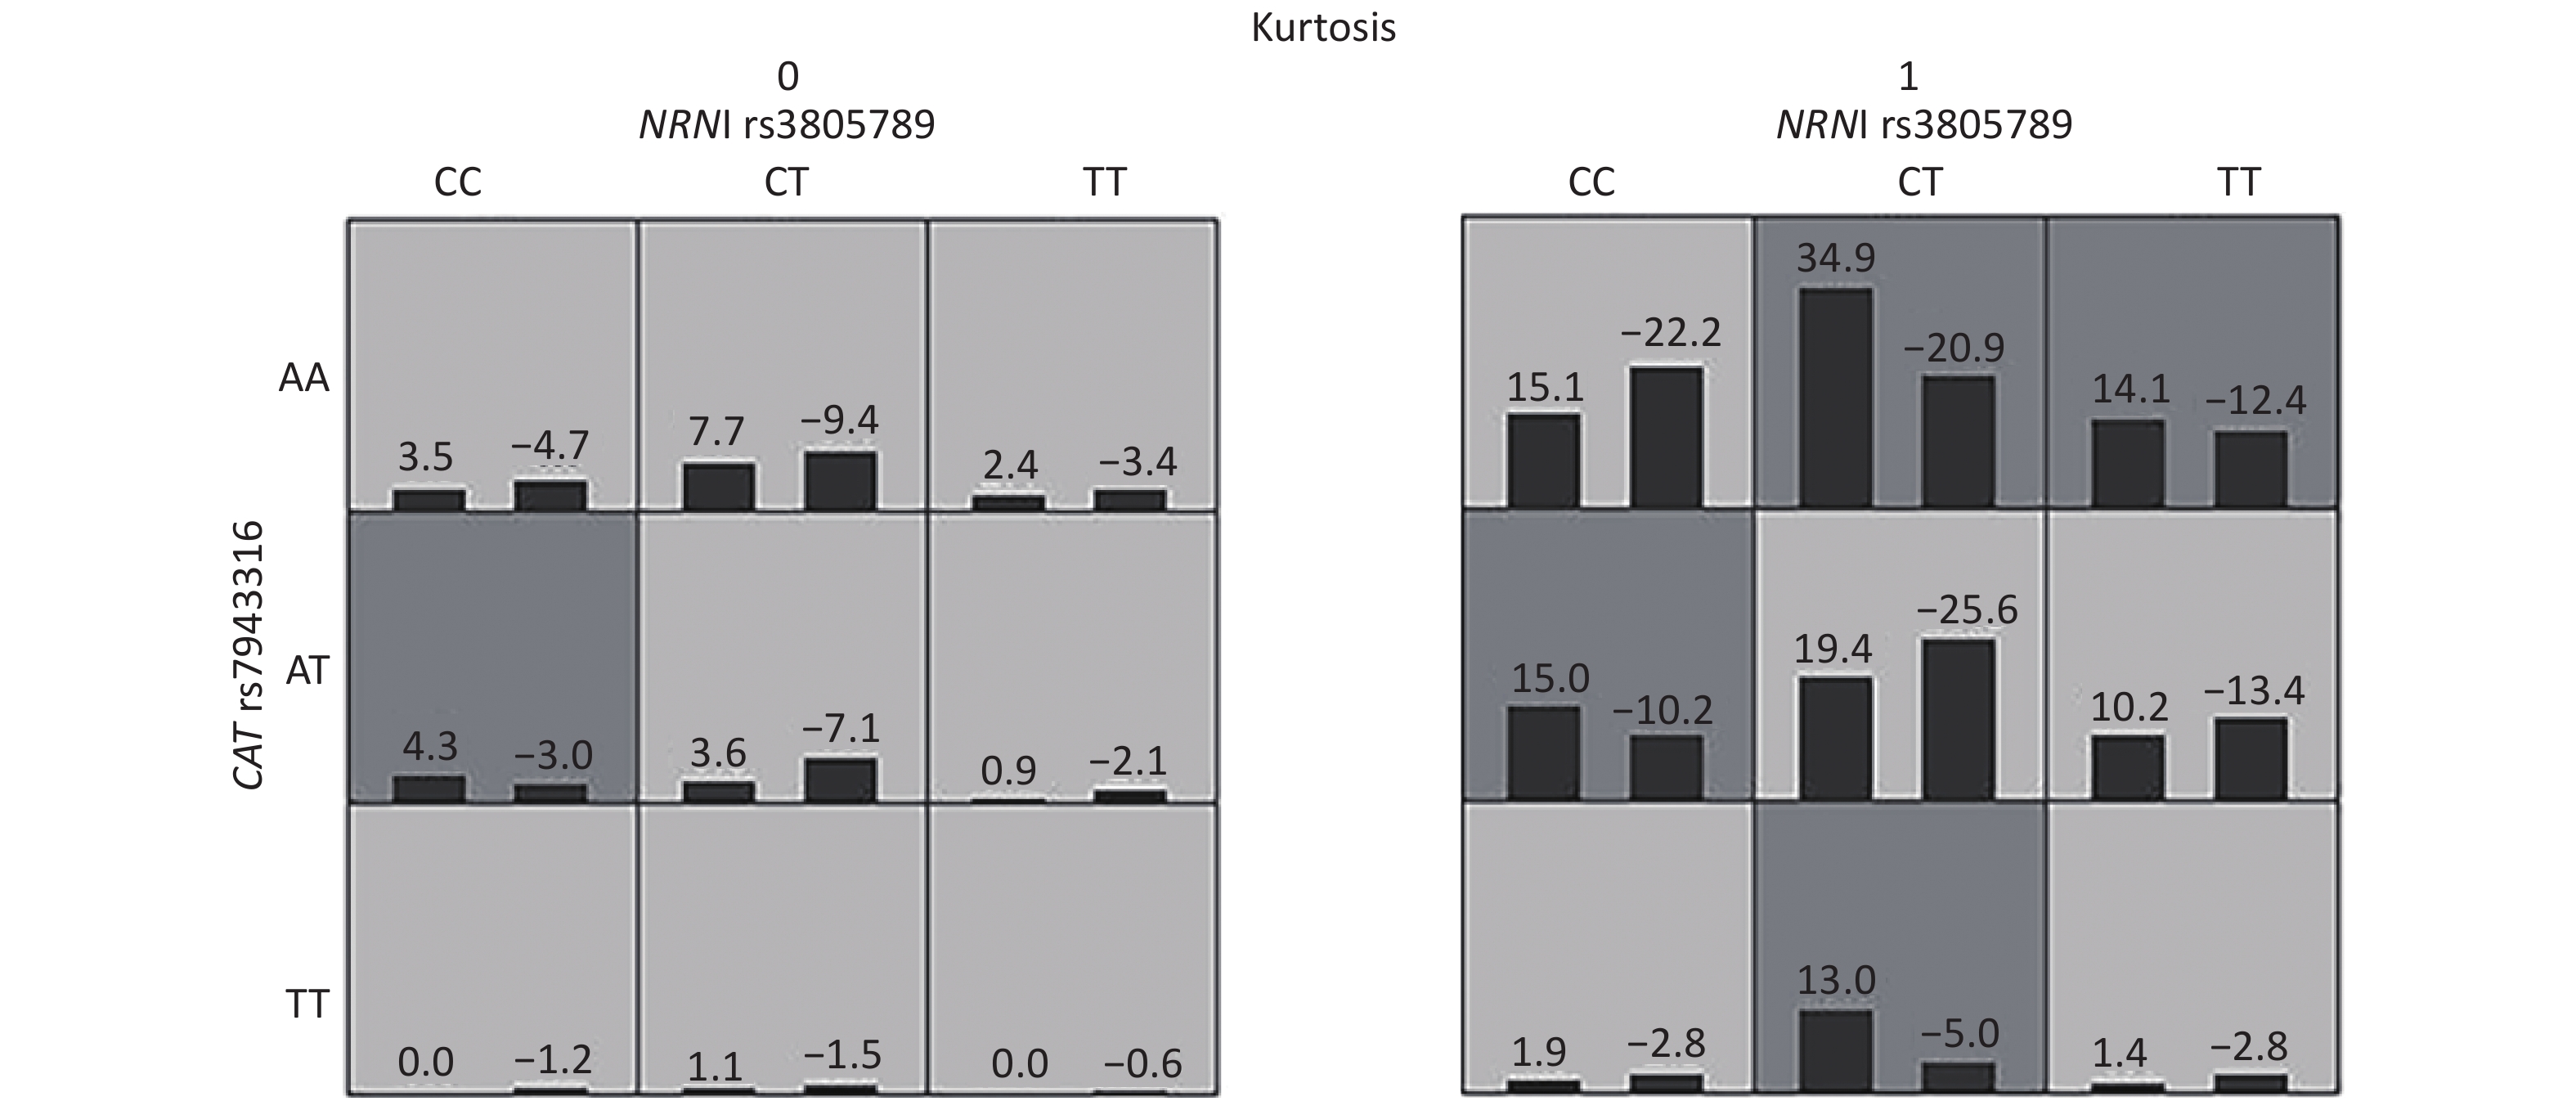
Figure S2. Interactions of NRN1 rs3805789, CAT rs7943316 and kurtosis associated with NIHL risk identified by GMDR
$$ {\rm{HT}}{{\rm{L}}_{346}} = \frac{{{\rm{Left}}\left( {{\rm{H}}{{\rm{L}}_{3{\rm{KHz}}}} + {\rm{H}}{{\rm{L}}_{4{\rm{KHz}}}} + {\rm{H}}{{\rm{L}}_{6{\rm{KHz}}}}} \right) + {\rm{Right}}\left( {{\rm{H}}{{\rm{L}}_{3{\rm{KHz}}}} + {\rm{H}}{{\rm{L}}_{4{\rm{KHz}}}} + {\rm{H}}{{\rm{L}}_{6{\rm{KHz}}}}} \right)}}{6}$$ (4) A binaural threshold > 25 dB was considered binaural hNIHL[16].
-
Oral mucosa cells from all the participants were collected using Yongming flocking swabs. DNA was extracted using the Tiangen Oral Mucosa Genomic DNA extraction kit (Tiangen Biotech, Beijing, China). For SNP analysis, 18 SNPs were selected from 7 genes (CAT, HSP70, CDH23, CASP3, CASP7, NOX3, and NRN1). The SNP selection process has previously been described[17]. The detailed information about the screened SNPs is shown in Table 1. We performed the genotyping analysis using the Kompetitive allele-specific polymerase chain reaction (KASP) method as previously described[17]. The primer and probe sequences are shown in Supplementary Tables S1 and S2 (available in www.besjournal.com). To control the quality, we randomly selected 10% of the samples and re-classified the genes; the concordance of the 18 SNPs was > 95%.
SNP ID Gene Chromosome Position Function Alleles rs1049216 CASP3 4 184628935 3 Prime UTR Variant G/A rs6948 CASP3 4 184627976 3 Prime UTR Variant T/G rs3805789 NRN1 6 6003752 Intron Variant, 5 Prime UTR Variant C/T rs2227956 HSPA1L 6 31810495 Missense Variant G/A, C, T rs1043618 HSPA1A/HSPA1L 6 31815730 5 Prime UTR Variant, 2KB Upstream Variant G/A, C, T rs2763979 HSPA1B 6 31826815 2KB Upstream Variant C/T rs3749930 NOX3 6 155440112 Missense Variant G/T rs12665231 NOX3 6 155395463 3 Prime UTR Variant T/C rs12195525 NOX3 6 155454846 Stop Gained, Synonymous Variant G/A, T rs3752752 CDH23 10 71695444 Synonymous Variant T/C rs3802711 CDH23 10 71784329 Missense Variant G/A rs1227049 CDH23 10 71675131 Missense Variant G/A, C, T rs12415607 CASP7 10 113678445 2KB Upstream Variant C/A rs1127687 CASP7 10 113730350 3 Prime UTR Variant G/A rs564250 CAT 11 34437314 2KB Upstream Variant T/A, C rs769214 CAT 11 34438170 2KB Upstream Variant G/A rs769217 CAT 11 34461361 Synonymous Variant C/T rs7943316 CAT 11 34438925 2KB Upstream Variant A/T Note. CASP3: Caspase3; NRN1: Neuritin1; HSP: Heat shock protein; NOX3: NADPH Oxidase3; CDH23: Cadherin-23; CASP7: Caspase7; CAT: Catalase. Table 1. Basic information for 18 SNPs
SNP ID Primer Allele FAM Primer Allele HEX Primer Common rs1049216 AGTAATTGTGAAAAAGTTAAACATTGAAGTAAT AGTAATTGTGAAAAAGTTAAACATTGAAC CAGTCTTAAGTGGGGGGAATATCATAAAA rs6948 GGAGGCCAGAGCTGAGCC CGGAGGCCAGAGCTGAGCA AGCCTGCCTCCCGGGCTGA rs3805789 TTCCGCCCTGAGGCCGAC CTTTCCGCCCTGAGGCCGAT CACTCAGCTTCCAGCCGGGTT rs2227956 ATGGTATTCTCAATGTCACAGCCAC AATGGTATTCTCAATGTCACAGCCAT CTTGTTCACCTTGCCGGTGCTCTT rs1043618 CCTGCTCTCTGTCGGCTCC CCTGCTCTCTGTCGGCTCG GTGTTCCGTTTCCAGCCCCCAA rs2763979 ATTCCTGGTTCACTCCTGGACG AATTCCTGGTTCACTCCTGGACA CTCGGGACTGTGAGGTCCTACTT rs3749930 ACACAACCACTGAATTGCTAAGGAC AACACAACCACTGAATTGCTAAGGAA CAGACCGGTGACGCCTGCTATT rs12665231 AGCTAAGGAAGTATGGTATAGTGTACT GCTAAGGAAGTATGGTATAGTGTACC CCCAGTTGGGAACTGGTGAATAATAATTA rs12195525 GTTCCTCTTATGAATGAAATAAGGTTTCA GTTCCTCTTATGAATGAAATAAGGTTTCG CTGTGCCTGAATTTTAACTGCATGCTAAT rs3752752 AAACATCACCCTCCTGGACATCAAT CATCACCCTCCTGGACATCAAC GTCCTTCCACGTGGGGTGGTT rs3802711 GTCCAGCTCCACGTCCTTCC GGTCCAGCTCCACGTCCTTCT TCTCCTGTGGAGGGGGTGCTAA rs1227049 AGCTGACTTCCCCAAAGGTGG AGCTGACTTCCCCAAAGGTGC GCTGTTGCAGGCAACTGACAATGAT rs12415607 AATGGAGTACATGCTTAGTGGTCG GAATGGAGTACATGCTTAGTGGTCT AGAAGATGGCGTTCTTGCCTGGTAT rs1127687 CACTCCATCTCAGTCAGTGGC CTCACTCCATCTCAGTCAGTGGT TGGAAAATGGAGCCATGACAAGAACAAA rs564250 AGACCTGGAGTCATTTCTTAACCTTTA GACCTGGAGTCATTTCTTAACCTTTG CAAATCCATAGTAACAAAAACAAAGGAAAA rs769214 TTTCAAAATTCCTGCTTACCTGGGA TCAAAATTCCTGCTTACCTGGGG ACTGGAGAAATCTGCTTCCCCAAATTTTA rs769217 GTGGCCAACTACCAGCGTGAC AGTGGCCAACTACCAGCGTGAT TACCCTGATTGTCCTGCATGCACAT rs7943316 AAATCTGCCTGTTGCCCCGAGT AAATCTGCCTGTTGCCCCGAGA GGTGCTGATTGGCTGAGCCTGAA Table S1. Primer information A
SNP ID Sequence CG%_FAM CG%_HEX CG% Common rs1049216 GGGGAATATCATAAAAATTC[A/G] TTACTTCAATGTTTAACTTT 21.2 24.2 37.9 rs6948 AGCCTGCCTCCCGGGCTGAG[G/T] GCTCAGCTCTGGCCTCCGGC 72.2 68.4 73.7 rs3805789 TCTTTCCGCCCTGAGGCCGA[C/T] GAACCCGGCTGGAAGCTGAG 70 61.9 61.9 rs2227956 TATTCTCAATGTCACAGCCA[C/T] GGACAAGAGCACCGGCAAGG 44 38.5 54.2 rs1043618 CCAGCCCCCAATCTCAGAGC[C/G] GAGCCGACAGAGAGCAGGGA 68.4 68.4 59.1 rs2763979 GAGGTCCTACTTCTACACAC[C/T] GTCCAGGAGTGAACCAGGAA 54.5 47.8 56.5 rs3749930 GACCGGTGACGCCTGCTATT[G/T] TCCTTAGCAATTCAGTGGTT 44 38.5 59.1 rs12665231 GGAAGTATGGTATAGTGTAC[T/C] GTTCACAATAGTTAATTATT 37 42.3 37.9 rs12195525 TATGAATGAAATAAGGTTTC[A/G] ACTGACAGGTATTAGAATTA 30 32.3 37.9 rs3752752 ATCACCCTCCTGGACATCAA[T/C] GACAACCACCCCACGTGGAA 42.3 54.5 61.9 rs3802711 GGAGGGGGTGCTAAGGGTCC[G/A] GAAGGACGTGGAGCTGGACC 65 61.9 59.1 rs1227049 GGCAACTGACAATGATGCAG[C/G] CACCTTTGGGGAAGTCAGCT 54.5 54.5 48 rs12415607 TGGCGTTCTTGCCTGGTATC[C/A] GACCACTAAGCATGTACTCC 45.8 42.3 48 rs1127687 GGAGCCATGACAAGAACAAA[G/A] CCACTGACTGAGATGGAGTG 58.3 52.2 39.3 rs564250 GCTTTTTTTTATATAATGAA[C/T] AAAGGTTAAGAAATGACTCC 37 42.3 26.7 rs769214 AAAATTCCTGCTTACCTGGG[A/G] GTAAAATTTGGGGAAGCAGA 49.2 44 37.9 rs769217 GTGGCCAACTACCAGCGTGA[C/T] GGCCCGATGTGCATGCAGGA 61.9 54.5 48 rs7943316 GAGCCTGAAGTCGCCACGGA[A/T] CTCGGGGCAACAGGCAGATT 54.5 54.5 56.5 Table S2. Primer information B
-
Normally distributed continuous variables are expressed as mean ± standard deviation (SD), and categorical variables are presented as percentages. Student’s t-test and the Chi-square test were used to compare the continuous variables and categorical variables, respectively, between the cases and controls. Non-normally distributed continuous variables were expressed as median (with the lower and upper quartiles) [M (P25, P75)] and analyzed using the Mann-Whitney U test. The cut-off values for the CNE and adj-CNE were determined to be 97.1420 dB(A) and 96.9939 dB(A), respectively, based on the receiver operating characteristic (ROC) curve between CNE, adj-CNE, and NIHL. The Hardy-Weinberg equilibrium (HWE) was tested using the Chi-square test. The generalized multifactor dimensionality reduction (GMDR Software Beta 0.9, www.ssg.uab.edu/gmdr/) method[25] was used to examine the effects of all possible interactions. The sign test of cross-validation consistency (CVC), testing balanced accuracy (TEBA), and trained balanced accuracy (TRBA) were calculated. A multivariate logistic regression model was used for the stratified analysis of the significant interactions obtained from the GMDR. Multiple comparisons were corrected using the Benjamini-Hochberg procedure. P < 0.05 indicated that the differences were statistically significant (shown in bold in the following tables).
-
A total of 614 participants (474 males and 140 females), including 307 NIHL patients and 307 controls, were selected (Table 2). The median age of the subjects was 35 years. 307 patients with NIHL and 307 controls were from packing worker (5.2% and 6.0%, respectively), coating worker (2.1% and 1.0%, respectively), electric welder (3.1% and 2.4%, respectively), fitter (6.8% and 7.0%, respectively), machinist (7.8% and 8.6%, respectively), wire drawing worker (2.3% and 1.8%, respectively), cold heading workers (4.6% and 8.3%, respectively), silk knead worker (3.6% and 4.6%, respectively), grinder (2.0% and 2.4%, respectively), Heat-treater (1.5% and 1.3%, respectively), punching worker (1.6% and 2.3%, respectively), and others (9.5% and 4.2%, respectively). The median kurtosis in the NIHL group was 7.25 (4.63–14.30), which was significantly higher than that in the control group [5.85 (4.06–12.51); P = 0.006]. The proportion of the subjects exposed to complex noise (β ≥ 4) was significantly greater in the NIHL group than that in the control group (P = 0.038). The median HTL346 in the NIHL group was 36.83 (29.83–49.83) dB, which was significantly higher than that in the control group [17.83 (14.17–21.00) dB; P < 0.001). The proportion of the subjects with high CNE (≥ 97.1420), high adj-CNE (≥ 96.9939), smoking habit, propensity to watch videos at high volume, or sedentary lifestyle was significantly greater in the NIHL group than in the control group (P < 0.05). However, there was no significant difference in education level or working pressure between the two groups (P > 0.05).
Characteristics Total (n = 614) NIHL (n = 307) Control (n = 307) χ2/z P Sex, n (%) Male 474 (77.2) 237 (38.6) 237 (38.6) 0.000 1.000 Female 140 (22.8) 70 (11.4) 70 (11.4) Age, y 35 (30–43) 36 (30–43) 34 (30–42) −1.959 0.050 Education, n (%) High school and above 347 (56.5) 168 (27.4) 179 (29.2) 0.802 0.371 Junior high school and below 267 (43.5) 139 (22.6) 128 (20.8) Type of work, n (%) Packing worker/
Coating worker/
Electric welder69 (11.2)/
19 (3.1)/ 34 (5.5)32 (5.2)/
13 (2.1)/19 (3.1)37 (6.0)/
6 (1.0)/15 (2.4)_ _ Fitter/Machinist 85 (13.8)/101 (16.4) 42 (6.8)/48 (7.8) 43 (7.0)/53 (8.6) Wire drawing worker/
Cold heading workers/
Silk knead worker25 (4.1)/
79 (12.9)/50 (8.2)14 (2.3)/
28 (4.6)/22 (3.6)11 (1.8)/
51 (8.3)/28 (4.6)Grinder/Heat-treater/
Punching worker27(4.4)/
17 (2.8)/24 (3.9)12 (2.0)/
9 (1.5)/10 (1.6)15 (2.4)/
8 (1.3)/14 (2.3)Others 84 (13.7) 58 (9.5) 26 (4.2) Years of noise exposure, y 3.00
(1.43–6.00)3.00
(1.20–6.00)3.00
(2.00–6.00)−1.002 0.317 HTL346, dB 25.00
(17.83–36.96)36.83
(29.83–49.83)17.83
(14.17–21.00)−21.442 < 0.001 Kurtosis, median (P25–P75) 6.62
(4.28–13.15)7.25
(4.63–14.30)5.85
(4.06–12.51)−2.755 0.006 < 4 114 (18.6) 47 (7.7) 67 (10.9) 4.039 0.038 ≥ 4 500 (81.4) 260 (42.3) 240 (39.1) CNE, median (P25–P75), dB(A) 93.69
(89.48–97.57)93.73
(89.67–98.24)93.62
(89.07–96.88)−1.23 0.219 < 97.1420 449 (73.1) 213 (34.7) 236 (38.4) 4.384 0.036 ≥ 97.1420 165 (26.9) 94 (15.3) 71 (11.6) Adj-CNE, median (P25–P75), dB(A) 94.89
(90.02–99.23)95.34
(90.20–99.61)94.61
(89.75–98.59)−1.564 0.118 < 96.9939 387 (63.0) 178 (29.0) 209 (34.0) 6.717 0.010 ≥ 96.9939 227 (37.0) 129 (21.0) 98 (16.0) Smoking, n (%) No 325 (52.9) 150 (24.4) 175 (28.5) 4.086 0.043 Yes 289 (47.1) 157 (25.6) 132 (21.5) Video volume, n (%) Low 149 (24.3) 60 (9.8) 89 (14.5) 7.453 0.006 High 465 (75.7) 247 (40.2) 218 (35.5) Physical exercise, n (%) Never 418 (68.1) 224 (36.5) 194 (31.6) 6.745 0.009 Regular 196 (31.9) 83 (13.5) 113 (18.4) Working pressure, n (%) Low 113 (18.4) 49 (8.0) 64 (10.4) 2.440 0.118 High 501 (81.6) 258 (42.0) 243 (39.6) Table 2. General characteristics of subjects between NIHL and control groups
-
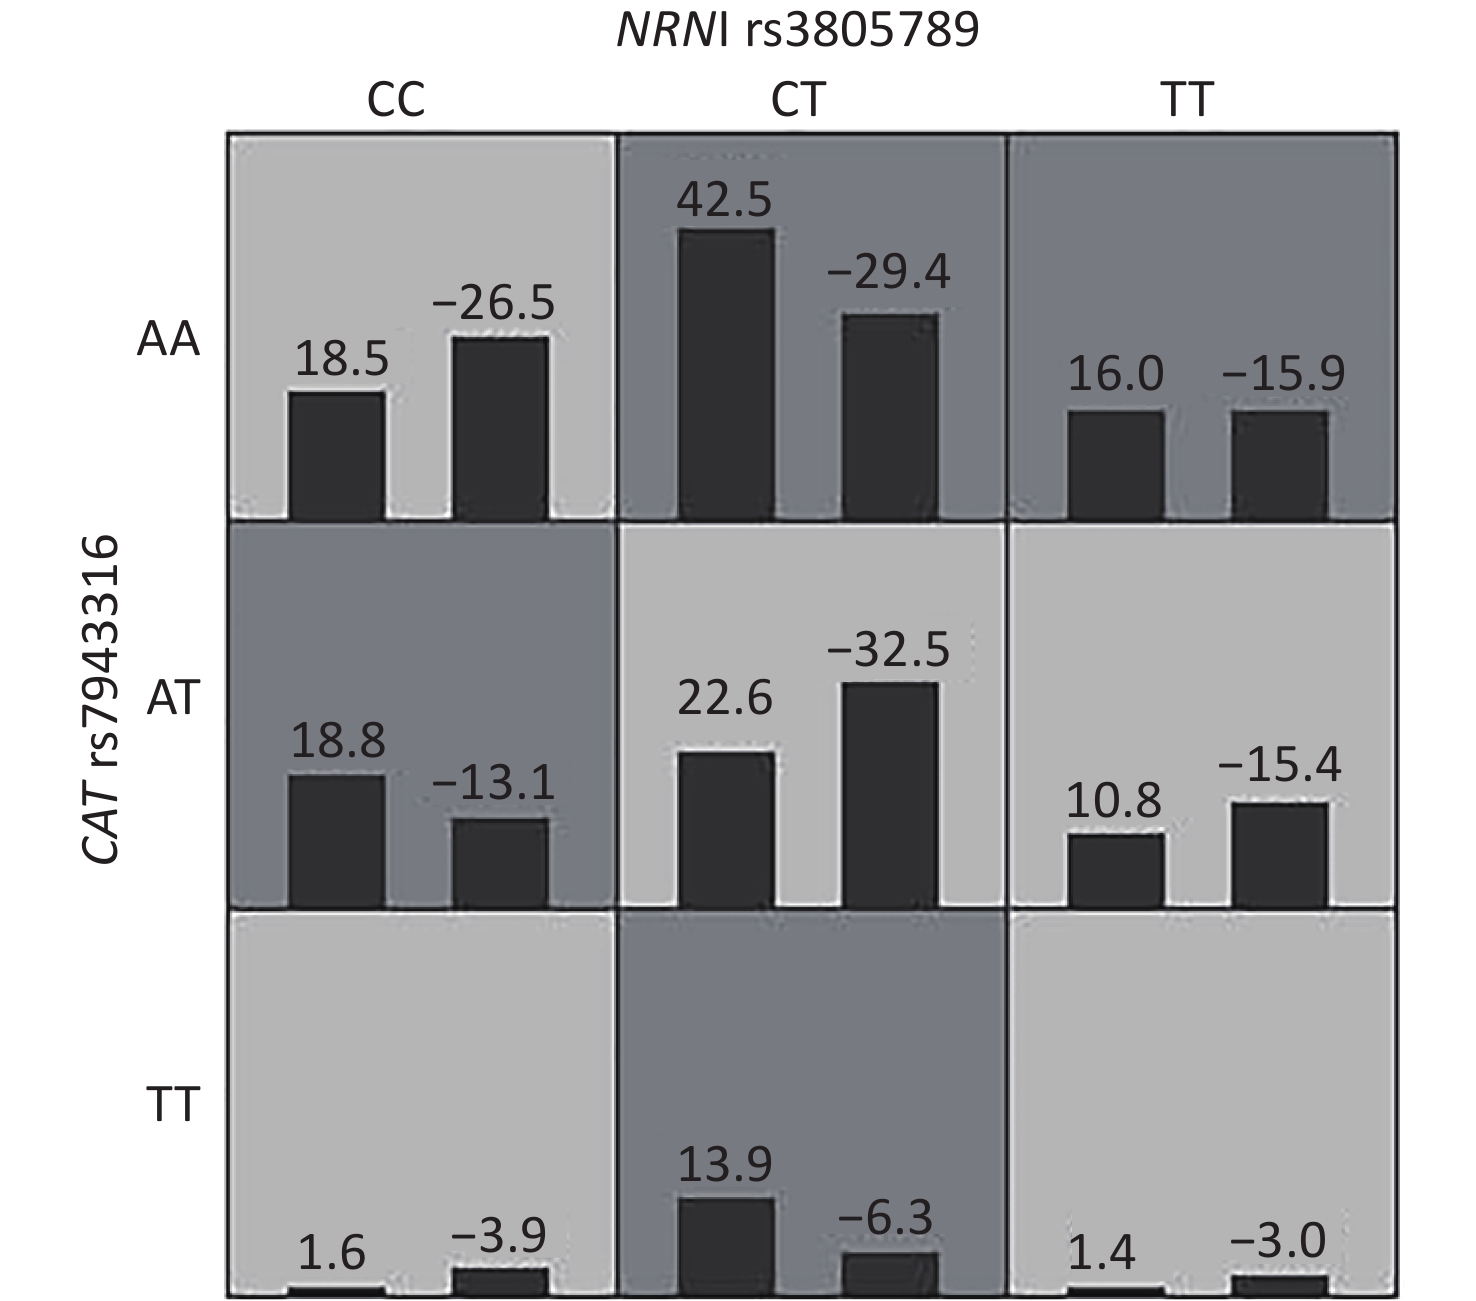
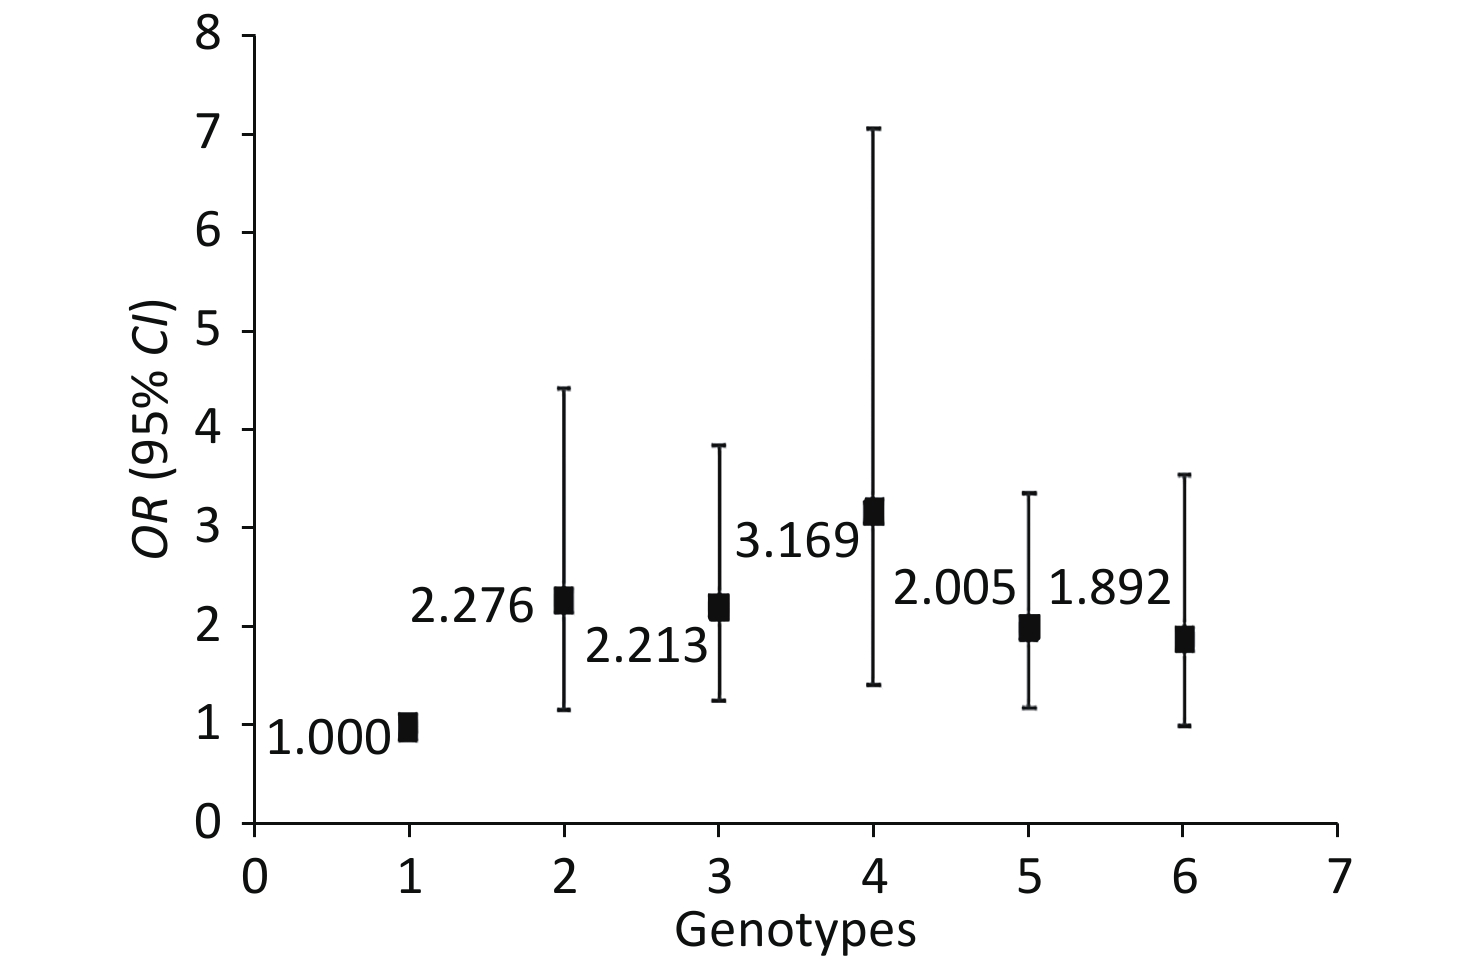
The genotype frequencies among the cases and controls did not deviate from the HWE for any of the 18 SNPs (P > 0.05, Table 3). We assessed for NIHL-related interactions among the 18 genetic variants by using GMDR. Consequently, 18 models were generated from the 18 SNPs (Table 4). After adjusting age, gender, education level, years of noise exposure, kurtosis, CNE, adj-CNE, smoking, video volume, physical exercise, and working pressure, a significant two-locus model (P = 0.0107) involving NRN1 rs3805789 and CAT rs7943316 was found (Table 4, Supplementary Figure S1 available in www.besjournal.com). The CVC of this two-locus model was 10/10, and the TEBA was 0.5768. We then conducted a stratified analysis for the significant models by using logistic regression. When compared with the subjects carrying NRN1 rs3805789-CC and CAT rs7943316-AA, those with NRN1 rs3805789-CC and CAT rs7943316-AT, NRN1 rs3805789-CT and CAT rs7943316-AA, NRN1 rs3805789-CT and CAT rs7943316-TT, NRN1 rs3805789-CT/TT and CAT rs7943316-AA, or NRN1 rs3805789-CC and CAT rs7943316-AT/TT had higher risks of NIHL (OR: 2.276, 95% CI: 1.171–4.427; OR: 2.213, 95% CI: 1.273–3.849; OR: 3.169, 95% CI: 1.425–7.048; OR: 2.005, 95% CI: 1.200–3.348; OR: 1.892, 95% CI: 1.008–3.550; P < 0.05) (Figure 1, Supplementary Table S3 available in www.besjournal.com).
SNP ID Gene Group Genotype (frequency %) Allele (frequency %) P OR (95% CI) MAFa MAFb HWE P rs1049216 CASP3 AA AG GG A G Case 10 (3.3) 105 (34.2) 192 (62.5) 125 (20.4) 489 (79.6) 0.046 1.046
(1.005–1.802)0.403 0.160 0.616 Control 9 (2.9) 80 (26.1) 218 (71.0) 98 (16.0) 516 (84.0) rs6948 CASP3 GG GT TT G T Case 10 (3.3) 92 (30.0) 205 (66.8) 112 (18.2) 502 (81.8) 0.064 1.334
(0.982–1.809)0.426 0.143 0.431 Control 8 (2.6) 72 (23.5) 227 (73.9) 88 (14.3) 526 (85.7) rs3805789 NRN1 CC CT TT C T Case 84 (27.4) 163 (53.1) 60 (19.5) 331 (53.9) 283 (46.1) 0.864 1.020
(0.815–1.276)0.300 0.466 0.216 Control 93 (30.3) 142 (46.3) 72 (23.5) 328 (53.4) 286 (46.6) rs2227956 HSPA1L CC CT TT C T Case 15 (4.9) 86 (28.0) 206 (67.1) 116 (18.9) 498 (81.1) 0.942 0.989
(0.744–1.316)0.123 0.191 0.671 Control 10 (3.3) 97 (31.6) 200 (65.1) 117 (19.1) 497 (80.9) rs1043618 HSPA1A/
HSPA1LCC CG GG C G Case 42 (13.7) 118 (38.4) 147 (47.9) 202 (32.9) 412 (67.1) 0.903 0.985
(0.777–1.250)0.481 0.332 0.587 Control 36 (11.7) 132 (43.0) 139 (45.3) 204 (33.2) 410 (66.8) rs2763979 HSPA1B CC CT TT C T Case 168 (54.7) 102 (33.2) 37 (12.1) 438 (71.3) 176 (28.7) 0.453 1.098
(0.860–1.403)0.448 0.306 0.387 Control 151 (49.2) 124 (40.4) 32 (10.4) 426 (69.4) 188 (30.6) rs3749930 NOX3 GG GT TT G T Case 86 (28.0) 148 (48.2) 73 (23.8) 320 (52.1) 294 (47.9) 0.123 1.192
(0.953–1.492)0.197 0.477 0.662 Control 68 (22.1) 157 (51.1) 82 (26.7) 293 (47.7) 321 (52.3) rs12665231 NOX3 CC CT TT C T Case 23 (7.5) 100 (32.6) 184 (59.9) 146 (23.8) 468 (76.2) 0.841 0.974
(0.749–1.265)0.188 0.243 0.126 Control 23 (7.5) 103 (33.6) 181 (59.0) 149 (24.3) 465 (75.7) rs12195525 NOX3 GG TG TT G T Case 267 (87.0) 35 (11.4) 5 (1.6) 569 (92.7) 45 (7.3) 0.057 1.471
(0.987–2.193)0.129 0.104 0.103 Control 249 (81.1) 52 (16.9) 6 (2.0) 550 (89.6) 64 (10.4) rs3752752 CDH23 CC TC TT C T Case 84 (27.4) 142 (46.3) 81 (26.4) 310 (50.5) 304 (49.5) 0.954 0.994
(0.794–1.243)0.445 0.493 0.154 Control 85 (27.7) 141 (45.9) 81 (26.4) 311 (50.7) 303 (49.3) rs3802711 CDH23 AA CA CC A C Case 19 (6.2) 107 (34.9) 181 (59.0) 145 (23.6) 469 (76.4) 0.305 1.151
(0.880–1.506)0.139 0.212 0.345 Control 11 (3.6) 108 (35.2) 188 (61.2) 130 (21.2) 484 (78.8) rs1227049 CDH23 CC CG GG C G Case 37 (12.1) 127 (41.4) 143 (46.6) 201 (32.7) 413 (67.3) 0.325 1.129
(0.887–1.436)0.185 0.301 0.612 Control 26 (8.5) 133 (43.3) 148 (48.2) 185 (30.1) 429 (69.9) rs12415607 CASP7 AA CA CC A C Case 51 (16.6) 155 (50.5) 101 (32.9) 257 (41.90 357 (58.1) 0.035 1.280
(1.017–1.611)0.268 0.360 0.237 Control 35 (11.4) 151 (49.2) 121 (39.4) 221 (36.0) 393 (64.0) rs1127687 CASP7 AA GA GG A G Case 17 (5.5) 94 (30.6) 196 (63.8) 128 (20.8) 486 (79.2) 0.103 0.801
(0.613–1.046)0.230 0.248 0.955 Control 19 (5.5) 114 (37.1) 174 (56.7) 152 (24.8) 462 (75.2) rs564250 CAT CC TC TT C T Case 195 (63.5) 92 (30.0) 20 (6.5) 482 (78.5) 132 (21.5) 0.623 0.933
(0.709–1.229)0.212 0.204 0.249 Control 198 (64.5) 93 (30.3) 16 (5.2) 489 (79.6) 125 (20.4) rs769214 CAT AA AG GG A G Case 31 (10.1) 120 (39.1) 156 (50.8) 182 (29.6) 432 (70.4) 0.852 0.977
(0.765–1.247)0.473 0.301 0.972 Control 28 (9.1) 129 (42.0) 150 (48.9) 185 (30.1) 429 (69.9) rs769217 CAT CC CT TT C T Case 83 (27.0) 148 (48.2) 76 (24.8) 314 (51.1) 300 (48.9) 0.864 1.020
(0.815–1.275)0.263 0.493 0.333 Control 83 (27.0) 145 (47.2) 79 (25.7) 311 (50.7) 303 (49.3) rs7943316 CAT AA AT TT A T Case 160 (52.1) 112 (36.5) 35 (11.4) 432 (70.4) 182 (29.6) 0.664 1.056
(0.827–1.347)0.488 0.308 0.609 Control 149 (48.5) 127 (41.4) 31 (10.1) 425 (69.2) 189 (30.8) Note. MAF: Minor allele frequency; HWE: Hardy–Weinberg equilibrium; a1000 genomes; bData form this study; OR: odds ratio; CI: confidence interval. P-values of deviation from HWE between the NIHL group and control group. Table 3. The genotype and allele frequencies of 18 SNPs in NIHL cases and control subjects
No. of loci Model TRBA TEBA P value CVC 1 X1 0.5480 0.5112 7 (0.1719) 8/10 2 X3 X18 0.5921 0.5771 9 (0.0107) 10/10 3 X3 X10 X16 0.6186 0.5116 6 (0.3770) 3/10 4 X3 X8 X10 X18 0.6662 0.4591 2 (0.9893) 2/10 5 X3 X6 X10 X13 X17 0.7392 0.4650 4 (0.8281) 3/10 6 X3 X5 X10 X12 X13 X17 0.8290 0.5218 7 (0.1719) 8/10 7 X3 X5 X7 X10 X11 X12 X17 0.9060 0.5538 6 (0.3770) 9/10 8 X3 X5 X7 X10 X11 X12 X13 X17 0.9527 0.4351 2 (0.9893) 4/10 9 X3 X4 X5 X7 X8 X10 X12 X13 X17 0.9927 NaN 4 (0.8281) 4/10 10 X3 X4 X5 X7 X8 X10 X11 X12 X13 X17 0.9926 NaN 4 (0.8281) 3/10 11 X2 X3 X4 X5 X6 X7 X8 X11 X12 X14 X17 0.9981 NaN 3 (0.9453) 1/10 12 X1 X3 X4 X5 X6 X7 X8 X10 X12 X13 X14 X17 1.0000 NaN 2 (0.9893) 1/10 13 X1 X2 X3 X4 X5 X7 X8 X9 X11 X12 X14 X16 X17 1.0000 NaN 3 (0.9453) 2/10 14 X1 X2 X3 X4 X5 X6 X7 X8 X9 X11 X12 X14 X16 X17 1.0000 NaN 4 (0.8281) 4/10 15 X1 X2 X3 X4 X5 X6 X7 X8 X9 X10 X11 X12 X13 X14 X18 1.0000 NaN 2 (0.9893) 8/10 16 X1 X2 X3 X4 X5 X6 X7 X8 X9 X10 X11 X12 X13 X14 X15 X18 1.0000 NaN 0 (1.0000) 8/10 17 X1 X2 X3 X4 X5 X6 X7 X8 X9 X10 X11 X12 X13 X14 X15 X16 X17 1.0000 N/A 0 (1.0000) 10/10 18 X1 X2 X3 X4 X5 X6 X7 X8 X9 X10 X11 X12 X13 X14 X15 X16 X17 X18 1.0000 N/A 0 (1.0000) 10/10 Note. P-values were obtained from the GMDR analysis which adjusted for age, gender, education, years of exposure, kurtosis, CNE, adj-CNE, smoking, video volume, physical exercise, and working pressure. TRBA: Training balanced accuracy; TEBA: Testing Balanced accuracy; CVC: cross-validation consistency; X1: CASP3 rs1049216; X2: CASP3 rs6948; X3: NRN1 rs3805789; X4: HSPA1L rs2227956; X5: HSPA1A/HSPA1L rs1043618; X6: HSPA1B rs2763979; X7: NOX3 rs3749930; X8: NOX3 rs12665231; X9: NOX3 rs12195525; X10: CDH23 rs3752752; X11: CDH23 rs3802711; X12: CDH23 rs1227049; X13: CASP7 rs12415607; X14: CASP7 rs1127687; X15: CAT rs564250; X16: CAT rs769214; X17: CAT rs769217; X18: CAT rs7943316. Table 4. Association of multidimensional gene-gene interactions of 18 SNPs with NIHL risk
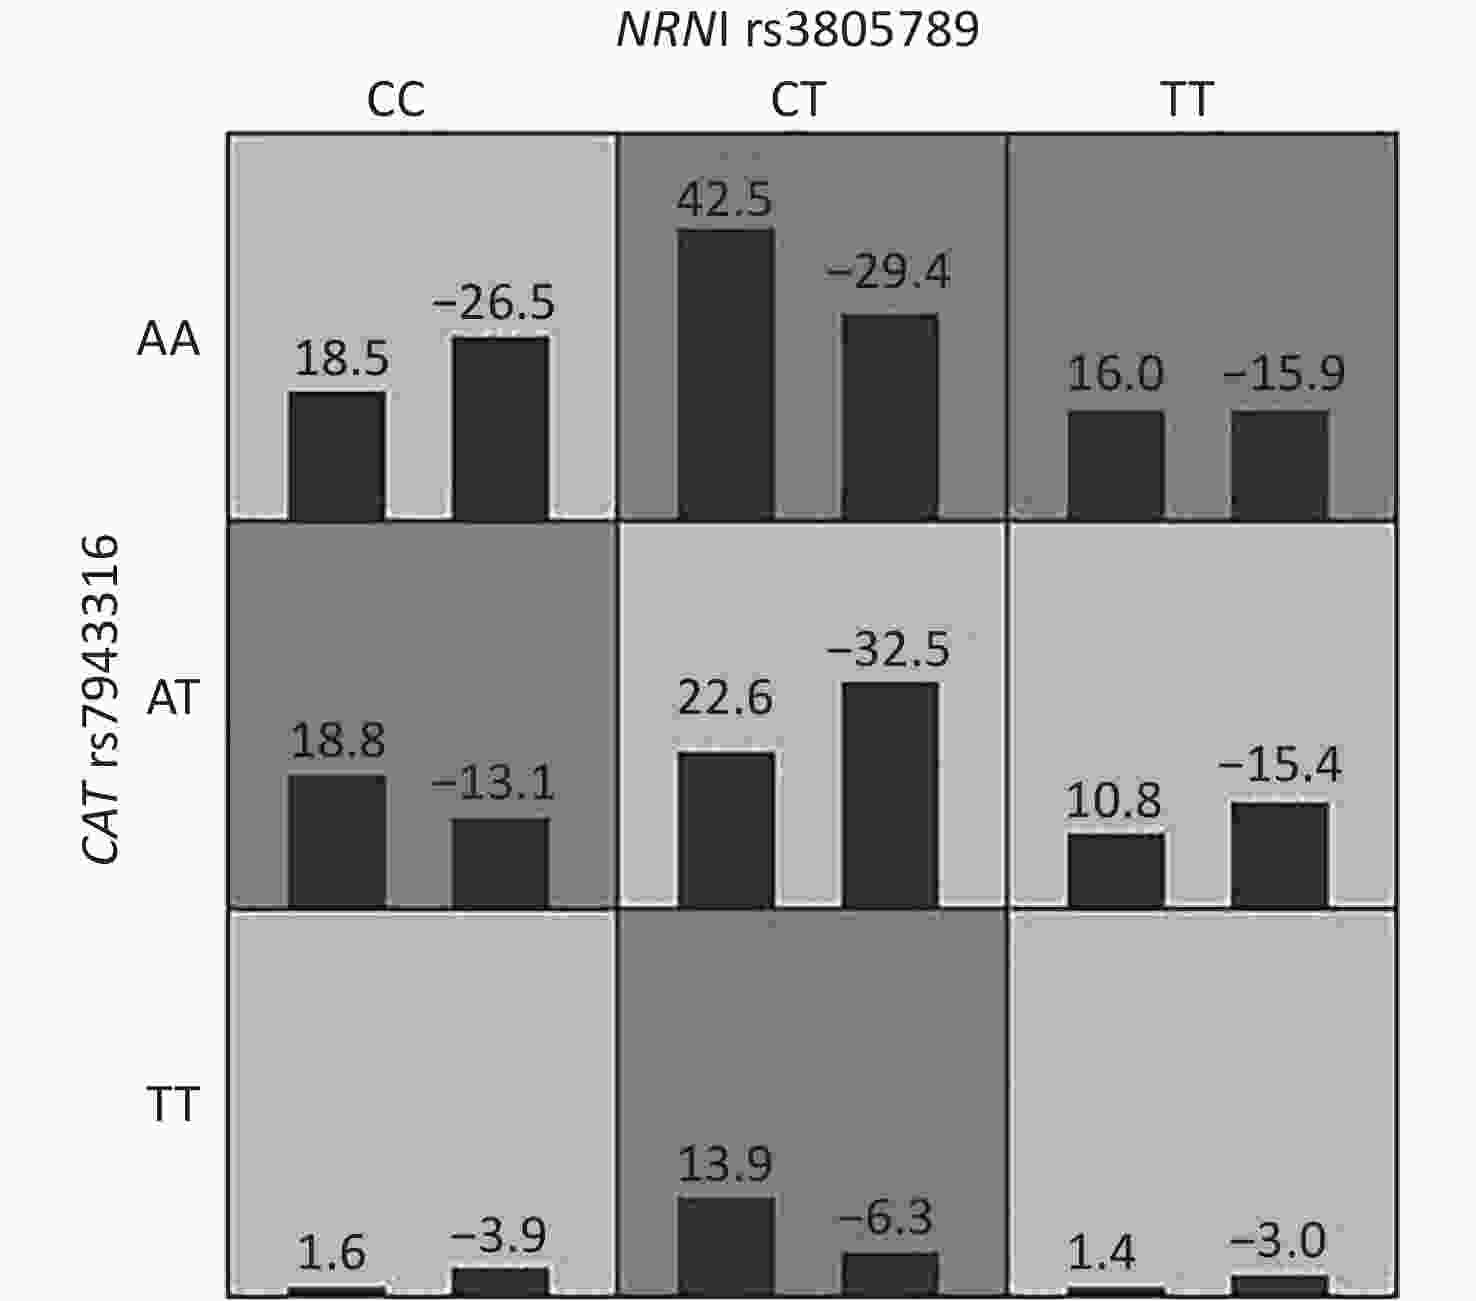
Figure S1. Interactions of NRN1 rs3805789 and CAT rs7943316 associated with NIHL risk identified by GMDR

Figure 1. Stratified analysis for gene–gene interaction on NIHL risk using logistic regression.
NRN1 CAT Risk of NIHL rs3805789 rs7943316 Controls/Cases, n (%) ORs (95% CI)* P FDR CC AA 55 (17.9)/39 (12.7) 1.00 CC AT 29 (9.4)/41 (13.4) 2.276 (1.171–4.427) 0.015 0.041 CC TT 9 (2.9)/4 (1.3) 0.650 (0.173–2.442) 0.524 0.64 CT AA 61 (19.9)/87 (28.3) 2.213 (1.273–3.849) 0.005 0.028 CT AT 67 (21.8)/48 (15.6) 1.036 (0.578–1.857) 0.905 0.905 CT TT 14(4.6)/28 (9.1) 3.169 (1.425–7.048) 0.005 0.028 TT AA 33 (10.7)/34 (11.1) 1.620 (0.419–6.205) 0.154 0.282 TT AT 31(10.1)/23 (7.5) 1.048 (0.514–2.137) 0.898 0.905 TT TT 8 (2.6)/3 (1.0) 0.558 (0.131–2.377) 0.430 0.591 CT+TT AA 94 (30.6)/121 (39.4) 2.005 (1.200–3.348) 0.008 0.029 CC AT+TT 38 (12.4)/45 (14.7) 1.892 (1.008–3.550) 0.047 0.103 CT+TT AT+TT 120 (39.1)/102 (33.2) 1.255 (0.752–2.094) 0.385 0.591 Note. NRN1: neuritin 1; CAT: catalase; ORs: odds ratio; CI: confidential interval. *ORs (95% CI) and P value were obtained with the use of multivariate logistic regression analysis after adjustment for age, gender, education, years of exposure, kurtosis, CNE, adj-CNE, smoking, video volume, physical exercise, and working pressure. FDR (false discovery rate) was obtained with the use of Benjamin-Hochberg procedure for controlling the false positive rate in multiple comparison. Table S3. Jointed effects of NRN1 and CAT on NIHL by using the logistic regression models
-
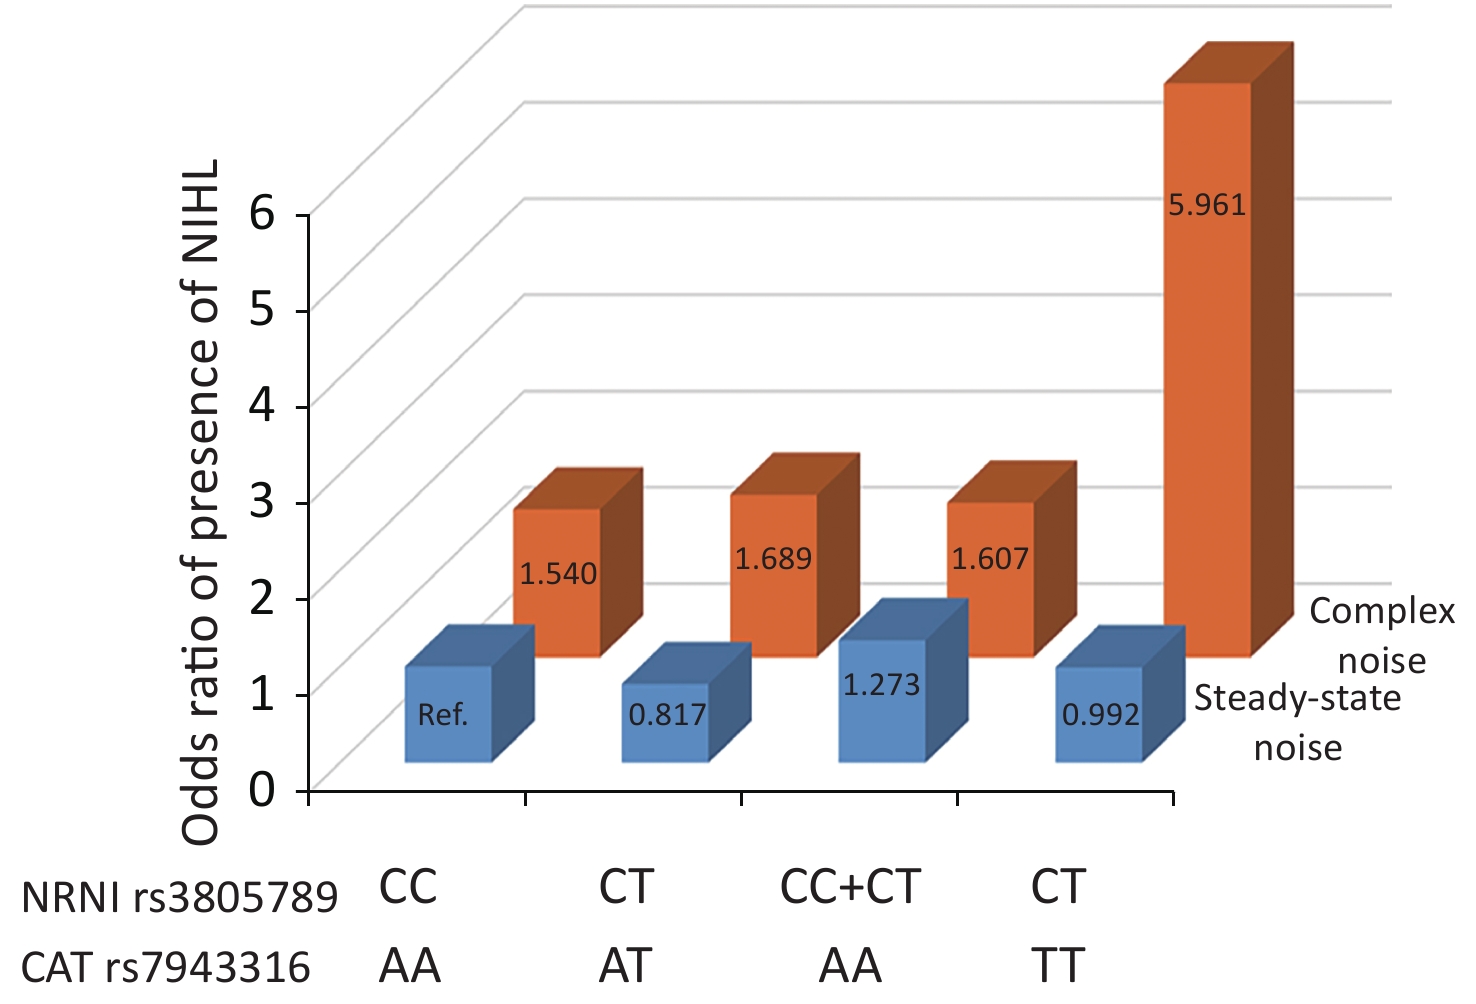
We next asked whether there were any multidimensional interactions between the genes and noise metrics by using the GMDR method. After adjustments were made for age, gender, education, smoking, video volume, physical exercise, and working pressure, the best model for the risk of NIHL was found to be the interaction between NRN1 rs3805789, CAT rs7943316, and kurtosis. This interaction had the score of 10/10 for CVC and 10 for the sign test (P = 0.0010; Table 5A, Supplementary Figure S2 available in www.besjournal.com). The joint effects of the individual interactions of NRN1 rs3805789 and CAT rs7943316 with kurtosis on NIHL risk were analyzed via logistic regression analysis. The results showed that, after adjusting age, gender, education level, years of noise exposure, smoking, video volume, physical exercise, and working pressure, the subjects exposed to complex noise who carried NRN1 rs3805789-CT and CAT rs7943316-TT or NRN1 rs3805789-CT/TT and CAT rs7943316-AA had higher risks of NIHL than those exposed to steady noise who carried NRN1 rs3805789-CC and CAT rs7943316-AA (OR: 5.961, 95% CI: 1.219–29.155; OR: 1.607, 95% CI: 1.035–2.494; P < 0.05) (Figure 2, Supplementary Table S4 available in www.besjournal.com). In the GMDR model, a two-locus model including NRN1 rs3805789 and CAT rs7943316 was found to be significant. This observation is consistent with the results of gene-gene interactions. A four‐locus model including NRN1 rs3805789, CAT rs7943316, kurtosis, and adj-CNE was found to be the interaction, in which the CVC was 10/10, and the TEBA was 0.5856 (P = 0.0107; Table 5A). In addition, a five‐locus model was also identified for the risk of NIHL. In this model, the CVC was 10/10, and TEBA was 0.5856 (P = 0.0107; Table 5A).
No. of loci Model TRBA TEBA P value CVC A. Gene–noise-metric interactiona 1 K4 0.5363 0.4907 5 (0.6230) 4/10 2 X3 X18 0.5903 0.5762 9 (0.0107) 10/10 3 X3 X18 K4 0.6003 0.5863 10 (0.0010) 10/10 4 X3 X18 adj-CNE K4 0.6125 0.5856 9 (0.0107) 10/10 5 X3 X18 adj-CNE CNE K4 0.6125 0.5856 9 (0.0107) 10/10 B. Gene–lifestyle-factor interactionb 1 Y3 0.5554 0.5356 6 (0.3770) 9/10 2 X3 X18 0.5927 0.5349 7 (0.1719) 7/10 3 X3 X18 Y4 0.6291 0.5377 9 (0.0107) 5/10 4 X3 X18 Y1 Y3 0.6830 0.5850 9 (0.0107) 9/10 5 X3 X18 Y1 Y3 Y4 0.7387 0.5570 9 (0.0107) 7/10 6 X3 X18 Y1 Y2 Y3 Y4 0.7946 0.5866 9 (0.0010) 10/10 C. Noise-metric–lifestyle-factor interactionc 1 Y3 0.5543 0.5340 6 (0.3770) 9/10 2 Y2 Y3 0.5816 0.5209 7 (0.1719) 5/10 3 Y2 Y3 Y4 0.6069 0.4792 3 (0.9453) 6/10 4 Y1 Y2 Y3 Y4 0.6494 0.5509 9 (0.0107) 10/10 5 Y1 Y2 Y3 Y4 K4 0.6778 0.5467 9 (0.0107) 10/10 6 Y1 Y2 Y3 Y4 K4 adj-CNE 0.6970 0.5437 9 (0.0107) 7/10 7 Y1 Y2 Y3 Y4 K4 adj-CNE CNE 0.6920 0.5503 9 (0.0107) 10/10 Note. aAdjusted for age, gender, education, smoking, video volume, physical exercise, and working pressure; bAdjusted for age, gender, education, years of exposure, kurtosis, CNE, adj-CNE; cAdjusted for age, gender, education; TRBA: Training balanced accuracy; TEBA: Testing Balanced accuracy; CVC: cross-validation consistency; X3: NRN1 rs3805789; X18: CAT rs7943316; K4: kurtosis; Y1: smoking; Y2: video volume; Y3: physical exercise; Y4: working pressure. Table 5. Associations of interactions among genes, noise metrics and lifestyle factors with the risk of NIHL
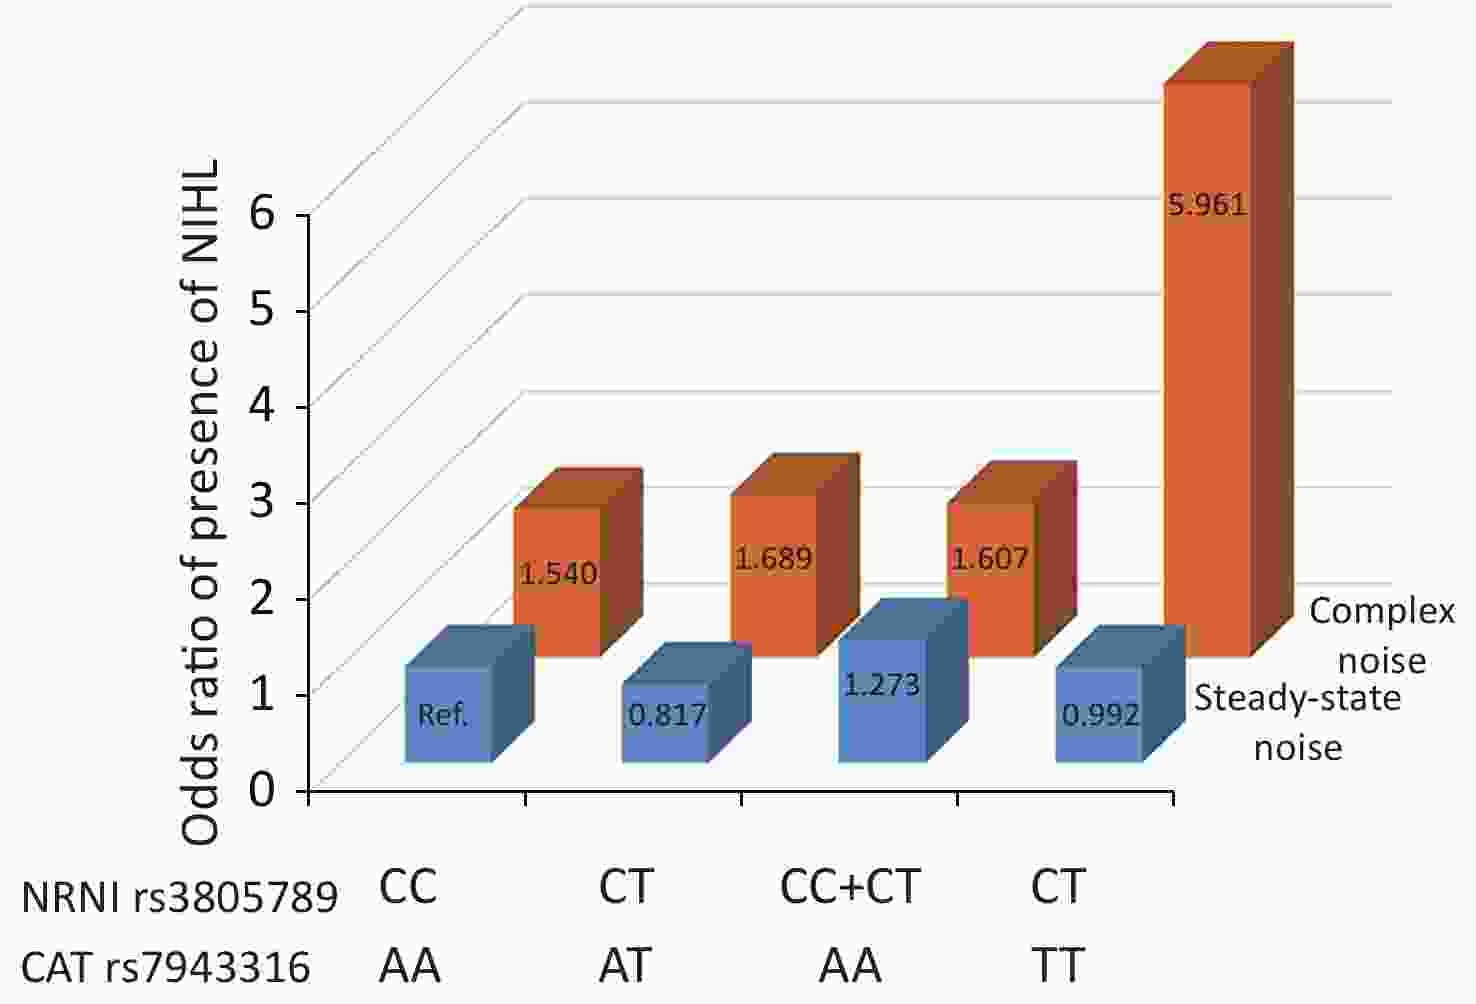
Figure 2. Joint effects of the NRN1 rs3805789 and CAT rs7943316 with kurtosis on NIHL risk. The reference group was defined as subjects exposed steady-state noise who carry NRN1 rs3805789 CC and CAT rs7943316 AA. Ref: reference group. The odds ratios (ORs) were calculated by the logistic regression analysis after adjustment for age, gender, education, years of exposure, smoking, video volume, physical exercise, and working pressure.
Combination of kurtosis and genotypes of NRN1and CAT Controls/Cases, n (%) ORs (95% CI)* P* FDR Steady-state noise rs3805789 CC-rs7943316 AA 9 (2.9)/8 (2.6) 1.000 rs3805789 CC-rs7943316 AT 6 (2.0)/9 (2.9) 2.499 (0.561–11.133) 0.230 0.814 rs3805789 CC-rs7943316 TT 3 (1.0)/0 (0.0) 0.000 0.999 1.000 rs3805789 CT-rs7943316 AA 19 (6.2)/14 (14.6) 1.317 (0.375–4.626) 0.667 1.078 rs3805789 CT-rs7943316 AT 15 (4.9)/7 (2.3) 0.817 (0.206–3.234) 0.773 0.895 rs3805789 CT-rs7943316 TT 3 (1.0)/2 (0.7) 0.992 (0.122–8.078) 0.994 1.047 rs3805789 TT-rs7943316 AA 7 (2.3)/5 (1.6) 1.289 (0.269–6.185) 0.751 0.987 rs3805789 TT-rs7943316 AT 4 (1.3)/2 (0.7) 0.734 (0.098–5.485) 0.763 0.941 rs3805789 TT-rs7943316 TT 1 (0.3)/0 (0.0) 0.000 1.000 1.000 rs3805789 CT/TT-rs7943316 AA 26 (8.5)/19 (6.2) 1.273 (0.388–4.179) 0.691 1.013 rs3805789 CC-rs7943316 (AT+TT) 9 (2.9)/9 (2.9) 1.723 (0.422–7.040) 0.449 1.041 rs3805789 (CT+TT)-rs7943316 (AT+TT) 23 (7.5)/11 (3.6) 0.772 (0.220–2.710) 0.686 1.013 Complex noise rs3805789 CC-rs7943316 AA 46 (15.0)/31 (10.1) 1.540 (0.348–6.809) 0.569 1.043 rs3805789 CC-rs7943316 AT 23 (7.5)/32 (10.4) 3.347 (0.740–15.139) 0.117 0.644 rs3805789 CC-rs7943316 TT 6 (2.0)/4 (1.3) 1.336 (0.193–9.262) 0.770 0.895 rs3805789 CT-rs7943316 AA 42 (13.7)/73 (23.8) 3.875 (0.895–16.774) 0.070 0.051 rs3805789 CT-rs7943316 AT 52 (16.9)/41 (13.4) 1.689 (0.391–7.288) 0.483 0.966 rs3805789 CT-rs7943316 TT 11 (3.6)/26 (8.5) 5.961(1.219–29.155) 0.028 0.374 rs3805789 TT-rs7943316 AA 26 (8.5)/29 (9.4) 2.625 (0.581–11.864) 0.210 0.843 rs3805789 TT-rs7943316 AT 27 (8.8)/21 (6.8) 1.750 (0.380–8.057) 0.473 0.966 rs3805789 CT+TT-rs7943316 AA 68 (22.1)/102 (33.2) 1.607 (1.035–2.494) 0.034 0.051 rs3805789 CC-rs7943316 (AT+TT) 23 (9.4)/36 (11.7) 1.378 (0.761–2.495) 0.290 0.800 rs3805789 (CT+TT)-rs7943316 (AT+TT) 97 (31.6)/91 (29.6) 0.945 (0.411–1.270) 0.259 0.800 Note. *ORs (95% CI) and P value were obtained with multivariate logistic regression analysis after adjustment for age, gender, education, years of exposure, smoking, video volume, physical exercise, and working pressure. FDR (false discovery rate) was obtained from the Benjamin-Hochberg procedure. Table S4. Jointed effects on NIHL between high-risk genotypes of NRN1and CAT and kurtosis
-
The GMDR model was used to screen for the best gene-lifestyle-factor combinations. After adjusting age, gender, education level, years of noise exposure, kurtosis, CNE, and adj-CNE, the best six-locus model involving NRN1 rs3805789, CAT rs7943316, smoking, video volume, physical exercise, and working pressure for the risk of NIHL was found to be the interaction, which scored 10/10 for CVC and 9 for the sign test (P = 0.0010; Table 5B). A four‐locus model involving NRN1 rs3805789, CAT rs7943316, smoking, and physical exercise was found to be the interaction, which scored 9/10 for CVC and 9 for sign test (P = 0.0107; Table 5B). A three‐locus model involving NRN1 rs3805789, CAT rs7943316, and working pressure was found to be the interaction, which scored 5/10 for CVC and 9 for the sign test (P = 0.0107; Table 5B). Moreover, a five‐locus model was also identified for the risk of NIHL. The corresponding CVC and TEBA were 7/10 and 0.5570, respectively (P = 0.0107; Table 5B).
-
We next evaluated the interaction combinations between noise metrics and lifestyle factors via the GMDR model. The results revealed that, after adjusting age, gender, and education level, a five-locus model involving smoking habit, video volume, physical exercise, working pressure, and kurtosis was found to be the interaction, which scored 10/10 for CVC and 9 for the sign test (P = 0.0107; Table 5C). A four-locus model involving smoking, video volume, physical exercise, and working pressure was found to be the interaction (P = 0.0107; Table 5C), in which the CVC was 10/10, and the TEBA was 0.5509. A seven‐locus model involving smoking, video volume, physical exercise, working pressure, kurtosis, CNE, and adj-CNE was found to be the interaction, which scored 10/10 for CVC and 9 for the sign test (P = 0.0107; Table 5C). Furthermore, a six‐locus model was also identified for the risk of NIHL. The corresponding CVC and TEBA were 7/10 and 0.5437, respectively (P = 0.0107; Table 5C).
-
In the current study, the association between gene polymorphisms, noise metrics, lifestyle factors, and NIHL was preliminarily explored using univariate analysis. The GMDR method was used to detect the association of the interaction among multiple factors with the risk of NIHL. The GMDR method explores interactions by collapsing the high-dimensional interactions of multiple factors into a single dimension. This method not only avoids biases associated with disease risk by adjusting confounding covariates, but also explores complex multi-locus interactions between genetic and environmental factors. Over the past ten years, the GMDR method has been widely applied to analyze the associations of gene–gene and gene–environment interactions with many complex diseases[26-28].
-
Increasing evidence has shown that multiple genes are closely associated with susceptibility to NIHL. Given that multiple genetic loci with moderate effects fail to reach genome-wide significance due to the limited power in most genetic studies[29], the present study focused on the associations of multi-locus interactions with NIHL risk by analyzing 18 variants in 7 susceptibility genes via the GMDR method. These genes were CAT, HSP70, CDH23, CASP3, CASP7, NOX3, and NRN1. These risk genes play significant roles in apoptosis, cell adhesion, and oxidative stress during the development of NIHL. We identified for the first time that the interaction between NRN1 rs3805789 and CAT rs7943316 increased susceptibility to NIHL. We further validated this genetic interaction via stratified analysis. The results illustrated that subjects carrying NRN1 rs3805789-CC and CAT rs7943316-AT, NRN1 rs3805789-CT and CAT rs7943316-AA, NRN1 rs3805789-CT and CAT rs7943316-TT, NRN1 rs3805789-CT/TT and CAT rs7943316-AA, or NRN1 rs3805789-CC and CAT rs7943316-AT/TT had higher risks of NIHL than those with NRN1 rs3805789-CC and CAT rs7943316-AA. Yang et al.[13] found that CAT rs208679 and rs769217 were significantly associated with the risk of NIHL. A study by Wang et al.[12] have studied the association of CAT rs7943316 with NIHL susceptibility. Their results indicated that carriers of T allele (AT+TT) of rs7943316 have significantly higher risks of NIHL than those with AA genotype (P < 0.05), and observed that a significant interaction model involving GJB2 rs4880, SOD2 rs137852540, and CAT rs769214 might associated with NIHL. These results are similar to our results presented here. CAT is an oxidative-stress gene. Its mutation weakens the anti-oxidant system in the cochlea, thereby hampering the elimination of the reactive oxygen species generated by noise exposure. Consequently, the structure and function of the cochlea are impaired, ultimately causing hearing loss. Furthermore, noise exposure can damage cochlear hair cells and ribbon synapses between hair cells and nerve fibres[30-32]. NRN1 is a small polypeptide closely related to the plasticity of neurites in the human central nervous system. As a neurotrophic factor, NRN1 has multiple effects in the nervous system. It can significantly promote the growth and branch formation of neurites[33] and establishment of functional synapses[34]. Additionally, it is necessary for the survival of neurons[35]. A previous study by our group has shown that a recombinant NRN1 induced extensive neuritogenesis from PC12 cells[36]. Picard et al. have observed that knocking out NRN1 impairs the development and plasticity of excitatory visual cortical networks in mice[37]. Taken together, these studies reveal that NRN1 may play an important role in NIHL by promoting neurodevelopment and neural plasticity.
-
Complex noise is ubiquitous in industrial environments. Complex noise with impact and impulse damages the auditory system more than steady-state noise at the equivalent level[10, 11, 38]. Previous studies on noise have considered only the effect of noise energy on the auditory system, ignored the effect of noise temporal structure, and underestimated the degree of hearing loss associated with complex noise[39]. In this study, we focused on noise kurtosis. This factor was used to describe the characteristics of impulsive noise, distinguish between steady-state and complex noises, and assess the effect of complex noise on hearing loss. We found that the NIHL group had a higher median noise kurtosis and a larger proportion of workers exposed to complex noise than the control group, consistent with our previous report[17]. In a previous study, mean kurtosis was used to describe the temporal structure of noise, and a mean kurtosis of 10 was used as the boundary value between Gaussian and complex noises. In our study presented here, the median kurtosis of 4 was considered as the boundary. Noise damages the auditory system via direct mechanical force and by disrupting the metabolism[10]. Considering that complex noise is more harmful to the auditory system than steady-state noise, researchers have begun to adjust the energy parameters or exposure time by using kurtosis. For example, Zhao et al.[10] and Goley et al.[40] have proposed correction methods for exposure time and noise energy, respectively. In this study, the correction method for the exposure time was used to adjust the CNE. We observed an association between CNE, adj-CNE, and NIHL through univariate analysis. The multidimensional interactions between genes and noise metrics were analyzed using the GMDR method. The best model for the risk of NIHL was found to be the interaction among NRN1 rs3805789, CAT rs7943316, and kurtosis. To date, studies have never reported the associations of such interactions with the risk of NIHL. The further stratified analysis revealed that the subjects exposed to complex noise who carried NRN1 rs3805789-CT and CAT rs7943316-TT or NRN1 rs3805789-CT/TT and CAT rs7943316-AA were at a higher risk of NIHL than those exposed to steady noise who carried both NRN1 rs3805789-CC and CAT rs7943316-AA. This observation illustrates that complex-noise exposure increases the effect of the interaction between NRN1 rs3805789 and CAT rs7943316 on NIHL risk. In addition, interaction among NRN1 rs3805789, CAT rs7943316, kurtosis, CNE, and adj-CNE was also identified as a risk factor for NIHL. This result indicates that kurtosis, CNE, and adj-CNE may affect the development of NIHL not only through direct effects but also through interactions with genes.
-
The risk of NIHL was also affected by lifestyle factors. In this study, we found a significant difference in smoking, video volume, and physical exercise between the two groups. We further investigated gene-lifestyle-factor interactions while investigating the effects of noise-metric-lifestyle-factor interactions on NIHL. We observed a cross-reaction involving NRN1 rs3805789, CAT rs7943316, smoking, video volume, physical exercise, and working pressure for the risk of NIHL. Furthermore, we also found a potential five‐locus noise-metric–lifestyle-factor interaction model involving smoking, video volume, physical exercise, working pressure, and kurtosis, as well as a seven‐locus model including smoking, video volume, physical exercise, working pressure, kurtosis, CNE, and adj-CNE. These results are similar to the previous results of our group[17]. Previous results showed that there were positive interactions between noise kurtosis with smoking, video volume and physical exercise. However, previous studies analyzed only the interactions between two-category variables via crossover analysis and failed to analyze the effects of CNE and adj-CNE on the risk of NIHL. Many studies have shown that smoking-induced hearing loss is likely due to vascular changes, including capillary contraction, increased blood viscosity, and cochlear anoxia[41, 42]. High-level noise exposure may lead to hearing loss via a mechanism involving reduced cochlear oxygen tension during and after noise exposure[43]. Moreover, lack of exercise affects blood, oxygen, and nutrient flow to the cochlea, leading to the degradation of the stria vascularis (SV). Blood vessels in the SV are essential for transporting necessary factors, such as oxygen and glucose, to the cochlea[44].
-
This study is superior to previous studies in multiple aspects. First, we firstly focused on the effects of multidimensional interactions on NIHL risk by analyzing 18 variants, three noise metrics, and four lifestyle factors. Second, we identified for the first time that interaction between NRN1 rs3805789 and CAT rs7943316 increases NIHL susceptibility. Third, the associations of the interactions among NRN1 rs3805789, CAT rs7943316, and kurtosis with the risk of NIHL was detected for the first time. However, this study had some limitations as well. First, we could not obtain data regarding other important confounding factors, such as hypertension and diabetes, due to technical reasons. Second, the analyses of lifestyle factors depended on the recollection of the subjects, which can be unreliable. Third, because the sample size is not large enough, the results obtained from this study should be verified by studies involving larger sample sizes. Finally, this study is an association study, the mechanisms of the gene-gene or gene–environmental-factor interactions should be investigated in future laboratory and clinical studies.
-
In conclusion, complex noise, high CNE, high adj-CNE, smoking, high video volume, and sedentary lifestyle are environmental risk factors for NIHL. Concurrence of NRN1 rs3805789 and CAT rs7943316 constitutes a genetic risk factor for NIHL. Complex noise exposure significantly increases the risk of NIHL in subjects with a high genetic risk score. Interactions between genes and lifestyle as well as noise metrics and lifestyle affect the risk of NIHL. These results provide a theoretical basis for screening genetic and environmental risk factors to prevent NIHL.
-
SYL and WQS are joint first authors. SYL oversaw data analysis and wrote the manuscript. WQS edited the article and JRX conducted the statistical analysis. ZL, SL, and YQC conducted the study design and revised the manuscript. TYZ, HYW, and LWX carried out the experiment. MBZ, YH, and LY was responsible for data collection and final manuscript. All authors approved the final manuscript.
-
The authors thank all the participants and institutions for their contribution to this study.
-
All the participants signed the informed consent form, and the study was approved by the Science Ethics Committee of Hangzhou Normal University (2017LL107).
-
The authors declare that they have no conflict of interest.
HTML
Subjects
Sample Size


Questionnaire Survey
Noise Waveform Recording and Analysis


Hearing Testing and Hearing Loss Diagnosis

Genomic DNA Extraction, Single Nucleotide Polymorphism (SNP) Selection, and Genotyping
Statistical Analysis
General Characteristics of the Subjects
Associations of the Gene-Gene Interactions with the Risk of NIHL
Associations of the Gene-Noise-Metric Interactions with the Risk of NIHL
Associations of Gene-Lifestyle-Factor Interactions with the Risk of NIHL
Associations of Noise-Metric-Lifestyle-Factor Interactions with the Risk of NIHL
Associations of the Gene-Gene Interactions with the Risk of NIHL
Associations of the Gene-Noise-Metric Interactions with the Risk of NIHL
Associations of Gene-Lifestyle-Factor and Noise-Metric-Lifestyle-Factor Interactions with the Risk of NIHL
Strengths and Limitations of this Study
 20458.pdf
|

|

 Quick Links
 DownLoad: