


-
The severe acute respiratory syndrome coronavirus 2 (SARS-CoV-2) caused coronavirus disease 2019 (COVID-19) pandemic in the early 2020. Quantitative reverse transcription-polymerase chain reaction (RT-PCR) test, a two-step method used for detection of ribonucleic acid (RNA), was a gold standard in COVID-19 diagnosis[1]. However, many patients can be asymptomatic due to the clinical spectrum of SARS-CoV-2 infection[2]. The SARS-CoV-2-specific antibodies appear around 3–10 days after infection, with IgM appeared first and IgG followed[3]. Previous serological studies about SARS-CoV-2 mainly focusing on health-care workers or blood donors, which based on small or non-random sampling[4, 5]. To increase the accuracy of estimation about seroprevalence of IgG and IgM against SARS-CoV-2 among asymptomatic people in Wuhan, our study not only considered the test performance, but also adjusted for age and gender of the general population.
A cross-sectional study was conducted in a general hospital near the Huanan Seafood Wholesale Market to conduct a serological survey using a validated assay targeting on spike and nucleocapsid protein for IgM and IgG antibodies against SARS-CoV-2[6]. After the outbreak of COVID-19 in Wuhan, residents were asked to do the SARS-CoV-2 nucleic acid tests (NAT) of nasopharyngeal swabs, chest CT scans or a SARS-CoV-2-specific serological test before resume work. We selected a serology test that has been fully validated using serum from confirmed COVID-19-infected individuals and well-characterized reference samples[6]. In this hospital, 18,712 medical examination records including IgM and IgG tests for SARS-CoV-2 antibodies and other tests were analysed among people with no fever, headache or other symptoms of COVID-19 from March 25 to April 28, 2020.
Clinical data we collected including birth date, gender, occupation, residential district, date of test, serum IgG and IgM positive or negative results for SARS-CoV-2 antibodies, nucleic acid testing, clinical symptoms, chest CT and laboratory tests. Only 1,636 of the subjects had chest CT and 12,481 subjects had the laboratory tests. SARS-CoV-2 antibody detection kits (colloidal gold method) were provided by INNOVITA (Tangshan, registration certificate for the medical devices of Peoples Republic of China: 20203400177). All enrolled medical examiners collected 2 mL peripheral venous blood. After centrifugation, serum was taken for SARS-CoV-2-specific IgG and IgM antibody detection within 2 h. Nasopharyngeal or oropharyngeal swabs used for SARS-CoV-2 nucleic acid testing were collected by trained and qualified medical staff to perform NAT within 2 h and read the results within 15 min. The automatic nucleic acid extraction instrument was provided by the Hangzhou Allsheng Instruments Co. Ltd. (Allsheng). The ABI-7500 fluorescence PCR instrument was from Thermo Fisher Scientific Inc. All operations were carried out according to kit instructions.
All analyses were conducted using SPSS software (version 22.0, IBM Corporation, Armonk, NY, USA), the R software package (version 3.6.2; 2019, The R Foundation for Statistical Computing), and GraphPad Prism (Version 8.0, GraphPad Software, LLC, La Jolla, CA, USA). Proportions for categorical variables were compared either by Pearson Chi-square test or by Fisher’s Exact Test. Statistical analysis of continuous variables utilized means with standard deviation(s) for normally distributed data and medians with interquartile range (IQR) for non-normally distributed data. Means for continuous variables were compared via independent group t-tests when the data were normally distributed; otherwise, the Mann-Whitney test was used. P < 0.05 was considered statistically significant. To correct for the effects of gender and age, the seroprevalence of IgM positivity, IgG positivity, and IgM and/or IgG positivity were standardized according to the gender and age-specific population of Wuhan in 2017 (Supplementary Table S1, available in www.besjournal.com). To correct for effects from accuracy of the serum antibody test, seroprevalence was corrected according to the sensitivity and specificity of the colloidal gold test in previous studies following the Rogan and Gladen method[7].
Aged group (years old) Male Female Total 4− 583,194 493,770 1,076,964 20− 256,003 209,481 465,484 25− 404,864 371,347 776,211 30− 421,463 395,119 816,582 35− 337,088 325,508 662,596 40− 290,599 288,596 579,195 45− 367,525 366,927 734,452 50− 350,878 343,543 694,421 55− 284,393 283,954 568,347 60− 303,427 316,329 619,756 65−81 482,899 513,251 996,150 Total 4,082,333 3,907,825 7,990,158 Note. Data from Wuhan Statistical Yearbook-2018, population grouped by age (2017). China Academic Journal Electronic Publishing House. Table S1. Numbers of male and female people aged from 4 to 81 in Wuhan in 2017
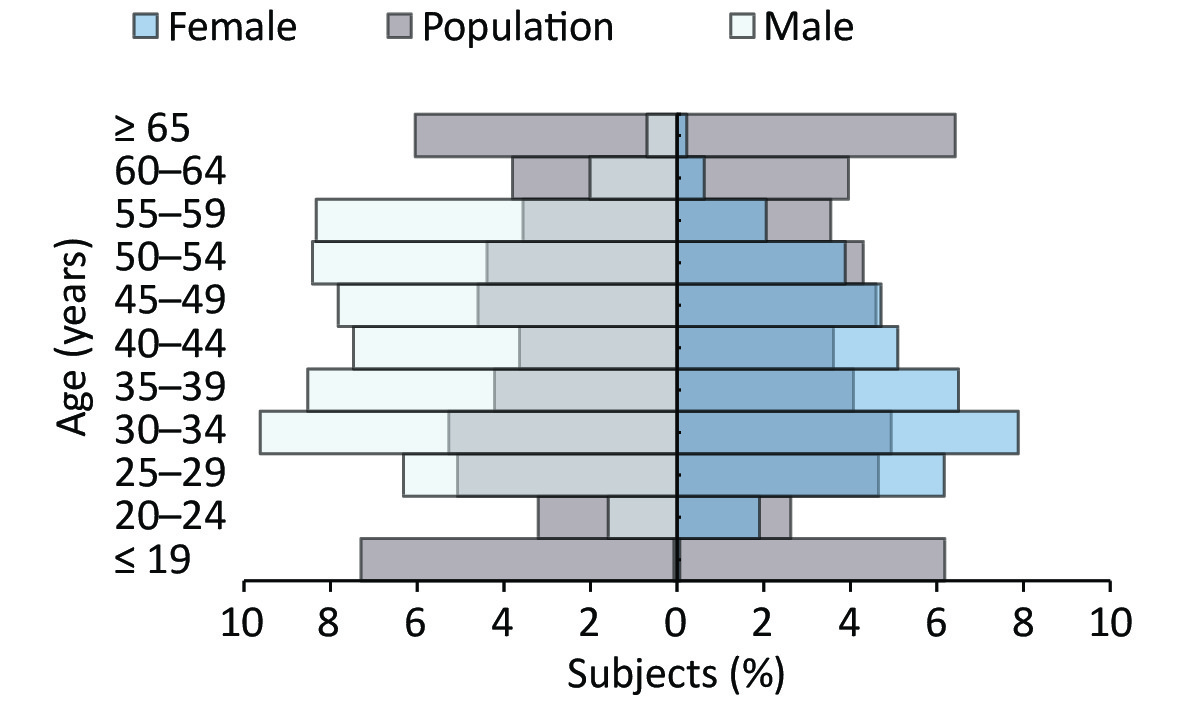
The demographic distribution of participants who enrolled in our study was a little different from that of Wuhan (Supplementary Figure S1, available in www.besjournal.com). Participants aged under 19 and over 65 in this study was much smaller than the general population. Among those enrolled, 11,391 (60.9%) were male and 7,321 (39.1%) were female. The median age of the subjects was 40 years (IQR, 42–50; range, 4–81), with the majority (n = 17,367, 92.8%) aged 25 to 59 years. The cumulative count of the population tested for antibodies against SARS-CoV-2 and the number of positive cases of IgG and IgM are shown in Supplementary Figure S2, available in www.besjournal.com.
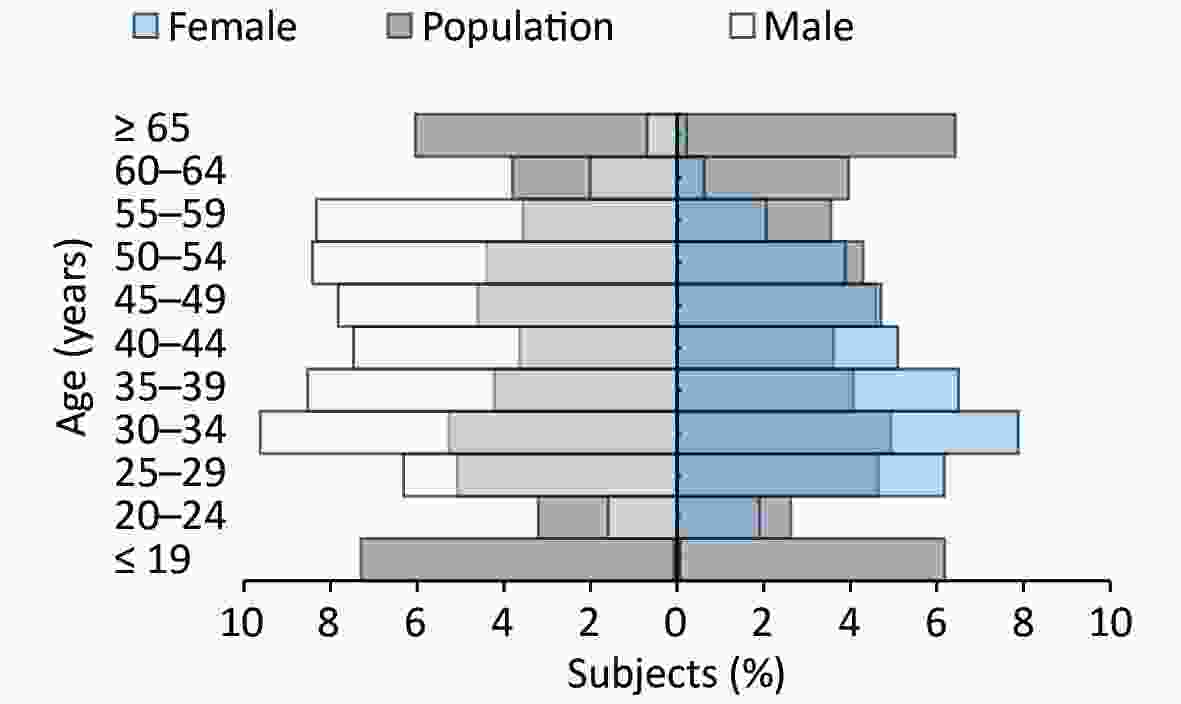
Figure S1. Sex and age distribution of participants with screening test for COVID-19 compared with the Wuhan population, screening study, March 25 to April 28, 2020, Wuhan.
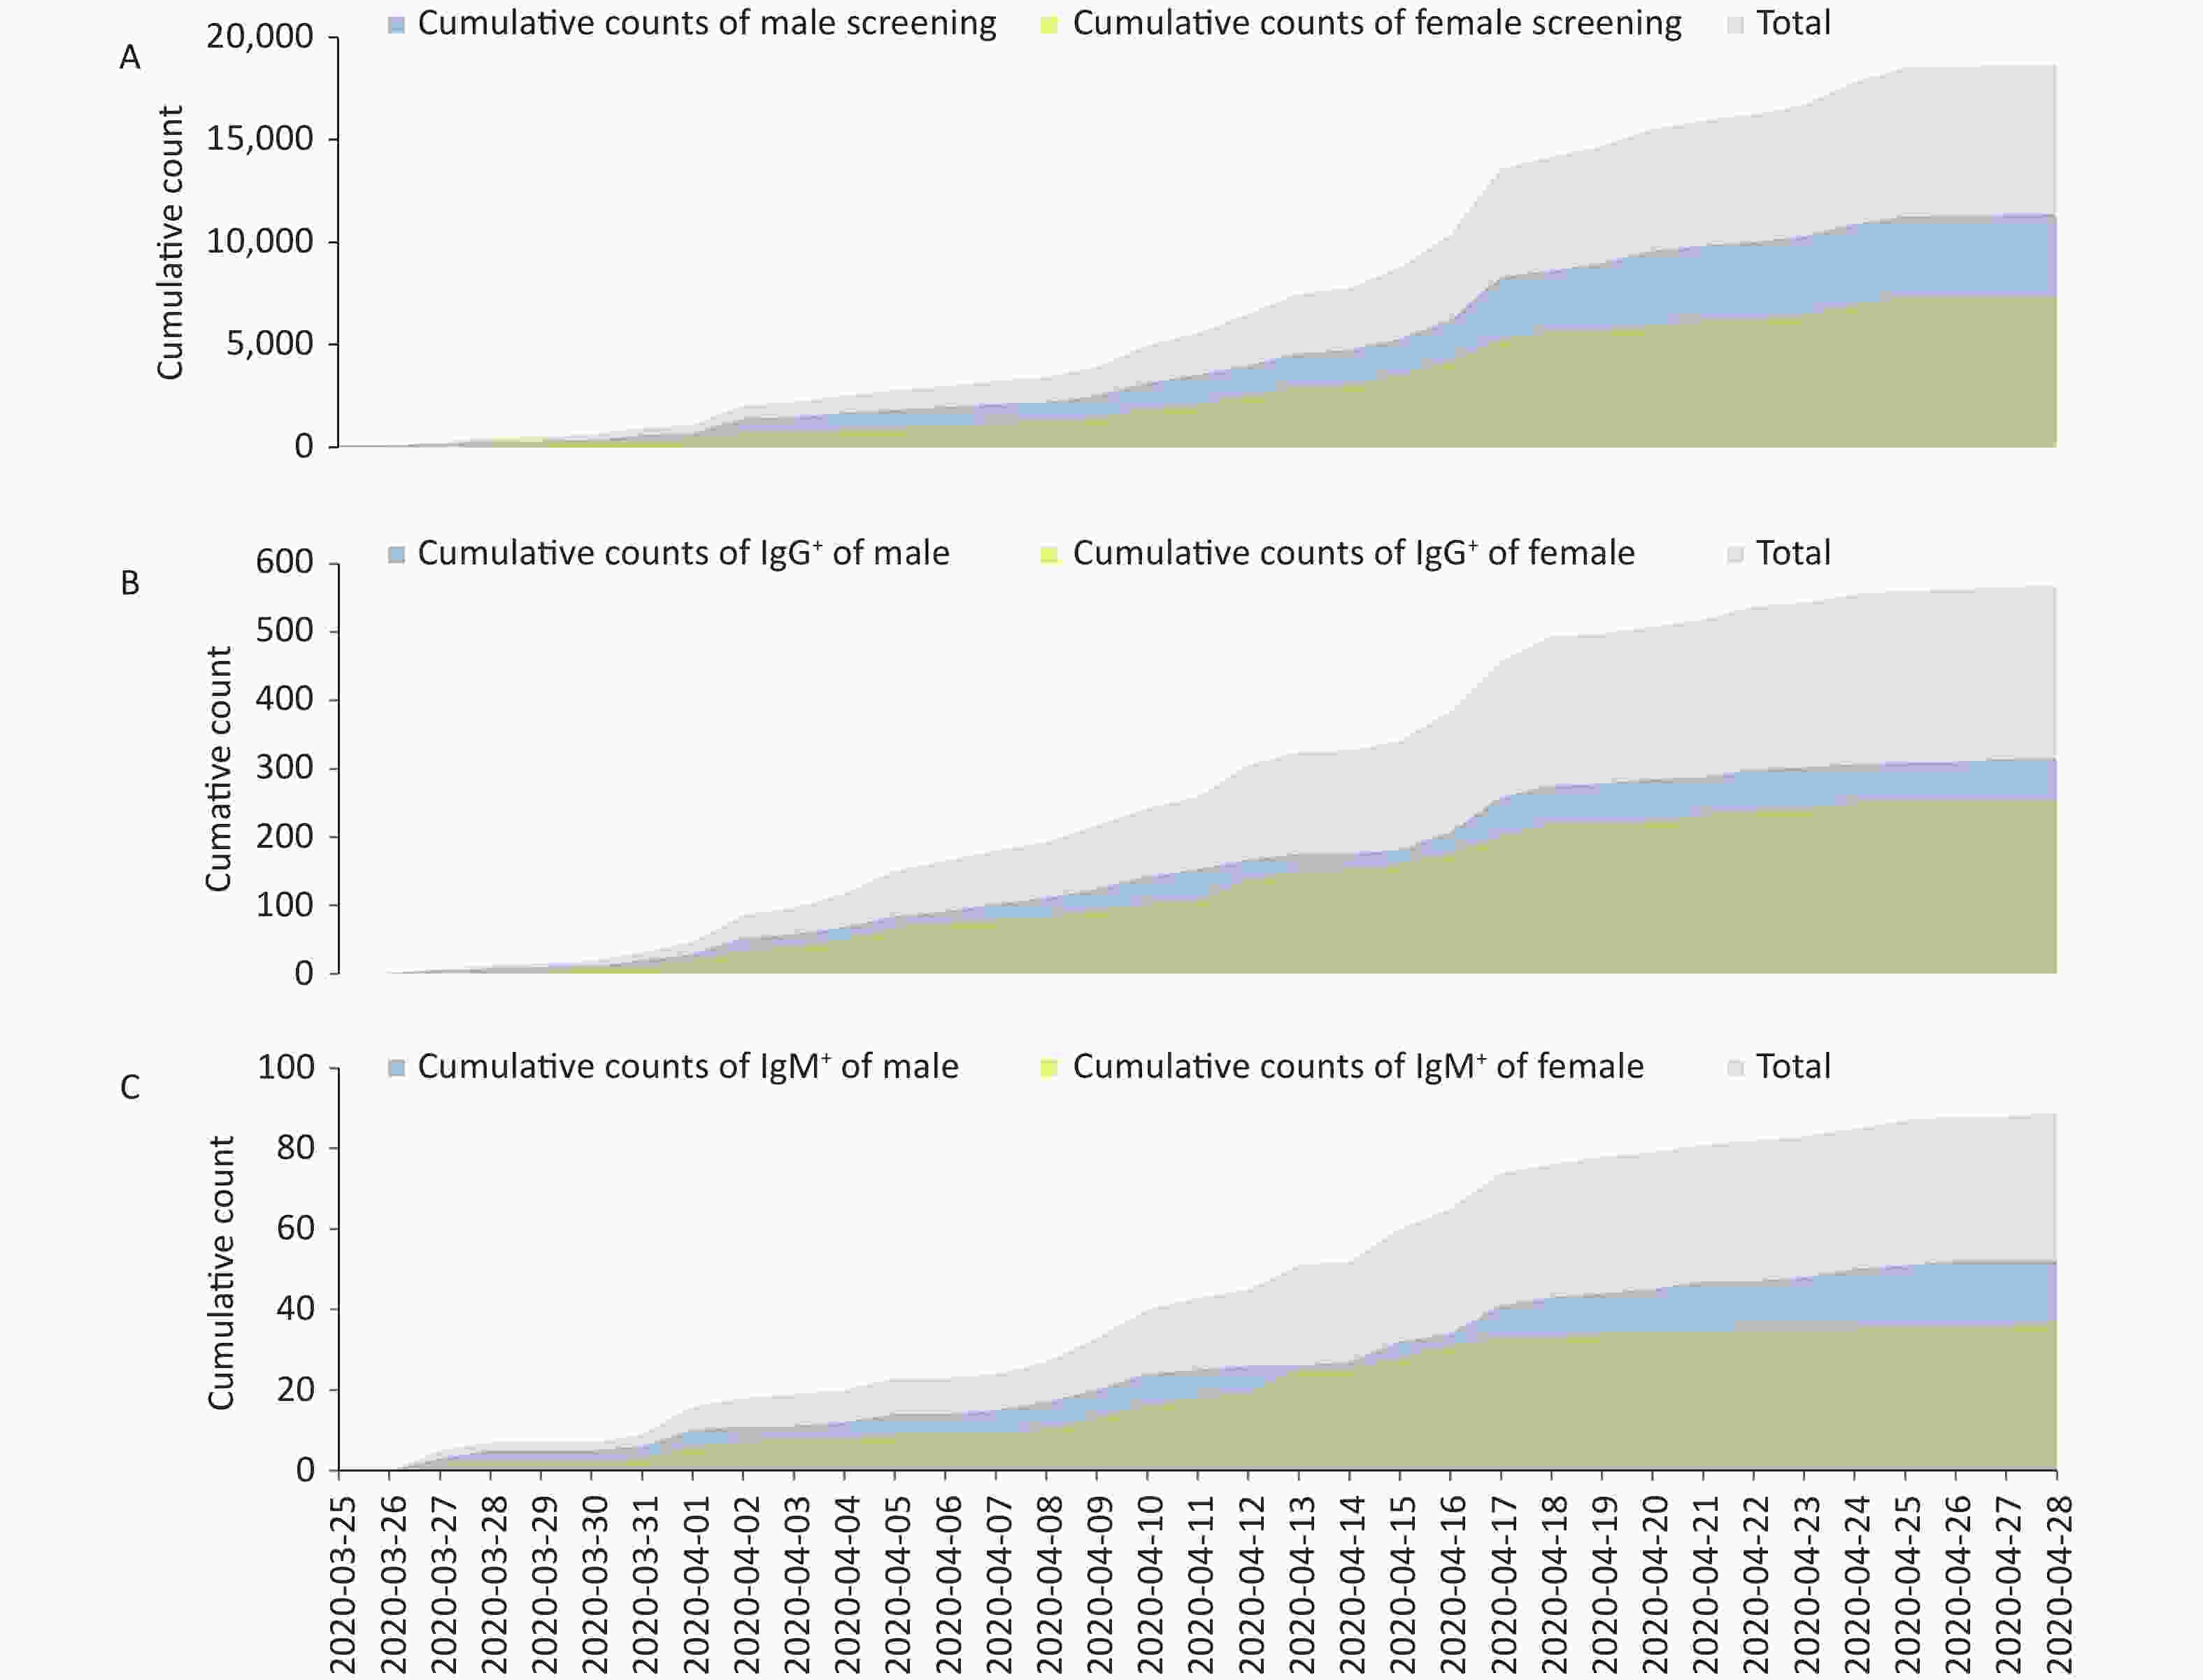
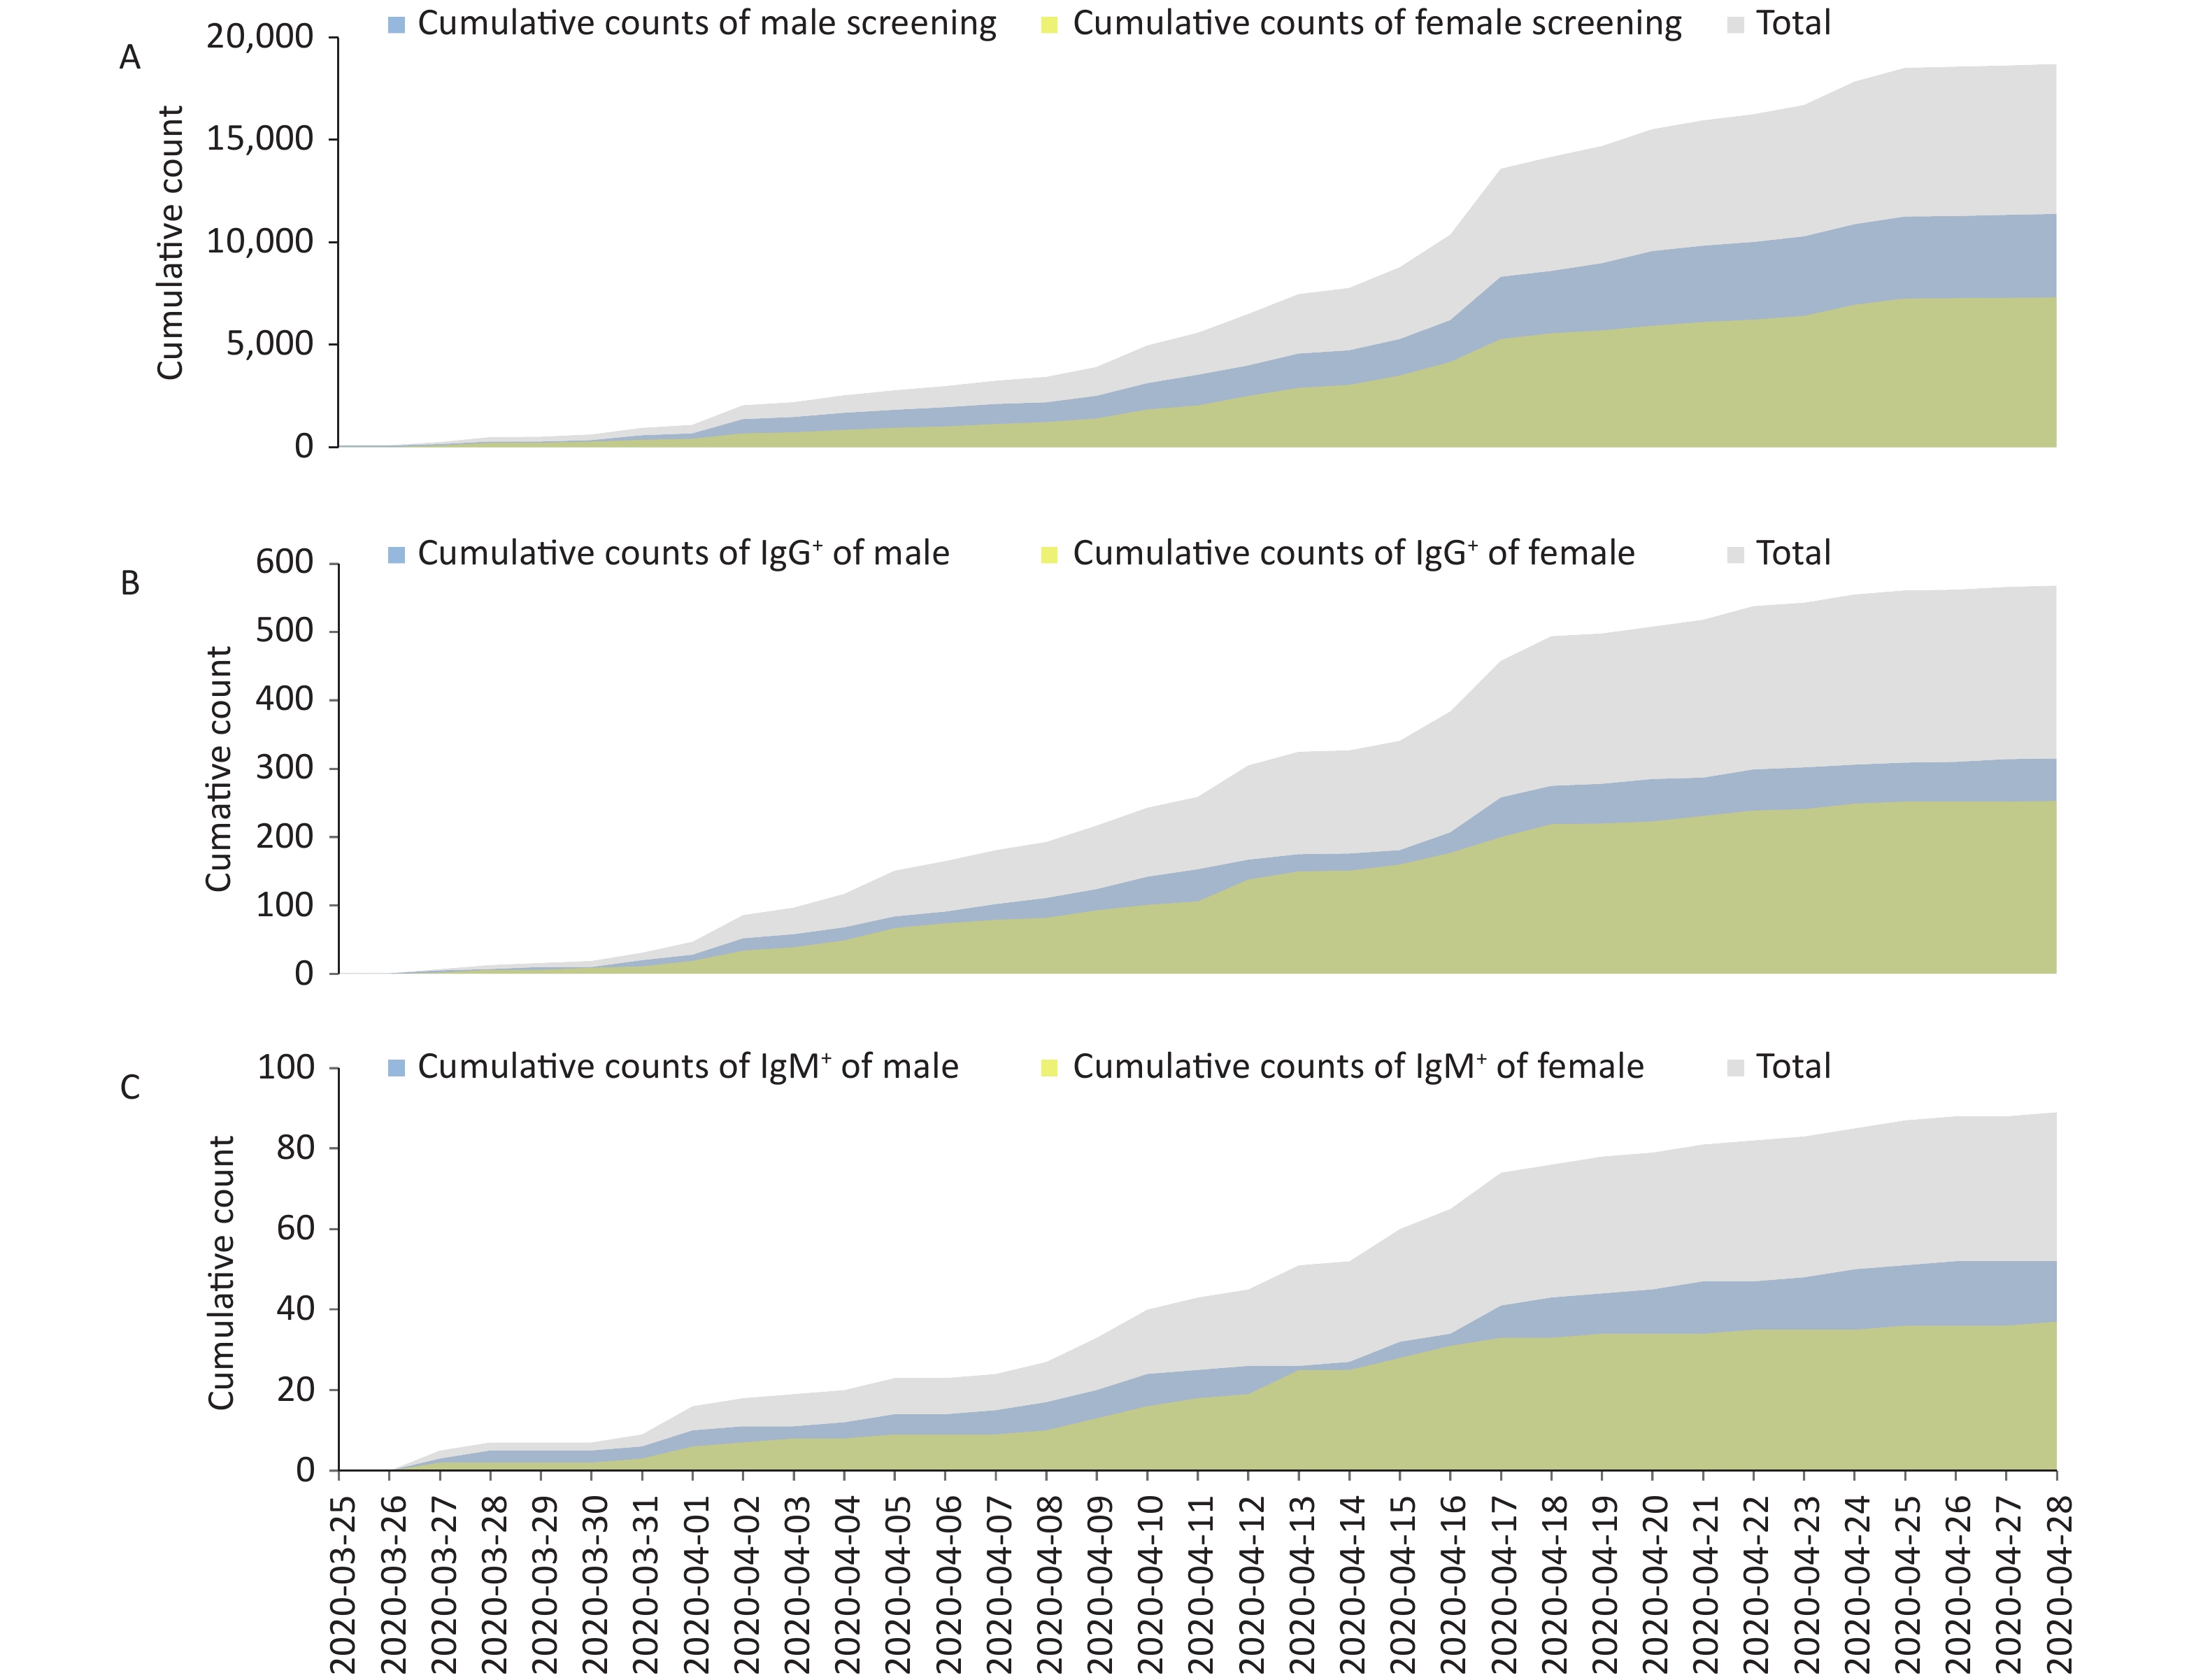
Figure S2. Cumulative count of asymptomatic individuals positive for antibodies against SARS-CoV-2 in a hospital in Wuhan, China, 2020. (A) A total of 18,712 asymptomatic individuals tested positive for IgG or IgM antibodies against SARS-CoV-2 from March 25 to April 28, 2020. (B) A total of 627 asymptomatic individuals tested positive for serum IgG antibodies, including 351 males and 276 females, from March 25 to April 28, 2020. (C) A total of 89 asymptomatic individuals tested positive for serum IgM antibodies, including 52 males and 37 females, from March 25 to April 28, 2020.
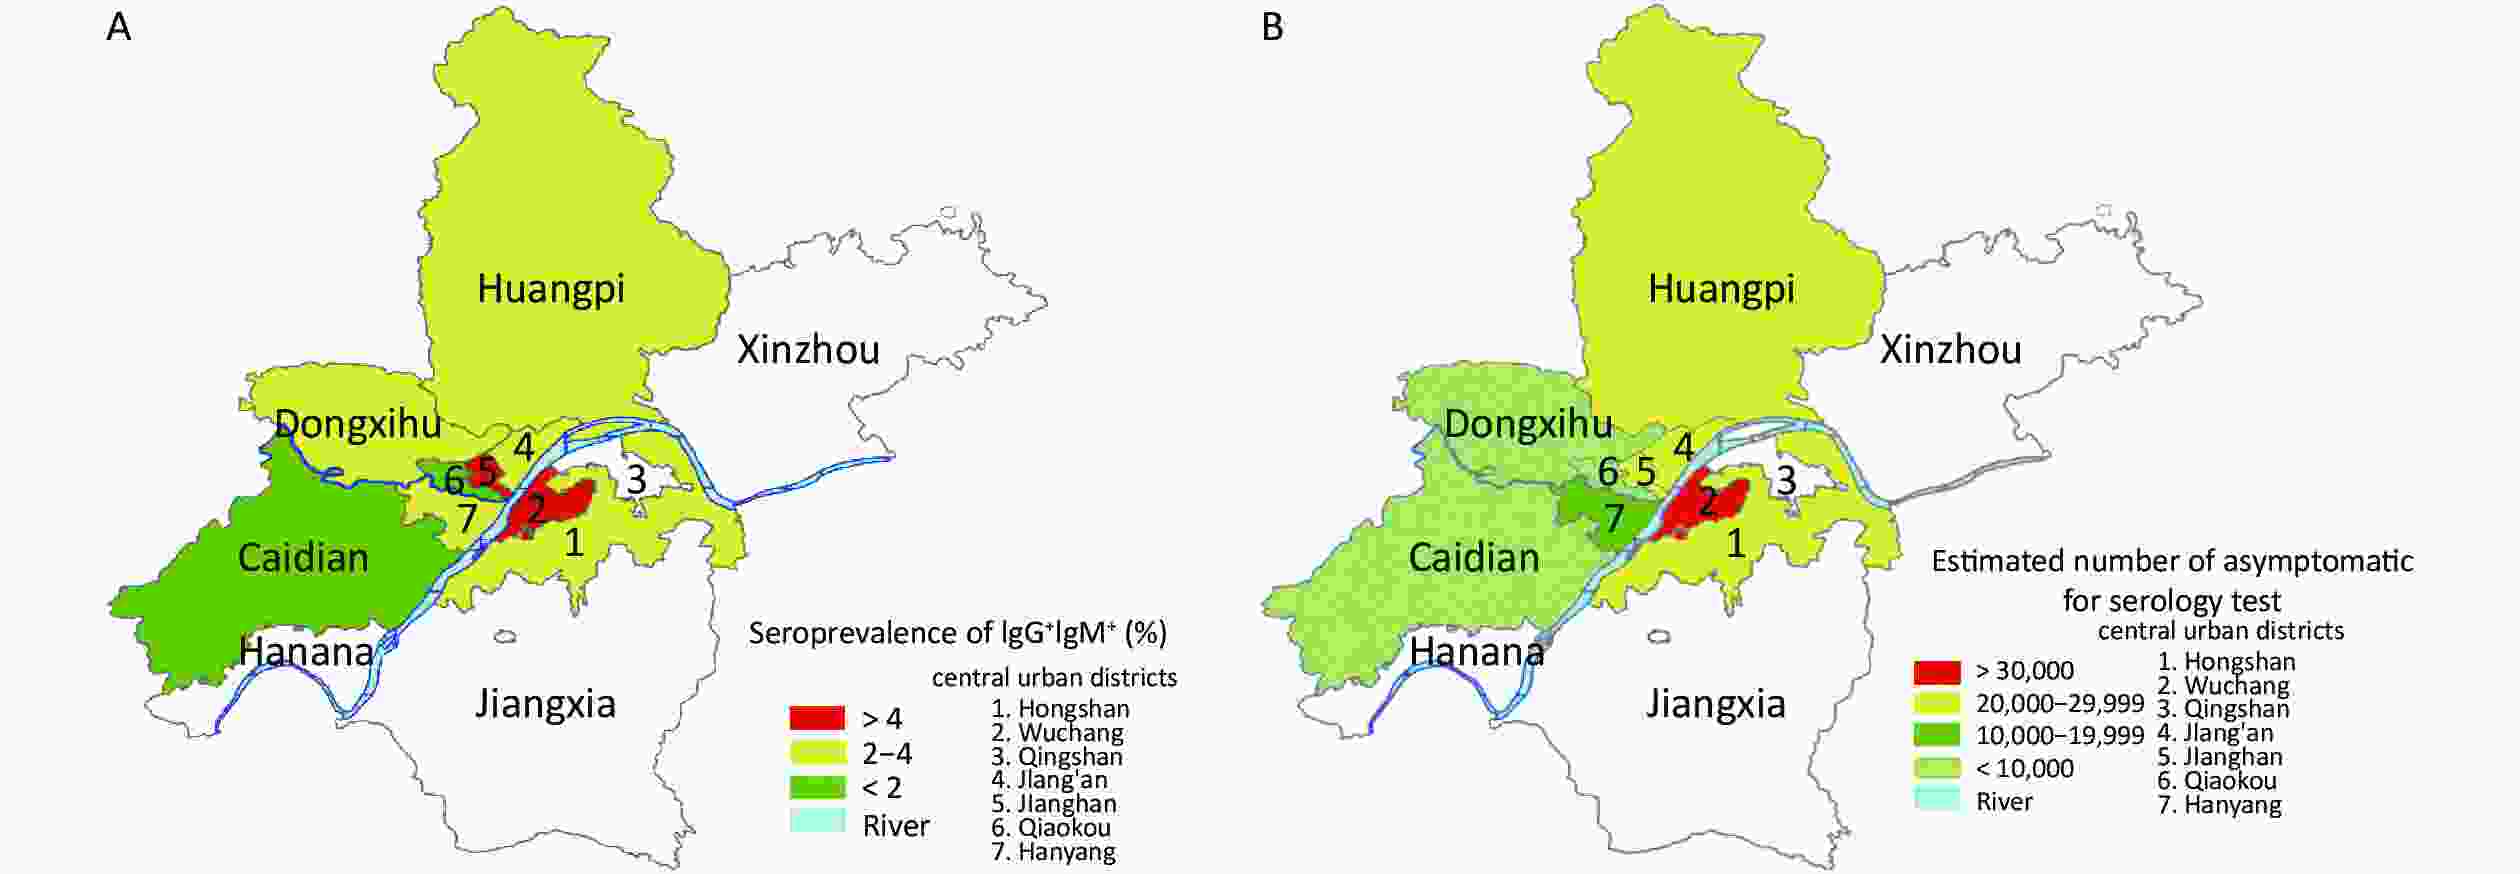
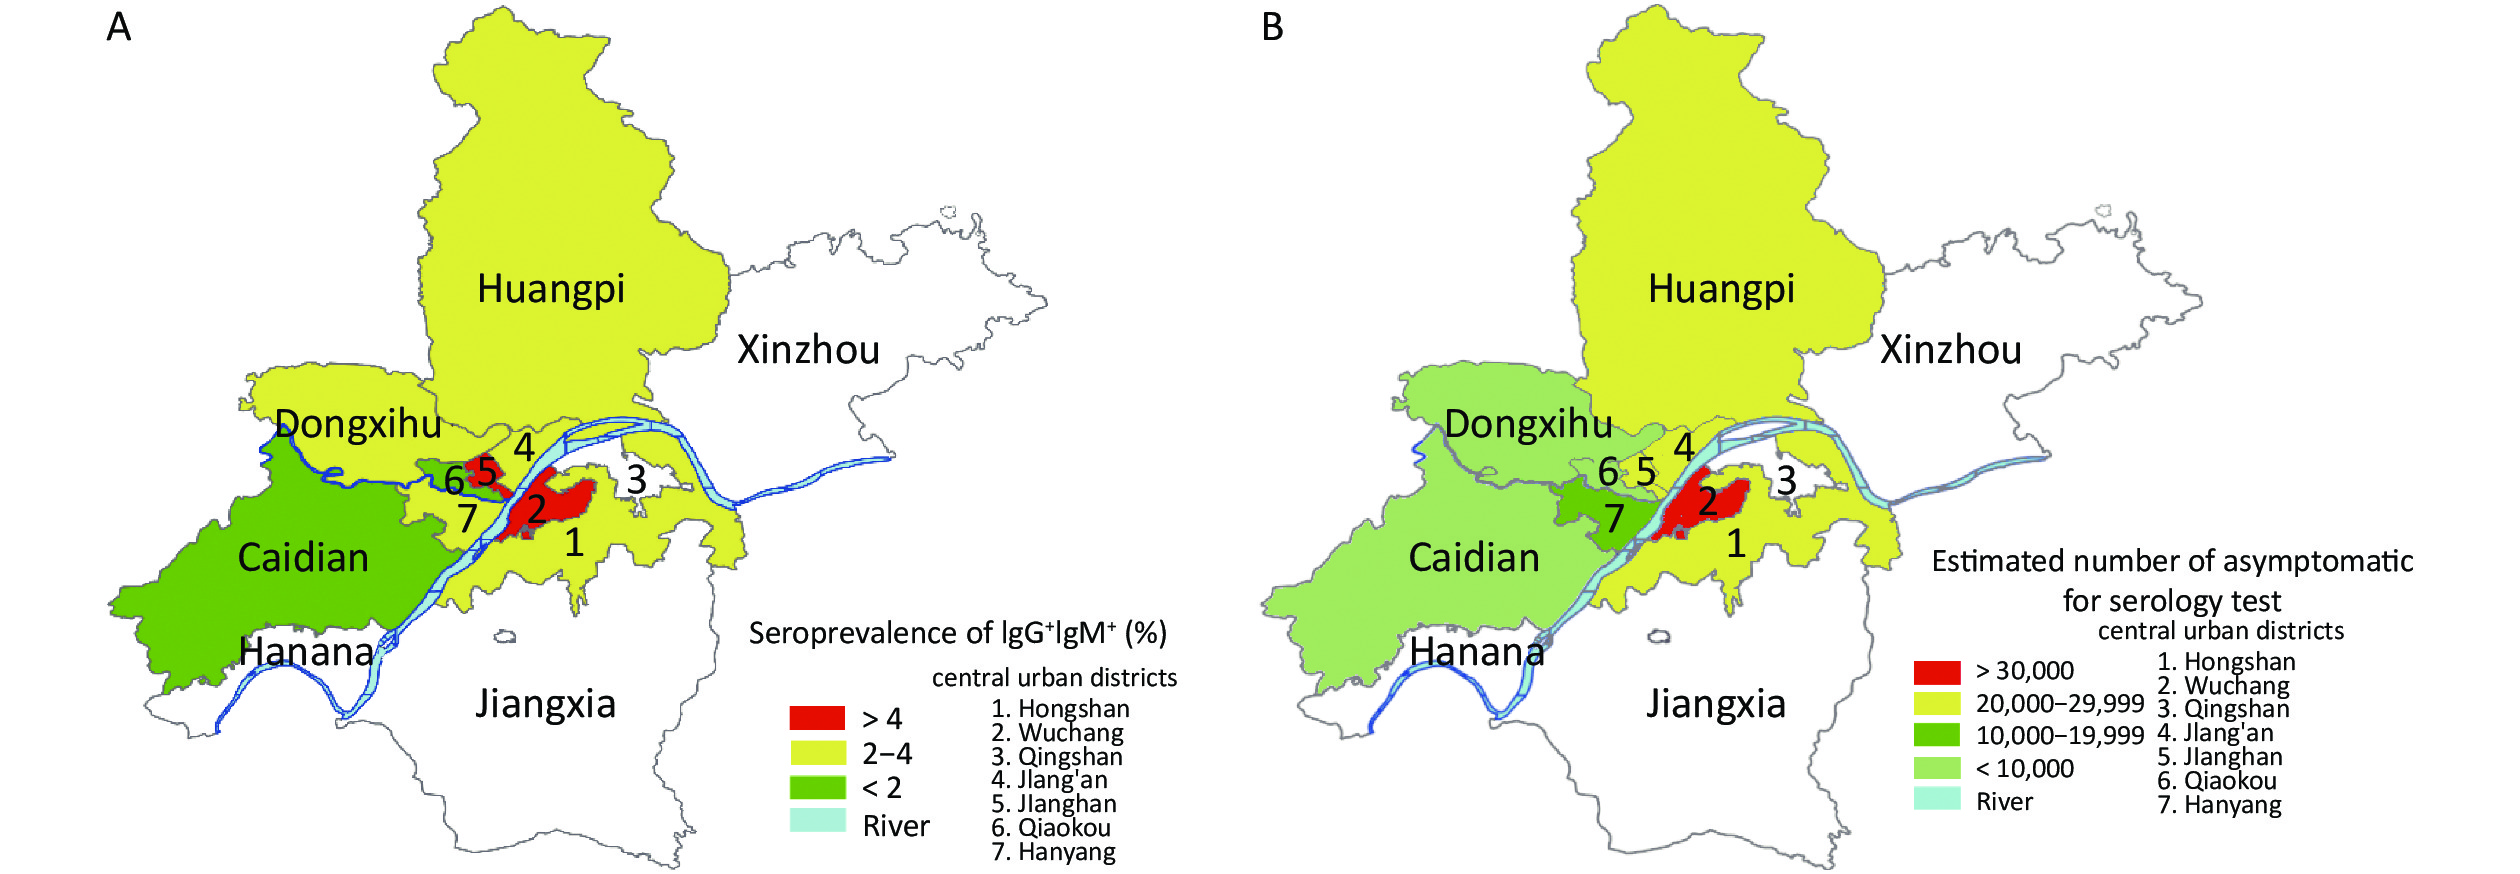
Figure S3. Geographic distribution of asymptomatic people in Wuhan. (A) The geographic distribution of seroprevalences of IgG or IgM antibodies against SARS-CoV-2 in asymptomatic people from March 25 to April 28, 2020, in Wuhan, China. (B) The geographic distribution of asymptomatic people estimated according to the seroprevalences and residential populations in the districts of Wuhan in 2017. The whites areas show no estimatiion for the number of serology test was too small to be representative.
Supplementary Table S2 (available in www.besjournal.com) shows the unadjusted, age- and gender- adjusted (standardized according to the number of people of different ages and gender in the population of Wuhan from the national census of 2017), and assay adjusted (adjusted for age, gender, and test sensitivity and specificity performance) seroprevalence for IgG and IgM against SARS-CoV-2 in asymptomatic people by gender. The seroprevalence of IgG in females was significantly higher than in males (unadjusted:
$ {\chi }^{2} $ = 6.53, P = 0.011; age- and gender- adjusted:$ {\chi}^{2} $ = 20.43, P < 0.001). However, both the unadjusted and age- and gender- adjusted seroprevalence of IgM were not significantly different between genders. When analysed IgG and IgM positivity together, the seroprevalence of IgG and /or IgM in females was significantly higher than in males (unadjusted:$ {\chi}^{2} $ = 7.19, P = 0.007; age- and gender- adjusted:$ {\chi}^{2} $ = 21.91, P < 0.001). Additionally, the assay adjusted seroprevalence for IgG and /or IgM was also significantly higher for females than males ($ {\chi}^{2} $ = 35.702, P < 0.001). Based on the census of Wuhan population aged 4–81 years in 2017, we estimated the number of asymptomatic COVID-19-positive individuals aged 4–81 years in Wuhan was 217,332 (95% CI: 198,709–235,955) from March 25 to April 28, 2020.N IgG+ IgM+ IgG+ or IgM+ n1 Unadjusted Ages and genders adjusted Assay adjusted* n2 Unadjusted Ages and genders adjusted n3 Unadjusted Ages and genders adjusted Assay adjusted* Male 11,391 351 3.08 (2.76−3.40) 2.58 (2.29−2.87) 1.02 (0.84−1.20) 52 0.46 (0.34−0.58) 0.30 (0.20−0.40) 367 3.22 (2.90−3.54) 2.67 (2.37−2.97) 2.05 (1.79−2.31) Female 7,321 276 3.77 (3.33−4.21) 3.74 (3.31−4.17) 2.35 (2.00−2.70) 37 0.51 (0.35−0.67) 0.44 (0.29−0.59) 290 3.96 (3.51−4.41) 3.89 (3.45−4.33) 3.41 (2.99−3.83) Average 18,712 627 3.35 (3.09−3.61) 3.15 (2.90−3.40) 1.67 (1.49−1.85) 89 0.48 (0.38−0.58) 0.37 (0.28−0.46) 657 3.51 (3.25−3.77) 3.27 (3.02−3.52) 2.72 (2.49−2.95) Note. N is the total number of individuals, n1 is the number of IgG-positive individuals, n2 is the number of IgM-positive individuals, n3 is the number of IgG-positive or IgM-positive. IgG+ is IgG antibody positivity, IgM+ is IgM antibody positivity, IgG+ or Ig+ is IgG antibody positivity or IgM antibody positivity. *Assay adjusted is the adjusted rate of IgG antibody positivity, IgM antibody positivity, IgG antibody positivity or IgM antibody positivity, corrected for sensitivity and specificity of the colloidal gold test in previous studies following the Rogan Gladen methods, to correct for effects from accuracy of the serum antibody test. According to the Rogan Gladen methods, P = (t + β - 1)/(α + β -1), in which P is adjusted seroprevalence, α is sensitivity of the antibody test (colloidal gold method), β is specificity of the antibody test by colloidal gold method, t is age- and gender-adjusted seroprevalence or positive test frequency. Table S2. Seroprevalence of IgG, IgM and IgG/IgM in asymptomatic individuals by gender (%, 95% CI)
The seroprevalence of IgG and odds ratio arranged by time series were listed in Supplementary Table S3, available in www.besjournal.com. In the first period, we estimated the seroprevalence of IgG at 3.82% (95% CI: 2.18–5.47, n = 523). The estimation increased to 8.43% (95% CI: 6.87–9.99, n = 1,222) in the third period, and then decreased. The lowest estimated seroprevalence of IgG was 1.45% (0.93–1.98, n = 1,998) in the last period. The positivity for IgM over the same time frame declined slightly and remained at a low level, with the highest rate at 1.34% (0.35–2.32) in the first period, which dropped to a low of 0.28% (0.07–0.48) in the sixth period (Supplementary Table S4, available in www.besjournal.com).
Five-day period N Male, % Median age
in years (IQR)Crude
seroprevalence
of IgGAdjusted
seroprevalence
of IgGCrude relative
risk (95% CI)P value Odds ratio (95% CI)
adjusting for age
and genderP value 1 523 55.7 38 (30−48) 3.82 (2.18−5.47) 2.98 (1.52−4.44) 2.70 (1.52−4.81) 0.001 2.62 (1.47−4.68) 0.001 2 1,694 70.3 40 (32−51) 5.14 (4.08−6.19) 4.18 (3.23−5.13) 3.68 (2.40−5.62) < 0.001 3.65 (2.38−5.60) < 0.001 3 1,222 55.3 40 (31−51) 8.43 (6.87−9.99) 7.67 (6.18−9.16) 6.25 (4.11−9.50) < 0.001 5.92 (3.87−9.05) < 0.001 4 4,046 61.0 40 (31−50) 3.58 (3.01−4.16) 3.18 (2.64−3.72) 2.52 (1.69−3.77) < 0.001 2.42 (1.61−3.64) < 0.001 5 6,695 60.9 40 (33−49) 2.79 (2.40−3.19) 2.18 (1.83−2.53) 1.95 (1.32−2.89) 0.001 1.89 (1.27−2.82) 0.002 6 2,534 64.0 41 (31−51) 2.21 (1.64−2.78) 1.56 (1.08−2.04) 1.53 (0.98−2.41) 0.064 1.49 (0.94−2.36) 0.086 7 1,998 55.2 32 (27−42) 1.45 (0.93−1.98) 2.23 (1.58−2.88) 1 (ref) − 1 (ref) − Note. N is number of individuals; IQR is interquartile range. Table S3. Demographic characteristics and seroprevalence of IgG in asymptomatic individuals and odds ratio by time series.
Five-day period N Crude
seroprevalence
of IgMAdjust
seroprevalence
of IgMOdds ratio
(95% CI)P value Odds ratio (95% CI)
adjusting for age
and sexP value 1 523 1.34 (0.35−2.32) 0.71 (0.00−1.43) 4.50 (1.51−13.5) 0.007 3.94 (1.31−11.8) 0.014 2 1,694 0.71 (0.31−1.11) 0.60 (0.23−0.97) 2.37 (0.89−6.33) 0.085 1.98 (0.73−5.33) 0.177 3 1,222 0.65 (0.20−1.11) 0.38 (0.04−0.72) 2.19 (0.76−6.32) 0.148 1.62 (0.55−4.78) 0.378 4 4,046 0.59 (0.36−0.83) 0.44 (0.24−0.64) 1.98 (0.81−4.85) 0.135 1.58 (0.64−3.91) 0.325 5 6,695 0.37 (0.23−0.52) 0.27 (0.15−0.39) 1.24 (0.51−3.04) 0.631 1.04 (0.42−2.56) 0.930 6 2,534 0.28 (0.07−0.48) 0.16 (0.00−0.32) 0.92 (0.31−2.74) 0.881 0.72 (0.24−2.18) 0.564 7 1,998 0.30 (0.06−0.54) 0.24 (0.21−0.45) 1 (ref) − 1 (ref) − Note. N is the total number of individuals. Table S4. Seroprevalence of IgM in asymptomatic individuals and odds ratio by time series
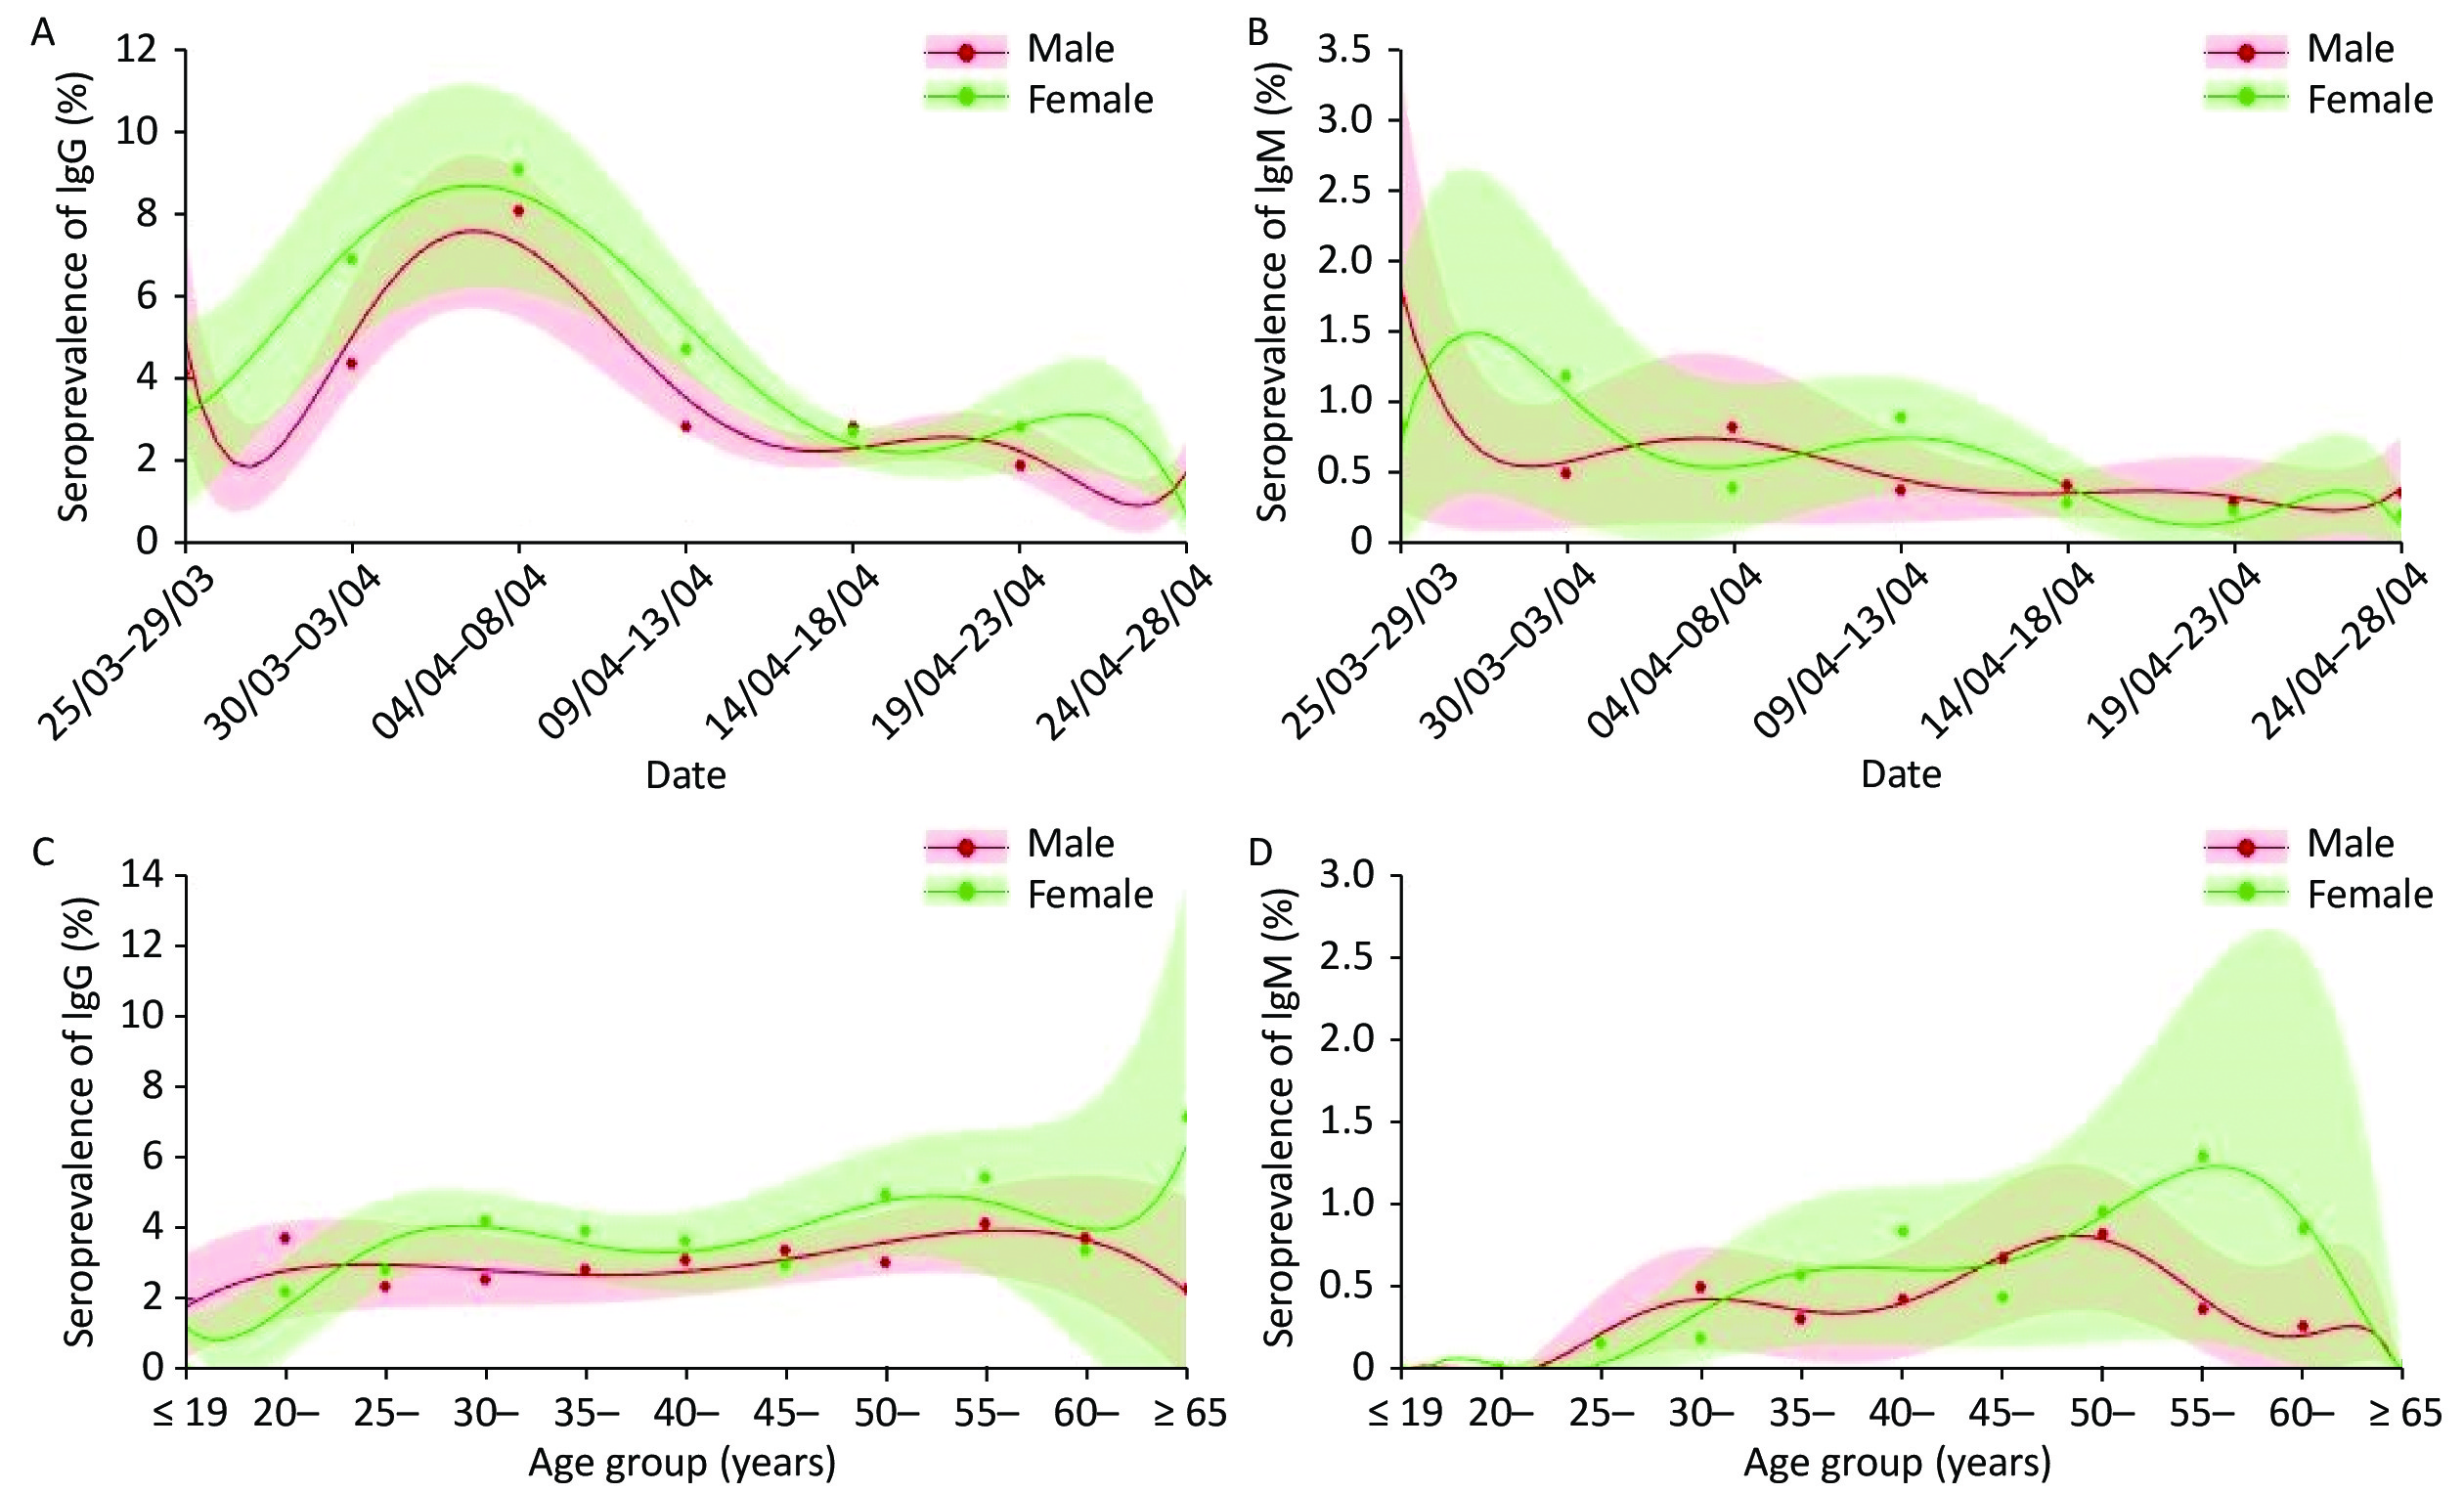
The distribution of the adjusted seroprevalence of IgG and IgM in the time series, and the distribution of the crude seroprevalence of IgG and IgM in different age groups are in Figure 1. The seroprevalence of IgG or IgM in different testing time periods was correlated with time periods (
$ {\chi}^{2} $ = 153.88, P < 0.001;$ {\chi}^{2} $ = 17.08, P = 0.009). Although none of the 26 individuals under the age of 19 years tested positive for IgG, no significant correlation was observed between the seroprevalence of IgG and the different age groups ($ {\chi}^{2} $ = 11.54, P = 0.292). In contrast, the seroprevalence of IgM was significantly correlated with different age groups ($ {\chi}^{2} $ = 18.50, P = 0.035), showing a higher seroprevalence in the middle-aged group for men and an increased seroprevalence with age for women. No IgM positivity was detected in males or females under 24 years old. The positivity for IgM antibodies in males over 55 years old was significantly lower than for females.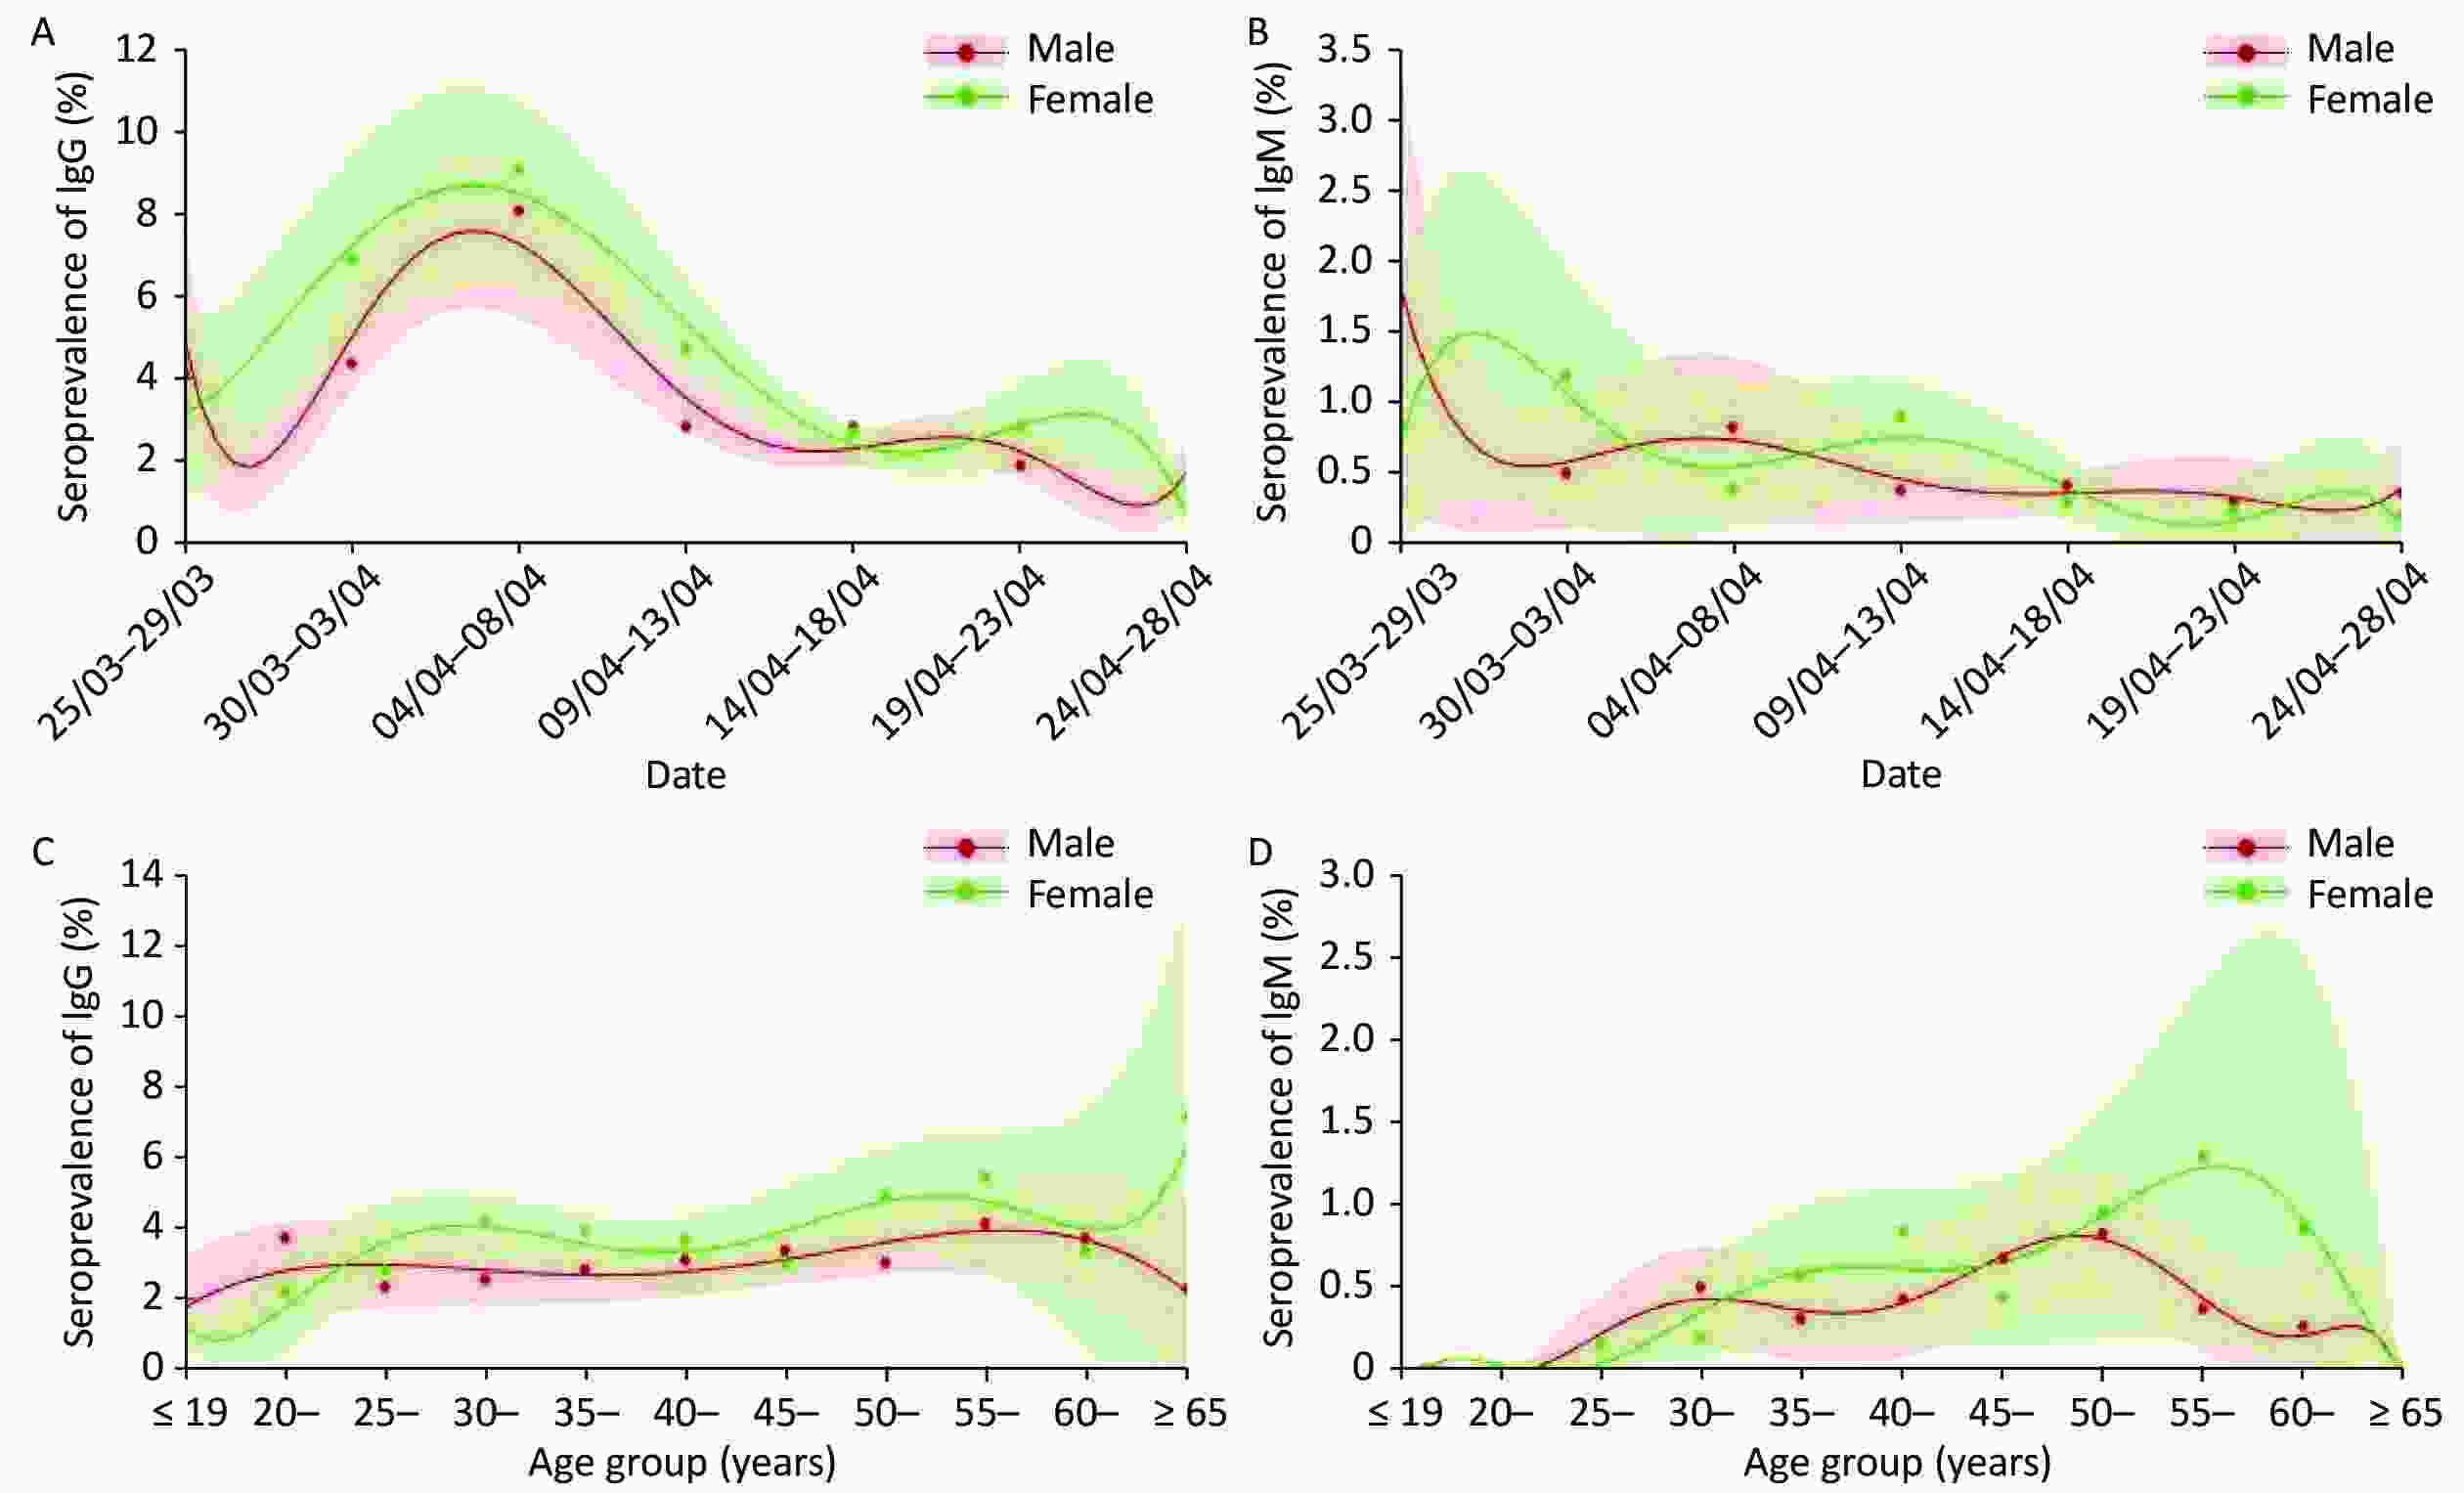
Figure 1. Distributions of seroprevalence of IgG and IgM in asymptomatic individuals in time series and age groups. (A) The seroprevalence with 95% CI of IgG adjusted for age in male and female asymptomatic individuals from March 25 to April 28, 2020 in Wuhan, China. (B) The seroprevalence with 95% CI of IgM adjusted for age in male and female asymptomatic individuals from March 25 to April 28, 2020 in Wuhan, China. (C) The crude seroprevalence with 95% CI of IgG in male and female asymptomatic individuals from ages 4 to 81 in Wuhan, China. (D) The crude seroprevalence with 95% CI of IgM in male and female asymptomatic individuals from ages 4 to 81 in Wuhan, China.
The crude seroprevalence and odds ratio by geographic areas from different types of workplaces are shown in Table 1. A significant difference was seen in seroprevalence of IgG by urban area (
$ {\chi}^{2} $ = 42.87, P < 0.001), but not observed for IgM ($ {\chi}^{2} $ = 14.73, P = 0.069). The Wuchang and Jianghan districts had higher seroprevalence of IgG than other urban areas. Among the 154 work units, 57.8% (89/154) had at least one positive case of IgG or IgM among employees, accounting for 92.5% (17,315/18,712) of individuals receiving serology testing, including in-service and partly retired employees. Approximately 60% of antibody-positive cases came from the top ten work units (6.5%, 10/154). Three work units (two located in Jianghan district) contributed 30.3% (199/657) of the number of antibody-positive individuals, including a water supply company, a real estate company, and telecommunications companies. A significant difference was seen in the seroprevalence of IgG and IgM among people from different work units (IgG:$ {\chi}^{2} $ = 202.43, P < 0.001; IgM:$ {\chi}^{2} $ = 28.92, P = 0.001). Among the tested individuals, the seroprevalence of IgG was highest for those who voluntarily came for serology test by themselves, followed by those encouraged by their work units. Supplementary Figure S3 (available in www.besjournal.com) shows the geographic distribution of the seroprevalence of IgG or IgM antibody against SARS-CoV-2 in asymptomatic people from March 25 to April 28, 2020, in Wuhan, China.Variables n Male, % Median age
in years (IQR)IgG+ IgM+ n1 %
(95% CI)Odds ratio*
(95% CI)P value n2 %
(95% CI)Odds ratio*
(95% CI)P value Urban and rural areas Jiangan# 1,468 56.1 43 (33−51) 40 2.72 (1.89−3.55) 1 (ref) − 3 0.20 (0.00−0.43) 1 (ref) − Jianghan 10,667 60.2 41 (33−51) 423 3.97 (3.60−4.34) 1.50 (1.08−2.08) 0.016 58 0.54 (0.40−0.68) 2.76 (0.86−8.83) 0.087 Huangpi 1,808 53.7 31 (26−36) 39 2.16 (1.49−2.83) 0.86 (0.55−1.35) 0.512 3 0.17 (0.00−0.36) 1.08 (0.22−5.44) 0.926 Hanyang 1,515 75.6 46 (34−53) 39 2.57 (1.77−3.37) 0.98 (0.62−1.53) 0.922 9 0.59 (0.20−0.98) 2.97 (0.80−11.0) 0.104 Qiaokou 974 78.1 37 (30−44) 13 1.33 (0.61−2.50) 0.53 (0.28−1.00) 0.051 2 0.21 (0.00−0.50) 1.22 (0.20−7.34) 0.831 Wuchang 884 59.2 43 (32−51) 37 4.19 (2.87−5.51) 1.59 (1.01−2.51) 0.045 7 0.79 (0.21−1.37) 4.04 (1.04−15.7) 0.043 Hongshan 565 45.7 39 (30−49) 14 2.48 (1.20−3.76) 0.91 (0.49−1.69) 0.767 4 0.71 (0.02−1.40) 3.70 (0.82−16.6) 0.088 Dongxihu 172 80.2 46 (34−52) 4 2.33 (0.08−4.58) 0.89 (0.32−2.52) 0.829 2 1.16 (0.00−2.76) 5.94 (0.98−35.9) 0.053 Caidian and the others 87 72.4 39 (33−47) 4 4.60 (0.20−9.00) 1.84 (0.64−5.26) 0.258 0 − − − Outside 572 46.9 42 (33−48) 14 2.45 (1.18−3.72) 0.89 (0.48−1.64) 0.704 1 0.17 (0.00−0.51) 0.87 (0.09−8.35) 0.901 Type of work unit Primary medical care# 628 33.9 43 (34−50) 15 2.39 (1.20−3.58) 1 (ref) − 3 0.48 (0.00−1.02) 1 (ref) − Tap water and natural gas 4,961 65.6 42 (35−50) 96 1.94 (1.56−2.32) 0.87 (0.50−1.51) 0.622 21 0.424 (0.24−0.60) 0.97 (0.29−3.29) 0.961 Real estate 2,481 67 41 (32−52) 147 5.93 (5.00−6.86) 2.78 (1.62−4.79) < 0.001 17 0.69 (0.36−1.02) 1.56 (0.45−5.37) 0.483 Government institutions 2,401 66.4 44 (35−52) 59 2.46 (1.84−3.08) 1.09 (0.61−1.94) 0.762 10 0.42 (0.16−0.68) 0.92 (0.25−3.37) 0.897 The airport 1,800 53.5 31 (26−36) 36 2.00 (1.35−2.65) 1.01 (0.54−1.86) 0.982 3 0.17 (0.00−0.36) 0.50 (0.10−2.53) 0.401 Banks, securities and insurance companies 1,786 46.7 35 (30−45) 89 4.98 (3.97−5.99) 2.38 (1.36−4.15) 0.002 17 0.95 (0.50−1.40) 2.43 (0.70−8.37) 0.161 Highway management and auto repair 944 76.3 47 (35−54) 41 4.34 (3.04−5.64) 1.99 (1.09−3.65) 0.025 8 0.85 (0.26−1.44) 1.87 (0.49−7.17) 0.361 Telecommunications companies 750 45.2 35 (31−40) 45 6.00 (4.30−7.70) 2.96 (1.63−5.38) < 0.001 1 0.13 (0.00−0.39) 0.36 (0.04−3.47) 0.375 Law firms, procuratorates 706 51.4 39 (31−50) 40 5.67 (3.96−7.38) 2.64 (1.44−4.83) 0.002 2 0.28 (0.00−0.67) 0.66 (0.11−3.98) 0.652 Rehab 700 72.7 45 (36−51) 15 2.14 (1.07−3.21) 0.97 (0.47−2.00) 0.925 5 0.71 (0.09−1.33) 1.62 (0.38−6.58) 0.514 Other service industries 1,501 60.4 39 (31−49) 33 2.20 (1.46−2.94) 1.01 (0.54−1.88) 0.978 1 0.07 (0.00−0.20) 0.16 (0.02−1.53) 0.112 Personal 54 61.1 42 (32−49) 11 20.4 (9.63−31.1) 11.5 (4.95−26.6) < 0.001 1 1.85 (0.00−5.44) 4.40 (0.45−43.3) 0.204 Note. n is the total number of individuals; n1 is the number of IgG-positive individuals; n2 is the number of IgM-positive individuals; IQR is interquartile range. *Odds ratios were adjusted for age and gender. #Jianghan district and primary medical care were the reference group to which other groups were compared. Real estate includes real estate agencies, residential property management firms and urban construction corporations. Table 1. Seroprevalence of IgG and IgM and odds ratio by geographic location (urban and rural areas) and occupation (types of work units)
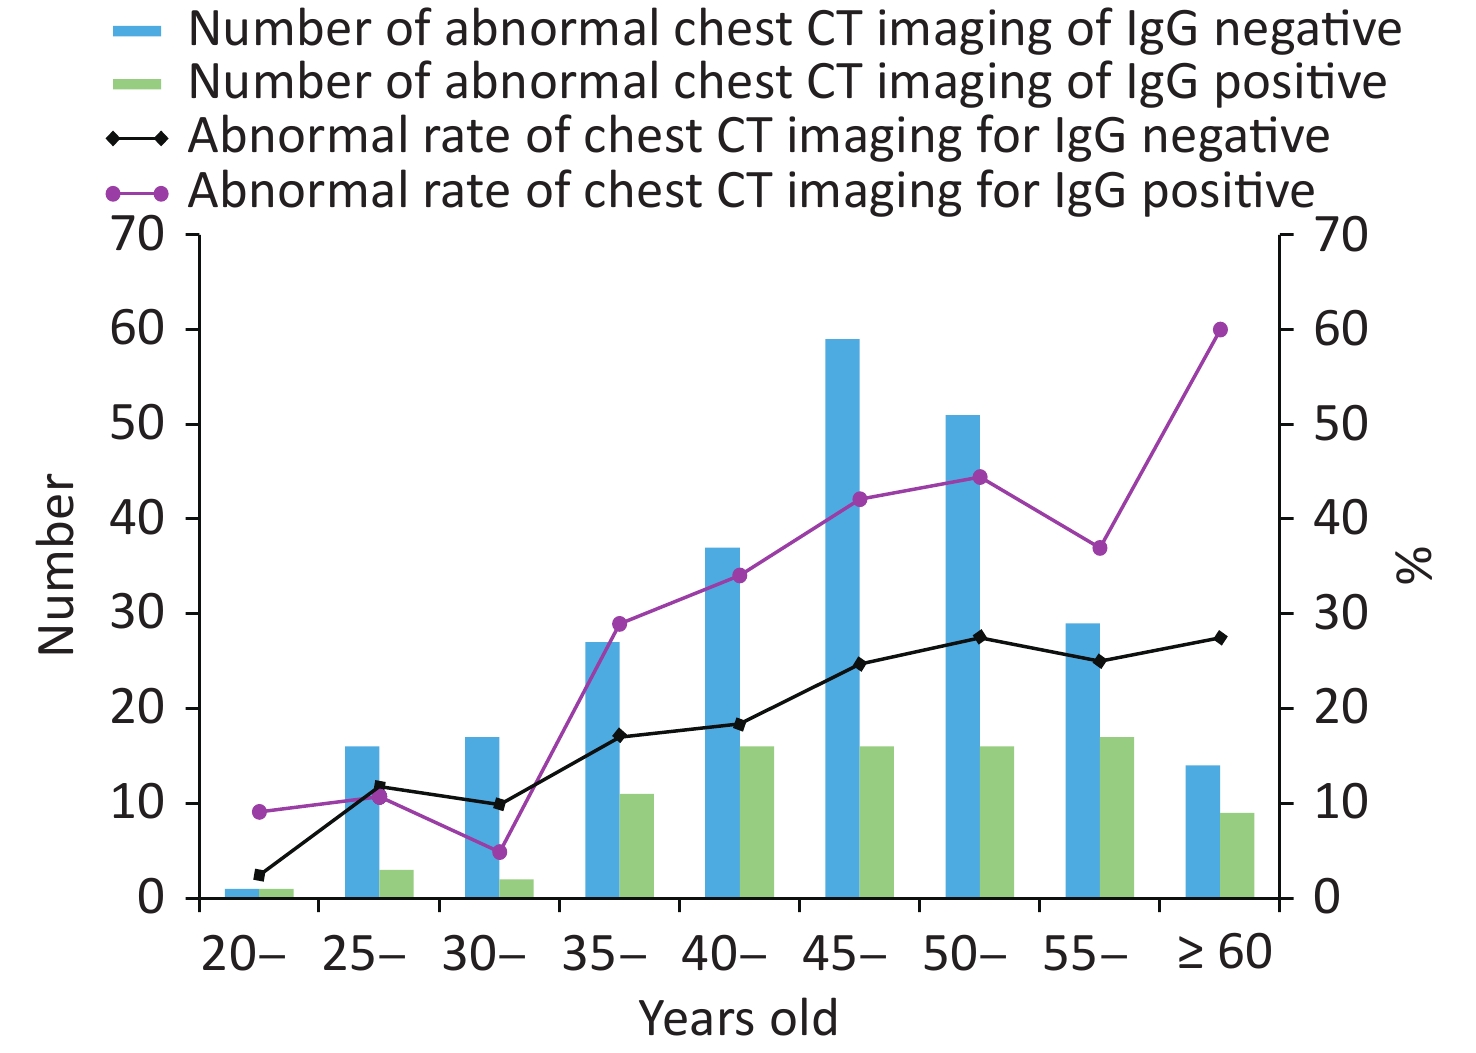
The relationship between abnormal chest CT imaging and the seroprevalence of IgG and IgM antibodies for different age groups was shown (Supplementary Figures S4–S5, available in www.besjournal.com). Of the participants, 1,636 underwent chest CT, and 342 had abnormal images. CT imaging abnormality was significantly different (
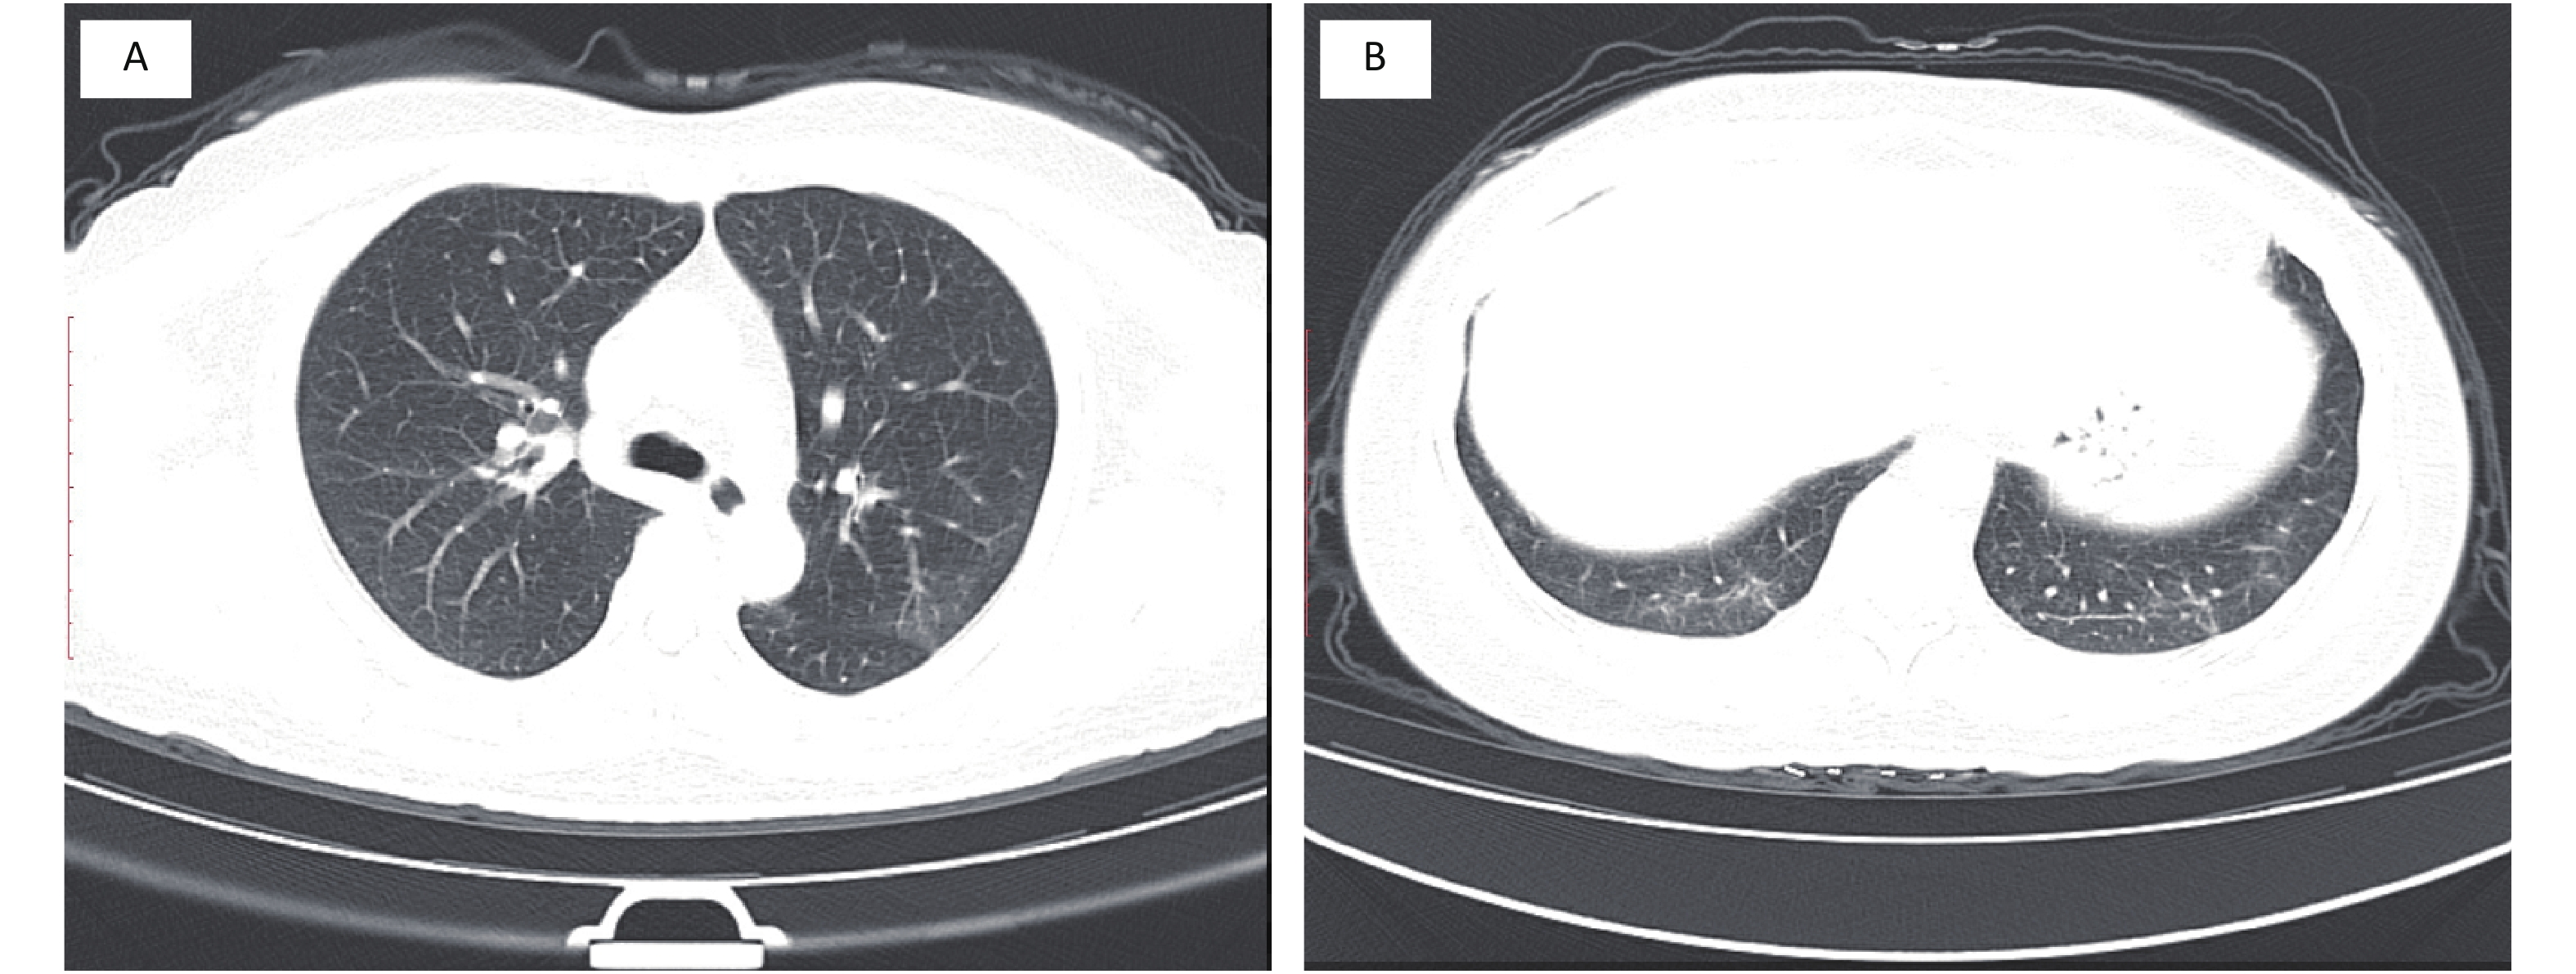
$ {\chi}^{2} $ = 17.74, P < 0.001) between people who were IgG antibody-positive (30.7%, 94/306) and IgG antibody-negative (19.7%, 262/1,330). Among the IgG-positive patients, typical abnormal chest CT signs were ground glass opacity (GGO)s, GGOs with small mixed consolidation, and prominent peripheral subpleural distribution (Figure 2). Significant differences were seen between IgG and/or IgM-positive test groups in leucocytes, neutrophilic granulocytes and monocyte percentage (Supplementary Table S5, available in www.besjournal.com).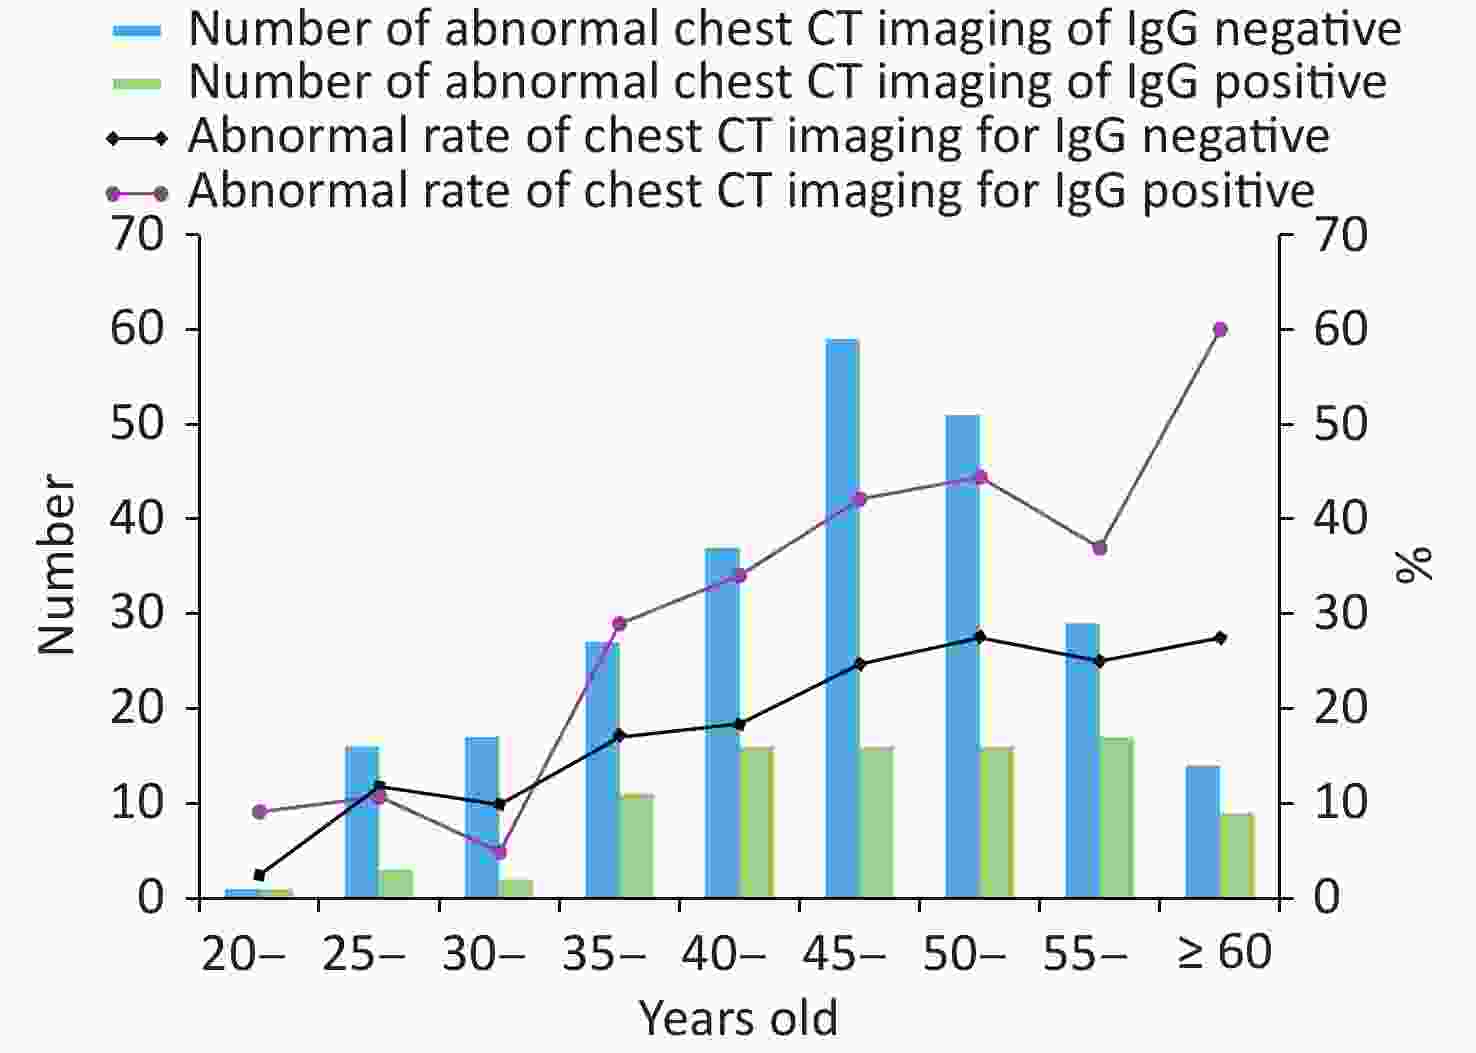
Figure S4. Abnormal rate of chest CT imaging between IgG positive and negative of asymptomatic individuals in Wuhan, 2020.
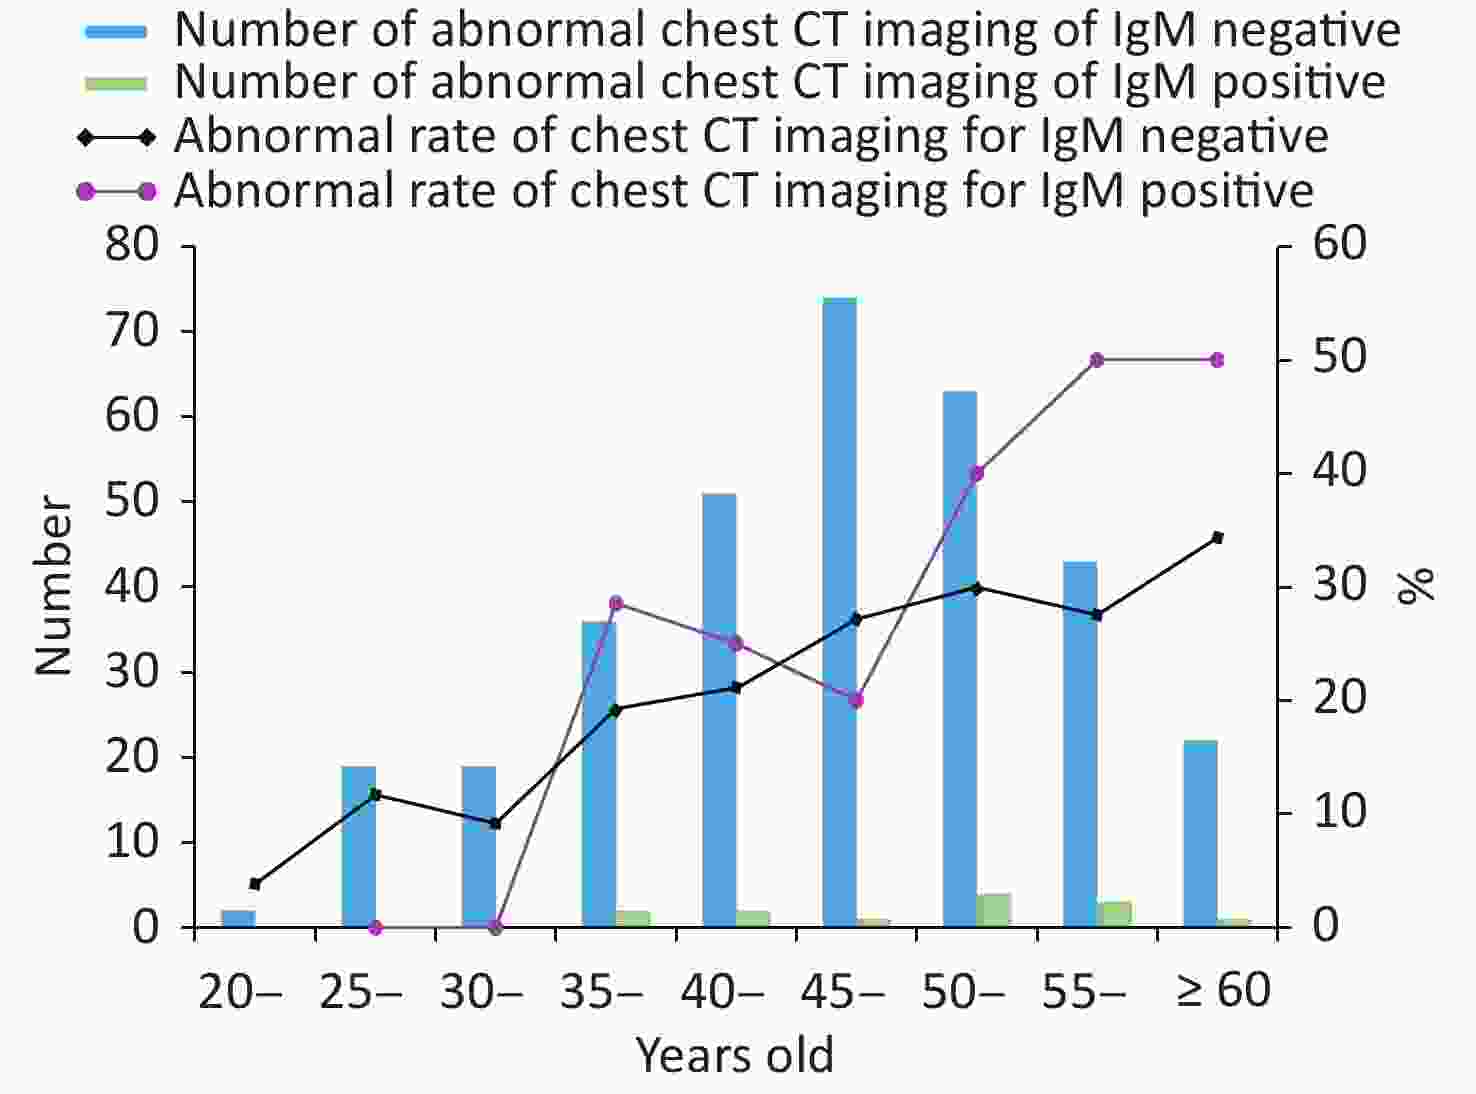
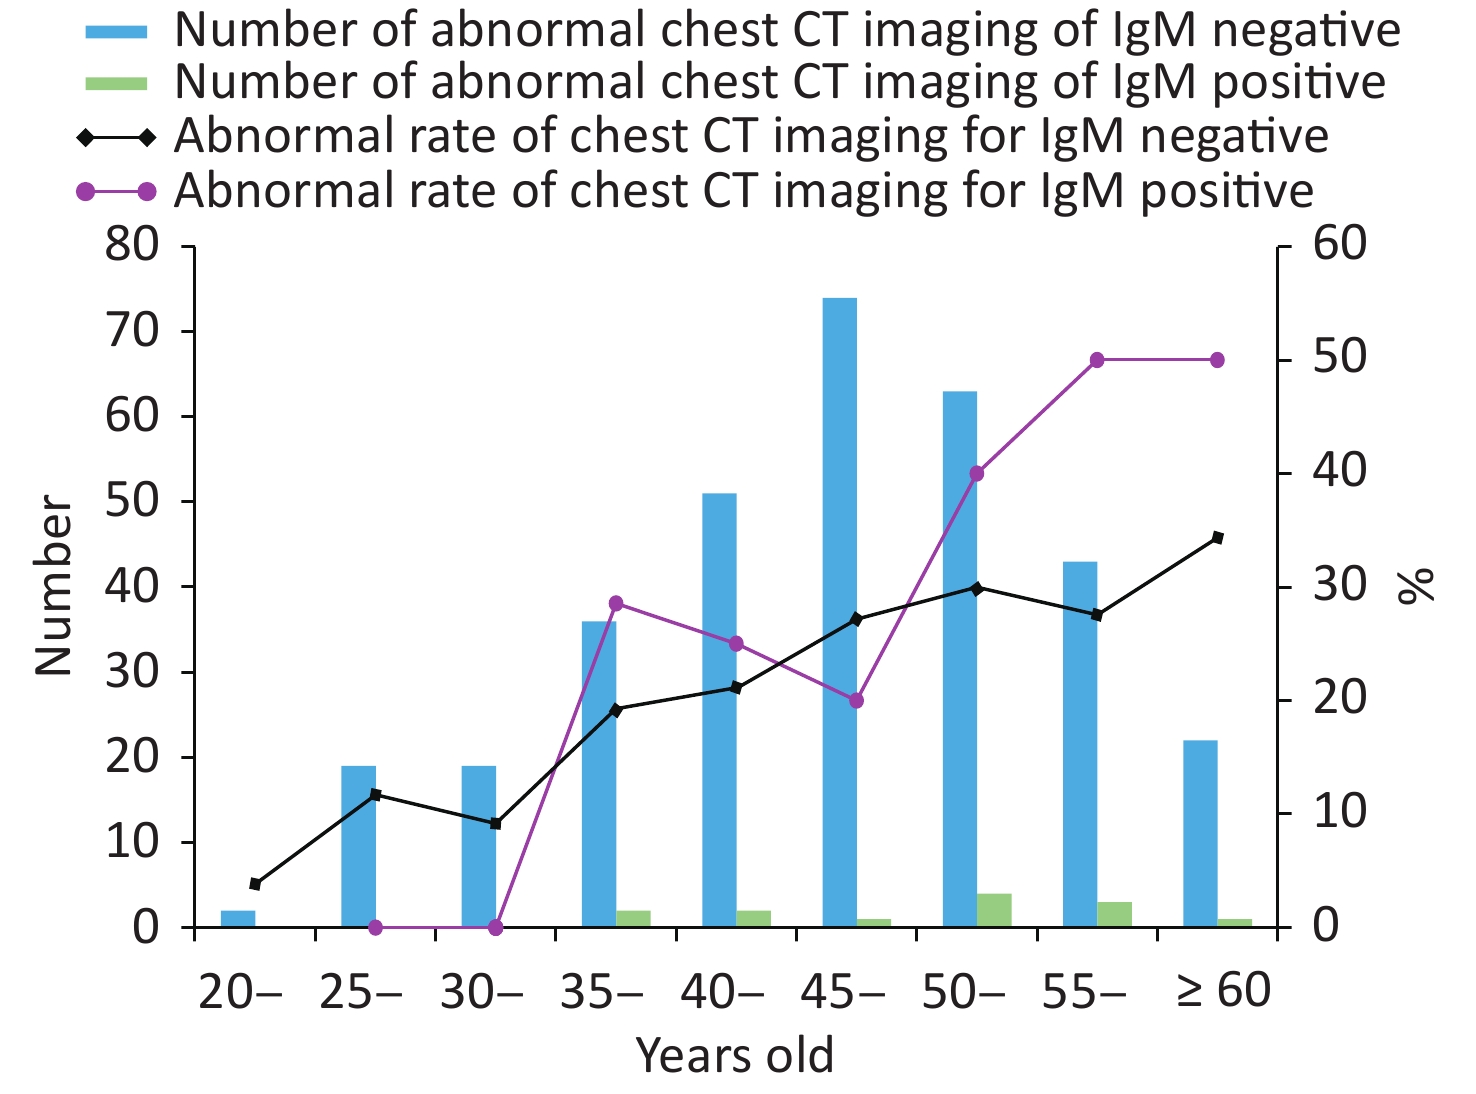
Figure S5. Abnormal rate of chest CT imaging between IgM positive and negative of asymptomatic individuals in Wuhan, 2020.
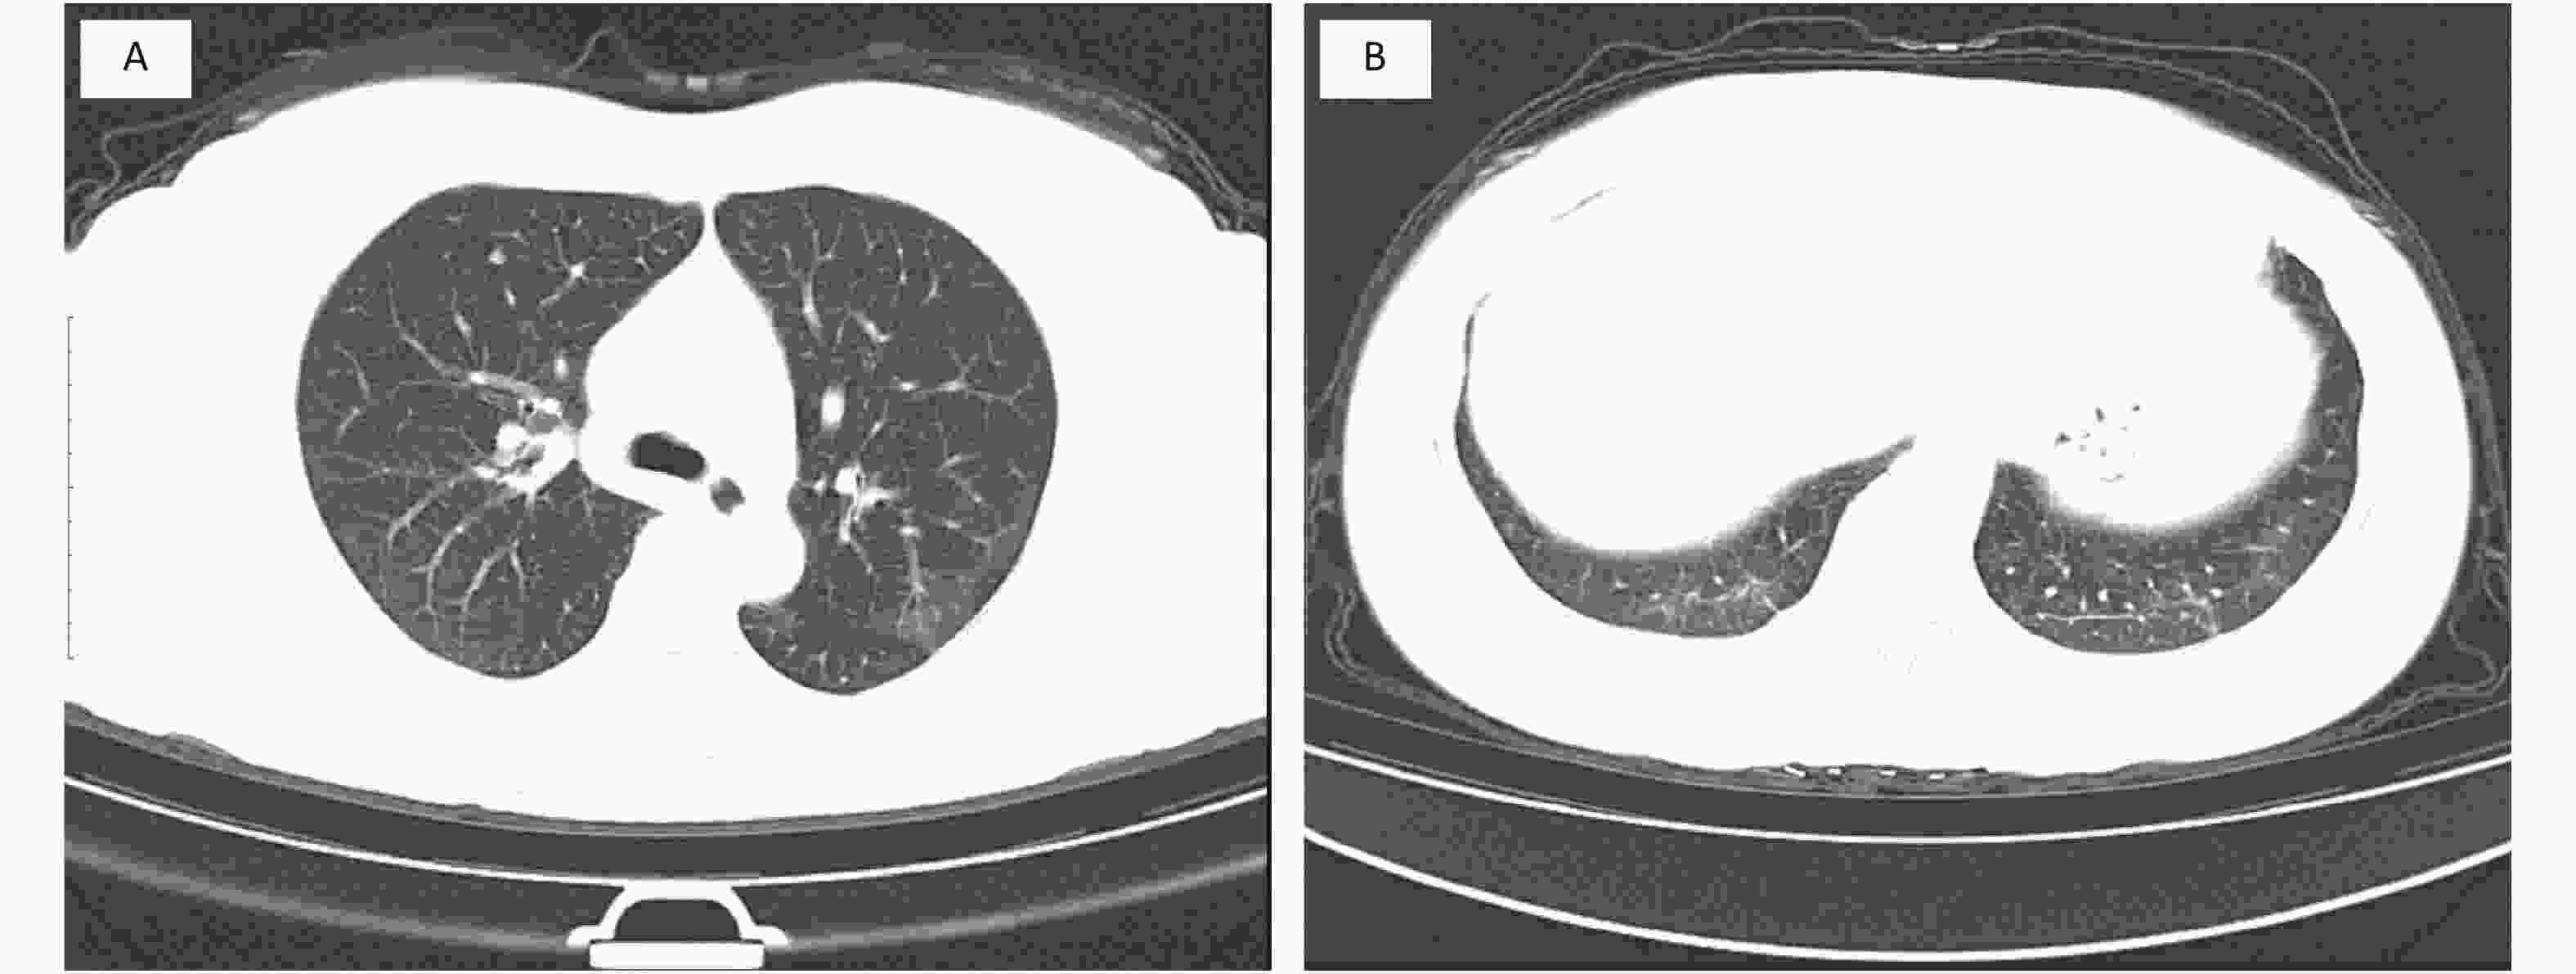
Figure 2. CT imaging of one asymptomatic individual positive for IgG. (A) shows a platelet of GGO in the posterior segment of the upper lobe of the left lung. (B) shows GGOs with small mixed consolidation in the posterior basal segment of the lower lobe of both lungs, and the pleural offline was seen in the posterior basal segment of the lower lobe of the left lung. GGO, ground glass opacity.
Laboratory result Normal range All IgG−/IgM− IgG+/IgM+ P n Mean ± SD n1 Mean ± SD n2 Mean ± SD Leucocytes, × 109/L 3.5–9.5 12,481 6.9 ± 1.8 12,037 6.9 ± 1.8 444 6.7 ± 1.7 0.027 Neutrophilic granulocyte, × 109/L 1.8–6.3 12,481 3.9 ± 1.3 12,037 3.9 ± 1.3 444 3.8 ± 1.3 0.027 Monocyte percentage, % 3.1–10.0 12,481 7.4 ± 2.1 12,037 7.4 ± 2.1 444 7.6 ± 2.1 0.006 Note. SD: Standard deviation. n is the total number of individuals; n1 is the number of IgG/IgM-negative individuals; n2 is the number of IgG/IgM-positive individuals. Table S5. Laboratory hematology results of asymptomatic individuals.
Detection of asymptomatic or subclinical SARS-CoV-2 infection is critical for understanding the overall prevalence and infection potential of COVID-19. In the early 2020, studies showed the seroprevalence of anti-SARS-CoV-2 antibodies were 4.8%–10.9% in Geneva, Switzerland[8] and around 5.0% (4.7%–5.4%) in Spain[6], which demonstrated most population remained unexposed. In China, the seroprevalence among the general population was only 3.35%. Additionally, the reported confirmed patients was up to 50,333 in Wuhan until April 28. Therefore, we estimated there were at least 4.1 (204,548/50,333) asymptomatic infections for every reported confirmed case in the general population, which was smaller than the estimate of the Switzerland study (11.6 infections per reported confirmed case in the community).
This study showed there were differences in IgG seroprevalence among urban and rural areas, which were much higher in Wuchang District and Jianghan District than in other areas. Based on the cumulative number of reported cases of COVID-19 from March 25 to April 28, and the number of residents in each district in Wuhan, we estimated an average incidence rate per 100,000 people of 2.98 (95% CI: 2.97–2.99) during this period. Incidence rates were higher in the Jianghan and Wuchang districts, at 8.09 (95% CI: 8.02–8.15) and 7.25 (95% CI: 7.20–7.29) per 100,000 people, respectively, which show that seropositive rates in different geographic areas were consistent with the spread of the SARS-CoV-2 coronavirus in Wuhan (Supplementary Table S6 and Supplementary Figure S6, available in www.besjournal.com).
Urban areas Cumulative
number of cases
reported in March 25, 2020Cumulative
number of cases
reported in April 28, 2020Number of
new cases reported
during the periodPermanent
populationIncidence rate
(/100,000)95% CI Jianghan 5,183 5,242 59 729,700 8.09 8.02 8.15 Huangpi 2,114 2,117 3 1,011,900 0.30 0.29 0.31 Hanyang 4,670 4,691 21 664,200 3.16 3.12 3.20 Jiangan 6,549 6,563 14 962,700 1.45 1.43 1.48 Qiaokou 6,834 6,854 20 868,700 2.30 2.27 2.33 Wuchang 7,458 7,551 93 1,282,800 7.25 7.20 7.29 Hongshan 4,679 4,718 39 1,677,300 2.33 2.30 2.35 Dongxihu 2,462 2,471 9 584,800 1.54 1.51 1.57 Caidian and
the others9,831 9,903 72 3,298,900 2.18 2.17 2.20 Total 50,003 50,333 327 11,081,000 2.98 2.97 2.99 Note. Data from: 1. Update on Covid-19 outbreak in Wuhan. 2020. http://wjw.wuhan.gov.cn/ztzl_28/fk/tzgg/202004/t20200430_1202887.shtml. [2020-6-3]. 2. Update on Covid-19 outbreak in Wuhan. 2020. http://wjw.wuhan.gov.cn/ztzl_28/fk/tzgg/202004/t20200430_1198159.shtml. [2020-6-3]. 3. A brief analysis of resident population in Wuhan in 2018. 2020. http://tjj.wuhan.gov.cn/tjfw/tjfx/202001/t20200115_840940.shtml. [2020-3-23]. Table S6. Incidence of COVID-19 from March 25 to April 28, 2020 in all urban areas of Wuhan city
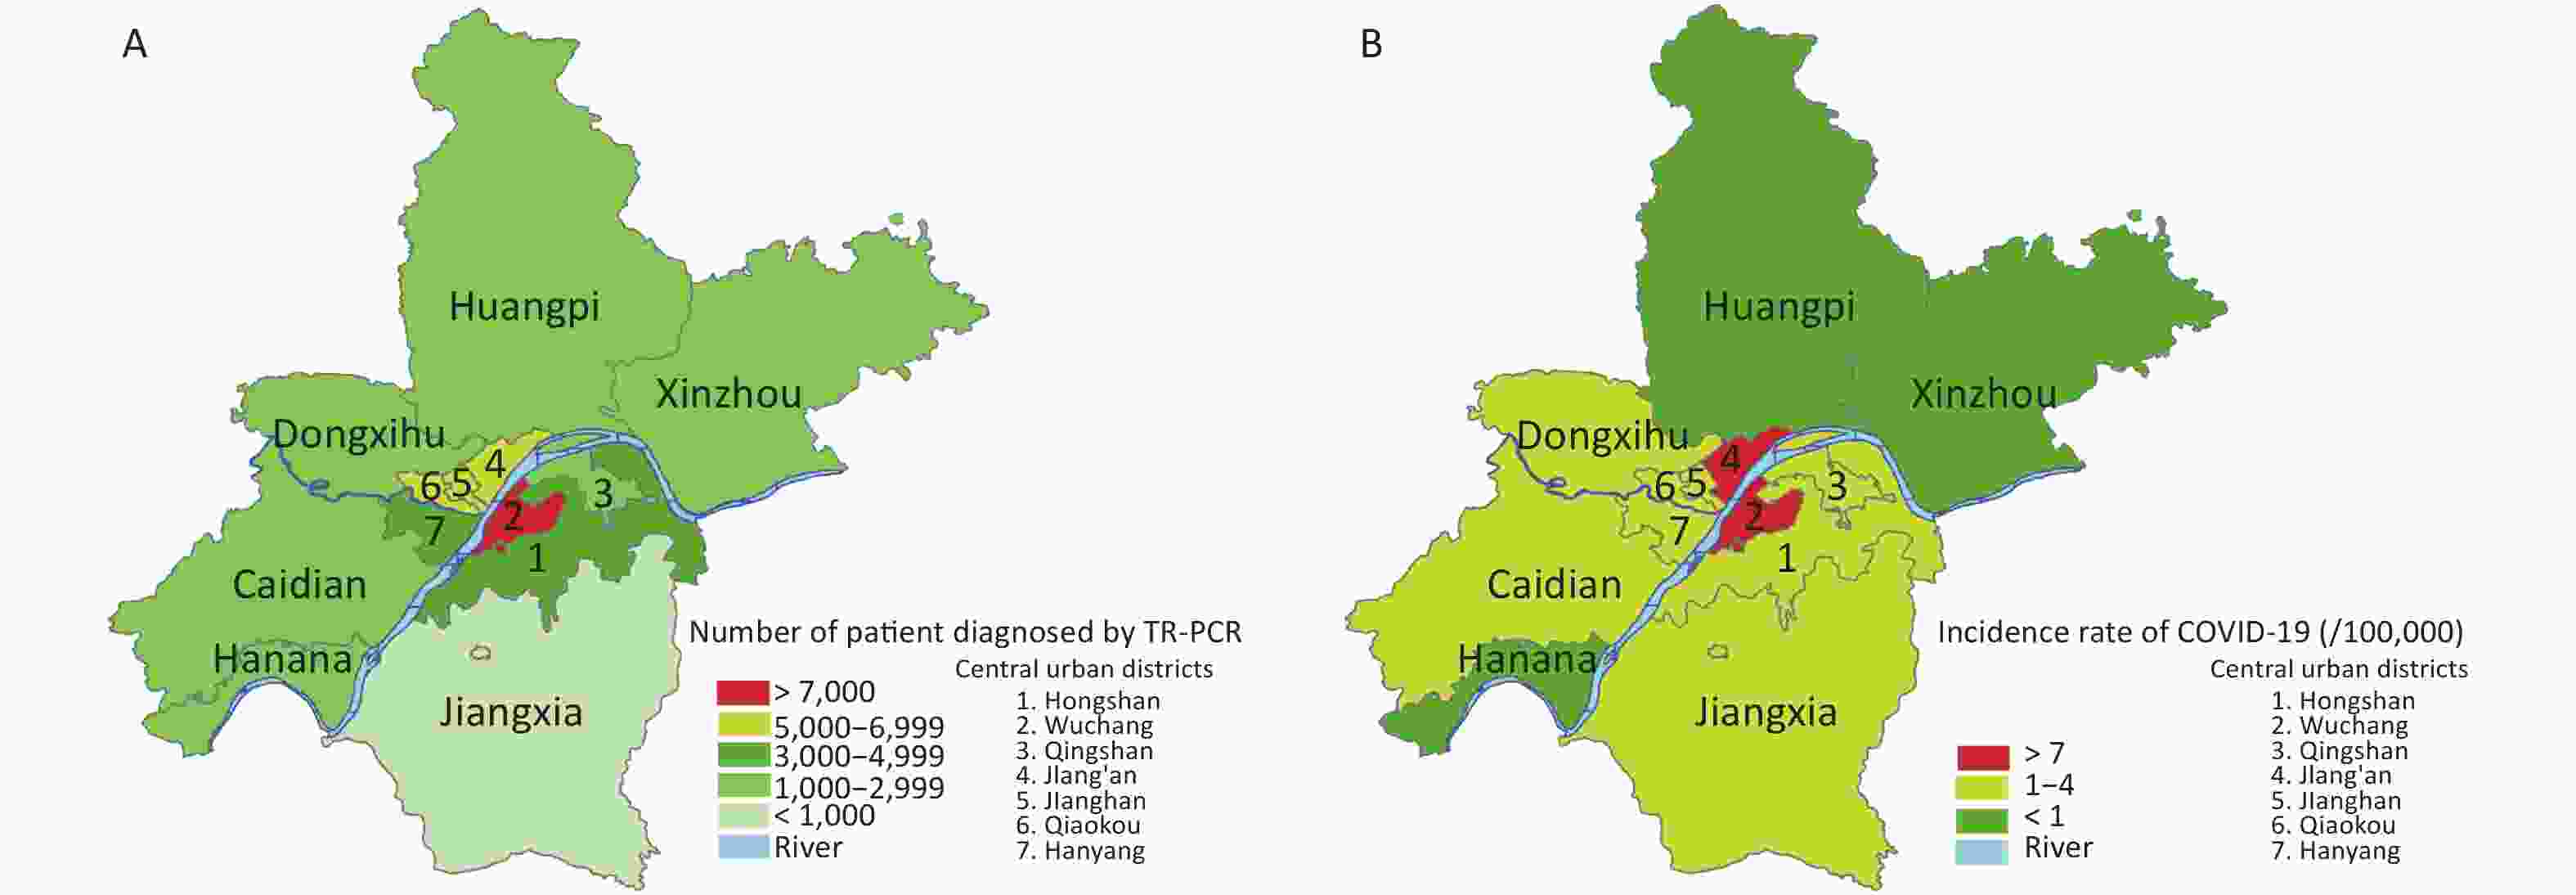
Figure S6. Geographic distribution of COVID-19 patients, by the time of April 28, 2020, grouped by each of the 13 districts of the city of Wuhan. (A) The cumulative number of patient reported diagnosed by RT-PCR for COVID-19. (B) The incidence rate of COVID-19 per ten thousand.
Additionally, the highest seroprevalence of IgG was in those people who voluntarily came for serology testing by themselves, most of whom had close contacts with COVID-19 patients and therefore had a higher risk of infection. Our study found significant aggregation of asymptomatic infections in individuals from certain occupations. The groups in some industries with high IgG seroprevalence were easy to identify due to the nature of their jobs, such as insurance and securities professionals located in the higher risk districts, which faced a greater chance of contacting infected people during their work. Besides, we also found the IgG seroprevalence was higher in females than in males, indicating that females were more likely to have asymptomatic infections. This was consistent with previous studies[9]. Finally, the most common CT features in patients affected by COVID-19 include GGO and consolidation involving the bilateral lungs in a peripheral distribution[10]. The CT imaging which we observed demonstrated similar differences between IgG antibody-positive and negative individuals, reminding some damage may have occurred in some asymptomatic individuals positive for IgG antibodies.
This investigation had a few limitations. First, there were selection bias since the analysed medical records were based on examinees directed by their work units. Most of the examinees came from government-owned institutions and agencies instead of private businesses. Therefore, the sample was incompletely randomized and insufficiently representative, compromising the assessment accuracy of the prevalence of asymptomatic infections in Wuhan. Second, as the examinees were only from the back-to-work population, people under the age of 19 and over age 65 were too few to be fully covered in analyses. However, the strength of this study includes being designed as repeated five-day serosurveys, which allowed for the monitoring of seroprevalence progression just after the end of the first epidemic. Furthermore, our study applied scientific statistical methods accounting for the demographic structure of the general population and diagnostic tests to estimate seroprevalence in the overall population, while capturing uncertainty in the estimates.
Our study verified most population remains susceptible to COVID-19 in Wuhan. We also found significant aggregation of asymptomatic infections from certain occupations and slight damage may occurred in infections CT imaging. Thus, we recommend the prevention strategies should focusing on high risk populations and the CT imaging should not use as the only diagnosing method. Moreover, we hope the study of IgG and IgM against SARS-CoV-2 among asymptomatic infections can provide scientific basis for vaccine development.
Acknowledgements We acknowledge the work and contribution of all the health care providers from the Hubei Provincial Hospital of Integrated Chinese & Western Medicine.
Ethical Approval and Consent to Participate This study was approved by the Ethics Committee of the Hubei Provincial Hospital of Integrated Chinese & Western Medicine [No. 2020011]. Waiver of informed consent for collection of epidemiological data from individuals tested for COVID-19 was granted by the National Health Commission of China as part of the infectious disease outbreak investigation. All identifiable personal information was removed for privacy protection when data were extracted.
Author Contributors LRJ, YHY, WHQ, and LT were responsible for study design. LRJ, YHY, WHQ, and HJY were responsible for the literature search. LRJ, YHY, ZJX, XS, SRR, ZWC, WHQ, and CMF were responsible for data collection. WHQ was responsible for data analysis. WHQ and CMF were responsible for figures. WHQ, JHL, and LT were responsible for data interpretation. WHQ, HJY, JHL, LRJ, and YHY were responsible for writing the first draft of the manuscript. All authors contributed to the final draft.
Conflict of Interest No potential conflict of interest was reported by the authors. The funder had no role in study design, data collection, data analysis, interpretation or writing of the report.
HTML


Reference
 20386.pdf
|

|

 Quick Links
 DownLoad: