


-
The nutritional status of children is one of the most important global public health issues [1]. The period from birth to two years of age has been identified as a critical period in the lives of children for the promotion of optimal growth and development [2]. Proper complementary feeding is important for healthy growth and the attainment of a child's human potential. Insufficient quantities and inadequate quality of complementary foods, together with poor feeding practices, pose a threat to children's health and nutrition [3].
China launched the National Survey on Physical Growth and Development of Children (NSPGDC) in nine Chinese cities, which was repeatedly undertaken using the same methods in the same nine cities for the continuity and comparability of the survey results every ten years from 1975 to 2015. These investigations showed an obvious trend in the feeding patterns of Chinese children. Since the early 1990s, the Chinese diet pattern has changed towards more fat and calories and less dietary fiber among young children. Although the prevalence of malnutrition decreased dramatically for children under five years old during the past two decades in China, it remains high during the complementary feeding introduction period [4,5]. Another national representative survey (Chinese National Nutrition and Health Survey) showed that dietary diversity, meal frequency, and acceptable diet during the complementary feeding period were not optimal for 6–23 month-old infants and young children in China [6]. During this period, the rates of stunting and anemia among infants and young children in China have risen sharply, forming a peak of child malnutrition. The main influencing factors are the variety and frequency of complementary food [7,8].
One of the guiding principles for complementary feeding is gradually increasing food consistency and variety as the infant grows older, adapting to the infant's nutritional requirements and abilities [9]. In 2021, the World Health Organization (WHO)/United Nations International Children's Emergency Fund (UNICEF) updated the indicators for assessing infant and young child feeding practices [10]. Guiding principles for feeding breastfed and non-breastfed children recommend that children aged 6–23 months be fed a variety of foods to ensure that nutrient needs are met. Children 6–23 months of age who consumed foods and beverages from at least five out of eight defined food groups each day. Generally, the progression from liquid food to a mixed diet of family foods occurs in the period from 6 to 24 months of age approximately. Six to eight months of age is the ideal stage to initiate complementary food introduction. Infants begin to become familiar with the taste of food during this stage. At the age of 12 to 23 months, most children have tasted various daily family foods, transitioned to eating with their families, and gradually formed their own eating patterns.
The research methods of dietary patterns can be roughly divided into several categories, which are investigator-driven methods, data-driven methods, hybrid methods, etc. [11]. Previous studies on children's diet patterns in China have mostly focused on preschoolers and school-age children whose diet patterns are roughly formed [12-14], and there are limited studies on children’s diet patterns using data-driven methods during the complementary food introduction period in China [5,15]. The purpose of this study is to understand the characteristics of diets among children aged 12 to 23 months and use multivariate statistical analysis methods to summarize and cluster the individual dietary patterns and discuss the relationship between dietary patterns and undernutrition status.
-
This research is based on a cross-sectional survey. The data presented in this study stem from the National Nutrition and Health Systematic Survey for 0 to 18 year-old children in China. The detailed methods of this survey have been described previously [16]. In brief, the survey used a stratified multistage cluster sampling method to select participants in each of the surveyed provinces. This study selected data from seven provinces, including Beijing (n = 351), Zhejiang (n = 362), Liaoning (n = 358), Jilin (n = 347), Jiangxi (n = 350), Hunan (n = 314), and Shanxi (n = 367). Inclusion criteria for survey subjects were being a healthy child born locally and within the age range and having lived at the survey site for more than half a year. Children who were incompatible with age, premature, or suffering from various acute or chronic diseases were excluded. Basic demographic information, including name, age, gender, race, residential area, and caregivers was collected via household survey questionnaires. The Ethics Review Board of the National Institute for Nutrition and Health, Chinese Center for Disease Control and Prevention approved the protocol (2019-009). All caregivers gave their informed, written consent to participate before starting the interview.
-
The weight and length of the children were measured using standardized procedures by well-trained local Centers for Desease Control and Prevention (CDC) and hospital staff at a community health center. Length was measured to the nearest 0.1 cm using a pediatric length board with the children in a recumbent position, and weight was measured to the nearest 0.1 kg on a lever weight scale. The dietary intakes of young children were assessed using a food frequency questionnaire (FFQ) through on-site face-to-face interviews with the parents or main caregivers by a trained clinical research assistant during each visit. The FFQ consisted of food commonly consumed, and participants needed to recall the consumption frequency according to two different time periods, including times per day and times per week. Quantities of dairy consumption of more than 10 grams were calculated as one time per day. According to indicators for assessing infant and young child feeding practices [10], the dietary foods were categorized as 1) grains (rice, wheat flour, roots, tubers, and corn); 2) vitamin A-rich fruits and vegetables; 3) other fruits and vegetables; 4) eggs (fresh egg, salted duck egg, and preserved egg); 5) flesh foods (meat, fish, poultry, organ meats); 6) pulses (beans, peas, lentils), nuts and seeds; 7) breast milk; 8) dairy products (milk, infant formula, yogurt, cheese); 9) snacks; 10) sugar drinks; 11) fortified food; 12) vitamin A or D; and 13) other supplements (iron, zinc, calcium, DHA). Investigators provided drawings of daily products which were common in local markets and helped the participants recall their intake frequency and quantity.
-
Length-for-age Z scores (LAZ), weight-for-age Z scores (WAZ), and weight-for-length Z scores (WLZ) were calculated according to the 2006 WHO Child Growth Standards using the WHO Anthro 2009 software [17]. Children with Z scores higher than 5 or lower than 5 were excluded. Descriptive statistics were performed to describe the basic demographic characteristics and weekly dietary intakes of the respondents. The frequencies of total dietary intakes were divided into three levels, which were described as < 1/week, 1–6/week, and ≥ 1/day. K-means clustering analysis was applied to identify children’s individual dietary patterns. The frequencies of dietary intakes, which were categorized as < 1/week, 1–3/week, 4–6/week, and ≥ 1/day, were scored as 1, 2, 3, and 4, respectively. Standardized scores of food frequency were entered into a cluster analysis model. The between-cluster comparison was performed using one-way analysis of variance (ANOVA) and Bonferroni test. All statistical analyses were performed with R software, and P values < 0.05 were considered statistically significant.
-
General characteristics and diets of the study sample are outlined in Table 1. Records with illogical answers or missing data were excluded. A total of 2,449 children aged 12–23 month-old were included in this analysis, with 1,258 boys (51.4%) and 1,191 girls (48.6%) after data cleaning. Of the children enrolled, 1,332 were from urban areas (54.4%), and 1,117 were from rural areas (45.6%). Children who consumed grain foods more than once per day (≥ 1/day) accounted for 88.4%. The percentage of children who consumed vitamin A-rich fruits and vegetables, other fruits and vegetables, and eggs more than once per day were 59.9%, 69.4%, and 62.1%, respectively. Children who consumed flesh foods more than once per day took up 40.1%. The proportion of continuous breastfeeding was 29.4%. The figure for children who consumed dairy products more than once per day was 83.1%.
Variables Case % Variables Case % Gender Dairy products Boys 1,258 51.4 ≥ 1/day 2,035 83.1 Girls 1,191 48.6 1–6/week 137 5.6 Residential area < 1/week 277 11.3 Urban 1,332 54.4 Breast milk Rural 1,117 45.6 ≥ 1/day 504 20.6 Caregivers 1–6/week 215 8.8 Parents 1,463 59.7 < 1/week 1,730 70.6 Grandparents 935 38.2 Snacks Others 51 2.1 ≥ 1/day 869 35.5 Grains 1–6/week 1,162 47.4 ≥ 1/day 2,165 88.4 < 1/week 418 17.1 1–6/week 210 8.6 Sugar drinks < 1/week 74 3.0 ≥ 1/day 199 8.2 Vitamin A-rich fruits and vegetables 1–6/week 400 16.3 ≥ 1/day 1,467 59.9 < 1/week 1,850 75.5 1–6/week 854 34.9 Fortified foods < 1/week 128 5.2 ≥ 1/day 293 12.0 Other fruits and vegetables 1–6/week 325 13.3 ≥ 1/day 1,699 69.4 < 1/week 1,831 74.7 1–6/week 649 26.5 Supplements: vitamin A or D < 1/week 101 4.1 ≥ 1/day 1,499 61.2 Eggs 1–6/week 176 7.2 ≥ 1/day 1,521 62.1 < 1/week 774 31.6 1–6/week 674 27.5 Supplements: others < 1/week 254 10.4 ≥ 1/day 1,167 47.6 Flesh foods 1–6/week 229 9.4 ≥ 1/day 983 40.1 < 1/week 1,053 43.0 1–6/week 1,104 45.1 Total 2,449 100.0 < 1/week 362 14.8 Pulses, nuts, and seeds ≥ 1/day 437 17.8 1–6/week 1,228 50.2 < 1/week 784 32.0 Table 1. Demographic characteristics and dietary intake frequency of the participants
-
The eight-cluster solution is regarded as an optimal clustering solution for separating the current dataset into several clusters, given the comparatively greater cluster quality and high repeatability. Consequently, the eight-cluster solution was adopted for further analysis to examine the characteristics of dietary patterns of the individuals allocated to each cluster. Clusters 1 to 8 (C1–C8) consisted of the following numbers of participants each: N1 = 195 (8.0%), N
2 = 361 (14.8%), N 3 = 214 (8.7%), N 4 = 373 (15.2%), N 5 = 423 (17.3%), N 6 = 516 (21.1%), N 7 = 263 (10.7%), and N 8 = 104 (4.2%). K-means cluster analysis outcomes and the differences between distributions of food frequency for each cluster are summarized in Tables 2 and 3. In C1, C2, and C7, children had a high consumption frequency of grains, fruits, vegetables, and nutrient supplements, while they had a medium consumption frequency of eggs, flesh foods, and pulses. The difference in dietary consumption between C1 and C2 was found in sugar drinks and fortified food consumption, for which children in C1 had a high frequency and those in C2 had a low frequency. Children in C7 had the highest breast milk consumption (more than once per day was 91.3%). In C3, C5, and C6, children had a high consumption frequency of grains, while they had a medium consumption frequency of fruits, vegetables, as well as eggs, flesh foods, and pulses, yet a low consumption frequency of other supplements (iron, zinc, calcium, DHA). Children in C3 had the lowest milk product consumption (more than once per day was 0.5%). Children in C5 and C6 had the lowest consumption of other supplements (more than once per day was 0% and 0%, respectively). In C4, children had a medium consumption frequency of fruits, vegetables, and eggs, but a low consumption frequency of flesh foods, pulses, and breastmilk (more than once per day was 8.3%, 3.5%, and 0%, respectively). In C8, children still took milk as their dominant dairy food. They displayed the lowest consumption frequency of grains, fruits, vegetables, eggs, and flesh foods, a medium frequency of breast milk consumption, and a high frequency of dairy product consumption. Item Cluster 1 Cluster 2 Cluster 3 Cluster 4 Cluster 5 Cluster 6 Cluster 7 Cluster 8 N (%) 195 (8.0) 361 (14.8) 214 (8.7) 373 (15.2) 423 (17.3) 516 (21.1) 263 (10.7) 104 (4.2) Grains 3.978 3.937 3.742 3.869 3.900 3.952 3.827 1.617 Vitamin A-rich fruits and vegetables 3.813 3.545 2.763 3.178 3.396 3.796 3.473 1.336 Other fruits and vegetables 3.870 3.823 2.980 3.414 3.578 3.570 3.715 1.308 Eggs 3.641 3.291 2.821 3.412 3.409 2.622 3.378 1.271 Flesh foods 3.632 3.243 2.110 2.604 2.823 3.496 2.793 1.187 Pulses, nuts, and seeds 3.197 2.169 1.722 1.828 2.100 2.200 2.072 1.168 Breast milk 1.232 1.399 1.628 1.055 1.113 1.448 3.949 2.215 Dairy products 3.825 3.783 3.038 3.893 3.884 3.174 2.944 3.336 Snacks 3.616 3.238 1.758 2.313 2.712 3.313 2.707 1.299 Sugar drinks 2.003 1.537 1.339 1.212 1.187 1.430 1.372 1.393 Fortified foods 2.124 1.074 1.235 1.368 1.559 3.970 1.798 1.084 Supplements: vitamin A or D 3.841 1.066 1.148 3.911 3.953 1.139 3.699 3.262 Supplements: others 3.908 1.624 1.418 3.937 1.135 1.426 3.011 2.935 Table 2. Eight dietary clusters and means of food consumption scores
Item Cluster 1
N = 195Cluster 2
N = 361Cluster 3
N = 214Cluster 4
N = 373Cluster 5
N = 423Cluster 6
N = 516Cluster 7
N = 263Cluster 8
N = 104n (%) n (%) n (%) n (%) n (%) n (%) n (%) n (%) Grains ≥ 1/day 192 (98.5) 352 (97.4) 176 (82.3) 328 (87.9) 393 (92.9) 470 (91.1) 236 (89.7) 18 (17.3) 1–6/week 3 (1.5) 8 (2.3) 36 (16.8) 45 (12.1) 29 (6.9) 45 (8.7) 25 (9.5) 19 (18.3) < 1/week 0 (0) 1 (0.3) 2 (0.9) 0 (0) 1 (0.2) 1 (0.2) 2 (0.8) 67 (64.4) Vitamin-A rich fruits and vegetables ≥ 1/day 176 (90.3) 284 (78.7) 96 (44.9) 148 (39.7) 272 (64.3) 303 (58.7) 187 (71.0) 1 (1.0) 1–6/week 17 (8.7) 76 (21.0) 110 (51.4) 210 (56.3) 144 (34.0) 196 (38.0) 70 (26.7) 31 (29.8) < 1/week 2 (1.0) 1 (0.3) 8 (3.7) 15 (4.0) 7 (1.7) 17 (3.3) 6 (2.3) 72 (69.2) Other fruits and vegetables ≥ 1/day 179 (91.8) 316 (87.5) 117 (54.7) 190 (50.9) 313 (74.0) 366 (70.9) 218 (82.9) 0 (0) 1–6/week 15 (7.7) 43 (11.9) 92 (43.0) 177 (47.5) 106 (25.1) 143 (27.7) 44 (16.7) 29 (27.9) < 1/week 1 (0.5) 2 (0.6) 5 (2.3) 6 (1.6) 4 (0.9) 7 (1.4) 1 (0.4) 75 (72.1) Eggs ≥ 1/day 150 (76.9) 275 (76.2) 107 (50.0) 226 (60.6) 295 (69.7) 271 (52.6) 195 (74.1) 2 (1.9) 1–6/week 32 (16.4) 68 (18.8) 82 (38.3) 115 (30.8) 99 (23.4) 204 (39.5) 53 (20.1) 21 (20.2) < 1/week 13 (6.7) 18 (5.0) 25 (11.7) 32 (8.6) 29 (6.9) 41 (7.9) 15 (5.8) 81 (77.9) Flesh foods ≥ 1/day 152 (77.9) 254 (70.4) 70 (32.7) 31 (8.3) 183 (43.3) 190 (36.8) 102 (38.8) 1 (1.0) 1–6/week 34 (17.5) 104 (28.8) 102 (47.7) 265 (71.1) 193 (45.6) 253 (49.0) 135 (51.3) 18 (17.3) < 1/week 9 (4.6) 3 (0.8) 42 (19.6) 77 (20.6) 47 (11.1) 73 (14.2) 26 (9.9) 85 (81.7) Pulses, nuts, and seeds ≥ 1/day 109 (55.9) 92 (25.5) 44 (20.6) 13 (3.5) 60 (14.2) 65 (12.5) 54 (20.5) 0 (0) 1–6/week 69 (35.4) 212 (58.7) 84 (39.3) 230 (61.7) 256 (60.6) 224 (43.5) 135 (51.3) 18 (17.3) < 1/week 17 (8.7) 57 (15.8) 86 (40.1) 130 (34.8) 107 (25.2) 227 (44.0) 74 (28.2) 86 (82.7) Dairy products ≥ 1/day 176 (90.3) 347 (96.1) 1 (0.5) 352 (94.4) 407 (96.2) 495 (95.9) 174 (66.2) 83 (79.8) 1–6/week 8 (4.1) 8 (2.3) 41 (19.1) 11 (3.0) 9 (2.1) 21 (4.0) 35 (13.3) 4 (3.8) < 1/week 11 (5.6) 6 (1.7) 172 (80.4) 10 (2.7) 7 (1.7) 0 (0) 54 (20.5) 17 (16.3) Breast milk ≥ 1/day 14 (7.2) 0 (0) 114 (53.3) 0 (0) 57 (13.5) 46 (8.9) 240 (91.3) 33 (31.7) 1–6/week 22 (11.3) 17 (4.7) 41 (19.2) 19 (5.1) 28 (6.6) 56 (10.8) 23 (8.7) 9 (8.7) < 1/week 159 (81.5) 344 (95.3) 59 (27.6) 354 (94.9) 338 (79.9) 414 (80.2) 0 (0) 62 (59.6) Snacks ≥ 1/day 151 (77.4) 185 (51.2) 54 (25.2) 54 (14.5) 145 (34.3) 172 (33.3) 107 (40.7) 1 (1.0) 1–6/week 39 (20.0) 153 (42.4) 113 (52.8) 247 (66.2) 227 (53.7) 239 (46.4) 122 (46.4) 22 (21.2) < 1/week 5 (2.6) 23 (6.4) 47 (22.0 72 (19.3) 51 (12.1) 105 (20.3) 34 (12.9) 81 (77.9) Sugar drinks ≥ 1/day 110 (56.4) 2 (0.6) 10 (4.7) 12 (3.2) 9 (2.1) 27 (5.3) 21 (8.0) 8 (7.7) 1–6/week 23 (11.8) 58 (16.1) 62 (29.0) 55 (14.8) 41 (9.7) 103 (19.9) 43 (16.4) 15 (14.4) < 1/week 62 (31.8) 301 (83.3) 142 (66.3) 306 (82.0) 373 (88.2) 386 (74.8) 199 (75.6) 81 (77.9) Fortified foods ≥ 1/day 115 (59.0) 1 (0.3) 12 (5.6) 34 (9.1) 53 (12.5) 28 (5.4) 48 (18.3) 2 (1.9) 1–6/week 18 (9.2) 45 (12.4) 19 (8.9) 68 (18.2) 68 (16.1) 48 (9.3) 54 (20.5) 5 (4.8) < 1/week 62 (31.8) 315 (87.3) 183 (85.5) 271 (72.7) 302 (71.4) 440 (85.3) 161 (61.2) 97 (93.3) Supplements: vitamin A or D ≥ 1/day 148 (75.9) 318 (88.1) 52 (24.3) 283 (75.9) 404 (95.5) 0 (0) 227 (86.3) 67 (64.4) 1–6/week 13 (6.7) 10 (2.8) 26 (12.1) 30 (8.0) 19 (4.5) 49 (9.5) 16 (6.1) 13 (12.5) < 1/week 34 (17.4) 33 (9.1) 136 (63.6) 60 (16.1) 0 (0.0) 467 (90.5) 20 (7.6) 24 (23.1) Supplements: others ≥ 1/day 171 (87.7) 345 (95.5) 10 (4.6) 343 (92.0) 0 (0) 0 (0.0) 237 (90.1) 61 (58.7) 1–6/week 15 (7.7) 16 (4.5) 26 (12.2) 30 (8.0) 46 (10.9) 62 (12.0) 22 (8.4) 12 (11.5) < 1/week 9 (4.6) 0 (0) 178 (83.2) 0 (0) 377 (89.1) 454 (88.0) 4 (1.5) 31 (29.8) Table 3. Dietary intake frequency by cluster
-
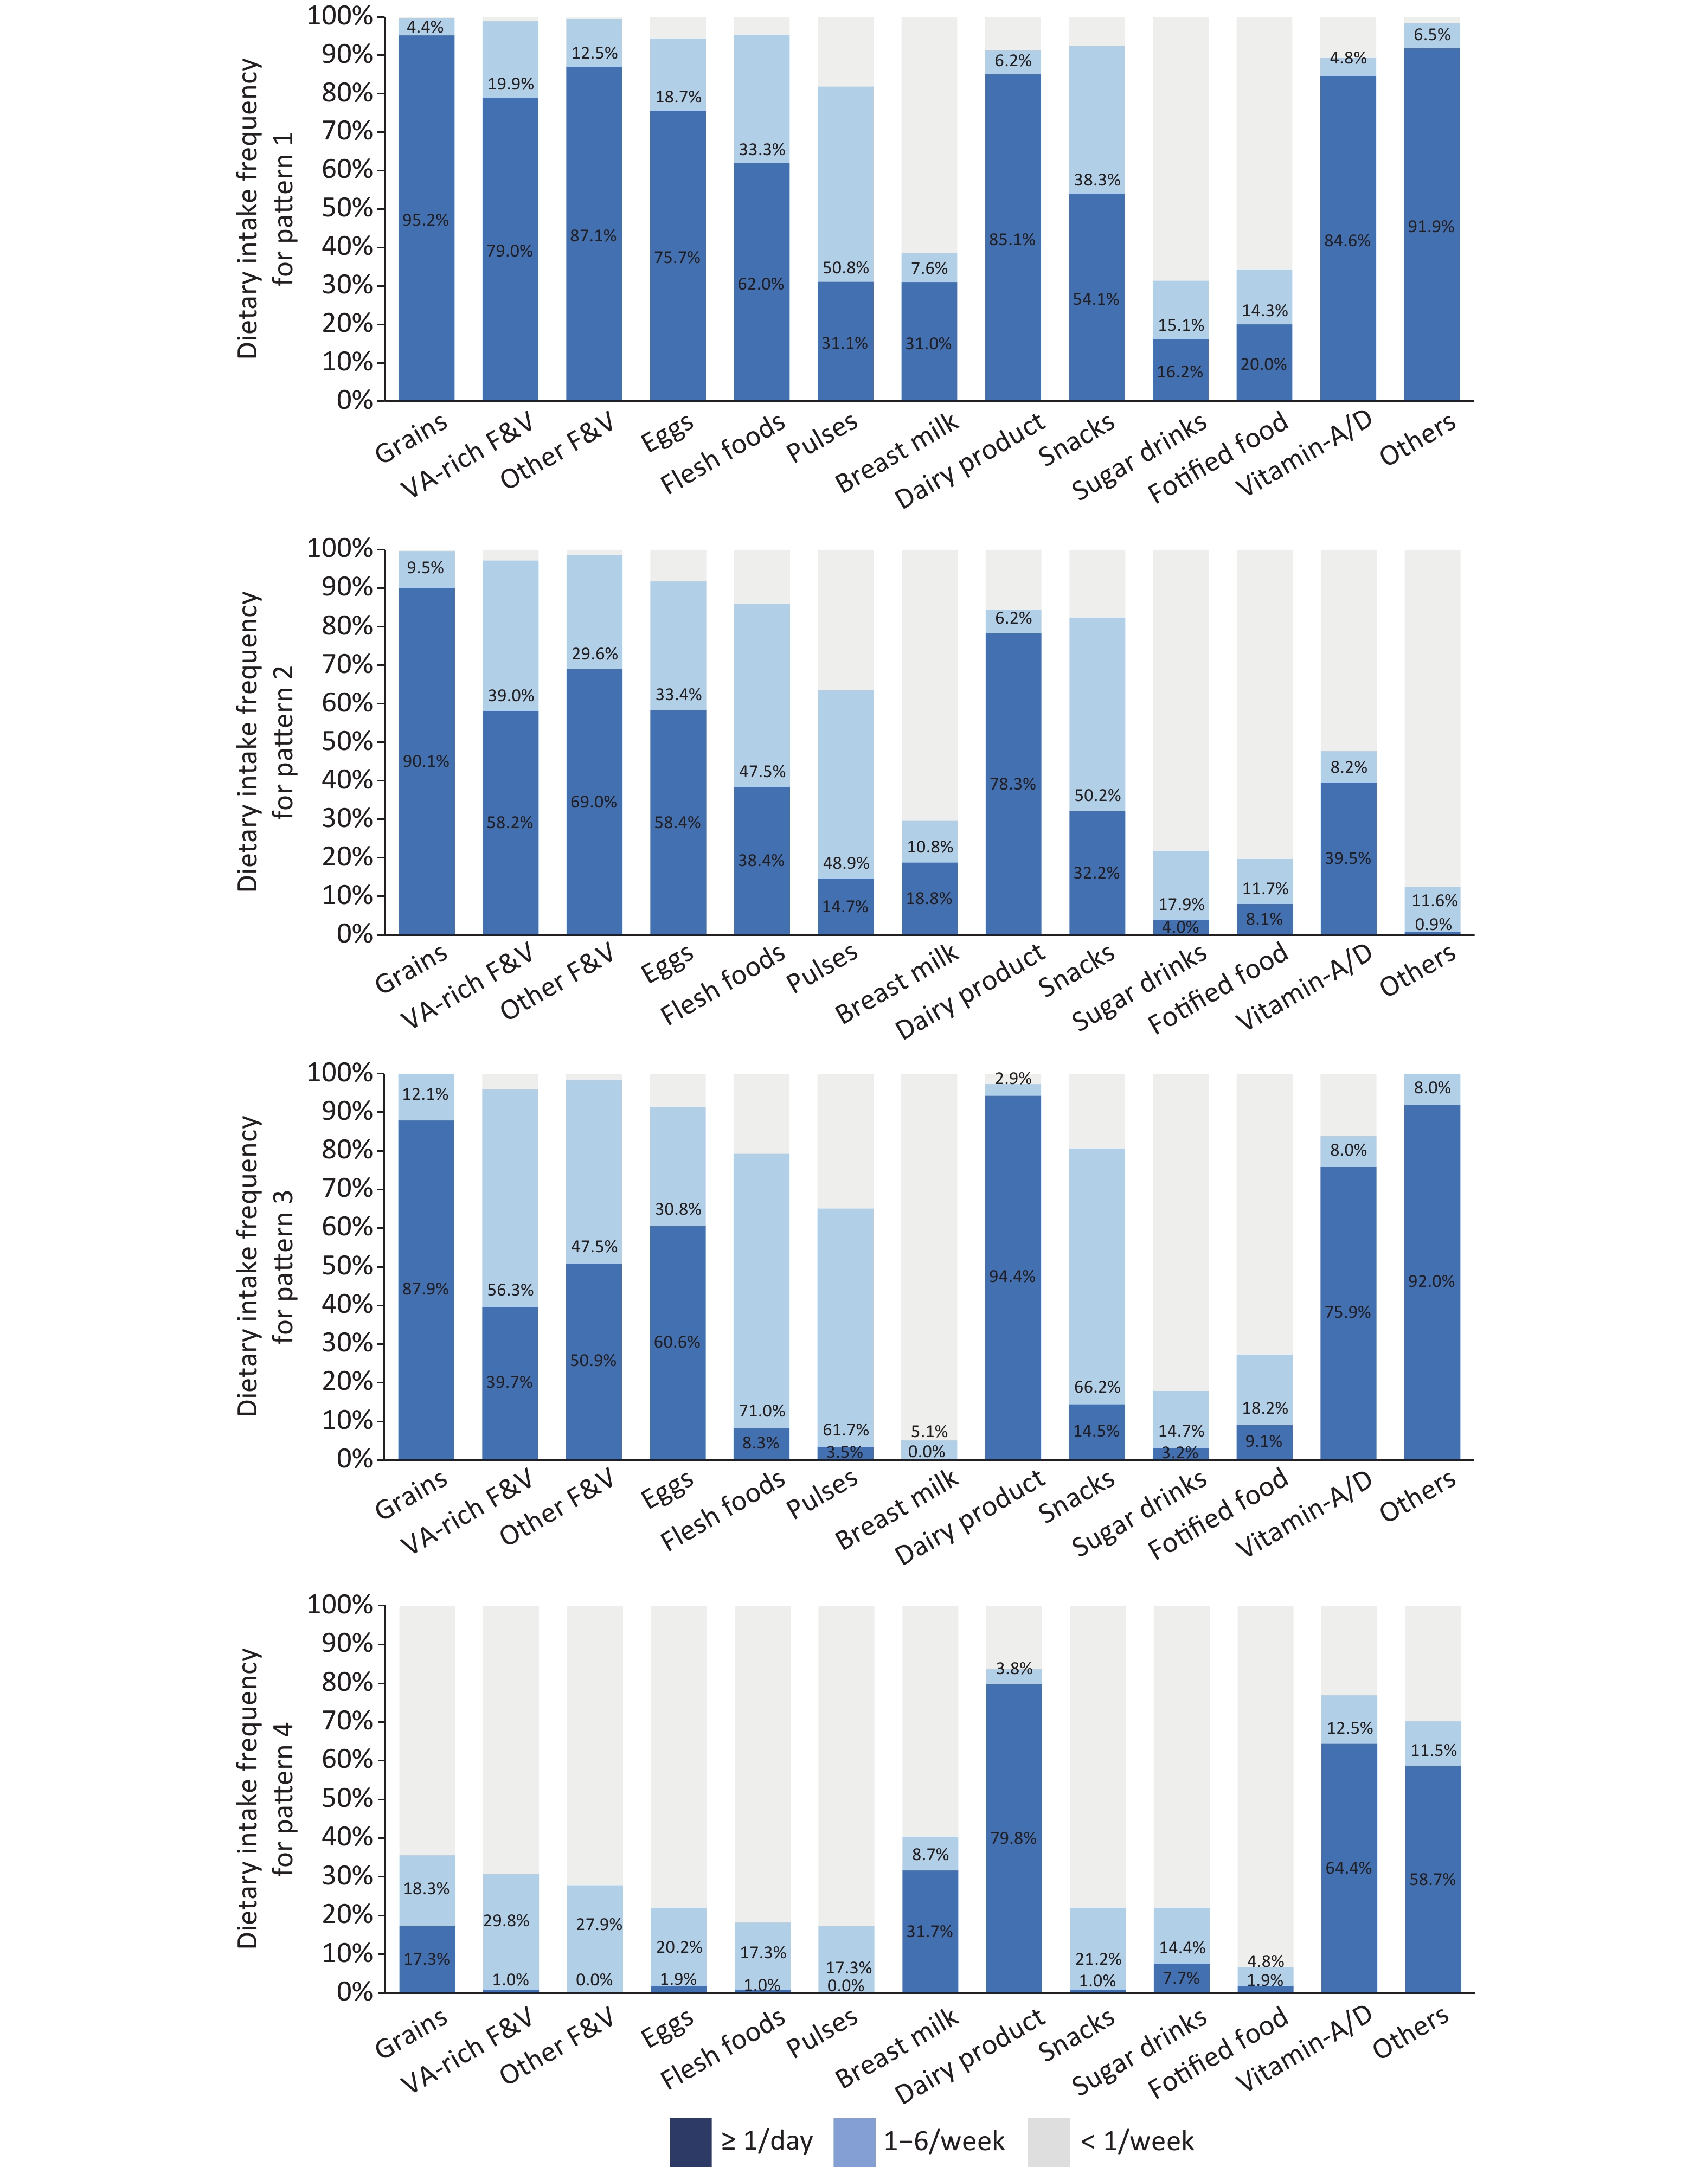
According to the characteristics of the eight clusters, the dietary patterns of children aged 12–24 months were classified into four types. Each pattern is shown in Figure 1. Pattern 1 (n = 819, 33.5%), including Clusters 1, 2, and 7, showed children with a high intake frequency of grains, fruits, vegetables, animal-source foods, and nutrient supplements. Pattern 2 (n = 1,153, 47.1%), including Clusters 3, 5, and 6, displayed a high intake frequency of grains, medium intake frequency of fruits, vegetables, and animal-source foods, and a low intake frequency of nutrient supplements. Pattern 3 (n = 373, 15.2%), including Cluster 4, featured a high intake frequency of grains, a medium intake frequency of fruits, vegetables, and eggs, and a low intake frequency of flesh food and pulses. Pattern 4 (n = 104, 4.2%), including Cluster 8, showed a low intake frequency of grains and a very low intake frequency of fruits, vegetables, eggs, and flesh foods.
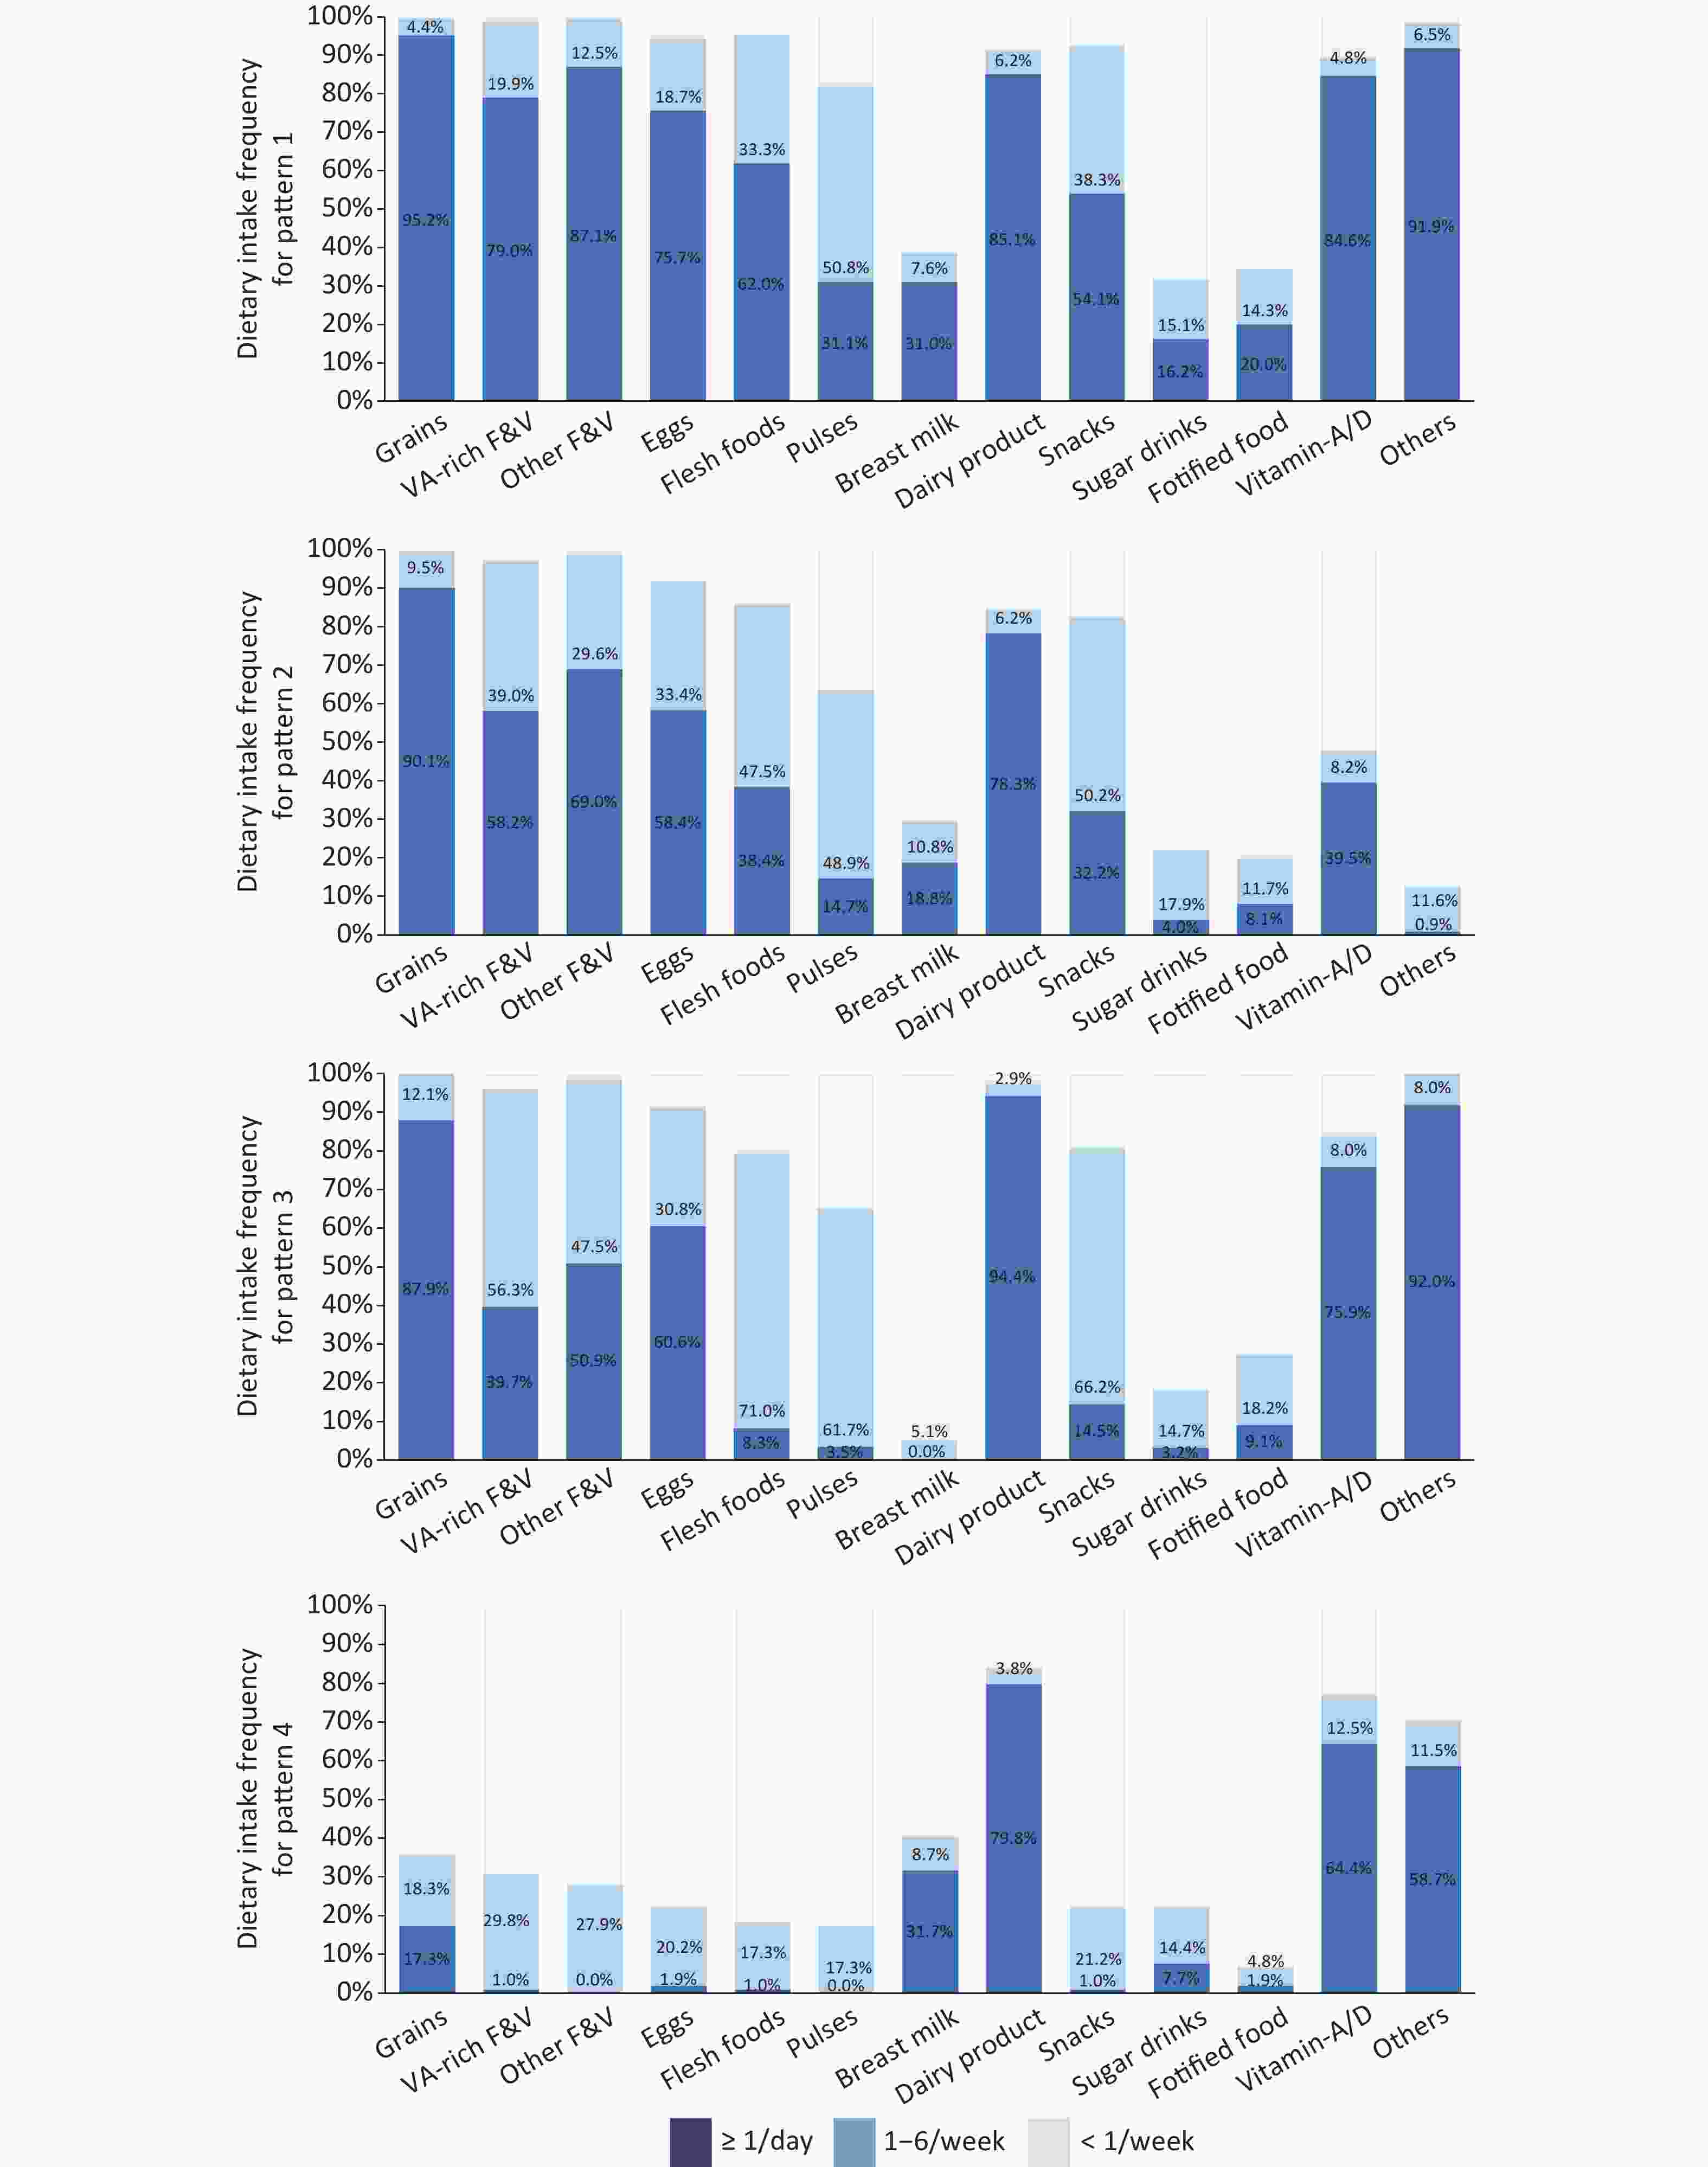
Figure 1. Dietary Intake Frequency by Pattern. Grains: rice, wheat flour, roots, tubers, and corn; VA-rich F&V: vitamin A-rich fruits and vegetables; Other F&V: other fruits and vegetables; Eggs: fresh egg, salted duck egg, and preserved egg; Flesh foods: meat, fish, poultry, organ meats; Beans: beans, peas, lentils, nuts, and seeds; Dairy product: milk, infant formula, yogurt, cheese; Others: iron, zinc, calcium, DHA.
-
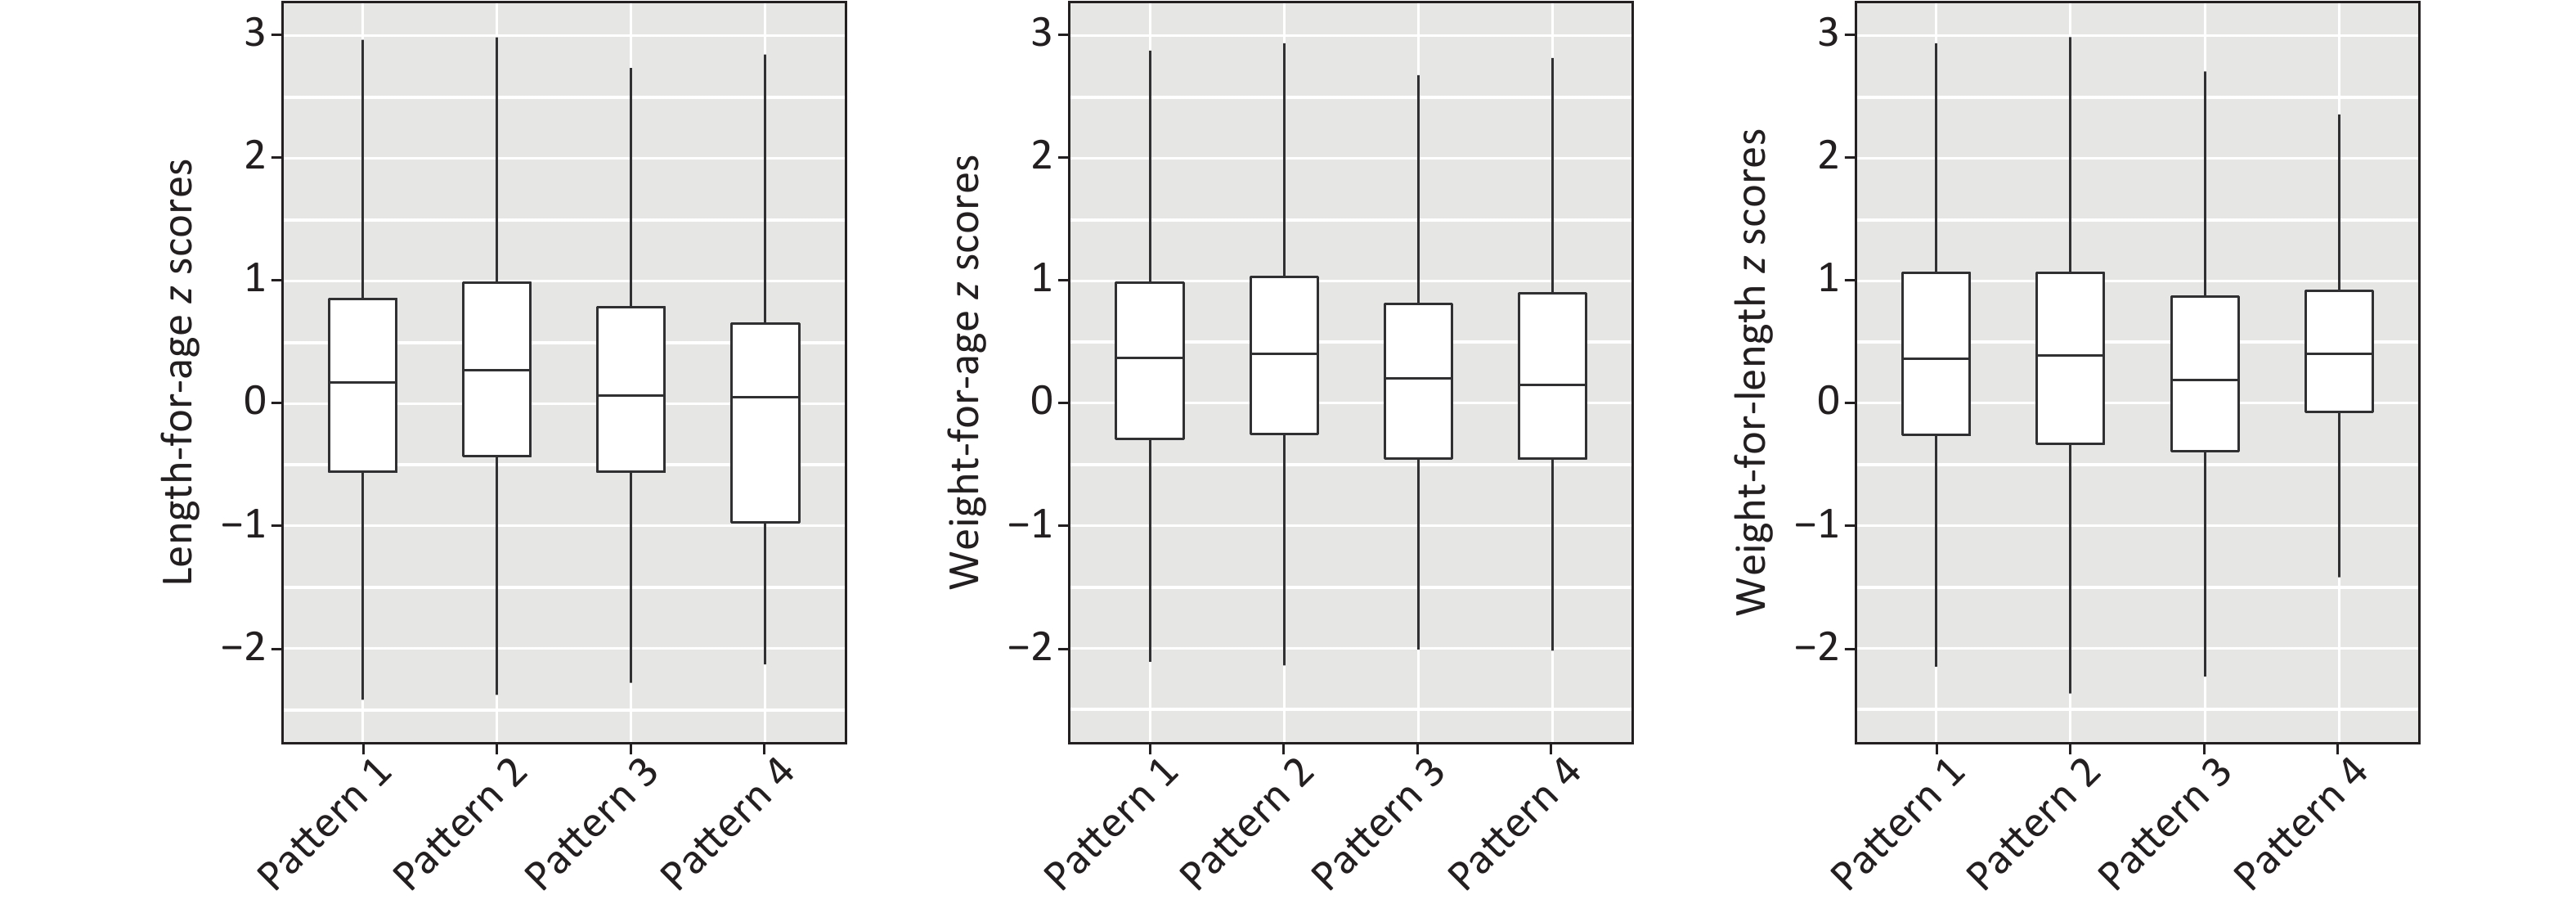
The distributions of LAZ, WAZ, and WLZ by dietary pattern are presented in Figure 2. Average Z scores by dietary pattern are presented in Table 4. It can be seen that Pattern 4 had the lowest average of LAZ and WAZ, with −0.10 ± 1.34 and 0.24 ± 1.00, respectively. LAZ and WAZ for Patterns 1 and 2 were significantly higher than for Patterns 3 and 4. Comparisons of means between patterns are shown in Table 5. There was no significant association between WLZ and patterns of dietary consumption among these children.
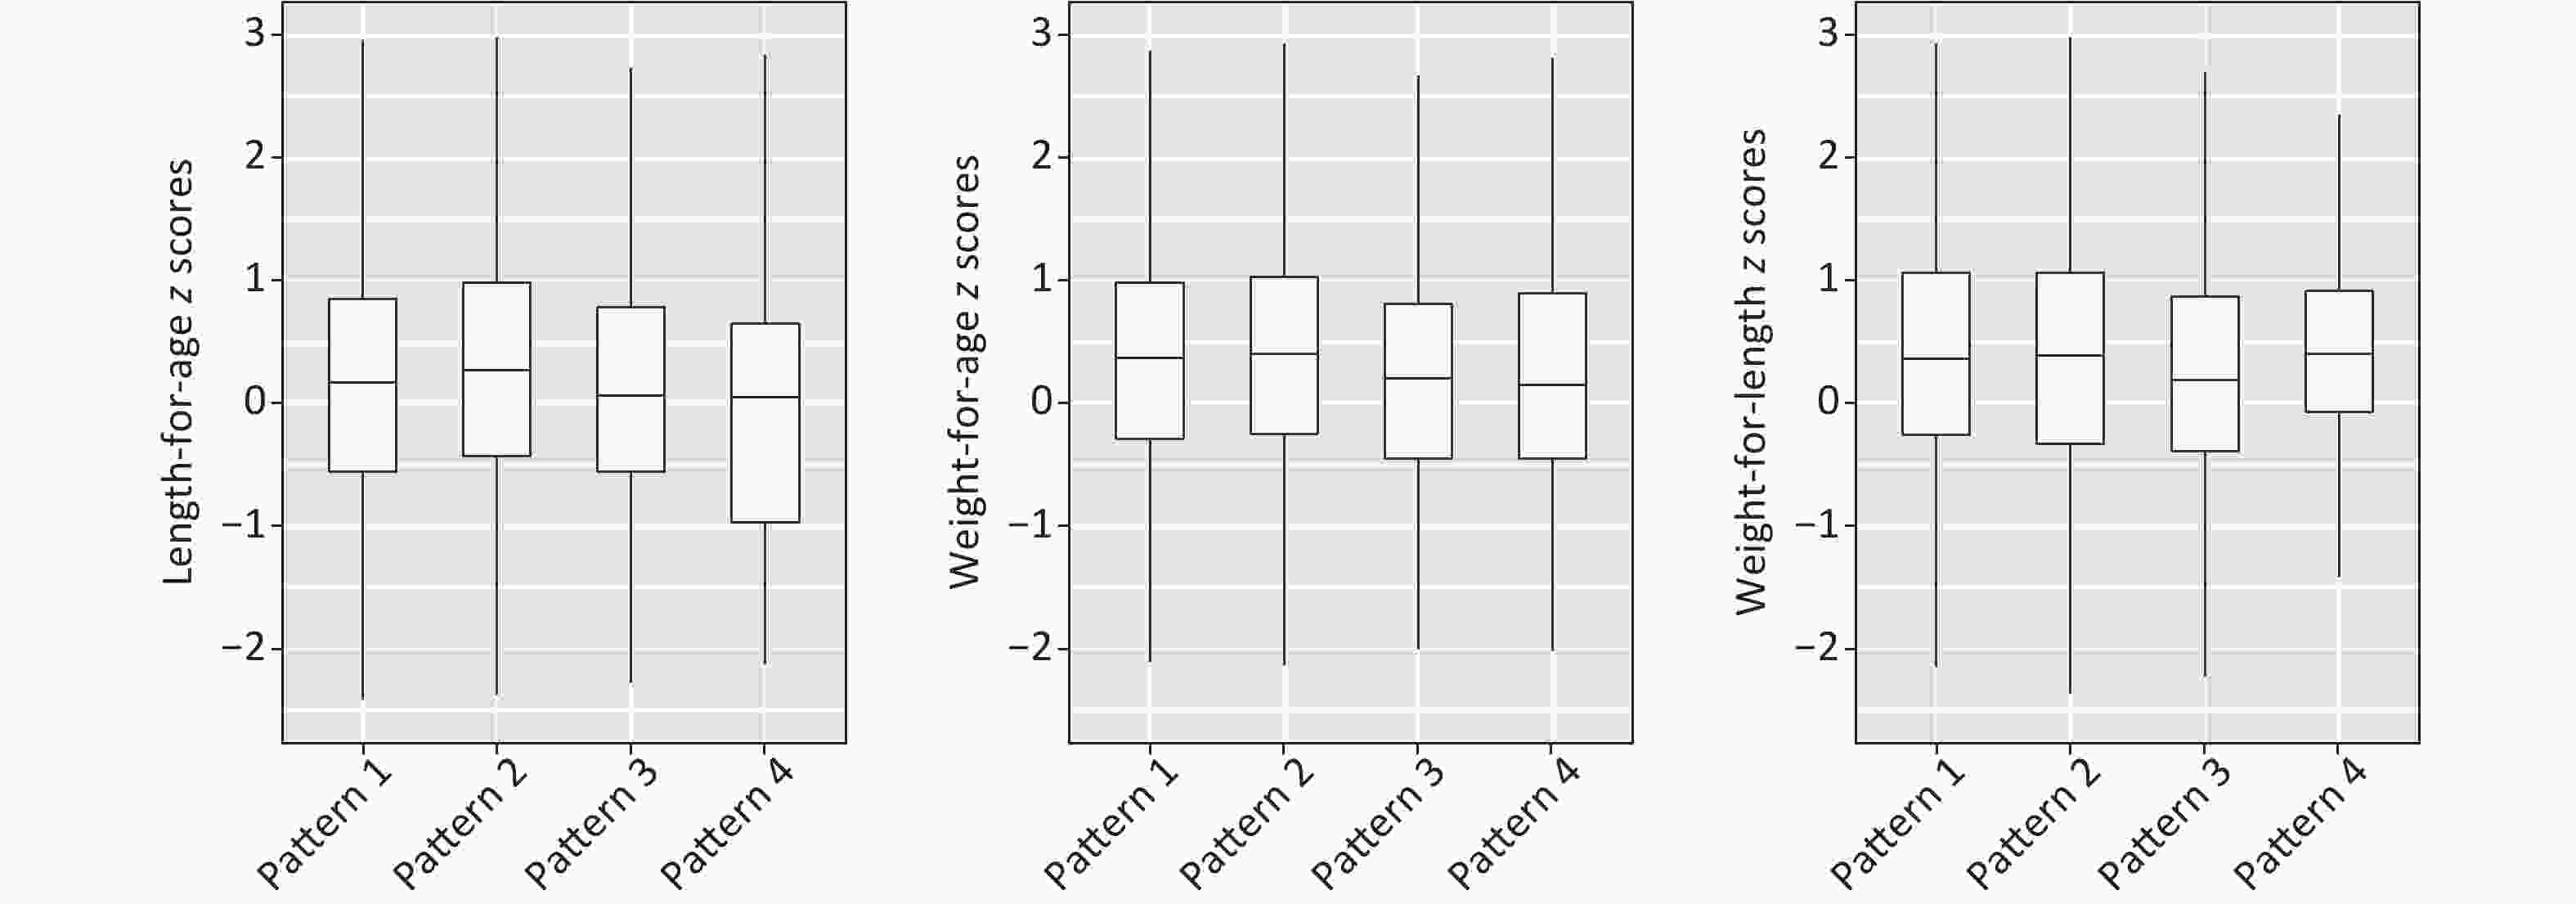
Figure 2. Length-for-age Z scores (LAZ), weight-for-age Z scores (WAZ), and weight-for-length Z scores (WLZ) by dietary pattern.
Item Pattern 1
N = 819Pattern 2
N = 1,153Pattern 3
N = 373Pattern 4
N = 104Total
N = 2,449F value P value Mean SD Mean SD Mean SD Mean SD Mean SD LAZ 0.15 1.21 0.30 1.24 0.02 1.16 -0.10 1.34 0.19 1.23 7.940 < 0.001 WAZ 0.36 1.01 0.45 1.08 0.23 1.00 0.24 1.00 0.38 1.04 5.317 < 0.001 WLZ 0.38 1.01 0.42 1.12 0.30 1.03 0.39 0.88 0.39 1.06 1.169 0.320 Note. LAZ, Length-for-age Z scores; WAZ, weight-for-age Z scores; WLZ, weight-for-length Z scores. Table 4. Average Z scores by dietary pattern
Comparisons of Patterns Difference between means* 95% CI P value LAZ Pattern2–Pattern4 0.41 0.161, 0.652 < 0.001 Pattern2–Pattern3 0.28 0.142, 0.428 < 0.001 Pattern1–Pattern4 0.26 0.008, 0.508 0.043 Pattern2–Pattern1 0.15 0.039, 0.258 0.008 Pattern1–Pattern3 0.13 −0.013, 0.287 0.075 Pattern3–Pattern4 0.12 −0.145, 0.388 0.372 WAZ Pattern2–Pattern3 0.23 0.104, 0.347 < 0.001 Pattern2–Pattern4 0.22 0.006, 0.424 0.044 Pattern1–Pattern3 0.13 0.003, 0.258 0.045 Pattern2–Pattern1 0.10 0.001, 0.188 0.046 Pattern1–Pattern4 0.12 −0.092, 0.333 0.267 Pattern4–Pattern3 0.01 −0.216, 0.237 0.928 WLZ Pattern2–Pattern3 0.12 −0.006, 0.242 0.062 Pattern1–Pattern3 0.08 −0.045, 0.215 0.200 Pattern4–Pattern3 0.09 −0.139, 0.322 0.437 Pattern2–Pattern1 0.03 −0.062, 0.128 0.493 Pattern2–Pattern4 0.03 −0.186, 0.240 0.805 Pattern4–Pattern1 0.01 −0.210, 0.223 0.953 Note. *The values of difference between means are sorted from the highest to the lowest. LAZ, Length-for-age Z scores; WAZ, weight-for-age Z scores; WLZ, weight-for-length Z scores. Table 5. Multiple comparisons by dietary pattern
-
A dietary pattern is defined as individuals’ total consumption of foods and beverages over the course of any given day, week, or year. A dietary pattern represents the totality of what individuals habitually eat and drink, and the parts of the pattern act synergistically to affect health. As a result, the dietary pattern may better predict overall health status and disease risk than individual foods or nutrients [18]. Common research methods of dietary patterns can be roughly divided into two categories, which are investigator-driven methods [19,20] and data-driven methods [12-14]. This research applied the cluster analysis method, which is a data-driven analysis method. The dietary intake patterns were derived from population data through data dimensionality reduction analysis methods. We use the existing data collected from food frequency questionnaires in an exploratory attempt to obtain dietary patterns instead of defined dietary assessment methods, such as dietary scores or dietary indexes, and to discuss the relationship between dietary patterns and the growth of children.
In recent years, China has published similar studies on preschool children. According to the results of statistical analyses, researchers have reported their own distinctive dietary patterns, such as traditional, nutritionally balanced, and Western-style patterns [12]; southern, meat, modern, and vegetarian patterns [13]; animal & fruit, staple patterns [14], etc. The daily diets of children aged 12 to 23 months is transitioning from complementary food to family food, and their mental development is also in a period of gradual increase in self-awareness. At the same time, some children’s diets are restricted by their own taste acceptance and oral function development, so children's eating patterns at this stage are complicated and unstable [21,22]. In this study, the cluster analysis method was used to summarize eight clusters of individual children aged 12 to 23 months. Among the eight clusters, children in C2 and C4 have basically weaned off breast milk but have a high frequency of consumption of dairy products. Children in C1, C5, and C6 have a higher consumption of dairy products. Those in C3 have a higher frequency of breast milk intake, and almost no dairy products are consumed. Children in C7 have the highest breast milk consumption among the eight dietary patterns. The frequency of sugar beverage consumption among the children in this study was very low, with 75.5% of the children not drinking or rarely drinking them.
According to the characteristics of the eight clusters, we merged categories with similar staple food characteristics. The dietary patterns of children aged 12–24 months are classified into four types. The results of this study show that the diet of children aged 12 to 23 months is dominated by grains, with a high proportion of daily consumption for Patterns 1, 2, and 3. The frequency of consumption of vegetables, fruits, and eggs is slightly lower than that of grains, but they are also the main daily diet. The frequency of flesh foods consumption is lower, with 40.1% of children consuming it an average of one time or more per day. Among the WHO-recommended eight foods, the intake of pulses is the lowest. The results of this study are similar to the results of previous national surveys in China [23]. The NSPGDC, conducted in 2015, found that the earliest introduced complementary food for Chinese children was grains, the earliest protein food introduced was eggs, and that meat was introduced later. Pulses were introduced the latest, and the frequency of their consumption is low until the age of two years [24]. Among the four types of dietary patterns, Pattern 4 is significantly different from the others. Children with this type of dietary pattern accounted for 4.2% of the total study sample. The diet structure is extremely unbalanced, and the staple food of these children is milk. In addition to the intake of some grains and sugar beverages, the intake frequency of vegetables, fruits, flesh foods, and eggs is extremely low. Children of Pattern 4 also have a higher frequency of intake of nutrient supplements, with 64.4% and 58.7% taking vitamin A/D, and other supplements daily, respectively.
From the comparison of Z scores, it can be seen that LAZ and WAZ of Pattern 4 have the lowest average scores among the four dietary patterns. This type of diet is a common feeding problem in children's health clinics, and its occurrence can be caused by many factors, such as unhealthy feeding methods of the caregiver, oral dysfunction of the child, or food neophobia in the process of psychological and emotional development [25,26]. The improvement of this feeding problem requires the intervention of a combination of physical, psychological, and social factors [27]. The average scores of LAZ for Pattern 3 are lower than for Pattern 2. The average scores of WAZ for Pattern 3 are lower than for Patterns 1 and 2. Children with Pattern 3 have almost been weaned from breast milk. Their intake of grains and dairy products is high, and the intake of nutrient supplements is high as well. Compared with Patterns 1 and 2, the intake frequency of vegetables, fruits, and eggs for Pattern 3 is slightly lower, but the intake frequency of flesh foods is particularly low. The dietary guidelines for Chinese residents and the feeding guidelines of the American Academy of Pediatrics recommend that children's complementary food introduction start with grains and meats because iron and zinc are the micronutrients that become limiting for primarily breastfed infants, and they are also the most likely to be low in the diets of older infants. To provide these nutrients, iron-and zinc-fortified infant cereals and meats are excellent first foods and are equally well accepted by infants [9,28]. Early consumption of meat, liver, and fish is related to later childhood growth and good cognitive development [29]. Some studies have also confirmed that the introduction of meat-complementary foods has a greater beneficial effect on children's length or hemoglobin level than low-protein complementary foods [30,31].
Previous similar studies on dietary patterns have rarely included nutrient supplements. However, according to the 2015 NSPGDC [24], the daily intake of nutrient supplements is very common among children aged 12 to 23 months. Therefore, this research included iron-fortified foods, vitamin A and D supplements, as well as iron, calcium, zinc, and DHA into the cluster analysis model, hoping to comprehensively describe the daily intake of nutrient supplements of children aged 12 to 23 months. The results of the study showed that, except for Pattern 2, the other three types of patterns all have a very high frequency of nutrient supplement intake.
This study has several limitations. First, it is a cross-sectional design, and the significant relationships reported in this study can only be interpreted as correlational relationships, not as causal relationships. Second, this study uses frequency data to analyze daily intake, and the lack of intake quantity limits the analysis of associations of dietary patterns with growth. Third, the sample size of children in Pattern 4 is too small to conduct a more in-depth analysis of this special diet pattern.
-
In conclusion, this study uses a cluster analysis to categorize the dietary patterns of individual children aged 12 to 23 months, describes the characteristics of each dietary pattern, and analyzes the relationships between dietary patterns and growth. Although China is undergoing rapid urbanization and economic development, there is still a phenomenon of insufficient intake of protein-rich foods during the period when complementary food is introduced. At the same time, there are still dairy-based dietary patterns for children over one year old. In-depth investigations can be conducted on this age group, and comprehensive interventions into their dietary structures, oral functions, and the feeding behaviors of caregivers will be beneficial to the further improvement of the nutritional status of children in China.
-
All authors were involved in the conceptualization of the review and revision of the manuscript. WANG Shuo contributed to the conceptualization and design of the study, as well as the analysis and interpretation of data and the drafting of the manuscript. Project administration: XU Tao, ZHAO Wen Hua, MA Zhong Hua, and MEI Yue. Methodology, investigation, and supervision: XU Tao, TANG Xue Jun, PANG Xue Hong, ZHANG Qian, LI Rui Li, and WANG Yu Ying. Review and editing: XU Tao. All authors have read and approved the final manuscript.
-
The authors declare no conflicts of interest.
Funds:
This research was funded by National Special Program for Science & Technology Basic Resources Investigation of China [Grant Number: 2017FY101100 and 2017FY101104]

 Quick Links
 DownLoad: