


-
Cognitive impairment is the preclinical stage of dementia[1]. The World Alzheimer Report estimated that 50 million people had dementia globally in 2018; that number is likely to rise to 152 million by 2050[2]. Cognitive impairment is characterized by decreased cognitive ability in one or more cognitive areas, such as directivity, memory, attention, recall and language[1]. Cognitive impairment affects the ability of older adults to look after themselves, and associated with increased disability and deaths[3]. Common risk factors for cognitive impairment include sedentary lifestyle, anabolic hormone deficiency, continuous inflammatory reactions, and malnutrition[4]. Therefore, wide attention has been given to the effects of motor function index, including sarcopenia, and nutrition index, including calf circumference on cognitive impairment.
Sarcopenia is a progressive and generalized skeletal muscle disorder that involves loss of muscle mass and function[5], which can result in more frequent falls, physical disability, dysfunction, and a greater risk of death in older adults[5-8]. The prevalence of sarcopenia ranges from 8%–40% in older adults ≥ 60 years, which progressively increases as people age[6,9]. In the past few years, the association of sarcopenia with cognitive impairment has been debated due to some common risk factors, such as sedentary lifestyle, malnutrition, and inflammatory processes[10,11]. Previous studies have shown that skeletal muscle mass is associated with cognitive function in a large number of healthy older adults[12]. In addition, it has been reported that skeletal muscle secretes neurotrophic factors, which affect brain function and motor units. Therefore, sarcopenia might be a potential risk factor for cognitive impairment.
Handgrip strength and calf circumference are widely regarded as related indices of sarcopenia. Several studies hypothesized that earlier handgrip strength impairment might be associated with further cognitive decline[13]. Among the anthropometric parameters, calf circumference has proven to be an effective alternative to dual-energy X-ray absorptiometry (DXA) for measurement of skeletal muscle mass[14,15]. Therefore, handgrip strength and calf circumference might also be potential risk factors of cognitive impairment.
Several studies have explored the potential association of sarcopenia with cognitive impairment, however results were inconsistent. Some previous studies showed a positive association of sarcopenia with cognitive impairment[12,16-20], whereas others did not identify a significant association[21,22]. Moreover, some have reported that a decrease of handgrip strength seems to be related to cognitive impairment[23,24]. A cross-sectional observational study reported that calf circumference is negatively associated with cognitive impairment in centenarians from Hainan, China[3]. Few studies on the associations of sarcopenia, handgrip strength and calf circumference with cognitive impairment have been conducted in China. Most available research has been confined to specific regions and populations with small sample sizes and without in depth study of the most vulnerable group, the older adults in the community. In addition, we do not know whether the associations of handgrip strength and/or calf circumference with cognitive impairment are linear or non-linear. Finally, the modifiers that might influence these associations have not been fully explored.
In view of the uncertainty, we used data from the Healthy Aging and Biomarkers Cohort Study (HABCS) in 9 longevity areas in China to investigate the associations of sarcopenia, handgrip strength and calf circumference with cognitive impairment, and to explore modifiable factors that might affect the associations.
-
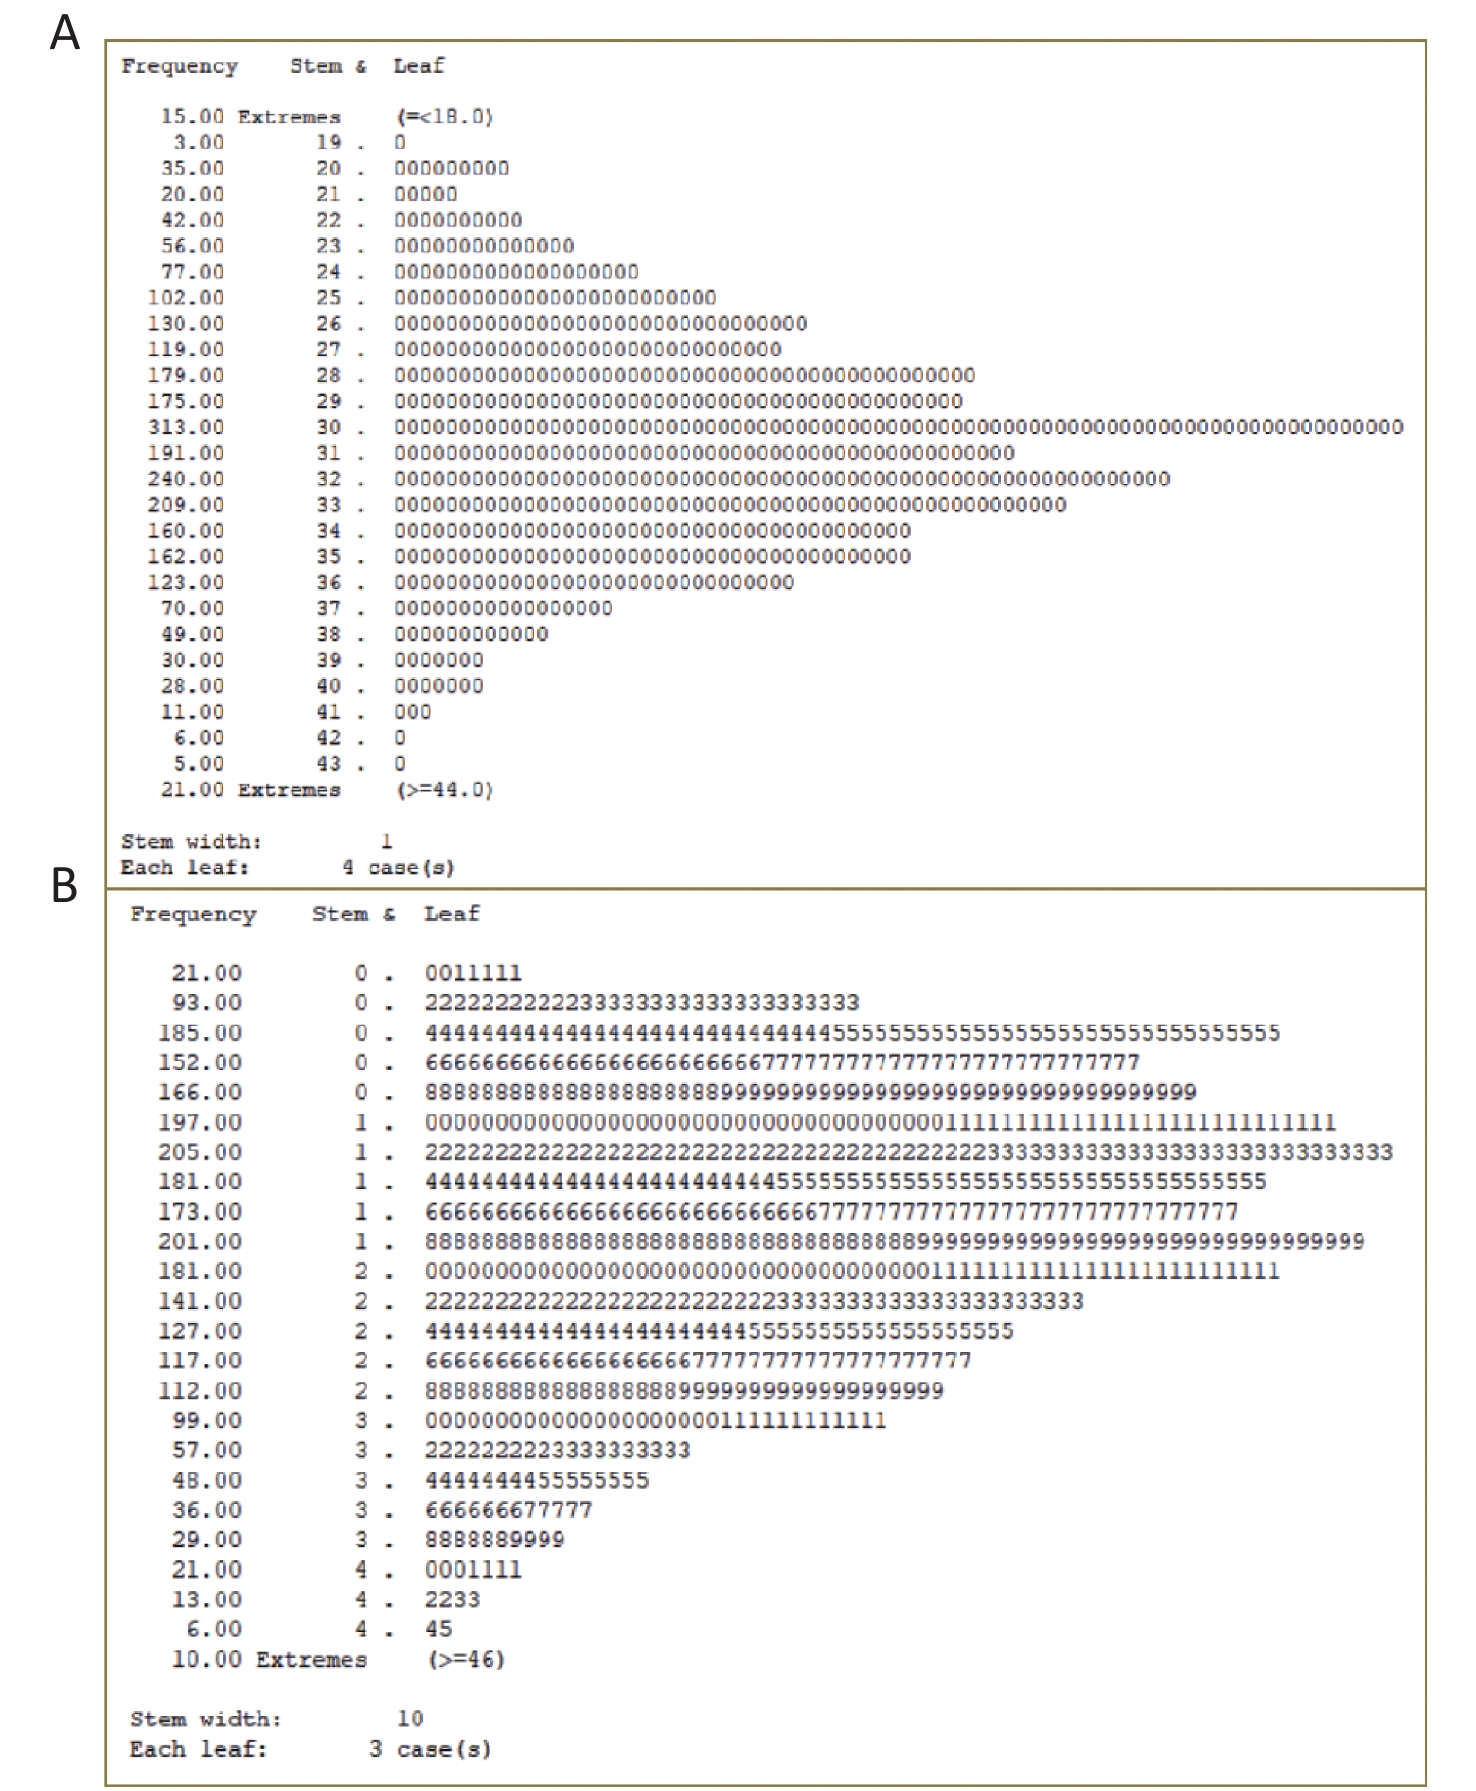
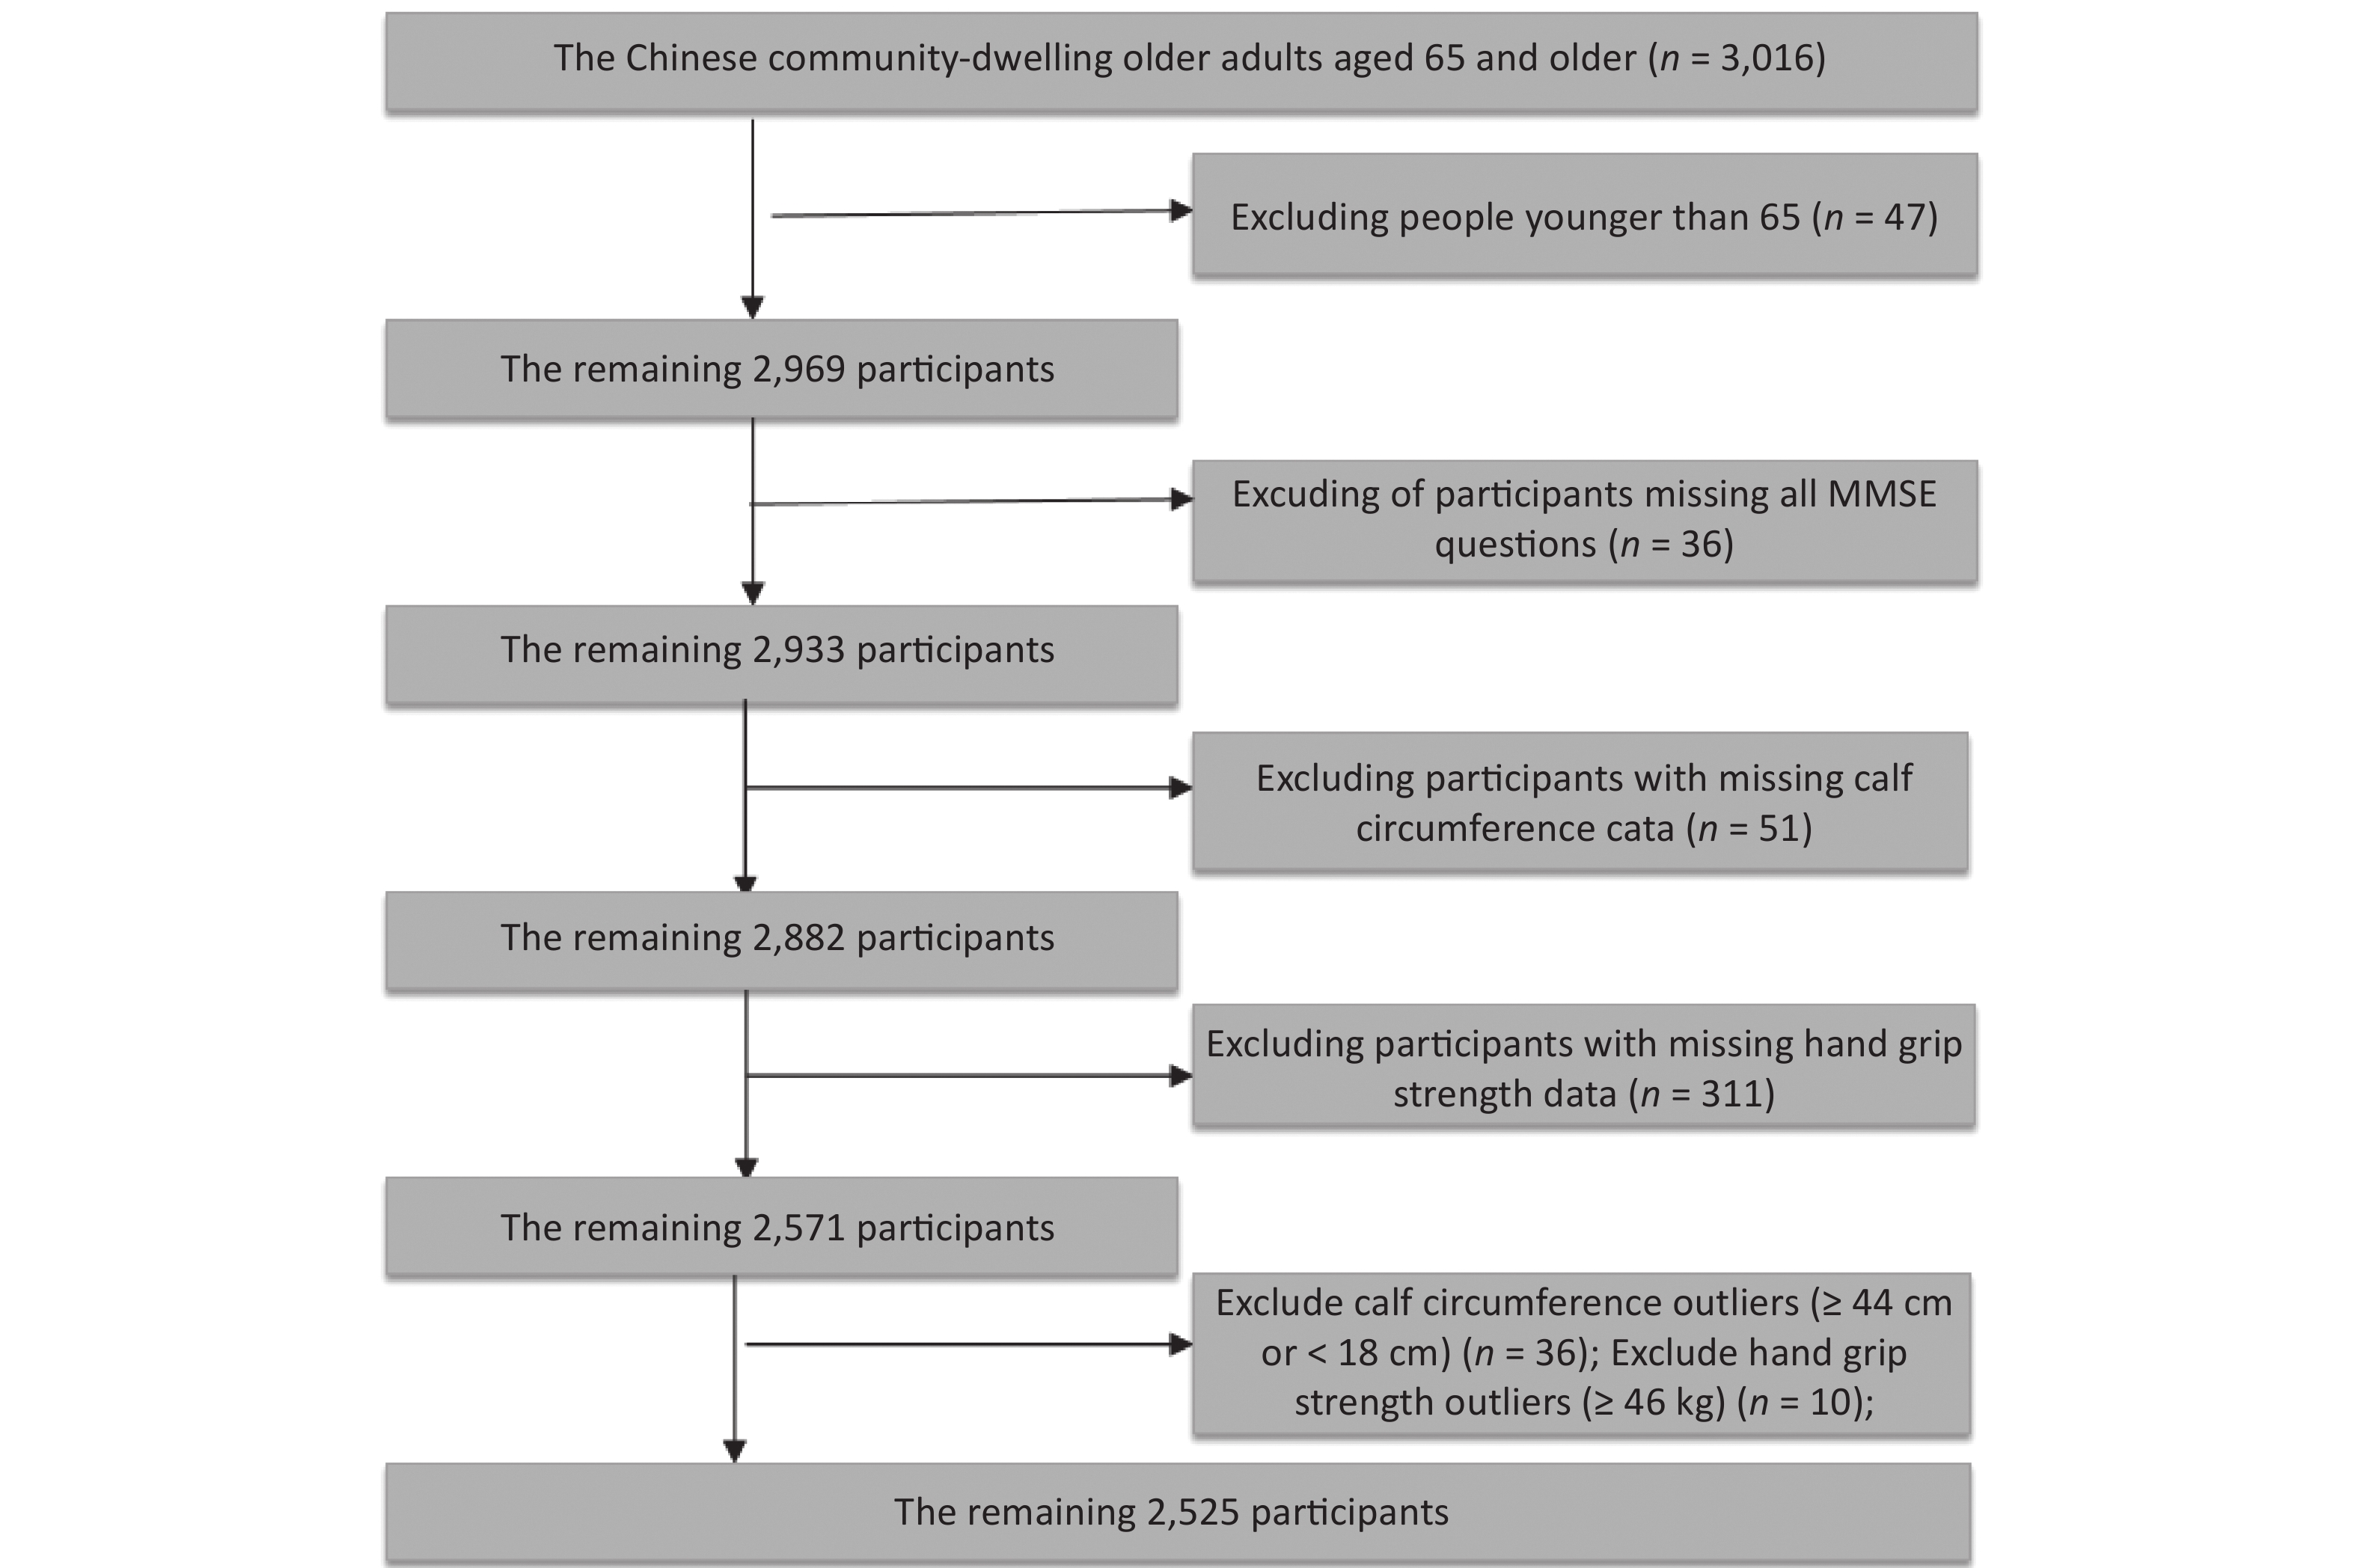
Older adults were enrolled in the HABCS conducted in 2017–2018. We excluded 47 participants younger than 65 years, 36 participants with missing Mini-Mental State Examination (MMSE) scores, 51 participants with missing calf circumference data, and 311 participants with missing handgrip strength data. Based on U±2.58σ (Supplementary Figure S1 available in www.besjournal.com), outlier data for handgrip strength (≥ 46 kg, 36 participants) and outlier data for calf circumference (≤ 18 cm or ≥ 44 cm, 10 participants) were also excluded. The final study sample included 2,525 older adults (Figure 1). This study obtained informed consent of all participants or their relatives and was approved by the Biomedical Ethics Committee of Peking University, Beijing, China (IRB00001052-13074).
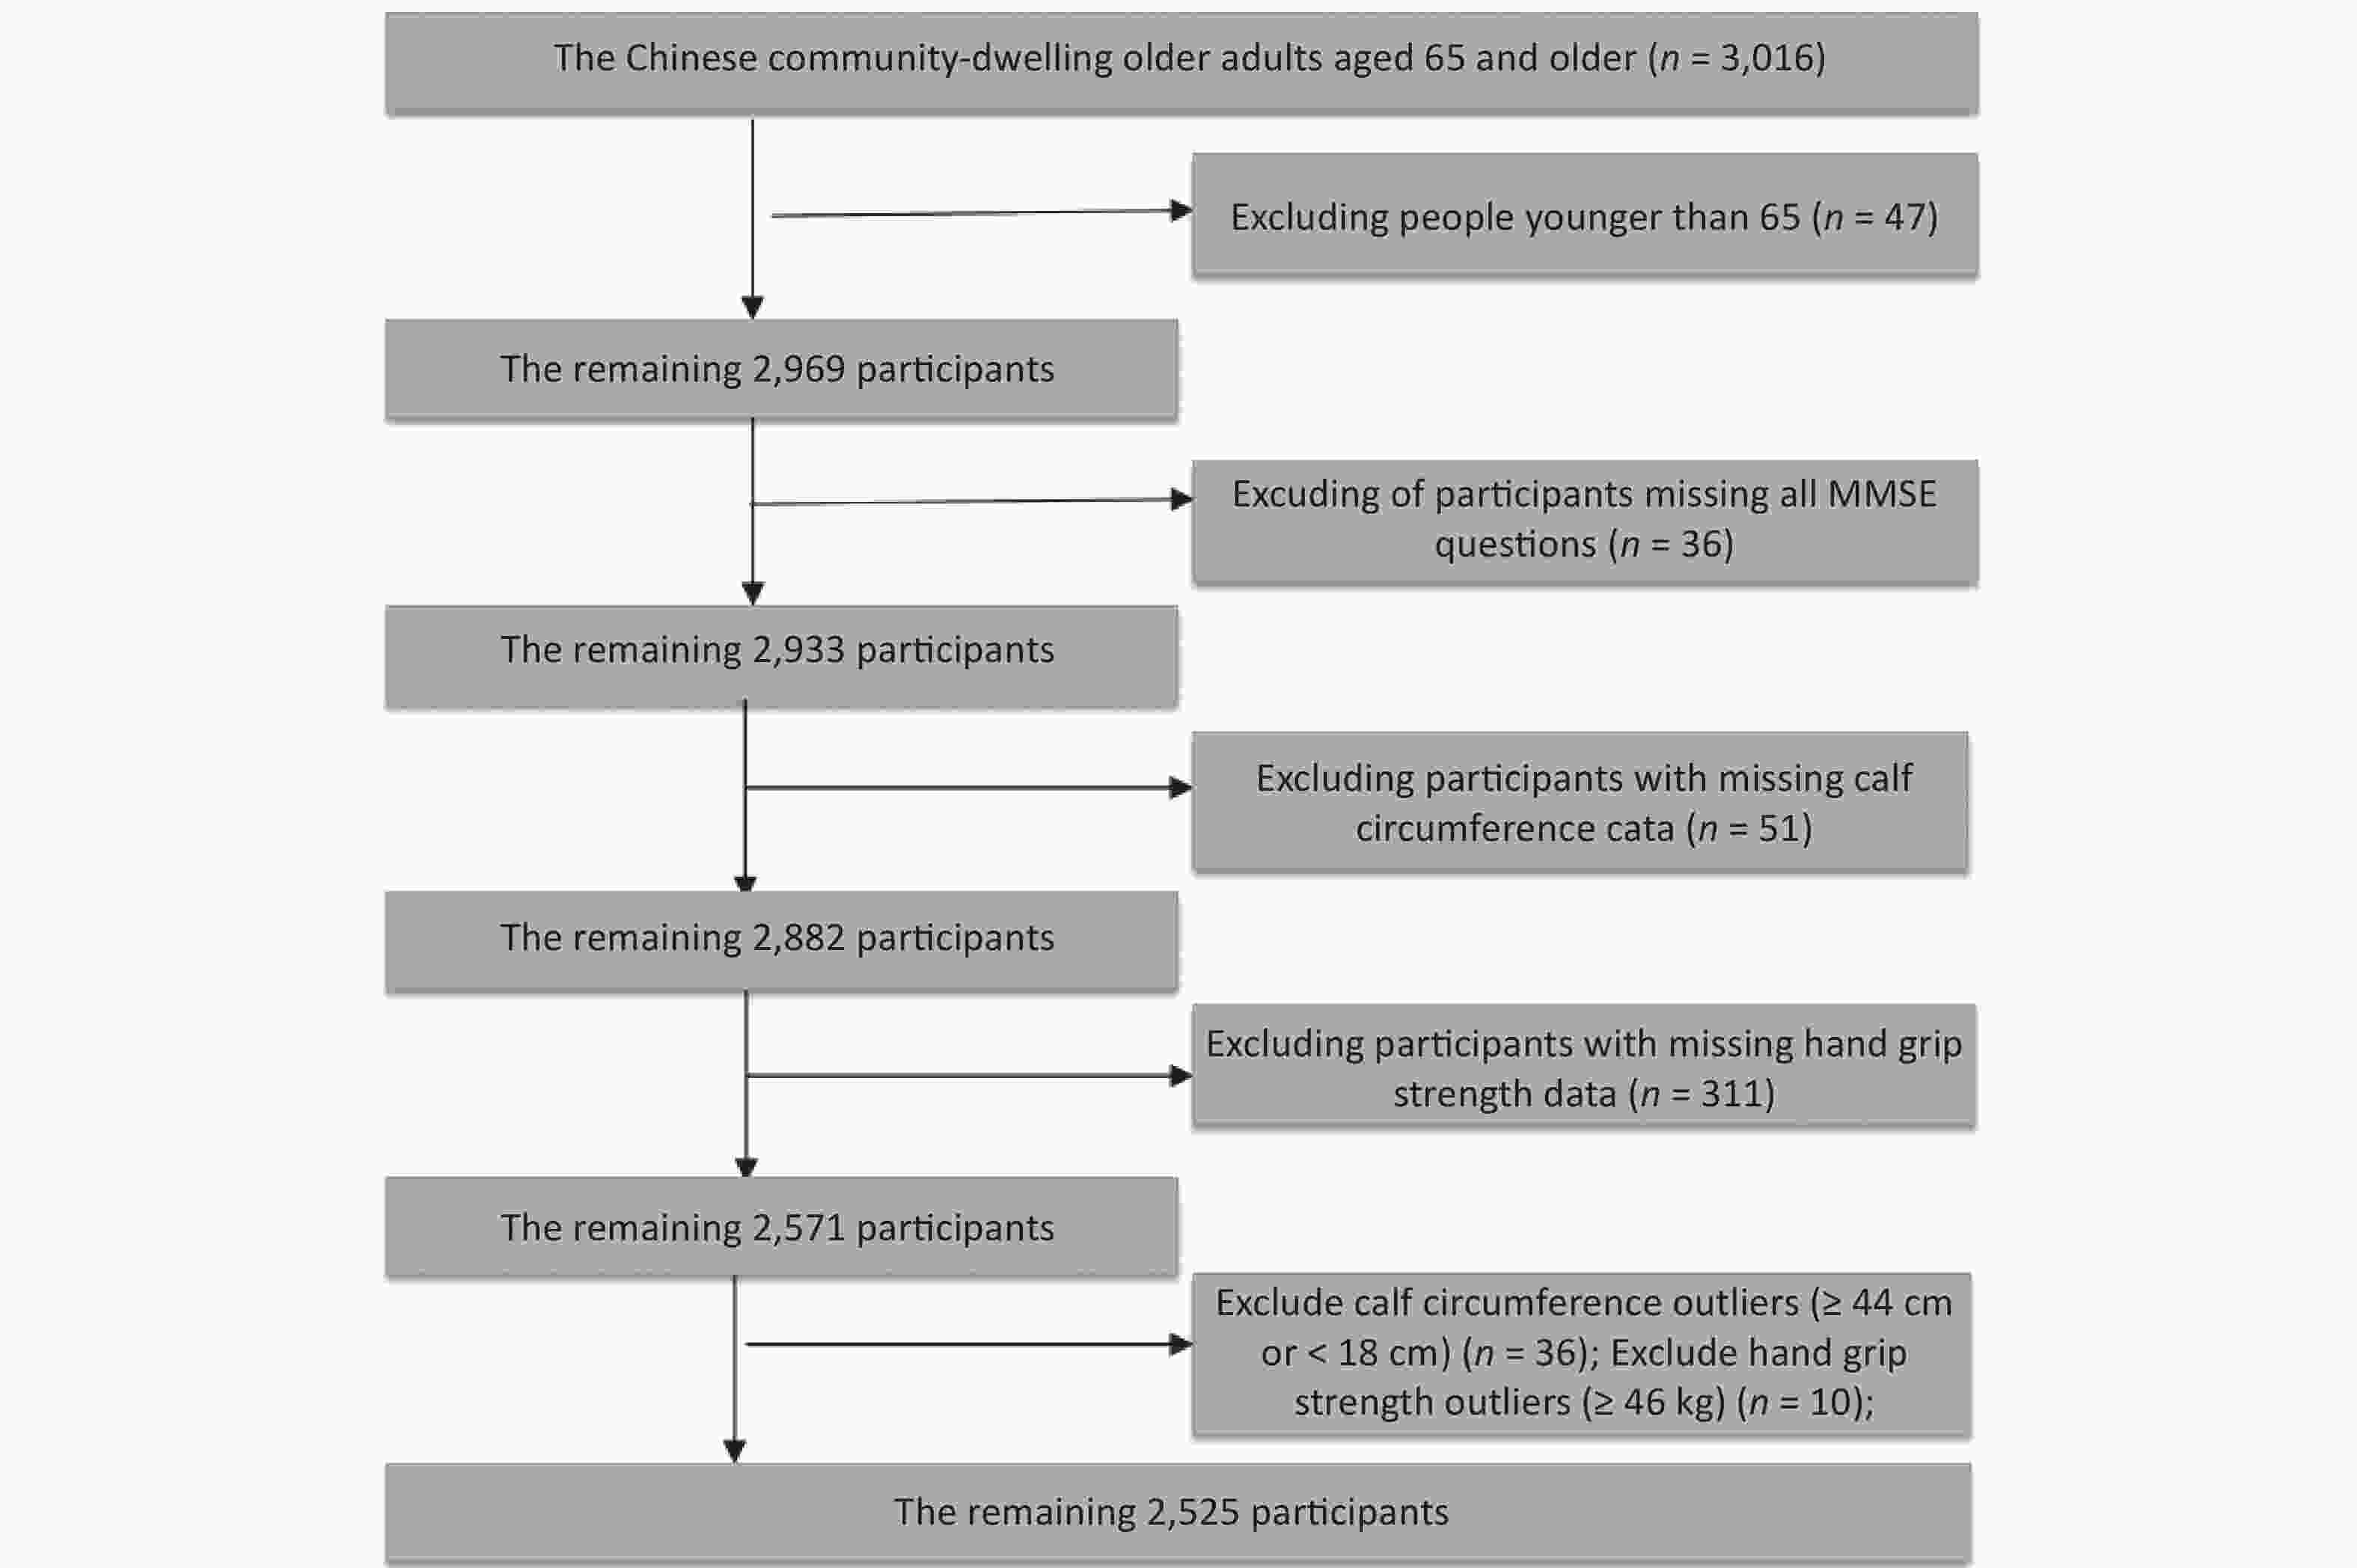
Figure 1. Flowchart of participant enrollment.
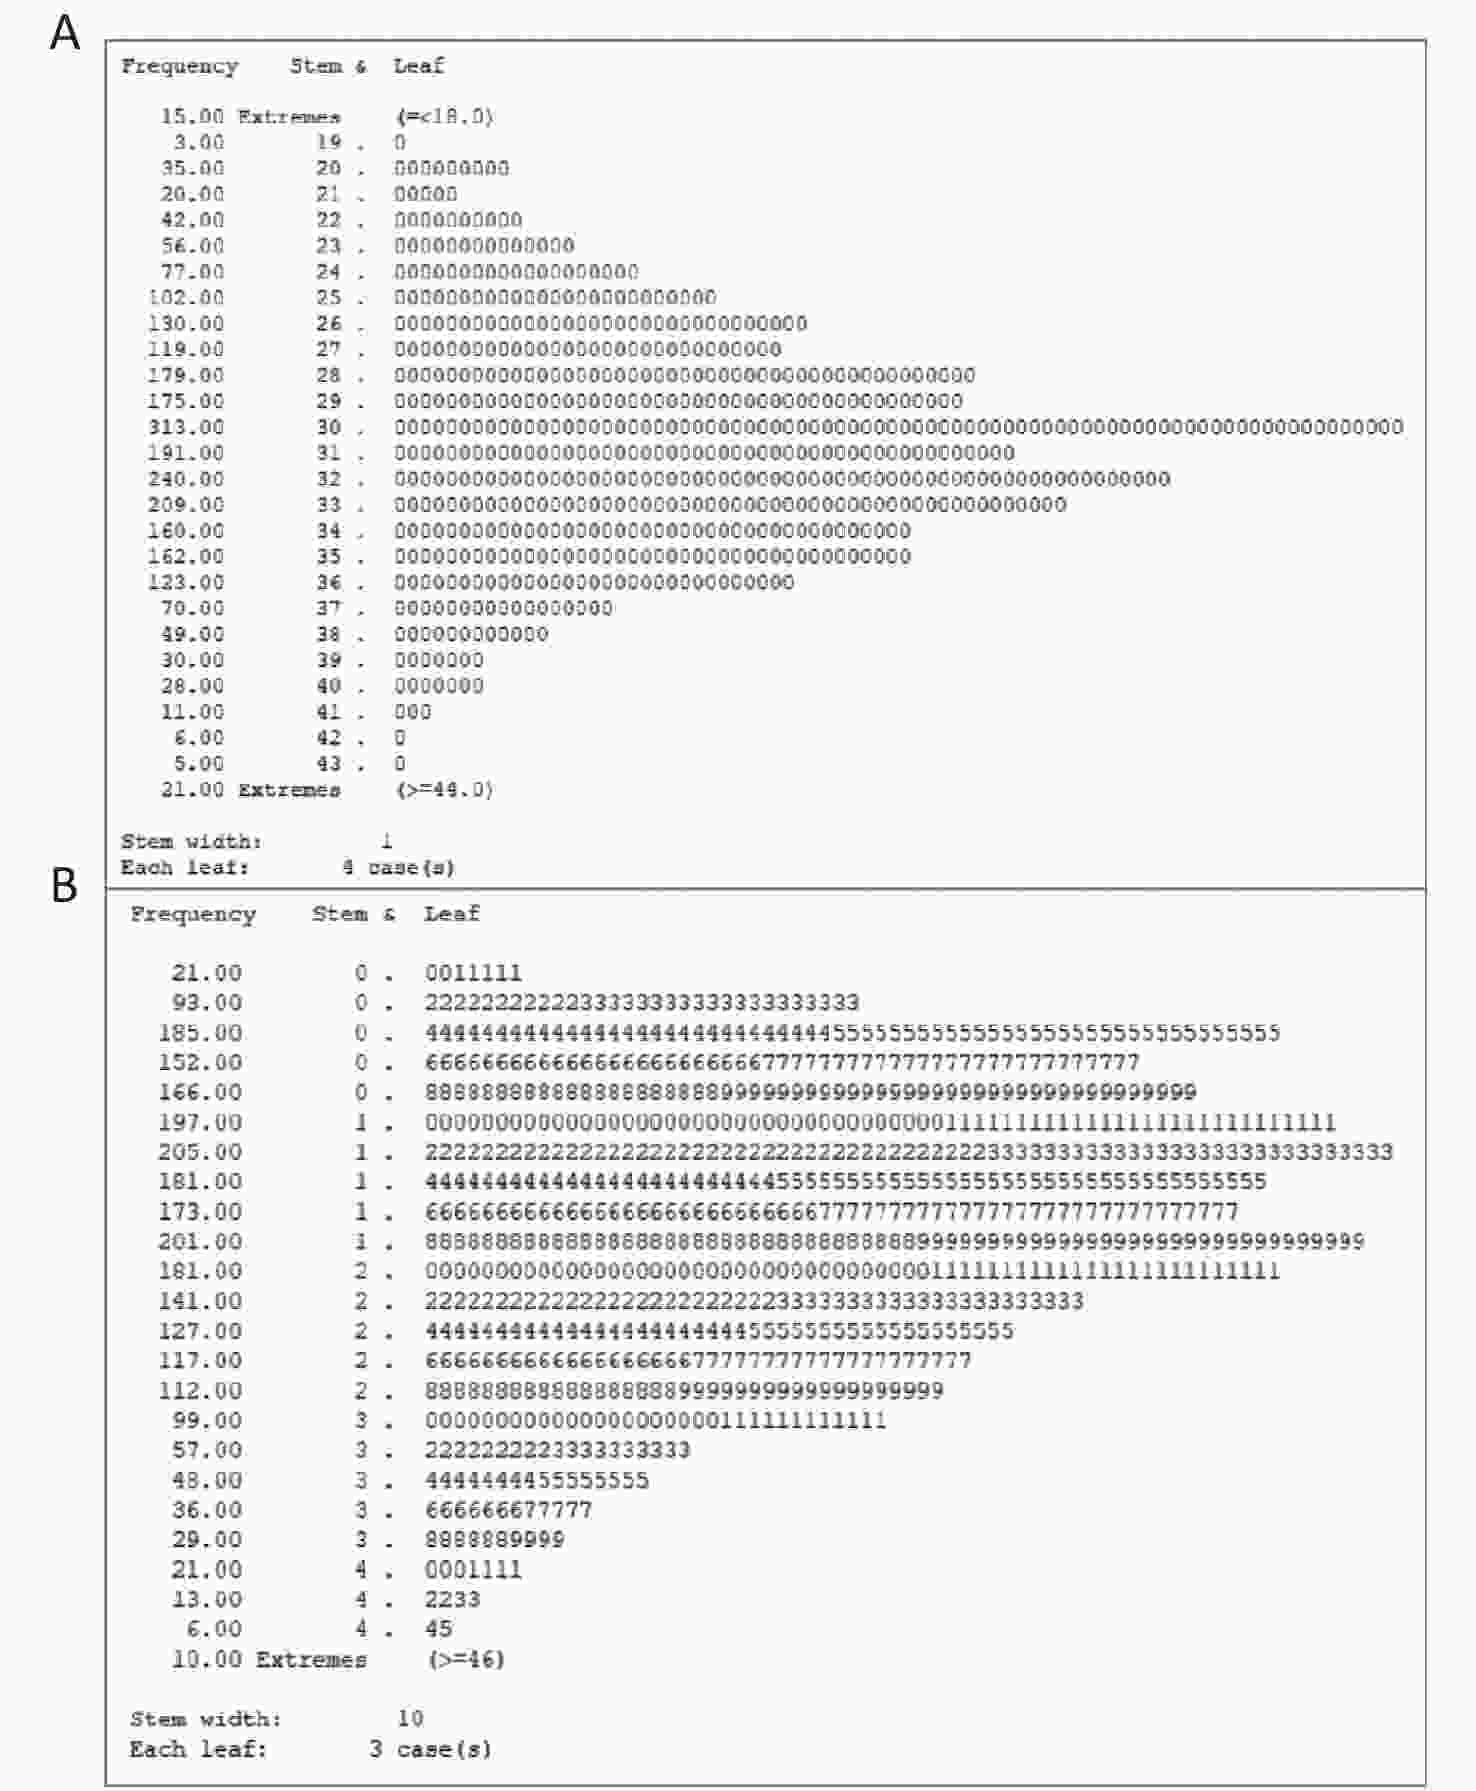
Figure S1. The stem-and-leaf display of calf circumference and grip strength.
-
The Mini-Mental State Examination (MMSE) questionnaire, which was translated into Chinese based on the internationally standard MMSE questionnaire, was used to assess cognitive impairment. There were 5 aspects of the MMSE questionnaire, including orientation, registration, attention and calculation, recall, and language[25]. Supplementary Table S1 (available in www.besjournal.com) shows the specific questions of the 5 components and their point values. For example, “Orientation” contains the questions, “What is the (year) (season) (date) (day) (month)?” and “Where are we: (state) (county) (town) (hospital) (floor)?”. The total score is between 0 and 30; the higher the score, the greater the cognitive function. When the score was less than 24 (score: 0–23), participants were considered to have cognitive impairment[26,27]. The informed consent statement suggested relatives could provide consent, so proxy respondents were available to participate.
Components Question Score Orientation What is the (year) (season) (date) (day) (month)? 5 Where are we: (state) (county) (town) (hospital) (floor)? 5 Registration Name 3 objects ("table", "apple", "clothes" ): 1 second to say each. Then ask the patient all 3 after you have said them. Give 1 point for each correct answer. Then repeat them until he learns all 3. Count trials and record. 3 Attention and Calculation Serial 7’s. 1 point for each correct. Stop after 5 answers.
$20-$3=?
$20-$3-$3=?
$20-$3-$3-$3=?
$20-$3-$3-$3-$3=?
$20-$3-$3-$3-$3-$3=?5 Recall Ask for the 3 objects repeated above. Give 1 point for each correct. 3 Language Name a pencil, and watch (2 points) 9 Repeat the following “As a man sows, so he shall reap” (1 point) Follow a 3-stage command: “Take a paper in your right hand, fold it in half, and put it on the floor” (3 points) Read and obey the following:
CLOSE YOUR EYES (1 point)
Write a sentence (1 point)
Copy design (1 point)Table S1. Components of the mini-mental state examination (MMSE)
-
The formula for determining sarcopenia contains three indicators: age, handgrip strength, and calf circumference, which was created by Ishii et al.[28]. A Jamar J00105 hydraulic hand dynamometer was used to measure handgrip strength in a sitting position. The elbow was placed against the side of the body and bent to a 90 angle with the forearm holding the dynamometer’s armrest. Handgrip strength was assessed using the mean of the right hand and left hand values, expressed as kg[29,30]. The participants' calf circumference was measured in a supine or sitting position. The calf was at right angles to the thigh, and the measurement was made at the maximum circumference of the non-dominant leg[31, 32]. The formulas for determining sarcopenia were different depending on gender. Table 1 for the specific formula[28].
Gender Formula Female 0.80 × (age − 64) −5.09 × (grip strength − 34) − 3.28 × (calf circumference − 42) Male 0.62 × (age − 64) − 3.09 × (grip strength − 50) − 4.64 × (calf circumference − 42) Table 1. The formula for determining sarcopenia
-
The covariates included in our models were collected using a structured HABCS questionnaire and were as follows: 1) Sociodemographic characteristics, including age, gender, nationality, marital status, and educational attainment. 2) Lifestyle behaviors, including smoking, drinking, and physical activity. 3) Health characteristics, including body mass index (BMI), hypertension, diabetes, self-reported heart disease, and self-reported respiratory diseases.
Age and educational attainment were modeled as continuous variables (in years). Gender was defined as male or female. Nationality was determined as Han Chinese or a minority. Regular exercise was classified as “yes” or “no”, based on the answer to the following question, “Do you often participate in physical activities, including walking, playing ball, running, and Qigong?”. Smoking and drinking were also classified as “yes” or “no”[27]. BMI was divided into 4 categories according to the guidelines for Chinese individuals: underweight (BMI < 18.5 kg/m2), normal weight (BMI 18.5 to < 24.0 kg/m2), overweight (BMI 24.0 to < 28.0 kg/m2), and obese (BMI higher than or equal to 28.0 kg/m2)[33]. The interviewer took blood pressure twice for older adults, at least two minutes apart. Hypertension was defined as diastolic blood pressure ≥ 90 mmHg or systolic blood pressure ≥ 140 mmHg, or self-reported hypertension[34]. Blood specimens were obtained after at least an 8-h fasting period. Venous blood samples were centrifuged at 4 °C, and serum was separated directly and stored at −80 °C until clinical biochemistry analysis. Diabetes was defined as fasting blood glucose ≥ 7.0 mmol/L or self-reported diabetes[35]. Heart disease was defined as self-reported heart disease (yes, no). Respiratory disease was defined as self-reported bronchitis, emphysema, asthma or pneumonia (yes, no).
-
Categorical variables were presented as numbers and percentages. Chi-square tests were used to compare differences in baseline sociodemographic characteristics, lifestyle behaviors, and health characteristics between the sarcopenic and non-sarcopenic groups. Before conducting the analysis, we tested the normality of the continuous variables. Data with normal distributions were presented as means and standard deviations. T-tests or analysis of variance for parametric continuous variables were performed to compare differences between the sarcopenic and non-sarcopenic groups. Data not normally distributed were presented as median [Inter Quartile Range (IQR)], and Kruskal-Wallis for non-parametric continuous variables was used to compare differences between groups. Multiple logistic regression models were used to assess the associations of sarcopenia, handgrip strength, handgrip strength quartile, calf circumference and calf circumference quartile with cognitive impairment. Odds ratios (ORs) with 95% confidence intervals (CIs) were calculated from the logistic regression models to represent the effect estimations. We also estimated the associations of sarcopenia, handgrip strength, handgrip strength quartile, calf circumference and calf circumference quartile with MMSE score by multiple linear regression. To evaluate the dose-response associations of handgrip strength and calf circumference with cognitive impairment, we used the restricted cubic spline (RCS) function with three knots located at the 5th, 50th, and 95th percentiles of handgrip strength and calf circumference. The effects were represented by the OR and 95% CIs for cognitive impairment, where the reference value for calf circumference was 19 cm and where the reference value for handgrip strength was 0 kg.
We performed a stratified analysis to estimate potentially modifiable effects by age (< 80 vs. ≥ 80 years), gender (male vs. female), regular exercise (yes vs. no), smoking (yes vs. no), drinking (yes vs. no), BMI (≥ 24 vs. < 24), diabetes (yes vs. no), hypertension (yes vs. no). We assessed potential modifiable effects by modeling the cross-product term of the stratifying variable with sarcopenia. In order to test the robustness of the results, we performed some sensitivity analyses. First, to minimize the influence of reverse causation, we conducted a sensitivity analysis by excluding participants with major chronic diseases (hypertension, diabetes, heart disease, and respiratory diseases). Second, we used the maximum grip strength value of the dominant hand to explore the association of grip strength with cognitive impairment. Moreover, we did not exclude the outliers of grip strength and calf circumference. In addition, the frequencies of vegetable, egg, meat, and fish consumption (almost every day, at least once a week, at least once a month, sometimes, or rarely) were added to model 2. Finally, dyslipidemia was added to model 3.
All statistical analyses were performed using SAS version 9.4 (SAS Institute, Inc., Cary, NC, USA). We used the ggBaseline2 macro program to determine the basic characteristic differences. In this process, two programs, PROC MEANS and PROC FREQ were applied. In the multiple logistic regression analysis, the PROC LOGISTIC procedure was used. The PROC REG procedure was used in multiple linear regression analysis. Additionally, the %RCS_REG macro program was used to draw RCS curves. P values less than 0.05 of a two-sided test were considered statistically significant for all analyses.
-
Table 2 shows the participants’ characteristics. Age, educational attainment, handgrip strength and calf circumference were skewed, and therefore we used the Mann-Whitney U nonparametric test for these data. The mean age was 84.5 years among the 2,525 participants, with median (IQR) age of 84 (75–93) years. The median (IQR) handgrip strength was 16.8 (10.0–24.0) kg. The median (IQR) calf circumference was 31 (28–34) cm. And 47.8% were women, 17.2% were smokers, and 17.6% were alcohol drinkers. The prevalence of cognitive impairment was 34.6% among all participants, 40.0% among participants with sarcopenia, and 12.2% among participants without sarcopenia. Hypertension was the most prevalent chronic diseases (70.1%). Compared with the non-sarcopenic group, participants in the sarcopenic group were older, had lower handgrip strength and calf circumference, as well as fewer years of education. Participants in the sarcopenic group had a higher prevalence of cognitive impairment (P < 0.001). Supplementary Table S2 (available in www.besjournal.com) shows the characteristics of participants with 95% CIs for continuous variables and percentages as well as 95% CIs for the percentages.
Variables Total Sarcopenic Non-sarcopenic P value (N = 2,525) (N = 2,032) (N = 493) Age (years) < 0.001 Mean ± SD 84.5 ± 11.3 87.2 ± 10.5 73.3 ± 6.3 Median (IQR) 84 (75–93 ) 87 (79–95 ) 72 (69–76) Handgrip strength < 0.001 Mean ± SD 17.6 ± 9.5 14.9 ± 7.9 28.5 ± 7.5 Median (IQR) 16.8 (10.0–24.0) 14.0 (8.8–20.3) 28.3 (21.5–34.7) Calf circumference < 0.001 Mean ± SD 30.6 ± 4.4 29.6 ± 4.0 34.7 ± 3.2 Median (IQR) 31.0 (28–34) 30 (27–32) 35.0 (33–37) Education attainment (years) < 0.001 Mean ± SD 2.7 ± 3.4 2.1 ± 3.1 4.9 ± 3.6 Median (IQR) 0 (0–5) 0 (0–4) 6 (2–7) Cognitive impairment (%) < 0.001 Yes 873 (34.6) 813 (40.0) 60 (12.2) No 1,652 (65.4) 1,219 (60.0) 433 (87.8) Nationality 0.371 Han 2,310 (91.5) 1,854 (91.2) 456 (92.5) Minority 215 (8.5) 178 (8.8) 37 (7.5) Gender (%) 0.391 Male 2,503 (99.1) 2,015 (99.2) 488 (99) Female 22 (0.9) 17 (0.8) 5 (1.0) Current marital status (%) < 0.001 Married 2,503 (99.1) 2,015 (99.2) 488 (99) Unmarried 22 (0.9) 17 (0.8) 5 (1.0) Smoking (%) 0.134 Yes 434 (17.2) 338 (16.6) 96 (19.5) No 2,091 (82.8) 1,694 (83.4) 397 (80.5) Alcohol consumption (%) 0.002 Yes 445 (17.6) 334 (16.4) 111 (22.5) No 2,080 (82.4) 1,698 (83.6) 382 (77.5) Regular exercise (%) < 0.001 Yes 515 (20.4) 359 (17.7) 156 (31.6) No 2,010 (79.6) 1,673 (82.3) 337 (68.4) BMI (kg/m2) < 0.001 < 18.5 371 (14.7) 359 (17.7) 12 (2.4) 18.5–23.9 1,347 (53.3) 1,160 (57.1) 187 (37.9) 24.0–27.9 609 (24.1) 396 (19.5) 213 (43.2) ≥ 28.0 198 (7.8) 117 (5.8) 81 (16.4) Hypertension (%) 0.008 Yes 1,771 (70.1) 1,401 (68.9) 370 (75.1) No 754 (29.9) 631 (31.1) 123 (24.9) Diabetes (%) 0.315 Yes 334 (13.2) 262 (12.9) 72 (14.6) No 2,191 (86.8) 1,770 (87.1) 421 (85.4) Heart disease (%) 0.355 Yes 268 (10.6) 210 (10.3) 58 (11.8) No 2,257 (89.4) 1,822 (89.7) 435 (88.2) Respiratory diseases (%) 0.063 Yes 217 (8.6) 185 (9.1) 32 (6.5) No 2,308 (91.4) 1,847 (90.9) 461 (93.5) Note. BMI: body mass index. Table 2. Characteristics of participants according to sarcopenia status
-
Sarcopenia (based on the formula derived by Ishii) was positively associated with cognitive impairment (Table 3). Compared with participants without sarcopenia, the crude OR for cognitive impairment was 4.81 (95% CI: 3.62–6.40; P < 0.001) among participants with sarcopenia. The fully adjusted model (model 3) still showed a statistically significant positive association (OR = 2.55, 95% CI: 1.86–3.50; P < 0.001). Handgrip strength and calf circumference were negatively associated with cognitive impairment (Table 3). Compared with individuals in the first quartile (Q1) of calf circumference, the adjusted ORs in the second, third, and fourth quartiles (Q2, Q3 and Q4) were 0.75 (95% CI: 0.58–0.96; P = 0.025), 0.59 (95% CI: 0.44–0.79; P < 0.001), and 0.62 (95% CI: 0.45–0.86; P = 0.004), respectively. Compared with individuals in Q1 of handgrip strength, the adjusted ORs in Q2, Q3, and Q4 were 0.49 (95% CI: 0.38–0.62; P < 0.001), 0.31 (95% CI: 0.23–0.41; P < 0.001), and 0.30 (95% CI: 0.21–0.44; P < 0.001), respectively.
Independent variables Crude Model Model 1 Model 2 Model 3 OR (95% CI) P value OR (95% CI) P value OR (95% CI) P value OR (95% CI) P value Sarcopenia No 1.00 [Reference] 1.00 [Reference] 1.00 [Reference] 1.00 [Reference] Yes 4.81 (3.62−6.40) < 0.001 2.73 (2.00−3.71) < 0.001 2.72 (1.99−3.70) < 0.001 2.55 (1.86−3.50) < 0.001 Calf circumference (cm) 0.86 (0.85−0.88) < 0.001 0.96 (0.93−0.98) < 0.001 0.96 (0.93−0.98) < 0.001 0.95 (0.93−0.98) 0.001 Calf circumference quartile Q1 (n = 584, 19−27 cm) 1.00 [Reference] 1.00 [Reference] 1.00 [Reference] 1.00 [Reference] Q2 (n = 667, 28−30 cm) 0.46 (0.37−0.58) < 0.001 0.75 (0.58−0.96) 0.023 0.74 (0.58−0.96) 0.023 0.75 (0.58−0.96) 0.025 Q3 (n = 638, 31−33 cm) 0.25 (0.19−0.31) < 0.001 0.59 (0.45−0.78) < 0.001 0.59 (0.45−0.79) 0.000 0.59 (0.44−0.79) < 0.001 Q4 (n = 636, 34−43 cm) 0.19 (0.15−0.25) < 0.001 0.64 (0.48−0.87) 0.004 0.64 (0.47−0.87) 0.004 0.62 (0.45−0.86) 0.004 Handgrip strength (kg) 0.89 (0.88−0.90) < 0.001 0.94 (0.93−0.96) < 0.001 0.94 (0.93−0.96) < 0.001 0.94 (0.93−0.96) < 0.001 Handgrip strength quartile Q1 (n = 612, 0.0−9.8 kg) 1.00 [Reference] 1.00 [Reference] 1.00 [Reference] 1.00 [Reference] Q2 (n = 660, 10.0−16.8 kg) 0.35 (0.28−0.44) < 0.001 0.50 (0.39−0.63) < 0.001 0.49 (0.38−0.62) < 0.001 0.49 (0.38−0.62) < 0.001 Q3 (n = 635, 17.0−24.3 kg) 0.13 (0.10−0.17) < 0.001 0.32 (0.23−0.43) < 0.001 0.31 (0.23−0.42) < 0.001 0.31 (0.23−0.41) < 0.001 Q4 (n = 618, 24.5−45.8 kg) 0.07 (0.05−0.10) < 0.001 0.32 (0.22−0.46) < 0.001 0.31 (0.21−0.45) < 0.001 0.30 (0.21−0.44) < 0.001 Note. Handgrip strength was calcaulated by the mean of right and left hand; OR, odds ratio; CI, confidence interval; Model 1: Multivariate logistic analysis was performed after adjusting for age, gender, nationality, education attainment, and marital status. Model 2 was adjusted for variables in model 1 plus smoking, drinking and regular exercise. Model 3 was adjusted for variables in model 2 plus BMI, hypertension, diabetes, heart disease, and respiratory disease. Table 3. Associations of sarcopenia, handgrip strength, and calf circumference with cognitive impairment
-
The results of multiple linear regression were consistent with those of multiple logistic regression. Sarcopenia was negatively associated with MMSE score (Table 4). Compared with participants without sarcopenia, the fully adjusted model showed a statistically significant negative association (β = –2.16; 95% CI: –2.88, –1.43; P < 0.001). Handgrip strength and calf circumference were positively associated with MMSE score (Table 4). Compared with individuals in Q1 of calf circumference, the adjusted differences in Q2, Q3, and Q4 were 1.73 (95% CI: 0.96, 2.50; P < 0.001), 2.22 (95% CI: 1.39, 3.04; P < 0.001), and 2.28 (95% CI: 1.38, 3.17; P < 0.001), respectively. Compared with individuals in Q1 of handgrip strength, the adjusted differences in Q2, Q3, and Q4 were 2.21 (95% CI: 1.44, 2.98; P < 0.001), 3.58 (95% CI: 2.71, 4.44; P < 0.001), and 3.03 (95% CI: 1.98, 4.08; P < 0.001), respectively.
Independent variables Crude Model Model 1 Model 2 Model 3 β (95% CI) P value β (95% CI) P value β (95% CI) P value β (95% CI) P value Sarcopenia No 0.00 [Reference] 0.00 [Reference] 0.00 [Reference] 0.00 [Reference] Yes −4.31
(−5.03, −3.60)< 0.001 −2.18
(−2.91, −1.46)< 0.001 −2.16
(−2.88, −1.43)< 0.001 −1.97
(−2.72, −1.22)< 0.001 Calf circumference (cm) 0.55 (0.48, 0.62) < 0.001 0.20 (0.13, 0.27) < 0.001 0.20 (0.13, 0.27) < 0.001 0.22 (0.14, 0.29) < 0.001 Calf circumference quartile Q1 (n = 584, 19−27 cm) 0.00 [Reference] 0.00 [Reference] 0.00 [Reference] 0.00 [Reference] Q2 (n = 667, 28−30 cm) 3.59 (2.76, 4.42) < 0.001 1.78 (1.01, 2.54) < 0.001 1.79 (1.02, 2.55) < 0.001 1.73 (0.96, 2.50) < 0.001 Q3 (n = 638, 31−33 cm) 5.54 (4.71, 6.38) < 0.001 2.25 (1.45, 3.06) < 0.001 2.25 (1.44, 3.06) < 0.001 2.22 (1.39, 3.04) < 0.001 Q4 (n = 636, 34−43 cm) 6.39 (5.56, 7.22) < 0.001 2.20 (1.36, 3.04) < 0.001 2.19 (1.35, 3.03) < 0.001 2.28 (1.38, 3.17) < 0.001 Handgrip strength (kg) 0.33 (0.30, 0.36) < 0.001 0.12 (0.08, 0.16) < 0.001 0.12 (0.08, 0.16) < 0.001 0.12 (0.08, 0.16) < 0.001 Handgrip strength quartile Q1 (n = 612, 0.0−9.8 kg) 0.00 [Reference] 0.00 [Reference] 0.00 [Reference] 0.00 [Reference] Q2 (n = 660, 10.0−16.8 kg) 3.77 (2.97, 4.57) < 0.001 2.22 (1.45, 2.99) < 0.001 2.24 (1.47, 3.01) < 0.001 2.21 (1.44, 2.98) < 0.001 Q3 (n = 635, 17.0−24.3 kg) 7.06 (6.26, 7.85) < 0.001 3.55 (2.68, 4.42) < 0.001 3.57 (2.71, 4.44) < 0.001 3.58 (2.71, 4.44) < 0.001 Q4 (n = 618, 24.5−45.8 kg) 8.42 (7.62, 9.21) < 0.001 2.96 (1.91, 4.00) < 0.001 2.98 (1.94, 4.03) < 0.001 3.03 (1.98, 4.08) < 0.001 Note. CI, confidence interval; Model 1: Multivariate logistic analysis was performed after adjusting for age, gender, nationality, education attainment, and marital status. Model 2 was adjusted for variables in model 1 plus smoking, drinking and regular exercise, Model 3 was adjusted for variables in model 2 plus BMI, hypertension, diabetes, heart disease, and respiratory disease. MMSE, Mini-mental state examination. Table 4. Associations of sarcopenia, handgrip strength, and calf circumference with MMSE score
-
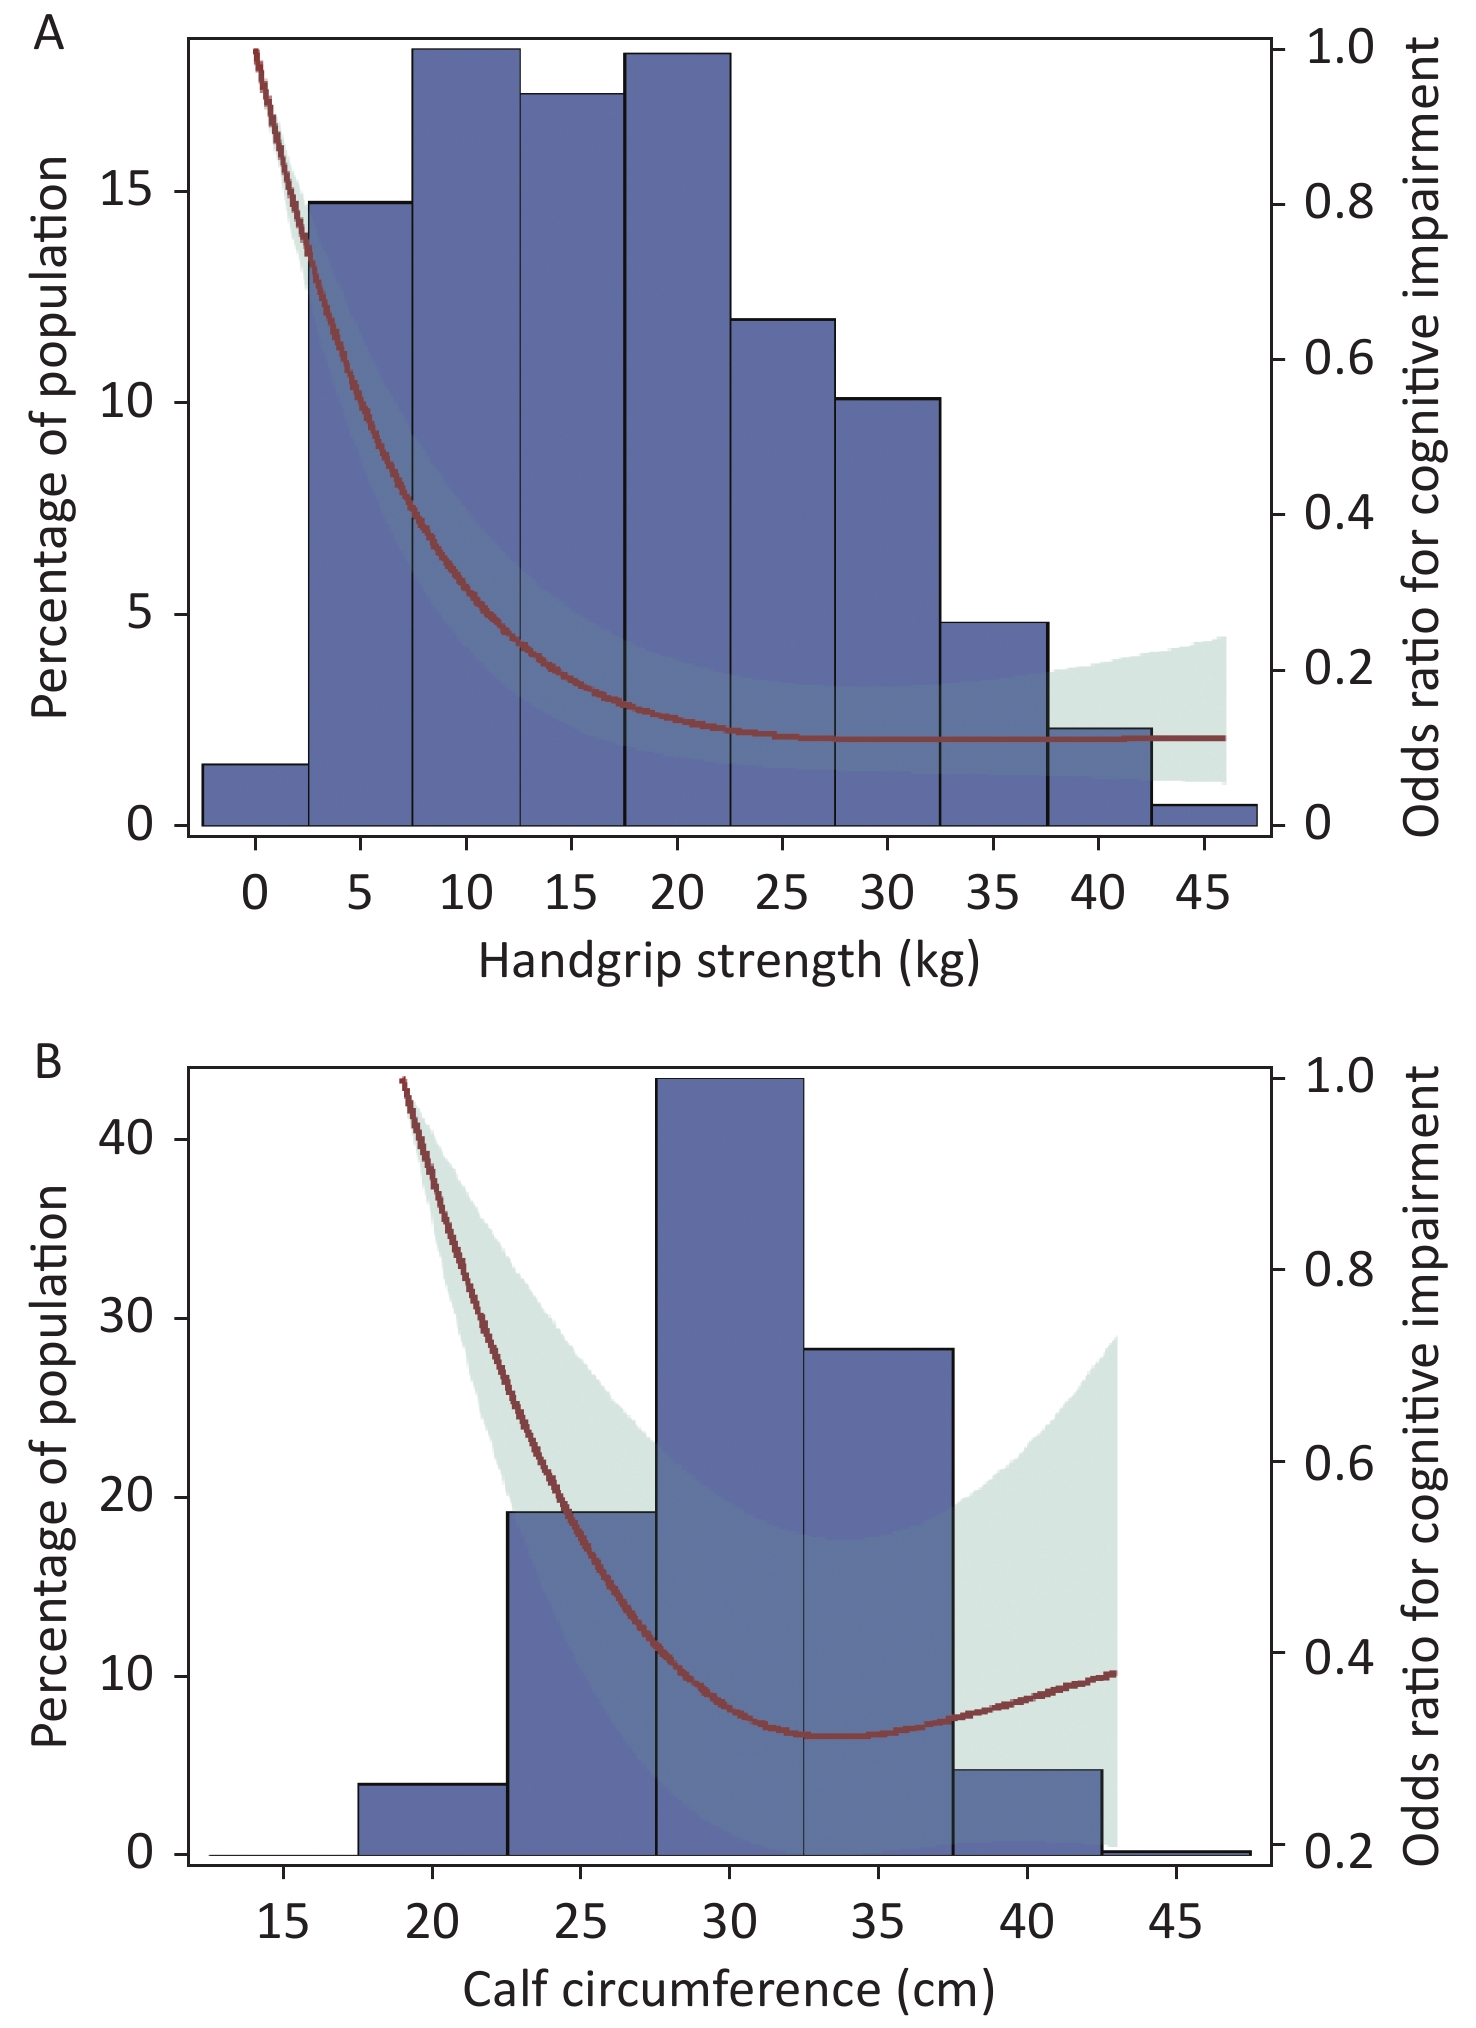
The RCS curve showed that handgrip strength had an L shaped association and calf circumference had an inverse J shaped association with the prevalence of cognitive impairment (P non-linearity < 0.01). When handgrip strength was less than 20 kg, the OR value for cognitive impairment decreased sharply with increased handgrip strength; when handgrip strength was more than 20 kg, the OR value for cognitive impairment decreased slowly with increasing increments of handgrip strength, and finally tended to be flat. Participants with 32 cm calf circumference had the minimum OR value for cognitive impairment (Figure 2).

Figure 2. Odds ratios for cognitive impairment by grip strength and calf circumference in restricted cubic splines models. Adjusted dose-response associations of handgrip strength (A) and calf circumference (B) with cognitive impairment was delineated using splines. The red line and light green shading indicate OR and 95% CI. The reference value (OR = 1) was set at the 0 kg (0 th percentile) for handgrip strength and 19 cm (0 th percentile) for calf circumference. ORs were adjusted for age, gender, nationality, education attainment, marital status, smoking, drinking, physical exercise, BMI, hypertension, diabetes, heart disease, and respiratory disease. The histogram represents the frequency distribution of handgrip strength (A) and calf circumference (B) in the study sample.
-
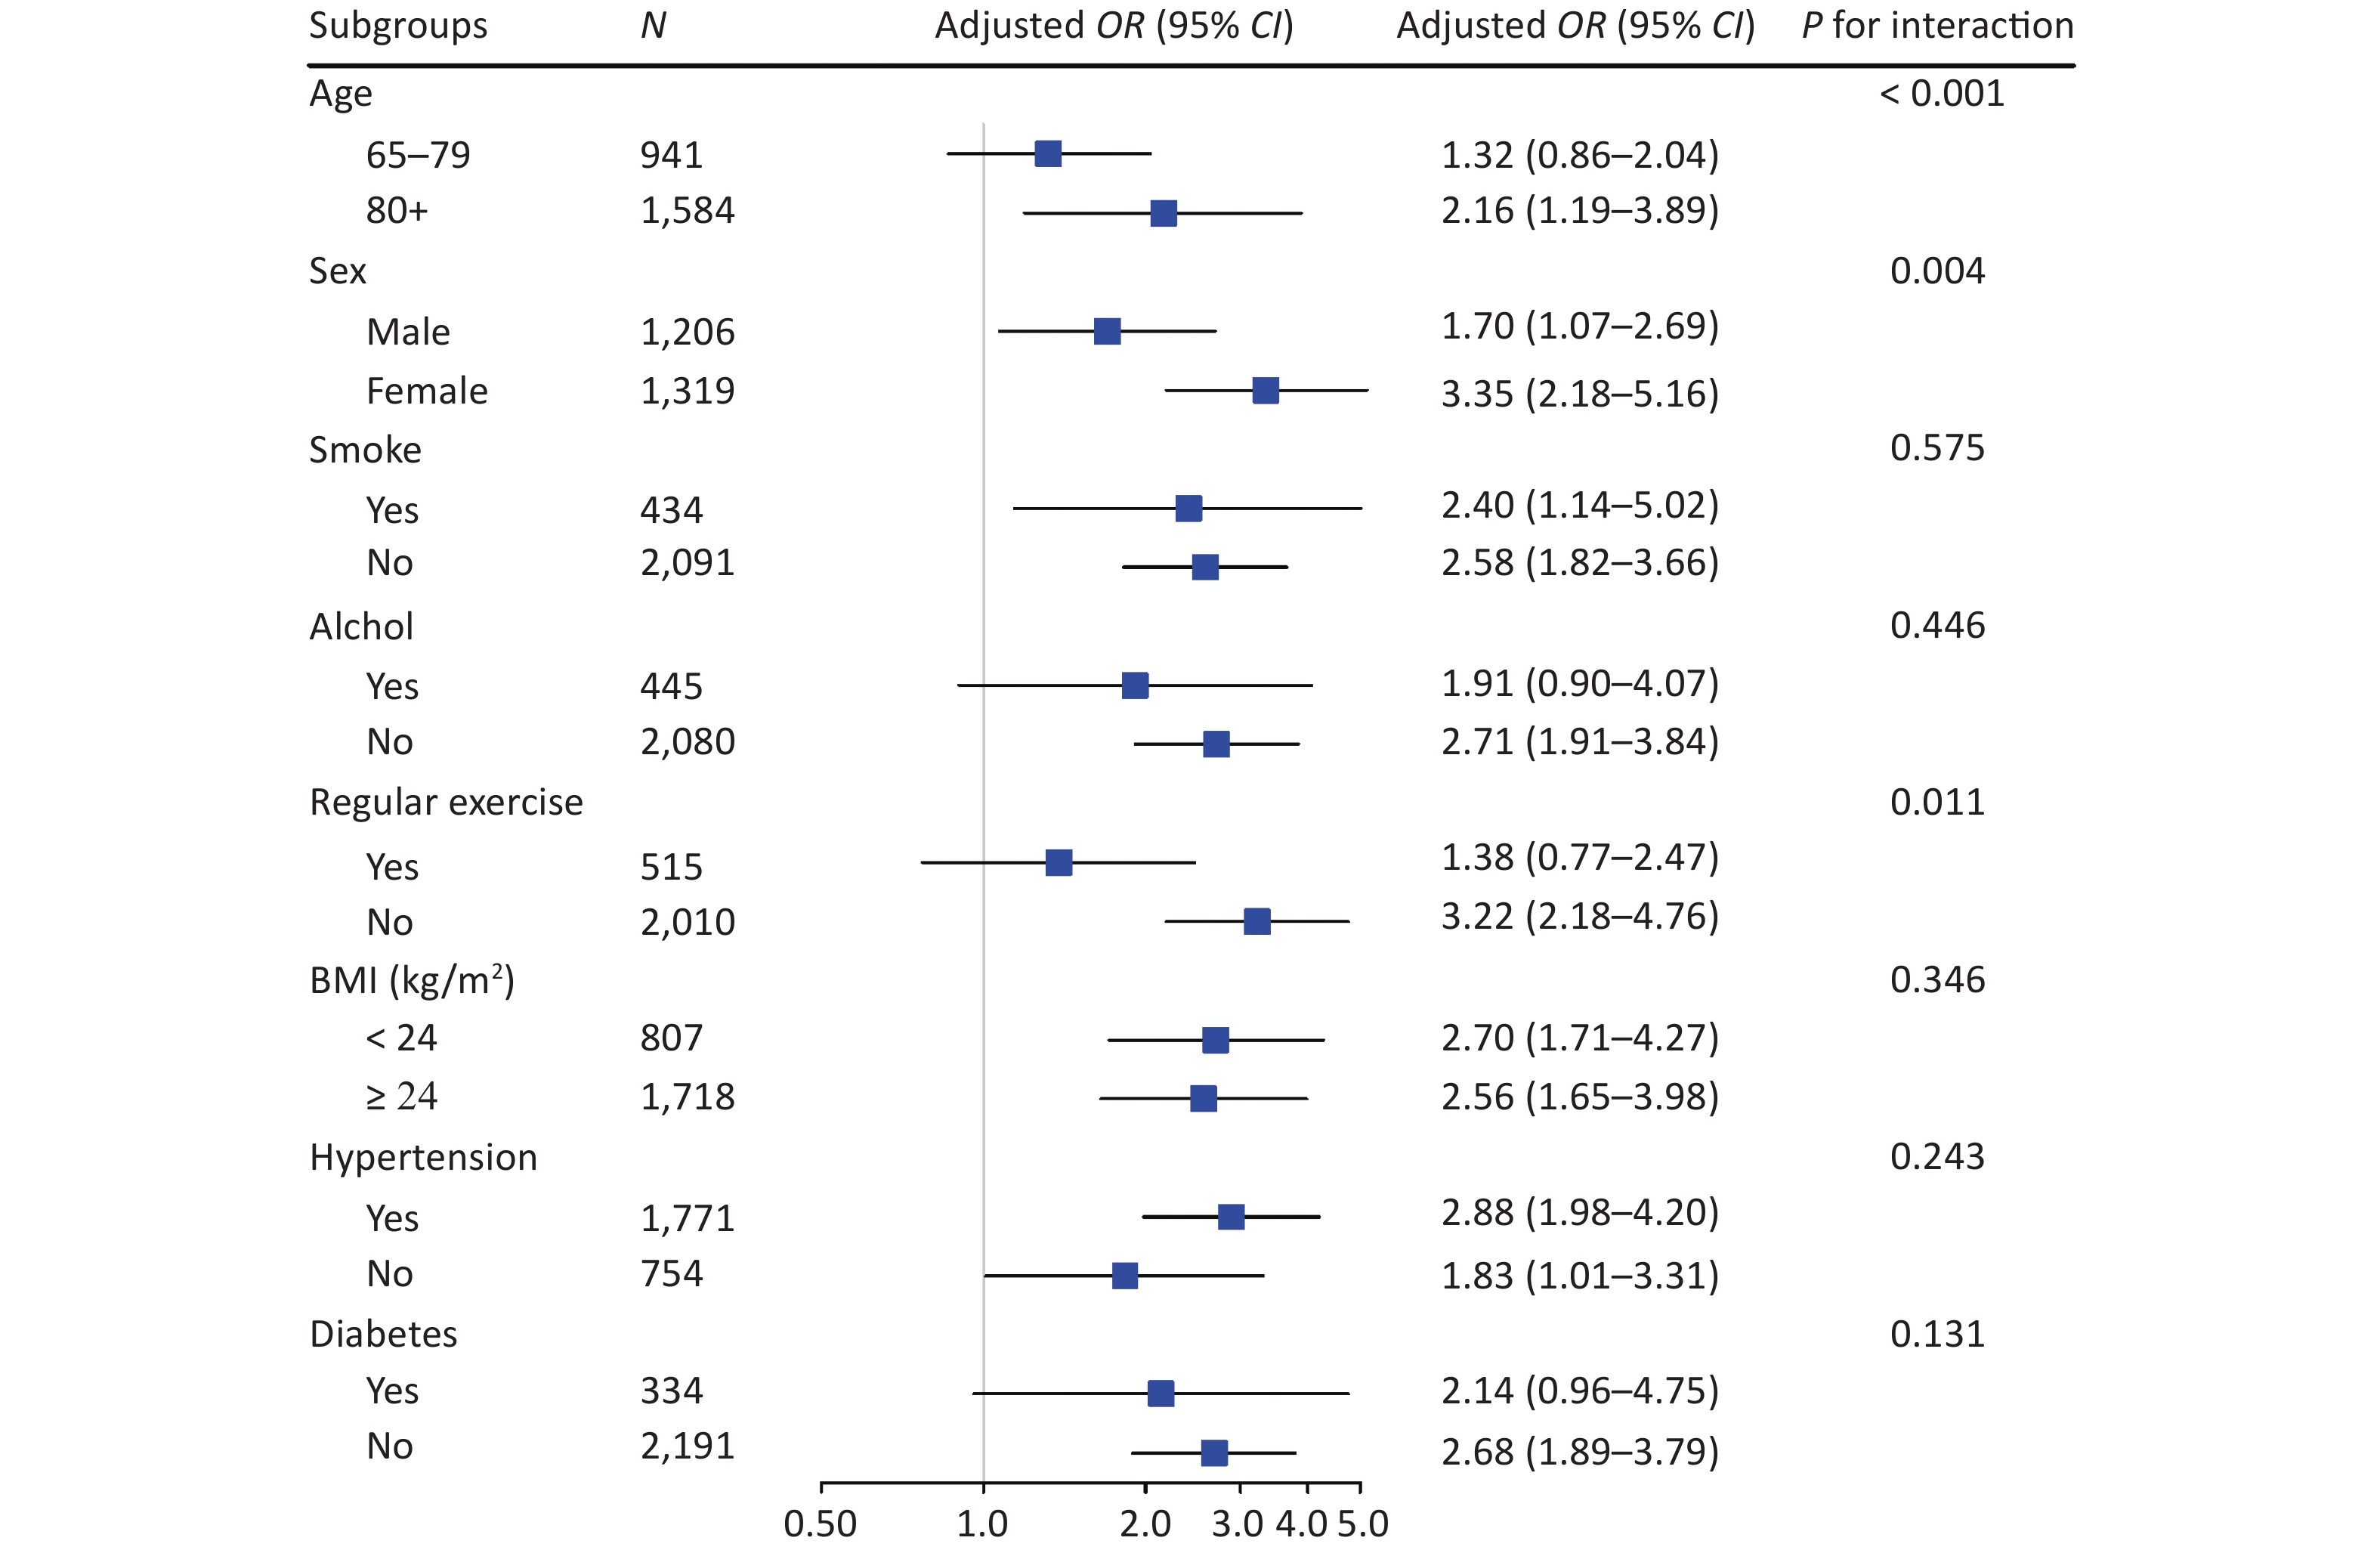
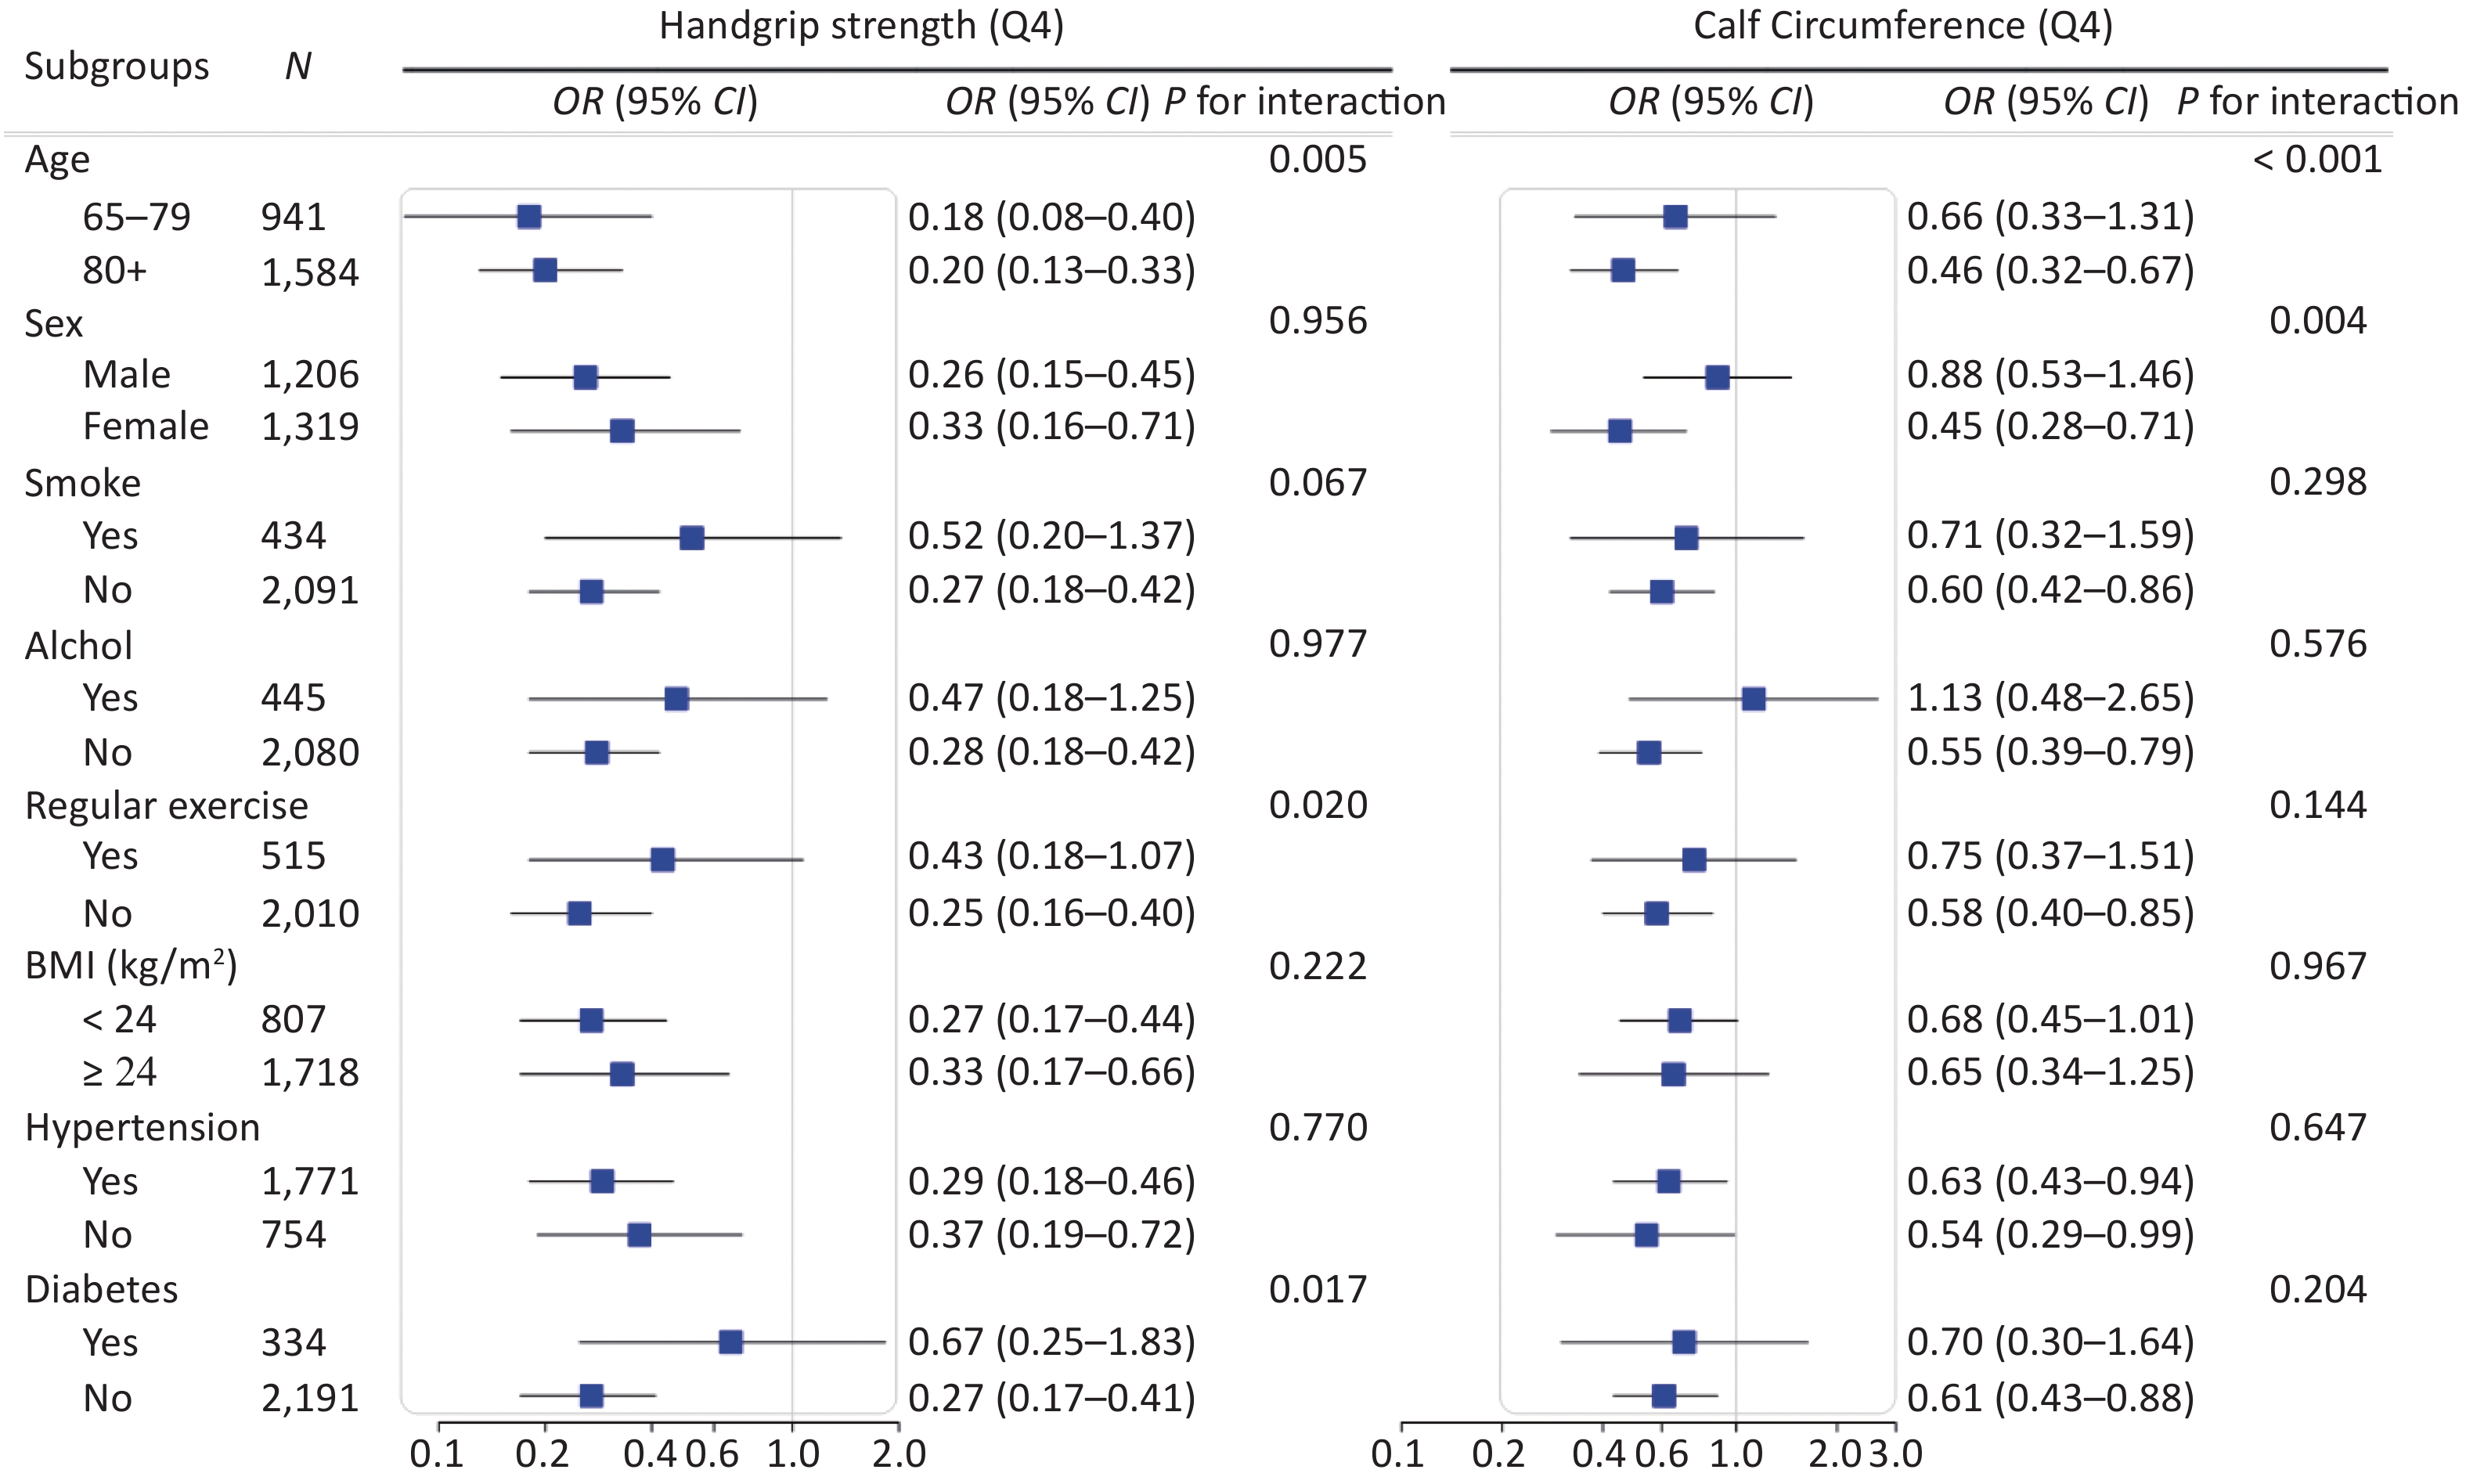
We conducted stratified analyses according to potential risk factors. The associations of sarcopenia with cognitive impairment were stronger among female (P for interaction = 0.004) and oldest old (P for interaction < 0.001; Figure 3) participants. The associations of calf circumference with cognitive impairment were stronger among female (P for interaction = 0.004) and oldest old (P for interaction < 0.001; Supplementary Figure S2 available in www.besjournal.com) participants. The associations of handgrip strength with cognitive impairment were stronger among participants who were 65−79 years (P for interaction = 0.005), participants who did not perform regular exercise (P for interaction = 0.020) and participants who did not have diabetes (P for interaction = 0.017; Supplementary Figure S2). No other significant interactions were found (all P for interaction ≥ 0.05; Figure 3 and Supplementary Figure S2).
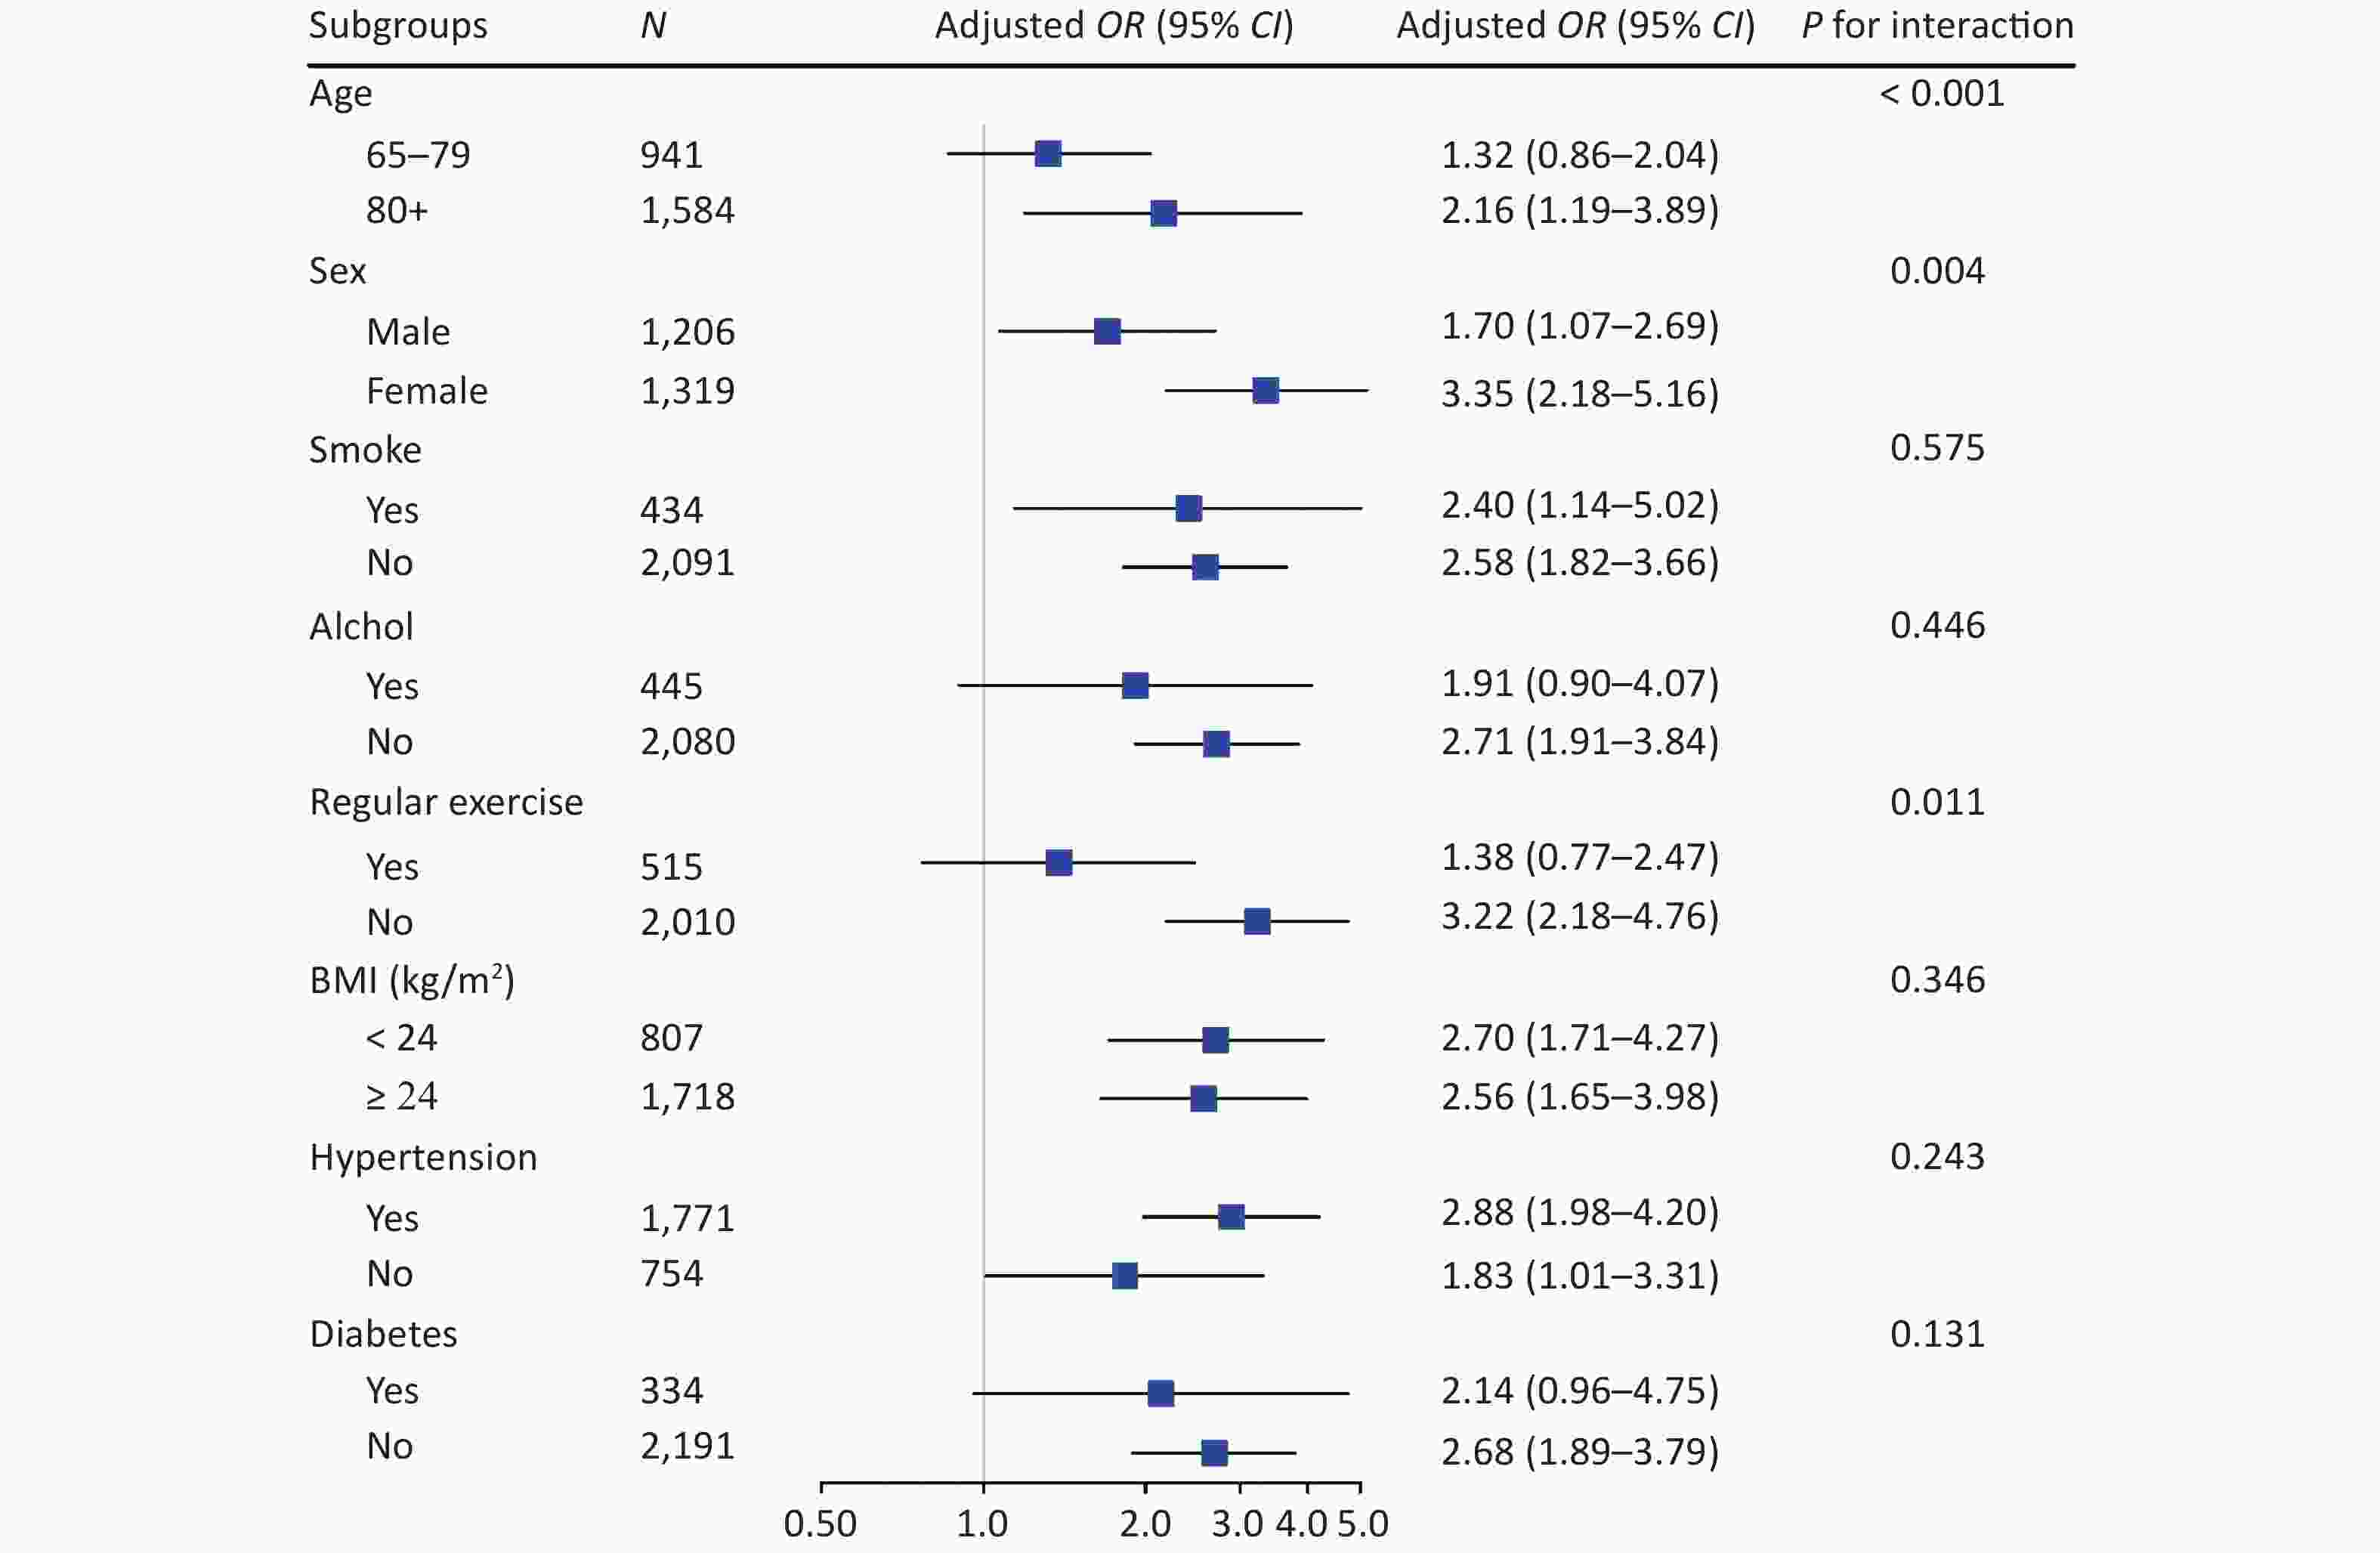
Figure 3. Stratified analyses of associations of sarcopenia with cognitive impairment in logistic regression models among Chinese older adults. CI, confidence interval; OR, odd ratio. Groups were stratified based on eight variables (listed in subgroups). Adjusted covariates included age, gender, nationality, education attainment, marital status, smoking, drinking, regular exercise, BMI, hypertension, diabetes, heart disease, and respiratory disease (When stratified by gender, the adjusted covariables in the model excluded gender, and when stratified by age, the adjusted covariables in the model excluded age, and so on)
Sensitivity analyses showed no substantial change when we excluded participants with major chronic diseases (hypertension, diabetes, heart disease, and respiratory diseases) (Supplementary Table S3 available in www.besjournal.com). The results did not change substantially when we used the maximum grip strength value of the dominant hand (Supplementary Table S4 available in www.besjournal.com), included the outliers of grip strength and calf circumference (Supplementary Table S5 available in www.besjournal.com), added the frequency of vegetable, egg, meat, and fish consumption in model 2 (Supplementary Table S6 available in www.besjournal.com), or added dyslidemia in model 3 (Supplementary Table S7 available in www.besjournal.com).
Independent variables Crude model Model 1 Model 2 Model 3 OR (95% CI) P value OR (95% CI) P value OR (95% CI) P value OR (95% CI) P value Sarcopenia No 1.00 [Reference] 1.00 [Reference] 1.00 [Reference] 1.00 [Reference] Yes 5.37 (2.78−10.39) < 0.001 2.22 (1.06−4.67) 0.035 2.22 (1.05−4.70) 0.037 2.23 (1.05−4.74) 0.038 Calf circumference (cm) 0.84 (0.81−0.88) < 0.001 0.94 (0.89−0.99) 0.031 0.94 (0.89−1.00) 0.037 0.94 (0.89−0.99) 0.018 Calf circumference quartile Q1 1.00 [Reference] 1.00 [Reference] 1.00 [Reference] 1.00 [Reference] Q2 0.41 (0.26−0.65) < 0.001 0.65 (0.38−1.09) 0.104 0.61 (0.36−1.03) 0.064 0.6 (0.35−1.03) 0.062 Q3 0.21 (0.13−0.36) < 0.001 0.50 (0.27−0.93) 0.029 0.5 (0.27−0.94) 0.031 0.48 (0.26−0.91) 0.023 Q4 0.15 (0.09−0.27) < 0.001 0.63 (0.31−1.28) 0.200 0.65 (0.32−1.32) 0.232 0.58 (0.28−1.21) 0.147 Handgrip strength (kg) 0.88 (0.86−0.90) < 0.001 0.94 (0.91−0.98) 0.001 0.94 (0.91−0.97) 0.001 0.94 (0.91−0.97) < 0.001 Handgrip strength quartile Q1 1.00 [Reference] 1.00 [Reference] 1.00 [Reference] 1.00 [Reference] Q2 0.26 (0.16−0.42) < 0.001 0.34 (0.2−0.59) < 0.001 0.32 (0.19−0.56) < 0.001 0.32 (0.18−0.55) < 0.001 Q3 0.11 (0.06−0.19) < 0.001 0.29 (0.15−0.56) < 0.001 0.25 (0.13−0.5) < 0.001 0.25 (0.13−0.49) < 0.001 Q4 0.05 (0.02−0.09) < 0.001 0.25 (0.10−0.58) < 0.001 0.24 (0.10−0.57) < 0.001 0.23 (0.10−0.56) < 0.001 Note. Handgrip Strength was calcaulated by the highest value of dominant hand; OR, odds ratio; CI, confidence interval; Model 1: Multivariate logistic analysis was performed after adjusting for age, gender, nationality, education attainment, and marital status. Model 2 was adjusted for variables in model 1 plus smoking, drinking and physical exercise, Model 3 was adjusted for variables in model 2 plus BMI. Table S3. Associations of handgrip strength, calf circumference and sarcopenia with cognitive impairment (excluding participants with chronic disease)
Independent variables Crude model Model 1 Model 2 Model 3 OR (95% CI) P value OR (95% CI) P value OR (95% CI) P value OR (95% CI) P value Sarcopenia No 1.00 [Reference] 1.00 [Reference] 1.00 [Reference] 1.00 [Reference] Yes 5.33 (4.13−6.89) < 0.001 3.18 (2.41−4.20) < 0.001 3.18 (2.40−4.20) < 0.001 3.04 (2.28−4.04) < 0.001 Handgrip strength (kg) 0.90 (0.89−0.91) < 0.001 0.96 (0.94−0.97) < 0.001 0.96 (0.94−0.97) < 0.001 0.96 (0.94−0.97) < 0.001 Handgrip strength quartile Q1 1.00 [Reference] 1.00 [Reference] 1.00 [Reference] 1.00 [Reference] Q2 0.39 (0.31−0.50) < 0.001 0.59 (0.46−0.76) < 0.001 0.58 (0.45−0.75) < 0.001 0.58 (0.45−0.75) < 0.001 Q3 0.15 (0.11−0.19) < 0.001 0.36 (0.27−0.48) < 0.001 0.35 (0.26−0.47) < 0.001 0.35 (0.26−0.47) < 0.001 Q4 0.08 (0.06−0.11) < 0.001 0.37 (0.25−0.54) < 0.001 0.36 (0.25−0.53) < 0.001 0.35 (0.24−0.52) < 0.001 Note. Handgrip Strength was calcaulated by the highest value of dominant hand; OR, odds ratio; CI, confidence interval; Model 1: Multivariate logistic analysis was performed after adjusting for age, gender, nationality, education attainment, and marital status. Model 2 was adjusted for variables in model 1 plus smoking, drinking and physical exercise, Model 3 was adjusted for variables in model 2 plus BMI, hypertension, diabetes, heart disease, and respiratory disease. Table S4. Associations of handgrip strength (the maximum value of the dominant hand) and sarcopenia with cognitive impairment
Independent variables Crude model Model 1 Model 2 Model 3 OR (95% CI) P value OR (95% CI) P value OR (95% CI) P value OR (95% CI) P value Sarcopenia No 1.00 [Reference] 1.00 [Reference] 1.00 [Reference] 1.00 [Reference] Yes 4.97 (3.76−6.57) < 0.001 2.83 (2.09−3.83) < 0.001 2.81 (2.08−3.81) < 0.001 2.65 (1.95−3.62) < 0.001 Calf circumference (cm) 0.88 (0.86−0.90) < 0.001 0.97 (0.95−0.99) 0.002 0.97 (0.95−0.99) 0.002 0.97 (0.94−0.99) 0.002 Calf circumference quartile Q1 1.00 [Reference] 1.00 [Reference] 1.00 [Reference] 1.00 [Reference] Q2 0.47 (0.37−0.59) < 0.001 0.75 (0.59−0.97) 0.028 0.75 (0.59−0.97) 0.029 0.76 (0.59−0.98) 0.032 Q3 0.25 (0.20−0.32) < 0.001 0.60 (0.45−0.79) 0.000 0.60 (0.45−0.80) 0.000 0.60 (0.45−0.80) < 0.001 Q4 0.19 (0.15−0.24) < 0.001 0.63 (0.46−0.84) 0.002 0.62 (0.46−0.84) 0.002 0.60 (0.43−0.82) 0.002 Handgrip strength (kg) 0.89 (0.88−0.90) < 0.001 0.94 (0.93−0.96) < 0.001 0.94 (0.93−0.96) < 0.001 0.94 (0.92−0.95) < 0.001 Handgrip strength quartile Q1 1.00 [Reference] 1.00 [Reference] 1.00 [Reference] 1.00 [Reference] Q2 0.35 (0.28−0.44) < 0.001 0.49 (0.39−0.63) < 0.001 0.48 (0.38−0.62) < 0.001 0.49 (0.38−0.62) < 0.001 Q3 0.13 (0.10−0.16) < 0.001 0.31 (0.23−0.41) < 0.001 0.30 (0.22−0.41) < 0.001 0.30 (0.22−0.40) < 0.001 Q4 0.07 (0.05−0.09) < 0.001 0.30 (0.21−0.44) < 0.001 0.29 (0.20−0.43) < 0.001 0.29 (0.20−0.42) < 0.001 Note. OR, odds ratio; CI, confidence interval; Model 1: Multivariate logistic analysis was performed after adjusting for age, gender, nationality, education attainment, and marital status. Model 2 was adjusted for variables in model 1 plus smoking, drinking and physical exercise, Model 3 was adjusted for variables in model 2 plus BMI, hypertension, diabetes, heart disease, and respiratory disease. Table S5. Associations of sarcopenia, handgrip strength and calf circumference (including outliers) with cognitive impairment
Independent variables Crude model Model 1 Model 2 Model 3 OR (95% CI) P value OR (95% CI) P value OR (95% CI) P value OR (95% CI) P value Sarcopenia No 1.00 [Reference] 1.00 [Reference] 1.00 [Reference] 1.00 [Reference] Yes 4.81 (3.62−6.40) < 0.001 2.73 (2.00−3.71) < 0.001 2.61 (1.91−3.58) < 0.001 2.46 (1.79−3.39) < 0.001 Calf circumference (cm) 0.86 (0.85−0.88) < 0.001 0.96 (0.93−0.98) < 0.001 0.96 (0.94−0.98) 0.001 0.96 (0.93−0.98) 0.001 Calf circumference quartile Q1 1.00 [Reference] 1.00 [Reference] 1.00 [Reference] 1.00 [Reference] Q2 0.46 (0.37−0.58) < 0.001 0.75 (0.58−0.96) 0.023 0.75 (0.58−0.97) 0.026 0.74 (0.57−0.96) 0.025 Q3 0.25 (0.19−0.31) < 0.001 0.59 (0.45−0.78) < 0.001 0.59 (0.44−0.78) < 0.001 0.58 (0.43−0.78) < 0.001 Q4 0.19 (0.15−0.25) < 0.001 0.64 (0.48−0.87) 0.004 0.66 (0.48−0.90) 0.008 0.63 (0.45−0.88) 0.007 Handgrip strength (kg) 0.89 (0.88−0.90) < 0.001 0.94 (0.93−0.96) < 0.001 0.94 (0.93−0.96) < 0.001 0.94 (0.93−0.96) < 0.001 Handgrip strength quartile Q1 1.00 [Reference] 1.00 [Reference] 1.00 [Reference] 1.00 [Reference] Q2 0.35 (0.28−0.44) < 0.001 0.50 (0.39−0.63) < 0.001 0.48 (0.38−0.62) < 0.001 0.49 (0.38−0.63) < 0.001 Q3 0.13 (0.10−0.17) < 0.001 0.32 (0.23−0.43) < 0.001 0.31 (0.23−0.42) < 0.001 0.31 (0.23−0.42) < 0.001 Q4 0.07 (0.05−0.10) < 0.001 0.32 (0.22−0.46) < 0.001 0.33 (0.22−0.49) < 0.001 0.32 (0.22−0.48) < 0.001 Note. OR, odds ratio; CI, confidence interval; Model 1: Multivariate logistic analysis was performed after adjusting for age, gender, nationality, education attainment, and marital status. Model 2 was adjusted for variables in model 1 plus smoking, drinking, physical exercise, intake frequencies of vegetables, eggs, meat and fish (almost every day, at least once a week, at least once a month, sometimes, or rarely). Model 3 was adjusted for variables in model 2 plus BMI, hypertension, diabetes, heart disease, and respiratory disease. Table S6. Associations of sarcopenia, handgrip strength and calf circumference with cognitive impairment (food consumption was added to model 2)
Independent variables Crude model Model 1 Model 2 Model 3 OR (95% CI) P value OR (95% CI) P value OR (95% CI) P value OR (95% CI) P value Sarcopenia No 1.00 [Reference] 1.00 [Reference] 1.00 [Reference] 1.00 [Reference] Yes 4.81 (3.62−6.40) < 0.0001 2.73 (2.00−3.71) < 0.0001 2.72 (1.99−3.70) < 0.0001 2.53 (1.85−3.48) < 0.001 Calf circumference (cm) 0.86 (0.85−0.88) < 0.0001 0.96 (0.93−0.98) 0.001 0.96 (0.93−0.98) 0.001 0.95 (0.93−0.98) 0.001 Calf circumference quartile Q1 1.00 [Reference] 1.00 [Reference] 1.00 [Reference] 1.00 [Reference] Q2 0.46 (0.37−0.58) < 0.0001 0.75 (0.58−0.96) 0.023 0.74 (0.58−0.96) 0.023 0.73 (0.56−0.94) 0.015 Q3 0.25 (0.19−0.31) < 0.0001 0.59 (0.45−0.78) 0.000 0.59 (0.45−0.79) 0.000 0.59 (0.44−0.79) < 0.001 Q4 0.19 (0.15−0.25) < 0.0001 0.64 (0.48−0.87) 0.004 0.64 (0.47−0.87) 0.004 0.62 (0.45−0.86) 0.004 Handgrip strength (kg) 0.89 (0.88−0.90) < 0.0001 0.94 (0.93−0.96) < 0.0001 0.94 (0.93−0.96) < 0.0001 0.94 (0.93−0.96) < 0.001 Handgrip strength quartile Q1 1.00 [Reference] 1.00 [Reference] 1.00 [Reference] 1.00 [Reference] Q2 0.35 (0.28−0.44) < 0.0001 0.50 (0.39−0.63) < 0.0001 0.49 (0.38−0.62) < 0.0001 0.49 (0.39−0.63) < 0.001 Q3 0.13 (0.10−0.17) < 0.0001 0.32 (0.23−0.43) < 0.0001 0.31 (0.23−0.42) < 0.0001 0.31 (0.23−0.41) < 0.001 Q4 0.07 (0.05−0.10) < 0.0001 0.32 (0.22−0.46) < 0.0001 0.31 (0.21−0.45) < 0.0001 0.31 (0.21−0.45) < 0.001 Note. OR, odds ratio; CI, confidence interval; Model 1: Multivariate logistic analysis was performed after adjusting for age, gender, nationality, education attainment, and marital status. Model 2 was adjusted for variables in model 1 plus smoking, drinking and physical exercise, Model 3 was adjusted for variables in model 2 plus BMI, hypertension, diabetes, heart disease, respiratory disease and dyslipidemia. Table S7. Associations of sarcopenia, handgrip strength and calf circumference with cognitive impairment (dyslipidemia was added to model 3)
-
In our study, sarcopenia was positively associated with cognitive impairment among Chinese community-dwelling older adults. Handgrip strength and calf circumference were negatively associated with cognitive impairment. Sarcopenia (positively), lower handgrip strength and lower calf circumference (both negatively) were associated with MMSE score. The RCS curve showed that handgrip strength had a L-shaped association, and calf circumference had an inverse J-shaped association with cognitive impairment. The associations of sarcopenia with cognitive impairment were stronger among female and oldest old.
Our results are consistent with some previous studies conducted in Japan, the United States, the United Kingdom, and Brazil[11,17,20,36]. In contrast, one cohort study in France found no association of sarcopenia with cognitive impairment in women aged 75 years and older[37]. Another study in Korea also showed no association of sarcopenia with cognitive impairment in older adults aged 70–84 years[38]. A possible reason for differences in results may be due to the different diagnostic criteria used for sarcopenia, which might not have been sufficiently sensitive in the study population. More evidence-based medical or biomarker studies are needed to further assess the exact link of sarcopenia with cognitive impairment.
There may be several potential mechanisms for the association of sarcopenia with cognitive impairment. First, sarcopenia causes arterial stiffness, which has been found to be a risk factor for cognitive impairment[12]. Kohara found the association between sarcopenic indices and brain white matter hyperintensities, which were also thought to be related to cognitive impairment[12]. Second, sarcopenia is often accompanied by insulin resistance[39], which was found to be an independent risk factor for cognitive impairment[40,41], by promoting the deposition of protein A in the brain and the release of numerous inflammatory factors, such a IL-β[42]. Finally, sarcopenia reflects a decrease in skeletal muscle mass, resulting in a decrease in the body’s basal metabolic rate and obesity[39]. The accumulation of fat in the body accompanied by obesity could lead to intracranial atherosclerosis and insufficient blood perfusion of the brain. Cerebral ischemia and hypoxia produce oxidative stress and excessive free radicals, which can cause the loss of neurons in the brain and decline of cognitive function[43].
Several studies have reported that the decrease of handgrip strength is positively associated with cognitive impairment, and higher handgrip strength may be a protective factor for cognitive function. These findings are consistent with our results[23,24,44,45]. One study found that handgrip strength impairment was associated with cognitive decline in terms of episodic memory, visuospatial ability, short-term memory, and semantic memory[46]. A cross-sectional study among an older Korean adult, reported a significant positive association of handgrip strength with MMSE[47]. A possible explanation for this association might be that handgrip strength and gait speed reflect the integrity of neural processes needed for muscle coordination, and muscle coordination is closely associated with cognitive function[44]. It has also been suggested that a stronger handgrip may reflect the integrity of the neuromuscular system, ensuring greater resistance to oxidative stress and inflammation, and thus it could have a protective effect on cognitive function[48]. One study indicated that calf circumference was negatively associated with cognitive impairment in Chinese centenarians [3], which was consistent with our results. This may be related to the fact that the calf circumference of the older adult group reflects the nutritional status and functional maintenance status of the body [49], which further affects the cognitive status of the elderly [50].
The RCS curve showed that handgrip strength had a L shaped association and calf circumference had an inverse J shaped association with the prevalence of cognitive impairment (P non-linearity < 0.01). The inflection points of handgrip strength and calf circumference were 20 kg and 32 cm. The Asia Working Group for Sarcopenia (AWGS) defines sarcopenia based on low muscle strength, low muscle mass, and/or low physical performance[51], with low muscle strength defined as handgrip strength < 26 kg in men and < 18 kg in women. The average age of the participants in our study was very high (84.5 years old) and the majority of participants were women. Therefore, it was reasonable that the inflection point of handgrip strength in our study was 20 kg. Two separate studies defined cut-off points for sarcopenia based on calf circumference of Japanese (34 cm) and Korean women (33 cm)[52,40]. These results were very close to the identified inflection point of 32 cm in our study. However, the exact biological mechanism needs to be verified by further studied.
Subgroup analyses showed that the associations of sarcopenia with cognitive impairment were stronger among female and oldest old participants. Age is considered the most significant risk factor for sarcopenia and cognitive impairment. With the increase of age, the number of neurons in people's brain decrease, making them more susceptible to cognitive impairment[53]. Researchers founded that circulating (plasma) tau proteins, which spreads in the brains of people who have Alzheimer's Disease, increased more over time in women than men[54]. Given the fact that women tend to live longer than men, they also tend to experience higher rates of cognitive impairment than men.
As far as we know, this is the largest cross-sectional study conducted in China to explore the association of sarcopenia with cognitive impairment. Few surveys on the association of sarcopenia with cognitive impairment have been conducted in China. Two such surveys were conducted in Taiwan, one with 731 older adult participants and the other with 353 participants[55,56]. Another study was conducted among 407 hospitalized older adult patients[57]. Most available domestic research has been confined to specific regions and populations, and all available studies used small sample sizes. Moreover, this study is the first to explore the non-linear associations of handgrip strength and calf circumference with cognitive impairment among Chinese older adults.
There were several limitations to the present study. Firstly, we only considered whether the participants did physical activity but ignored the big picture of the underlying level of physical activity, which was likely not very sensitive. Secondly, we could not completely exclude the possibility of reverse associations, while we conducted a sensitivity analysis to exclude participants with chronic diseases and the results remained robust, which reduced the possibility of an inverse association. Moreover, we did not use bioelectrical impedance or X-ray to measure participants’ muscle loss. Finally, a known disadvantage of cross-sectional studies is that we were unable to infer a causal association of sarcopenia with cognitive impairment.
-
Sarcopenia, lower handgrip strength and lower calf circumference were positively associated with cognitive impairment among Chinese community-dwelling older adults. Sarcopenia was positively associated with MMSE score. The RCS curve showed that handgrip strength had a L-shaped association and calf circumference had an inverse J-shaped association with cognitive impairment. The associations of sarcopenia with cognitive impairment were more prominent among female and oldest old. This study provided evidence for modifiable risk factors that could potentially be used to treat and prevent cognitive impairment.
-
The authors thank the staff of all national, provincial, and local Centers for Disease Control and Prevention for carrying out the fieldwork. We thank all the older adults who participated in the HABCS.
-
The authors declare that they have no conflict of interest.
-
X-MS had full access to all the data in the study and takes responsibility for the integrity of the data and the accuracy of the data analysis. BW, Y-BL contributed to the study concept, collected and assembled the data, analysed and interpreted the data, and drafted the manuscript. Z-JC, YW, W-YS, J-HZ, CM, and X-MS helped to implement the survey and contributed to the concept and data analysis. XG, VBK, FZ, XC, FL, M-YZ, and Y-CL helped to interpret the results and provided critical revisions. Q-YT, S-XS, Y-LQ, and X-LZ helped with correction of the manuscript.
Variables Total Sarcopenia Non-sarcopenia (N = 2,525) (N = 2,032) (N = 493) Age (years) 84.50 (84.06−84.94) 87.23 (86.77−87.69) 73.27 (72.71−73.83) Handgrip strength 17.58 (17.20−17.95) 14.93 (14.59−15.28) 28.47 (27.80−29.14) Calf circumference 30.58 (30.40−30.75) 29.58 (29.41−29.75) 34.67 (34.39−34.96) Education attainment (years) 2.66 (2.53−2.79) 2.11 (1.98−2.25) 4.90 (4.59−5.22) Cognitive impairment (%) Yes 0.35 (0.33−0.36) 0.4 (0.38−0.42) 0.12 (0.09−0.15) No 0.65 (0.64−0.67) 0.6 (0.58−0.62) 0.88 (0.85−0.91) Nationality Han 0.91 (0.90−0.93) 0.91 (0.90−0.92) 0.92 (0.90−0.95) Minority 0.09 (0.07−0.10) 0.09 (0.08−0.10) 0.08 (0.05−0.10) Gender (%) Male 0.48 (0.46−0.50) 0.47 (0.45−0.50) 0.49 (0.45−0.54) Female 0.52 (0.50−0.54) 0.53 (0.50−0.55) 0.51 (0.46−0.55) Current marital status (%) Married 0.99 (0.99−0.99) 0.99 (0.99−1.00) 0.99 (0.98−1.00) Unmarried 0.01 (0.00−0.01) 0.01 (0.00−0.02) 0.01 (0.01−0.01) Smoking (%) Yes 0.17 (0.16−0.19) 0.17 (0.15−0.18) 0.19 (0.16−0.23) No 0.83 (0.81−0.84) 0.83 (0.82−0.85) 0.81 (0.77−0.84) Alcohol consumption (%) Yes 0.18 (0.16−0.19) 0.16 (0.15−0.18) 0.84 (0.82−0.85) No 0.82 (0.81−0.84) 0.23 (0.19−0.26) 0.77 (0.74−0.81) Exercise (%) Yes 0.20 (0.19−0.22) 0.18 (0.16−0.19) 0.32 (0.28−0.36) No 0.80 (0.78−0.81) 0.32 (0.28−0.36) 0.68 (0.64−0.72) Hypertension (%) Yes 0.70 (0.68−0.72) 0.69 (0.67−0.71) 0.75 (0.71−0.79) No 0.30 (0.28−0.32) 0.31 (0.29−0.33) 0.25 (0.21−0.29) Diabetes (%) Yes 0.13 (0.12−0.15) 0.13 (0.11−0.14) 0.15 (0.11−0.18) No 0.87 (0.85−0.88) 0.87 (0.86−0.89) 0.85 (0.82−0.89) Heart disease (%) Yes 0.11 (0.09−0.12) 0.1 (0.09−0.12) 0.12 (0.09−0.15) No 0.89 (0.88−0.91) 0.9 (0.88−0.91) 0.88 (0.85−0.91) Respiratory diseases (%) Yes 0.09 (0.08−0.10) 0.09 (0.08−0.10) 0.06 (0.04−0.09) No 0.91 (0.90−0.93) 0.91 (0.9−0.92) 0.94 (0.91−0.96) Table S2. Characteristics of participants according to sarcopenia status
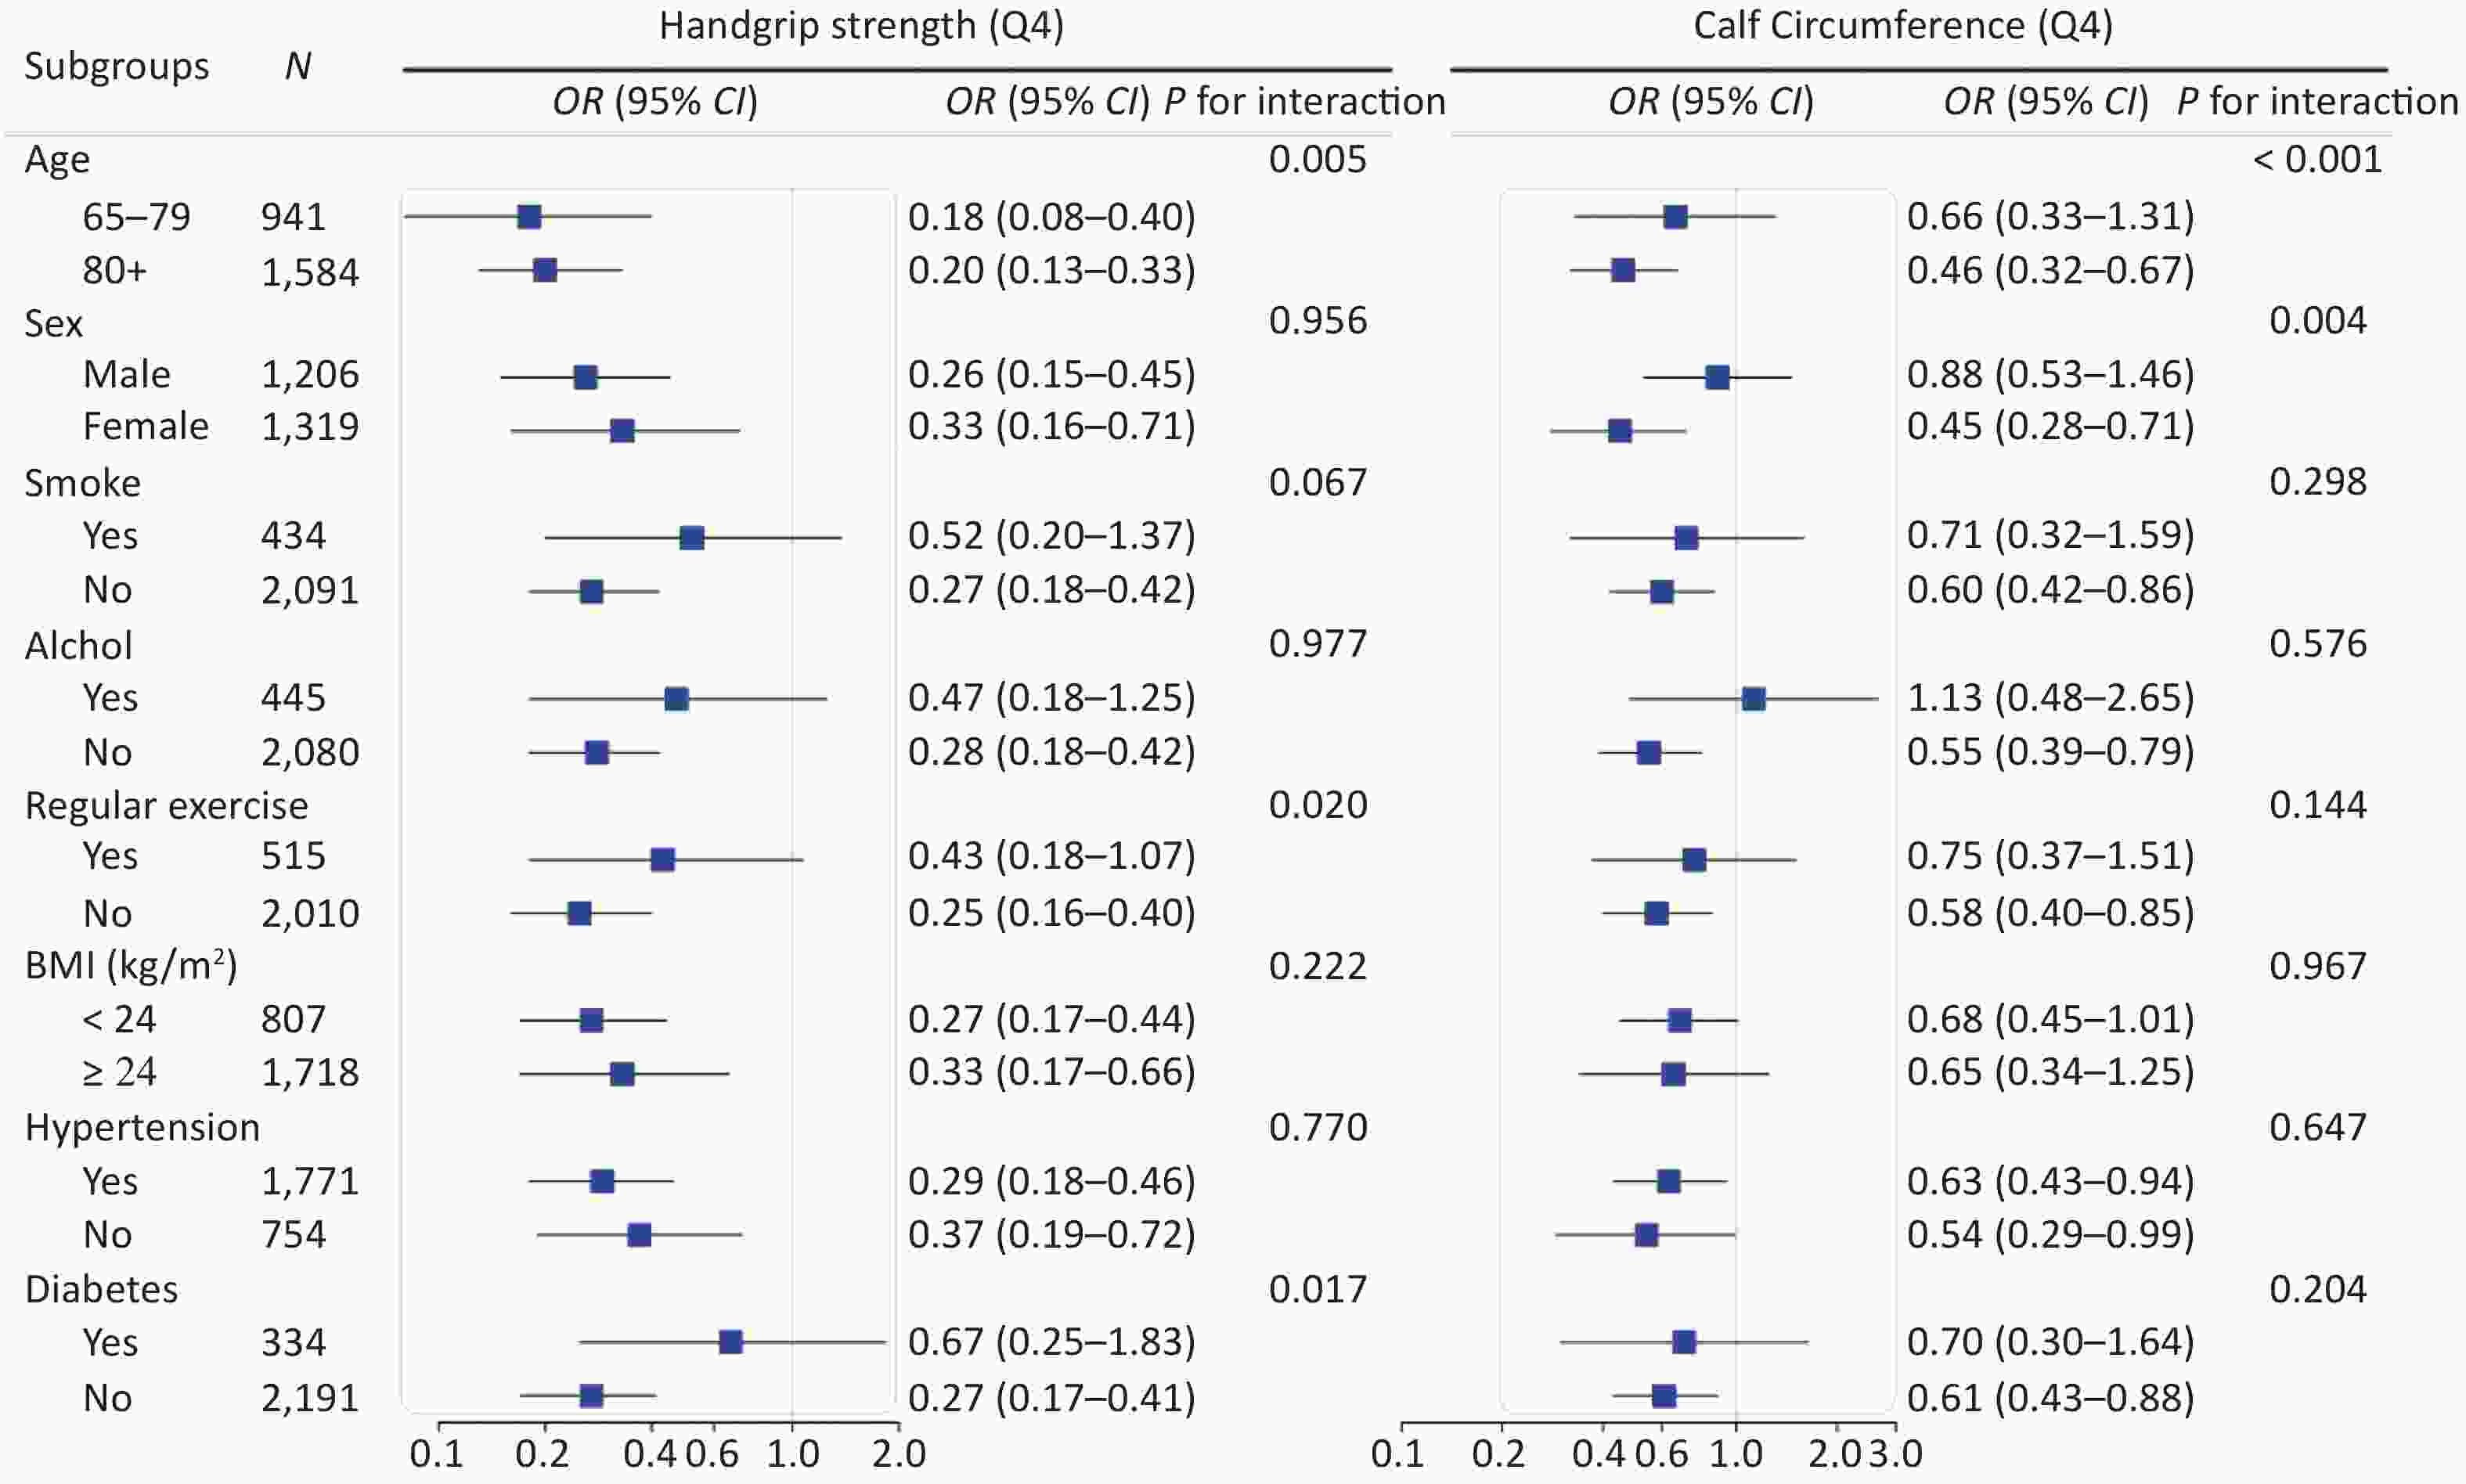
Figure S2. Stratified analyses of association of handgrip strength and calf circumference with cognitive impairment in logistic regression models among Chinese older adults
HTML
Study Population
Assessment of Cognitive Impairment
Screening for Sarcopenia
Assessment of Covariates
Statistical Analyses
Participants’ Characteristics
Associations of Sarcopenia, Handgrip Strength and Calf Circumference with Cognitive Impairment
Association of Sarcopenia, Handgrip Strength and Calf Circumference with MMSE Score
Dose-Response Associations of Handgrip Strength and Calf Circumference with Cognitive Impairment
Subgroup Analysis and Sensitivity Analysis
 20514Supplementary Materials.pdf
|

|

 Quick Links
 DownLoad: