


-
Obesity has become a serious public health problem worldwide. In China, obesity dramatically increased in the past decades; the prevalence of being overweight and obese among adults reached 50.7% in 2020 [1], and it might reach 65.3% in the next 10 years [2]. Obesity is a well-documented risk factor for several chronic diseases, including type 2 diabetes, hypertension, cardiovascular diseases (CVDs), and certain cancers [3, 4]. The economic consequences of obesity and obesity-related diseases are high. For example, the total medical cost associated with obesity in China will be approximately ¥418 billion in 2030 [2]. Obesity and the major metabolic factors associated with it are also recognized risk factors for certain severe clinical outcomes of the coronavirus disease (COVID-19) [5–7]. A recent study conducted in the United States found that nearly 63.5% of COVID-19 hospitalizations among adults can be attributed to total obesity, diabetes, hypertension, and heart failure [5]. In a Chinese study, hypertension (16.2%), diabetes (7.7%), and CVD (6.3%) were the three most common comorbidities among patients with COVID-19 [8].
Given the critical role played by obesity and its major metabolic risk factors, as well as the obesity paradox reported by previous studies [9, 10], the joint associations of obesity and metabolic health with disease outcomes have become an important research topic. The findings can help further stratify obesity risk in consideration of corresponding metabolic health status for the identification of high-risk individuals [11–14]. For example, compared with the metabolically unhealthy obese (MUO) phenotype, the metabolically healthy obese (MHO) phenotype showed a decreased risk of CVD, cancer, and mortality [12, 15–17]. However, only a few such studies have been conducted in the Chinese population [13, 15], and they have all used body mass index (BMI) as a surrogate for obesity. In this study, we have included fat mass percentage (FMP) since obesity is defined as excessive body fat while BMI cannot reflect body adiposity [18].
This study aimed to investigate the association of metabolic phenotypes that are jointly determined by BMI or FMP and the metabolic health status with CVD risk among Chinese adults.
-
This study was part of a population-based, cross-sectional study about assessing Chinese physiological constants and health conditions completed in 2012. The two-stage cluster sampling method was used to select eligible subjects from six provinces across cities and communities randomly. Detailed descriptions of the sampling procedure could be found in many publications [19].
For the current analysis, the study population included 13,239 adults aged 34–75 years who completed the biochemical and body composition tests. The study was approved by the review board of the Institute of Basic Medical Sciences, Chinese Academy of Medical Sciences. All participants provided written consent.
-
Weight and height were measured according to the standard protocols. BMI was defined as the body weight (kg) divided by the squared body height (m2). Body fat was measured with the bioelectric impedance analysis (BIA) method using the Biodynamics body composition analyzer (BI-310, American Biodynamics Corporation, USA). Measurements were made in a supine position, and the participants kept their hands away from their bodies, with their feet apart at approximately 15 cm. Fat mass was measured, and FMP was calculated with fat mass divided by weight. Quality control was performed before the daily measurements. Blood pressure was measured using an oscillometric sphygmomanometer (HEM-7000, Omron, Japan), and systolic and diastolic blood pressures (SBP and DBP, respectively) were recorded in mmHg.
All participants were required to fast overnight for 12-h before the blood sampling. Total cholesterol (TC), triglycerides (TG), high-density lipoprotein cholesterol (HDL-C), and low-density lipoprotein cholesterol (LDL-C) were measured with a Beckman AU Series Automatic Biochemical Analyzer (Japan), using Sekisui Medical (Japan) reagents. Fasting blood glucose (FBG) was measured with the same biochemical analyzer, using Beckman AU reagents.
-
Demographic information (including age, sex, race, marital status, education, and geographical location), family history of CVD, and lifestyle information (including smoking, alcohol drinking, and physical activity) were obtained through questionnaires. Marital status was classified as married and others. Education was classified as college or higher and others. Ever-smokers (former and current) were all regarded as smoking in the past 12 months. Alcohol drinking, former or current, was regarded as drinking in the past 12 months. Physical activity was classified as regular or irregular.
-
Obesity status was defined with BMI or FMP. BMI-defined obesity was categorized as (1) non-obese for BMI < 28 kg/m2 and (2) obese for BMI ≥ 28 kg/m2 [20]. FMP-defined obesity was categorized as (1) non-obese for FMP < 25.0% in men and FMP < 30.0% in women, and (2) obese for FMP ≥ 25.0% in men and FMP ≥ 30.0% in women [21].
The metabolic status was defined using the modified metabolic syndrome criteria provided by the International Diabetes Federation (IDF) [22]. The metabolically healthy phenotype was defined as the absence of any of the following: (1) SBP ≥ 130 mmHg, DBP ≥ 85 mmHg, or using antihypertensive drugs, (2) FBG ≥ 5.6 mmol/L, (3) TG ≥1.7 mmol/L, and (4) HDL-C < 1.0 mmol/L in men and HDL-C < 1.3 mmol/L in women. By contrast, the metabolically unhealthy phenotype was defined as having 1–4 of the above.
The metabolic phenotype was cross grouped by metabolic and obesity status jointly. The metabolically healthy non-obese (MHNO) phenotype was defined as being metabolically healthy and non-obese. The metabolically unhealthy non-obese (MUNO) phenotype was defined as being metabolically unhealthy and non-obese. MHO was defined as being metabolically healthy and obese. MUO was defined as being metabolically unhealthy and obese.
-
CVD risk within ten years was estimated with a model based on the Chinese guidelines[23], similar to the Framingham CVD score. In this model, individual and mean effects were calculated first. The mean effect was calculated using age, SBP, TC, HDL-C, waist circumference (WC), smoking, diabetes, living in an urban area in northern China, and without a family history of CVD. The model was as shown below:
Ten-year CVD Risk Score
$ =1-{{S}_{10}}^{{e}^{(Individual\;effect-Mean\;effect)}} $ S10, the survival rate for CVD in 10 years, is a constant in men and women (S10 = 0.97, 0.99, respectively). The ten-year CVD risk grade was categorized according to the Chinese guidelines on the primary prevention of CVDs [24]. Low risk was defined as a ten-year CVD risk score < 5.0%, and medium- to high-risk was defined as a 10-year CVD risk score ≥ 5.0%.
-
Participant characteristics were categorized into four phenotypic groups, namely MHNO, MUNO, MHO, and MUO, and continuous variables with a normal distribution were expressed as mean ± standard deviation. The F test was used to compare the four groups. TG and the ten-year CVD risk score did not show a normal distribution, and they were both expressed as median and interquartile range. The categorical variables were expressed with N (%), and χ2 test was used to compare the four groups.
Multiple linear regressions were conducted using the BMI- and FMP-defined obesity models. The ten-year CVD risk score was the dependent variable, and the metabolic phenotype was the independent variable, adjusted for the related covariates. Three dummy variables were created for the four categories of metabolic phenotypes in each model, with the MHNO phenotype group as the reference. The adjusted coefficient of determination (R2) was used to compare the different models and determine the best one. Logistic regression was used to compare CVD risk among the four metabolic phenotype groups. Odds ratios (OR) and 95% confidence intervals (CI) were calculated to estimate the associations of metabolic phenotype with CVD risk. Simultaneously, we performed subgroup analyses to examine the effect of obesity defined by BMI or FMP on CVD risk, stratified by sex, age, smoking, alcohol drinking, physical activity, and geographical location. The MHNO phenotype group was used as the reference.
All statistical tests were conducted using SAS 9.4 (SAS Institute Inc.), and the forest plot was conducted in R version 3.6.2 using the forest plot package [25].
-
In 13,239 participants, the prevalence values of metabolic health and obesity defined by BMI were 38.3% and 13.5%, respectively. The prevalence values of MHNO, MUNO, MHO, and MUO phenotypes were 35.9%, 50.5%, 2.4%, and 11.1%, respectively. The characteristics of the study population are shown in Table 1.
Characteristics Non-obesity Obesity χ2/F P Metabolically healthy Metabolically unhealthy Metabolically healthy Metabolically unhealthy N 4,755 6,694 315 1,475 Age, years 50.0 ± 10.7 52.2 ± 10.6 52.1 ± 10.2 53.2 ± 10.6 57.63 < 0.001 Female (%) 2,685 (56.5) 3,658 (54.7) 157 (49.8) 687 (46.6) 47.30 < 0.001 Race Han (%) 1,841 (38.7) 2,289 (34.2) 134 (42.5) 512 (34.7) 31.55 < 0.001 Geographical location Southern China (%) 2,499 (52.6) 3,441 (51.4) 84 (26.7) 456 (30.9) 295.44 < 0.001 Northern China (%) 2,256 (47.4) 3,253 (48.6) 231 (73.3) 1,019 (69.1) Marital status Married (%) 4,260 (93.1) 5,949 (93.0) 274 (95.5) 1,302 (93.1) 5.33 0.502 Education College or higher (%) 1,317 (28.5) 1,652 (25.5) 77 (25.7) 391 (27.6) 20.39 0.002 Smoking (%) 1,254 (26.4) 1,823 (27.2) 87 (27.6) 1,302 (93.1) 17.37 < 0.001 Alcohol drinking (%) 1,087 (22.9) 1,750 (26.1) 90 (28.6) 463 (31.4) 47.19 < 0.001 Regular physical activity (%) 1,233 (31.7) 1867 (34.9) 111 (40.2) 472 (38.9) 28.46 < 0.001 WC, cm 77.2 ± 8.0 81.7 ± 8.4 93.9 ± 8.2 95.5 ± 7.3 2131.3 < 0.001 FMP, % 22.0 ± 8.1 23.7 ± 7.7 28.9 ± 8.1 28.7 ± 7.3 319.67 < 0.001 BMI, kg/m2 22.6 ± 2.5 23.9 ± 2.5 30.0 ± 2.0 30.1 ± 1.9 4153.4 < 0.001 TC, mmol/L 4.81 ± 0.89 5.01 ± 1.09 4.99 ± 0.91 5.18 ± 1.07 64.77 < 0.001 TG, mmol/L 1.00 (0.76, 1.26) 1.79 (1.18, 2.50) 1.19 (0.94, 1.44) 2.13 (1.56, 3.01) 1675 < 0.001 HDL-C, mmol/L 1.58 ± 0.32 1.29 ± 0.35 1.43 ± 0.29 1.18 ± 0.28 928.06 < 0.001 LDL-C, mmol/L 2.74 ± 0.78 2.92 ± 0.87 2.97 ± 0.76 3.02 ± 0.87 65.08 < 0.001 FBG, mmol/L 4.99 ± 0.39 5.81 ± 1.49 5.06 ± 0.34 6.01 ± 1.65 519.19 < 0.001 SBP, mmHg 124.4 ± 17.2 130.2 ± 18.6 133.1 ± 18.1 139.5 ± 20.2 273.59 < 0.001 DBP, mmHg 78.3 ± 10.8 81.8 ± 11.0 85.7 ± 11.5 88.1 ± 11.8 324.79 < 0.001 Ten-year CVD risk score, % 1.00 (0.38, 2.64) 1.72 (0.72, 3.89) 1.87 (0.98, 4.31) 3.13 (1.55, 5.81) 305.51 < 0.001 Ten-year CVD risk score < 5.0% 4,157 (88.2) 5,352 (81.6) 247 (79.2) 991 (70.3) 260.12 < 0.001 ≥ 5.0% 554 (11.8) 1,204 (18.4) 65 (20.8) 418 (29.7) Note. WC, waist circumference; FMP, fat mass percentage; BMI, body mass index; TC, total cholesterol; TG, triglycerides; HDL-C, high-density lipoprotein cholesterol; LDL-C, low-density lipoprotein cholesterol; FBG, fasting blood glucose; SBP, systolic blood pressure; DBP, diastolic blood pressure. Table 1. Characteristics of the study population
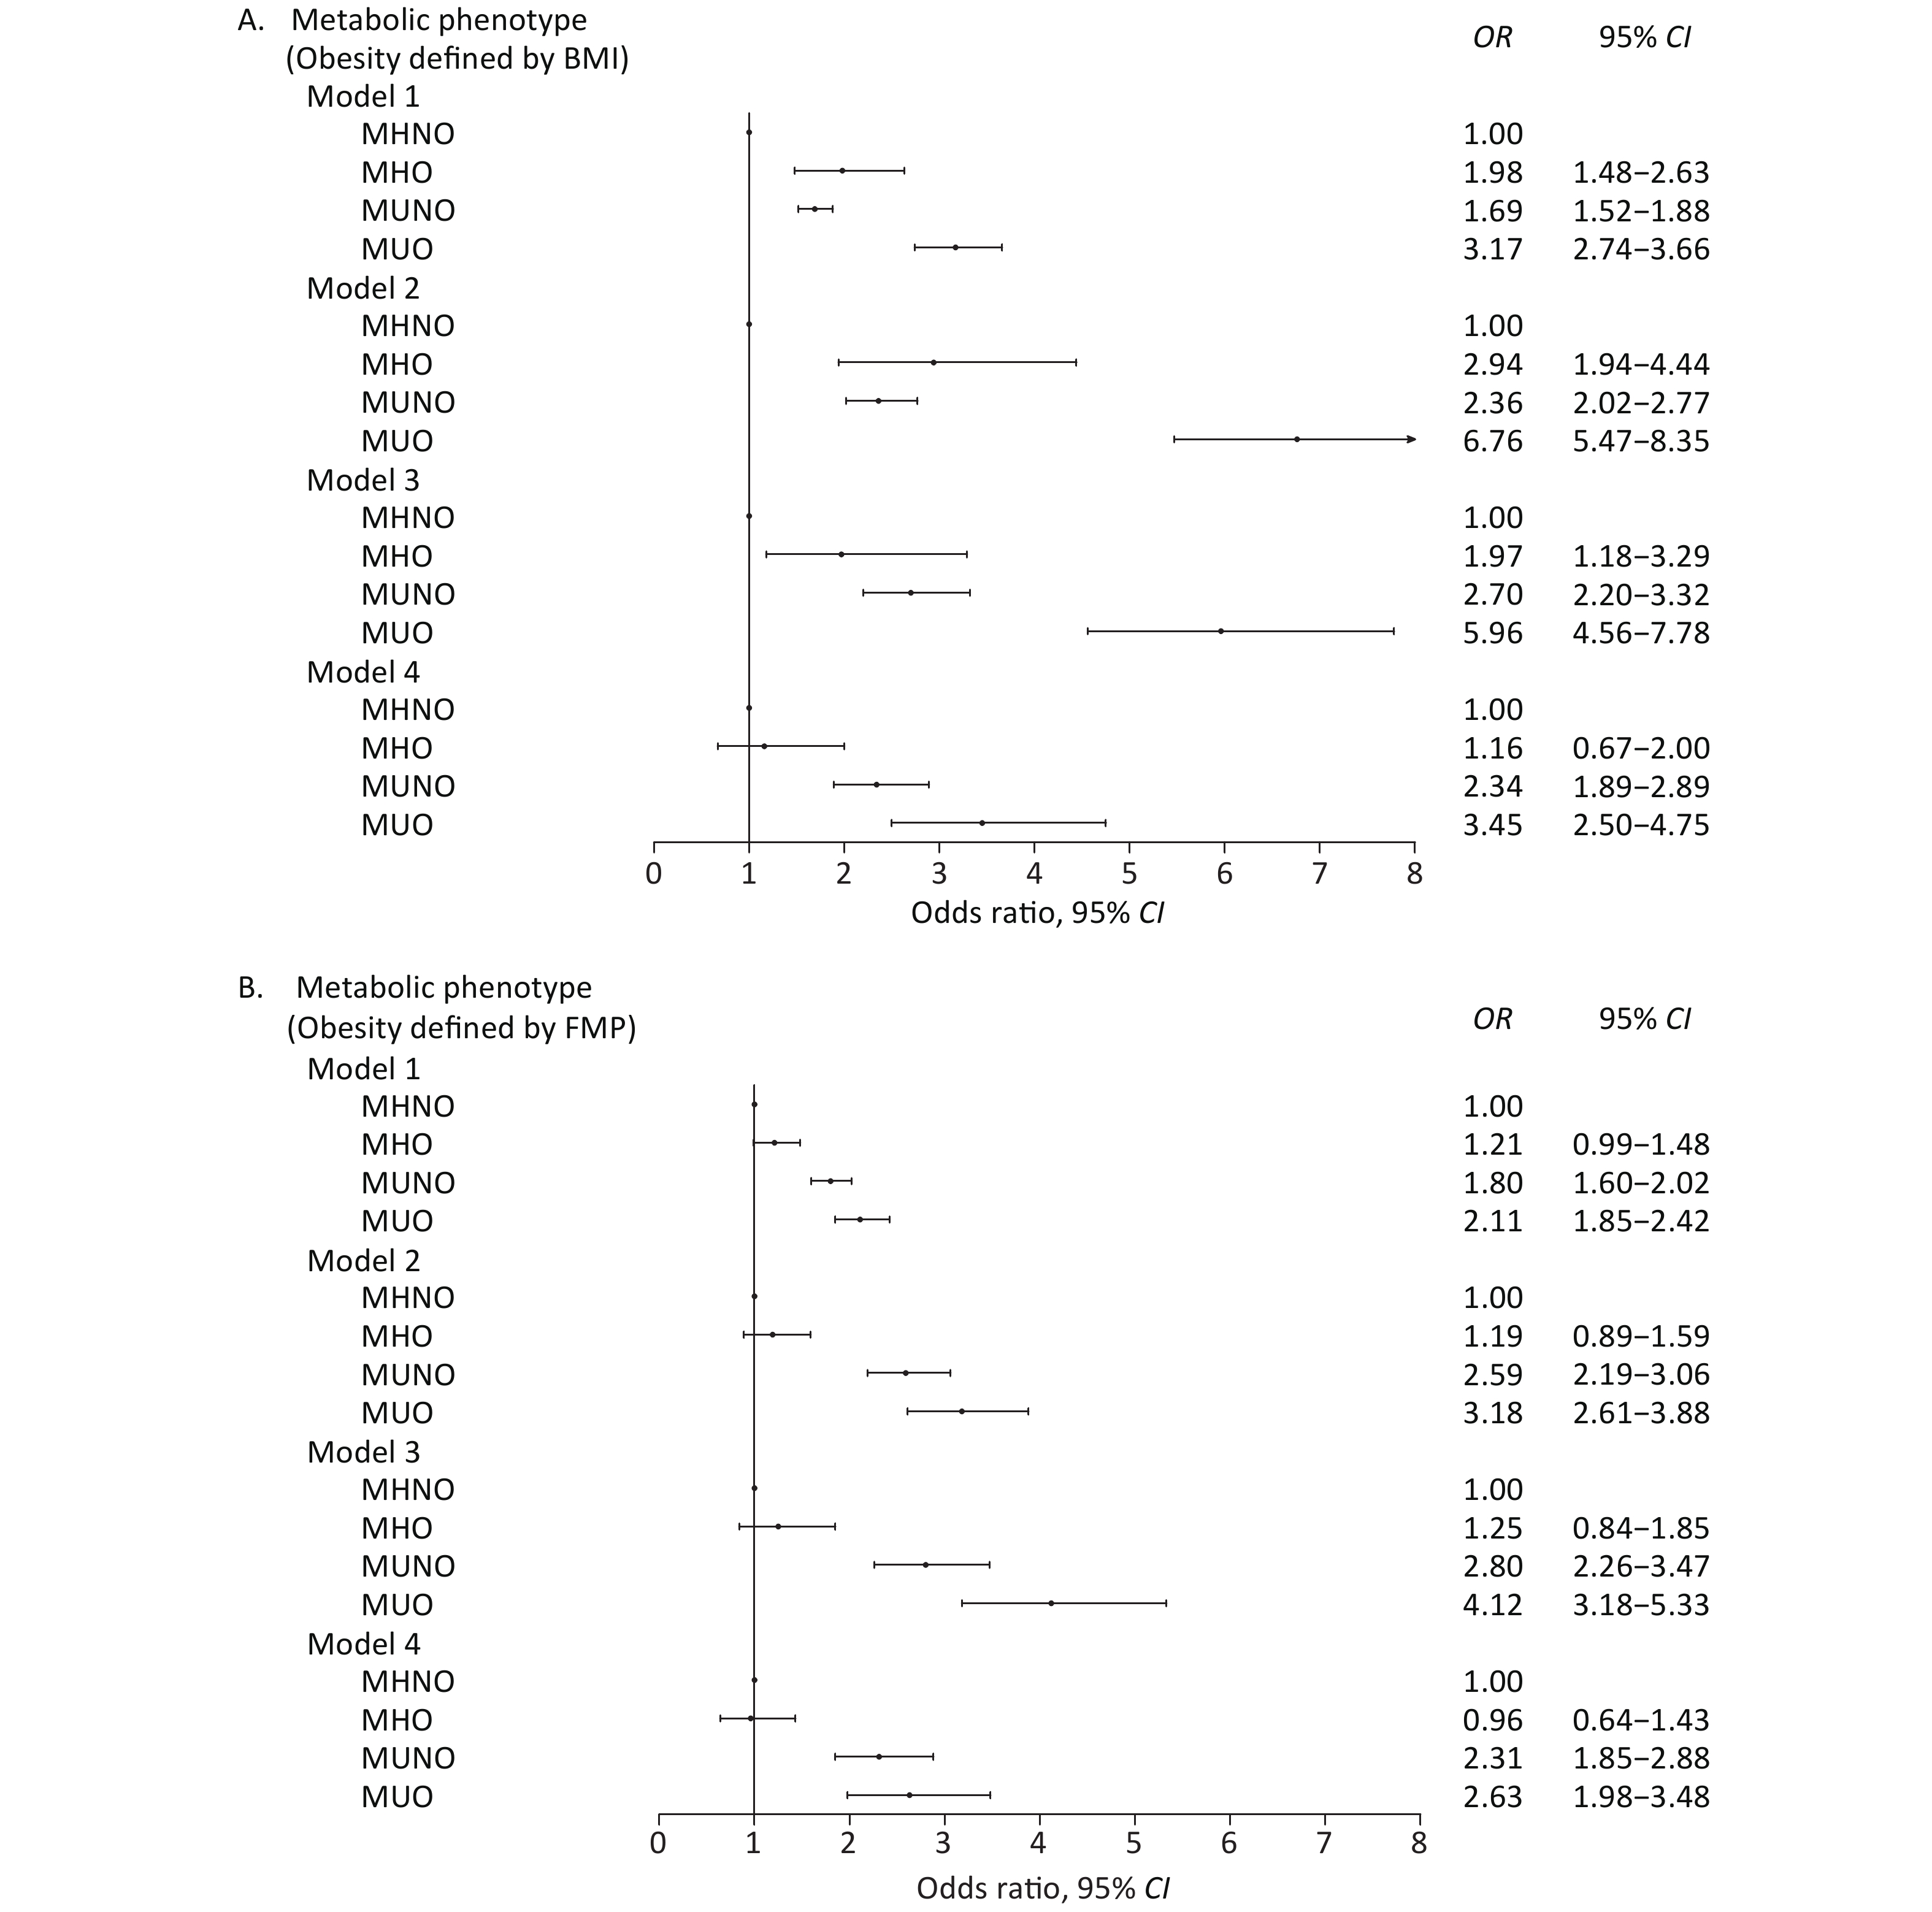
The multiple linear regression models shown in Table 2 yielded β, which is the slope coefficient used for the prediction of the CVD risk score. After adjusting for sex, age, alcohol drinking, education, physical activity, marital status, race, smoking, and geographical location in model 3, CVD risk of all the three metabolic phenotypes increased compared with the MHNO phenotype in both BMI- and FMP-defined obesity models. After further adjusting for WC, the effect of the MHO phenotype on CVD risk disappeared. The effects of MUNO and MUO on CVD risk were higher than those of MHNO and MHO (Table 2). From the logistic regression analyses, in the BMI-defined obesity model, CVD risks of MHO, MUNO, and MUO significantly increased from model 1 to model 3 compared with the MHNO phenotype. In model 4, after further adjustment for WC, the MHO phenotype was no longer associated with CVD risk, whereas MUNO and MUO were still risk factors for CVD compared with the MHNO phenotype (Figure 1A). In the FMP-defined obesity model, MHO was not associated with CVD risk regardless of adjusting for any covariates in the four models; however, the other two phenotypes were significantly associated with CVD risk compared with the MHNO phenotype (Figure 1B).
Metabolic phenotype β Model 1 Model 2 Model 3 Model 4 BMI-defined obesity MHNO − − − − MHO 0.673* 0.430* 0.276* −0.003 MUNO 0.465* 0.265* 0.244* 0.173* MUO 1.027* 0.675* 0.540* 0.239* Adjusted R2 0.066* 0.713* 0.756* 0.767* FMP-defined obesity MHNO − − − − MHO 0.235* 0.085* 0.140* 0.025 MUNO 0.496* 0.293* 0.259* 0.177* MUO 0.738* 0.407* 0.414* 0.213* Adjusted R2 0.048* 0.702* 0.753* 0.767* Note. *P < 0.05. Model 1: Non-adjusted. Model 2: Adjusted for sex and age. Model 3: Model 2 + adjusted for sex, age, alcohol drinking, education, physical activity, marital status, race, smoking, geographical location. Model 4: Model 3 + adjusted for waist circumference. MHNO, metabolically healthy non-obese; MHO, metabolically healthy obese; MUNO, metabolically unhealthy non-obese; MUO, metabolically unhealthy obese. Table 2. Association between metabolic phenotypes and ten-year CVD risk score
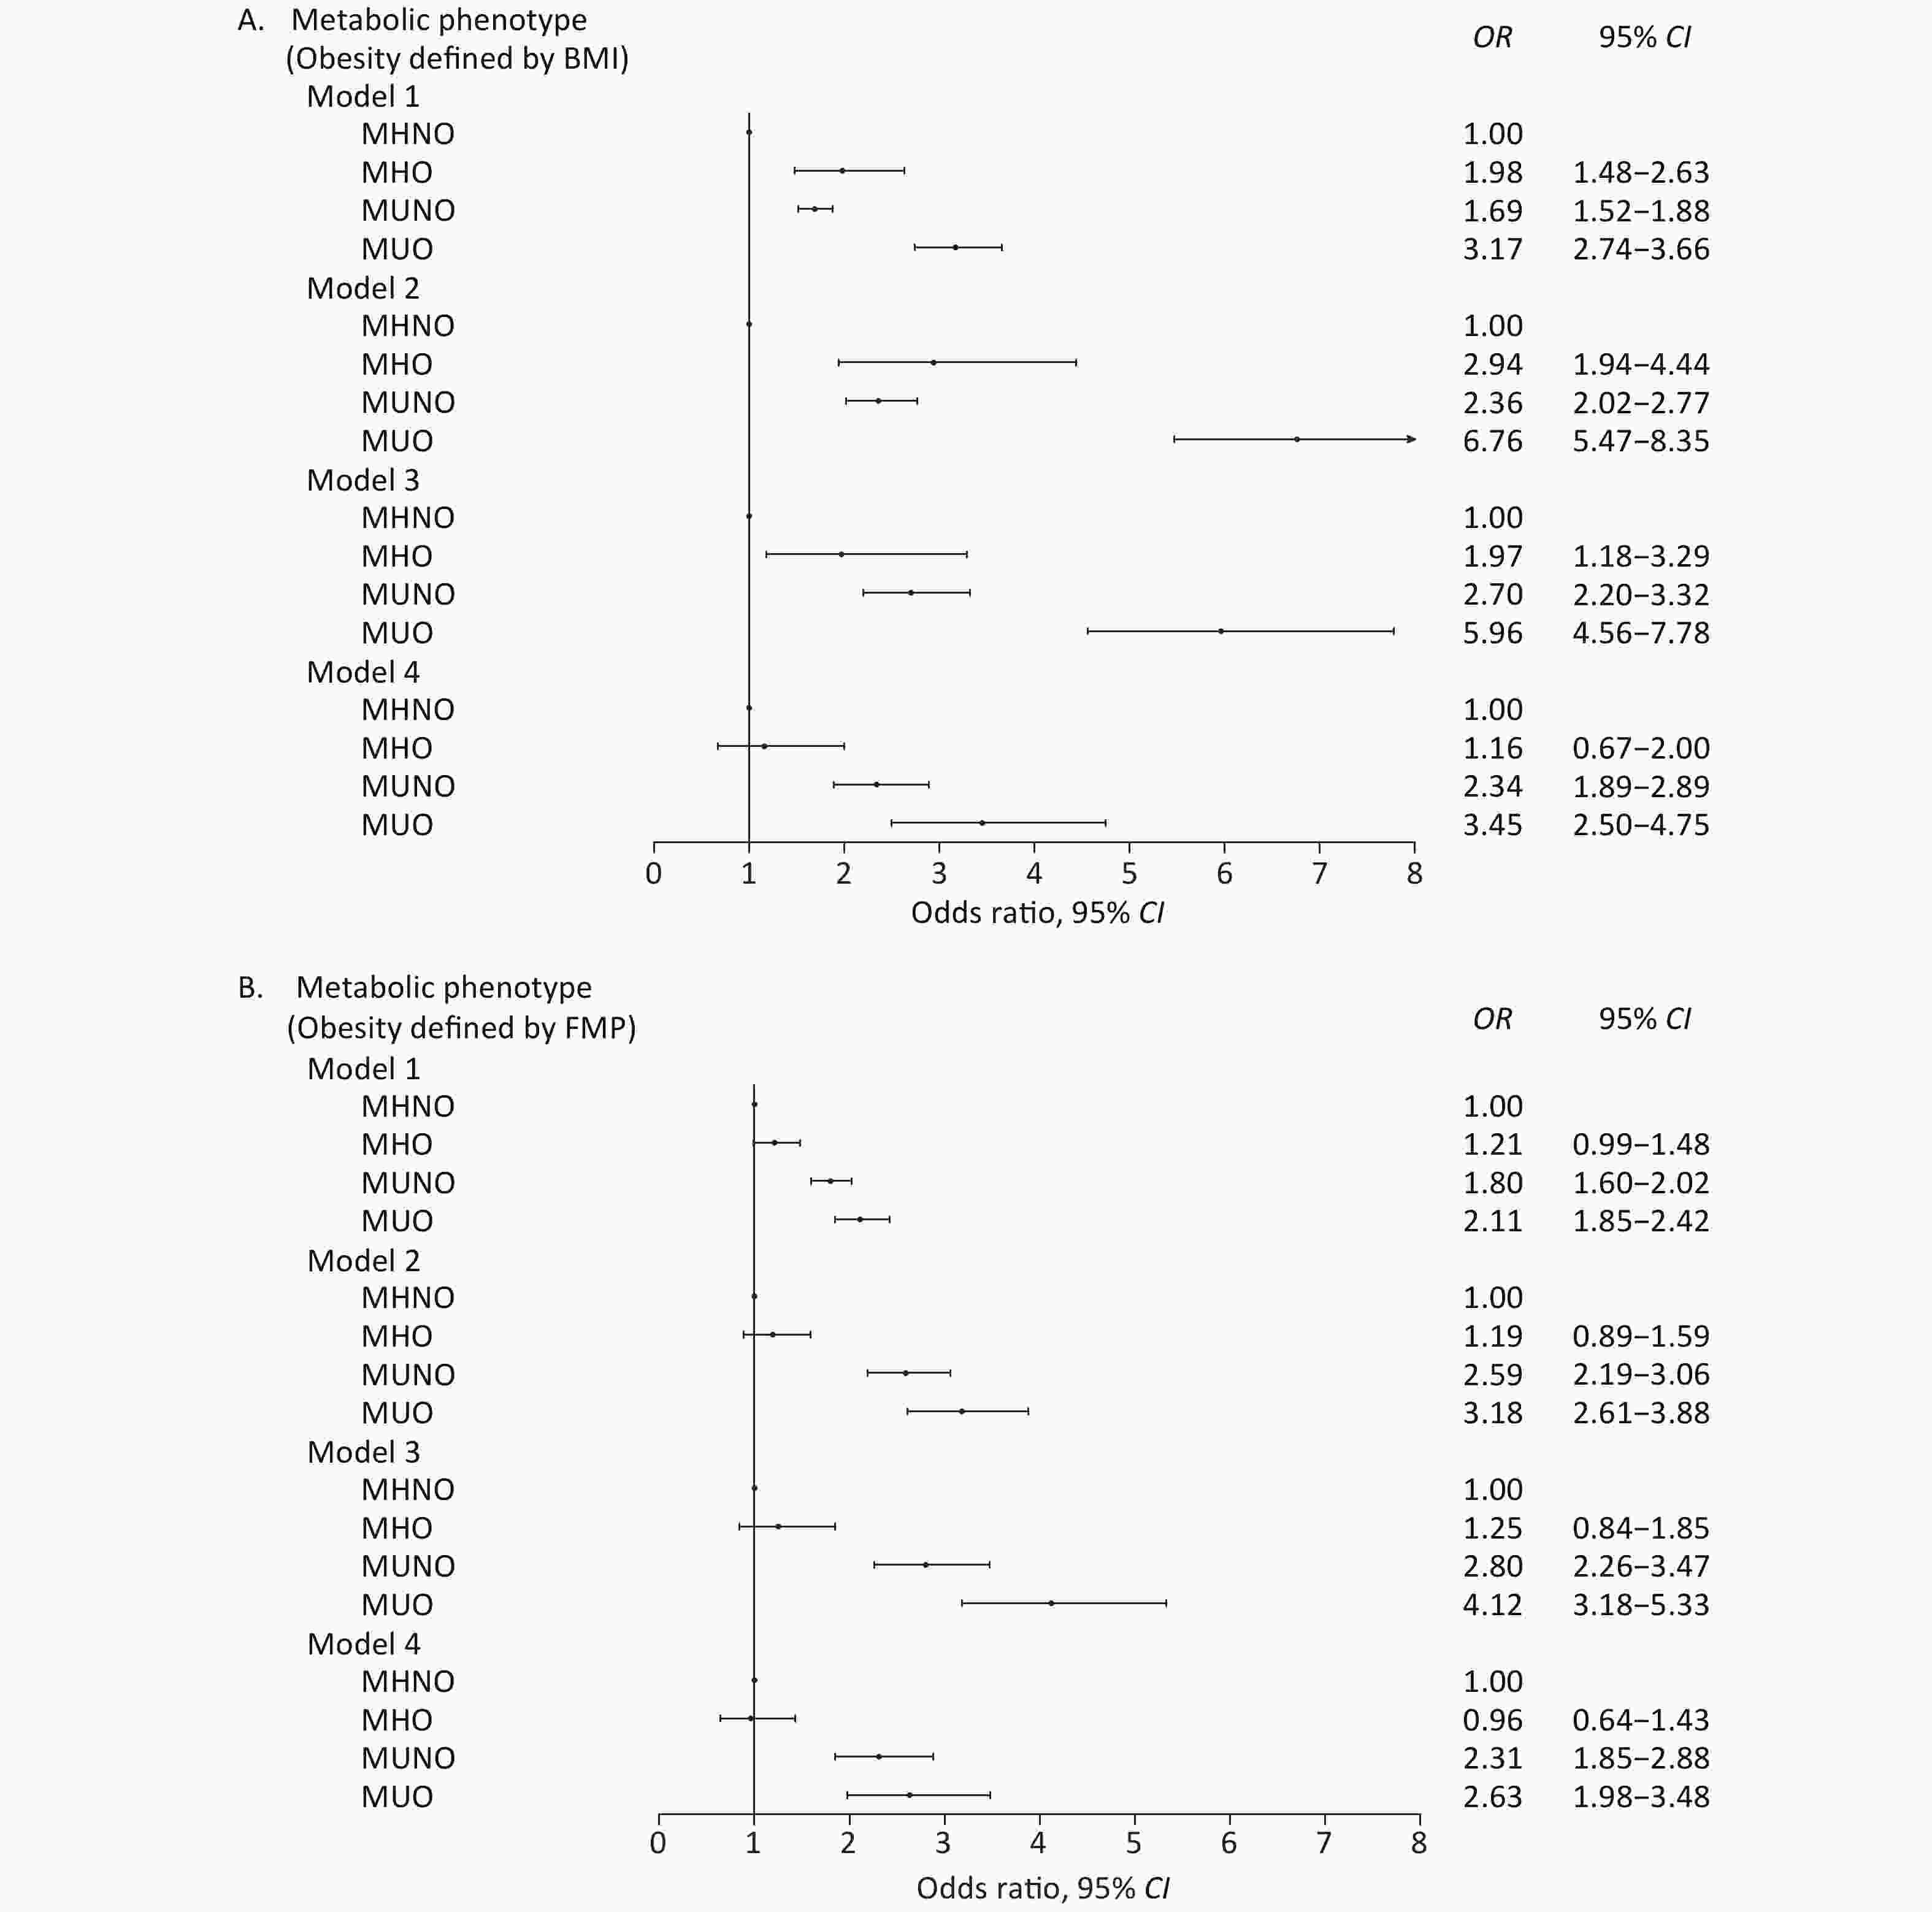
Figure 1. Forest plot of metabolic phenotypes and CVD risk. (A) BMI-defined metabolic phenotypes and CVD risk. (B) FMP-defined metabolic phenotypes and CVD risk. Model 1: Non-adjusted. Model 2: Model 1 + adjusted for sex and age. Model 3: Model 2 + adjusted for sex, age, alcohol drinking, education, physical activity, marital status, race, smoking, and geographical location. Model 4: Model 3 + adjusted for waist circumference. MHNO, metabolically healthy non-obese; MHO, metabolically healthy obese; MUNO, metabolically unhealthy non-obese; MUO, metabolically unhealthy obese.
The subgroup analyses (Tables 3 and 4) were performed with stratification by sex, age, smoking, alcohol drinking, physical activity, and geographical location. In the BMI-defined obesity model, no significant difference was found among each factor between the MHO and MHNO phenotypes, except for alcohol drinking. However, the MUNO and MUO phenotypes were significantly different from the MHNO phenotype. For each factor, the CVD risk of MUNO or MUO was higher than that of MHNO when adjusting for the covariates, except for the categorical variables. In the FMP-defined obesity model, the factors of the MHO phenotype were not significantly different from those of the MHNO phenotype, except for the age group (< 60). The MUNO and MUO phenotype groups were more greatly associated with CVD risk than the MHNO phenotype for each of the factors.
Group OR (95% CI) MHNO MHO MUNO MUO Sex Male 1.00 1.44 (0.76–2.71) 2.21 (1.75–2.79) 3.32 (2.26–4.87) Female 1.00 0.74 (0.23–2.33) 3.72 (2.19–6.30) 4.60 (2.35–9.01) Age < 60 1.00 1.49 (0.78–2.85) 2.42 (1.84–3.18) 2.94 (2.00–4.32) ≥ 60 1.00 0.61 (0.28–1.33) 1.52 (1.16–2.00) 1.84 (1.18–2.87) Smoking No 1.00 1.35 (0.63–2.88) 2.84 (2.07–3.90) 4.48 (2.83–7.10) Yes 1.00 1.01 (0.44–2.31) 2.01 (1.51–2.67) 2.83 (1.78–4.51) Alcohol drinking No 1.00 0.58 (0.27–1.23) 1.98 (1.50–2.61) 3.32 (2.18–5.05) Yes 1.00 2.78 (1.26–6.15) 2.95 (2.11–4.11) 3.68 (2.21–6.13) Physical activity No 1.00 0.74 (0.35–1.58) 2.48 (1.87–3.28) 3.00 (1.94–4.65) Regular 1.00 1.94 (0.87–4.35) 2.17 (1.57–2.99) 4.19 (2.59–6.78) Geographical location Southern China 1.00 1.26 (0.33–4.82) 2.33 (1.76–3.09) 3.39 (2.00–5.75) Northern China 1.00 1.05 (0.59–1.86) 2.33 (1.82–2.97) 3.23 (2.27–4.61) Note. Except for the group factor, all other factors were adjusted in the above 6 models. BMI, body mass index; CVD, cardiovascular disease; MHNO, metabolically healthy non-obese; MHO, metabolically healthy obese; MUNO, metabolically unhealthy non-obese; MUO, metabolically unhealthy obese. Table 3. Odds ratios of metabolic phenotypes defined by BMI on CVD risk stratified by sociodemographic and lifestyle factors
Group OR (95% CI) MHNO MHO MUNO MUO Sex Male 1.00 1.38 (0.83–2.31) 2.26 (1.78–2.86) 2.56 (1.84–3.58) Female 1.00 0.62 (0.26–1.48) 3.56 (1.82–6.93) 2.88 (1.44–5.76) Age < 60 1.00 1.93 (1.05–3.52) 2.40 (1.83–3.15) 3.68 (2.58–5.
6)≥ 60 1.00 0.69 (0.43–1.10) 1.41 (1.03–1.92) 1.55 (1.07–2.25) Smoking No 1.00 1.02 (0.58–1.81) 2.81 (1.99–3.96) 3.18 (2.11–4.81) Yes 1.00 1.03 (0.58–1.83) 2.05 (1.53–2.75) 2.24 (1.50–3.35) Alcohol drinking No 1.00 0.63 (0.38–1.06) 2.00 (1.49–2.69) 2.02 (1.40–2.92) Yes 1.00 1.89 (0.98–3.65) 2.74 (1.96–3.83) 3.67 (2.35–5.74) Physical activity No 1.00 0.98 (0.56–1.72) 2.43 (1.81–3.26) 3.24 (2.24–4.70) Regular 1.00 0.89 (0.50–1.59) 2.15 (1.53–3.03) 1.99 (1.29–3.07) Geographical location Southern China 1.00 1.17 (0.70–1.96) 2.53 (1.84–3.46) 2.22 (1.50–3.29) Northern China 1.00 0.86 (0.54–1.38) 2.27 (1.76–2.93) 2.60 (1.88–3.59) Note. Except for the group factor, all other factors were adjusted in the above 6 models. FMP, fat mass percentage; CVD, cardiovascular disease; MHNO, metabolically healthy non-obese; MHO, metabolically healthy obese; MUNO, metabolically unhealthy non-obese; MUO, metabolically unhealthy obese. Table 4. Odds ratios of metabolic phenotypes defined by FMP on CVD risk stratified by sociodemographic or lifestyle factors
-
In this nationwide representative sample of Chinese adults, we investigated the association of metabolic phenotypes with 10-year CVD risk and found that the BMI-defined MHO phenotype group was associated with a higher CVD risk compared with the MHNO phenotype group before adjusting for WC. However, the association disappeared after further adjustment of WC. The FMP-defined MHO phenotype group was not associated with CVD risk compared with the MHNO phenotype group, regardless of adjusting for any covariates. WC might mediate the association of the BMI-defined MHO phenotype with CVD risk. Compared with the MHNO phenotype group, the 10-year CVD risk of the MUNO and MUO phenotype groups defined by BMI or FMP were both significant, even when excluding the effect of WC.
A few studies have examined the relationship of metabolic syndrome with BMI categories and reported that compared with normal-weight adults, those with a greater BMI have a significantly higher prevalence of metabolic syndrome [26, 27]. In our study, we further took into account both BMI categories and the metabolic health status and found that the CVD risk of the MHO phenotype group was higher than that of the MHNO phenotype group in the robust model as well as the model adjusted for sociodemographic and lifestyle covariates. However, after further adjusting for WC, the effect of the MHO phenotype group on CVD risk disappeared. This result was consistent with the finding of a study conducted in the United States, which is that the MHO phenotype group does not have a significant effect on the Framingham CVD risk score compared with the MHNO phenotype group [28]. According to the World Health Organization, obesity is defined as excessive body fat accumulation that could impair health. When evaluating obesity, we used BMI and the appropriate cut-offs. Although BMI is a measure of overall adiposity, it does not distinguish body fat and fat-free mass from the distribution of fat, which can be quantified by imaging techniques [29]. In addition, WC is an indicator of abdominal fat deposition [30]. When the effect of WC was adjusted, the MHO phenotype was not significantly associated with CVD risk; however, the MUNO and MUO phenotype groups were significantly associated with CVD risk. Hence, WC might increase CVD risk if obese people are accompanied by central obesity. Although such individuals are metabolically healthy, CVD risk increases. Our study further evaluated FMP-defined obesity and found that the MHO phenotype was not associated with CVD risk, although WC was not excluded. Therefore, in the evaluation of CVD risk associated with obesity, fat mass might be a better indicator than BMI. Our findings also suggest that people who are metabolically unhealthy have increased CVD risk, even if they are not obese [28]. Being metabolically unhealthy is a significant risk factor of CVD, and it plays an important role in CVD development. Hence, the metabolic status is more important than the weight status in predicting CVD risk. Moreover, the MUO phenotype has a higher CVD risk than the MHNO phenotype. What is different in our results from other studies is that the MUNO phenotype has the highest risk of cardiometabolic disease or death [13, 31–34]. Being obese and metabolically unhealthy increases CVD risk, and hence, theoretically, the MUO phenotype should be the most significant risk factor for CVD.
We further performed a subgroup analysis of sociodemographic or lifestyle factors and defined obesity based on BMI and FMP. The association of MUNO and MUO with CVD risk is significant compared with the MHNO phenotype. The results are consistent for each factor. Obesity and metabolic status have a synergistic effect on CVD risk.
This study provides a comprehensive estimate of the prevalence and CVD risk in metabolic phenotypes according to BMI or FMP at the national level. Our findings can provide insights into the risk stratification given the rising incidence of obesity affecting metabolic health, highlight the needed resources for metabolically unhealthy phenotypes across the BMI or FMP spectra, and guide public health efforts. In future public health applications, in addition to traditional BMI indicators, health assessment should be performed in conjunction with body fat assessment.
-
The strengths include the use of a large, nationally representative survey with objective body measures and metabolic risk factors, using a rigorously standardized protocol and quality control, and evaluation of metabolic phenotypes according to BMI or FMP in addition to obesity and metabolic health. This study has several limitations. First, this is a cross-sectional study, which limits the ability to determine the true relationship between metabolic phenotypes and CVD risk. Second, although we used FMP to evaluate obesity, there is no approved reference of FMP specific for the Chinese population. Therefore, we used a cut-off widely used from a systematic review, which comprised research data from the Chinese population [21]. Similarly, there is no universally accepted definition of metabolic health. We used the metabolic parameters proposed by the IDF to measure metabolic syndrome. Future studies might incorporate insulin resistance and low-grade chronic inflammation to assess metabolic health and focus on the body or regional fat mass to evaluate the effect of obesity on CVD at the national level. Third, BIA was used to measure body fat mass, which was not the gold standard. However, it was widely used in large-scale population surveys. Finally, some variables were used in achieving the CVD risk score simultaneously, and they were also used in the categorized metabolic phenotypes. Therefore, it might exaggerate the relationship between metabolic phenotype and CVD risk. However, there was no multicollinearity and it might minimize the bias.
In conclusion, general obesity without central obesity does not increase CVD risk in metabolically healthy individuals. FMP-defined obesity might be a more meaningful factor for the evaluation of CVD risk. Obesity and metabolic status have a synergistic effect on CVD risk. In the evaluation of CVD risk in obesity, WC and body fat should be used in combination with BMI.

Funds:
This study is supported by the Beijing Hospitals Authority Youth Programme [QML20191302] and the Basic Performance Key Project by the Ministry of Science and Technology of the People’s Republic of China [No. 2006FY110300]

 Quick Links
 DownLoad: