


-
C ardiovascular diseases (CVDs) are the top leading cause of global mortality and have been regarded as one of the greatest threats to human health [1]. Evidence suggested the continuing rise in the annual number of CVD cases in China [2]. As it affects 31.1% of the adult population worldwide [3], hypertension (HTN) has become an important public health challenge in China in the past decades [4]. Previous epidemiologic studies have identified tobacco use, sodium intake, and physical inactivity as major behavioral contributors to CVD [5] and HTN [6]; other factors remain insufficiently explored. Recently, emerging evidence [7-9] has revealed that sleep is possibly associated with the development of CVD and HTN, but the contribution of daytime napping has not been fully investigated in epidemiologic studies.
Daytime napping, or siesta, is considered a common practice and a healthy habit [10]. A previous study demonstrated that the prevalence of regular napping (at least once a week) varied from 30% to 70% in many countries within South America, the Middle East, and Southeast Asia [11]. In China, the prevalence of habitual napping usually increases with age, corresponding to 61.7% and 46.8% in men and women aged 60 years or older [12]. Although most people consider taking naps a beneficial strategy in fighting fatigue, the effects of different patterns of napping (e.g., frequency and duration) on human health are less known.
Recent studies have demonstrated associations between daytime napping and a series of adverse health outcomes, including diabetes mellitus [13], metabolic syndrome [14], breast cancer[15], and all-cause mortality [16]. In terms of CVDs, there is an ongoing controversy regarding whether daytime napping is a risk factor for CVDs abroad and at home. Specifically, nap-CVD associations were reported in some developed countries, such as Japan [17], the United States[18], Israel [19], and Germany [20]. However, several studies have revealed the protective effects of siestas on CVDs [21, 22] or null associations of napping with CVD [23-25]. In China, several investigations have linked nap with an elevated risk of CVDs by enrolling a regional cohort (e.g., Dongfeng-Tongji cohort) [12, 26] or cross-sectional samples from local areas [27]; however, a community-based study in an older rural population [28] identified no significant associations of HTN with daytime napping. Notably, no nationwide cohort evidence is available to date from a representative Chinese population. In this study prospective cohort study in a national Chinese survey sample, we aimed to evaluate the association of CVDs with daytime napping and provide scientific evidence into future effective interventions designed to reduce CVD incidences.
-
The data were derived from China Family Panel Studies (CFPS), a representative and comprehensive ongoing nationwide longitudinal social survey of Chinese communities, families, and individuals launched by the Peking University Institute of Social Science Survey in 2010 [29]. In this survey, the samples at baseline were enrolled from 162 county-level units from 25 provinces and municipalities, accounting for 94.5% of the national population (Figure 1). The CFPS survey was conducted on average every 2 years and has released the baseline dataset in 2010 and four waves of follow-up data (CFPS 2012, 2014, 2016, and 2018); however, the CFPS 2018 was not fully publicly accessed at the time of our study. Baseline questionnaire survey interviewed 14,960 households and 42,590 individuals, with successful tracking rates of 85%, 89%, and 89% in 2012, 2014, and 2016 follow-ups, respectively. Trained investigators performed face-to-face interviews aided by computer-assisted personal interviewing technology.
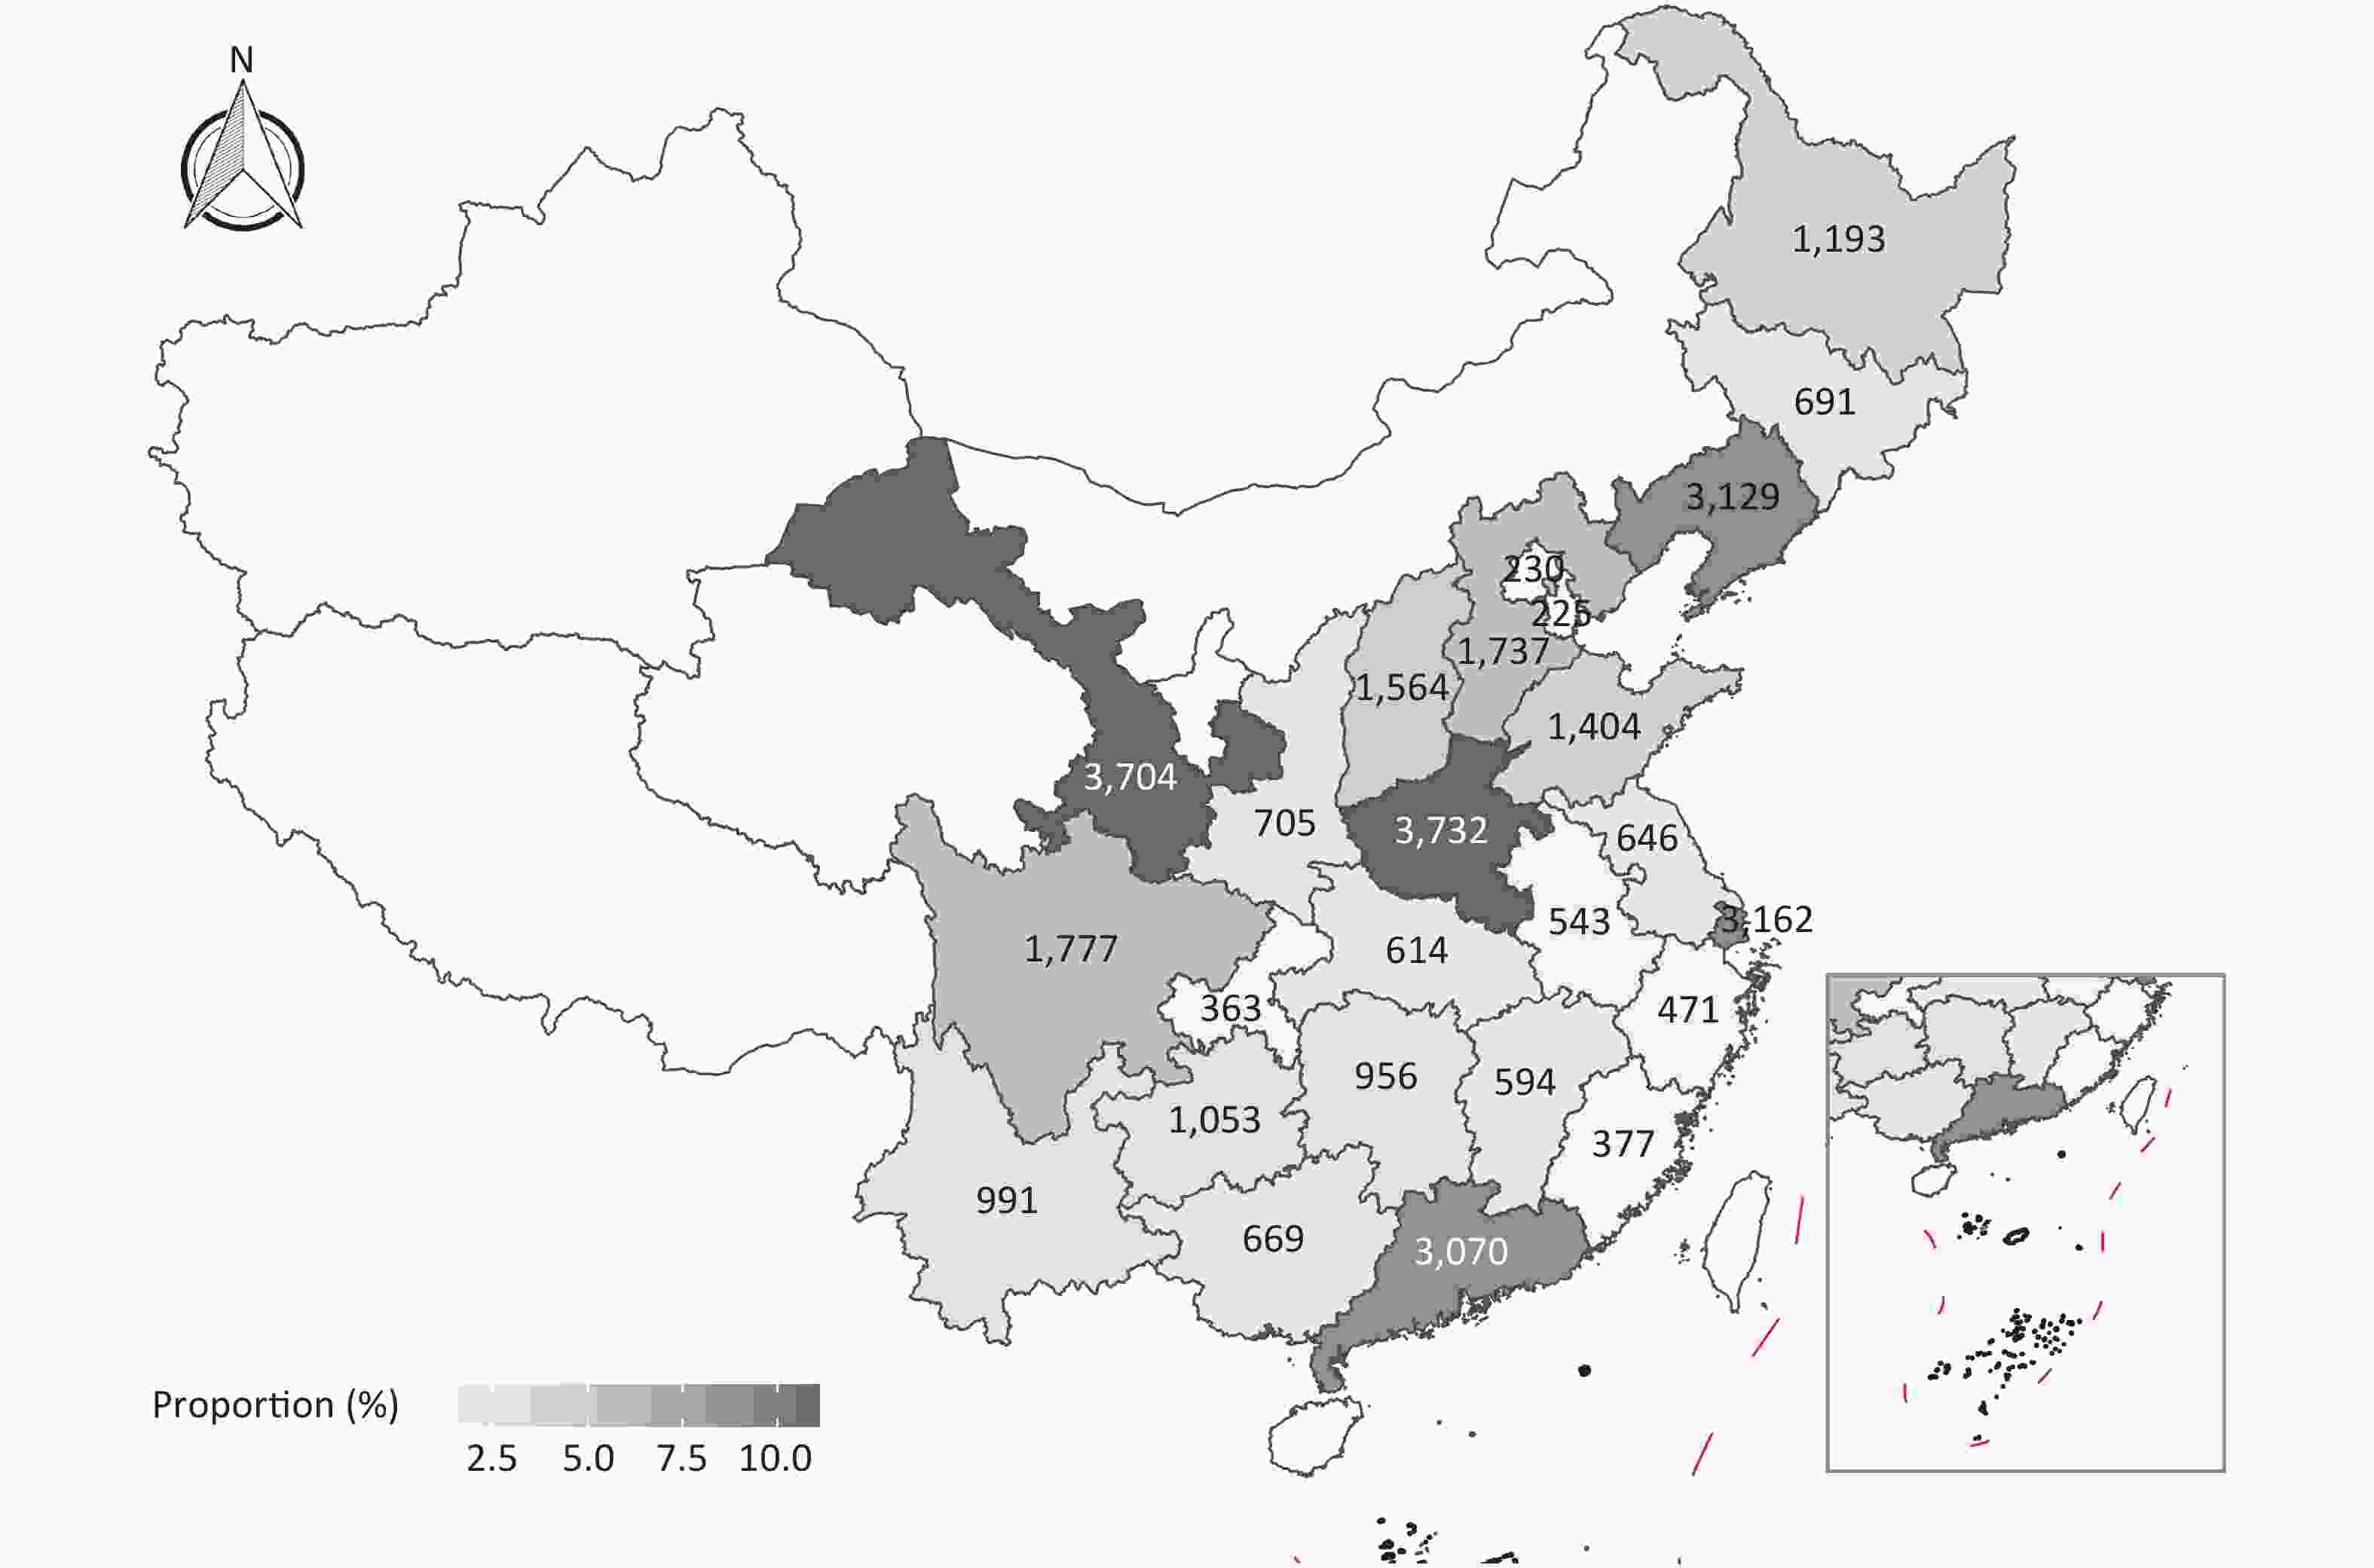
Figure 1. Distribution of adult samples at baseline.
All participants signed informed consent forms. The investigation was ethically approved by the Peking University Biomedical Ethics Review Committee (Approval No. IRB00001052-14010). Additional details on sampling and design could be found in prior publications [30] and are available at the Peking University Open Research Data Platform (
https://opendata.pku.edu.cn/dataverse/CFPS/ ). -
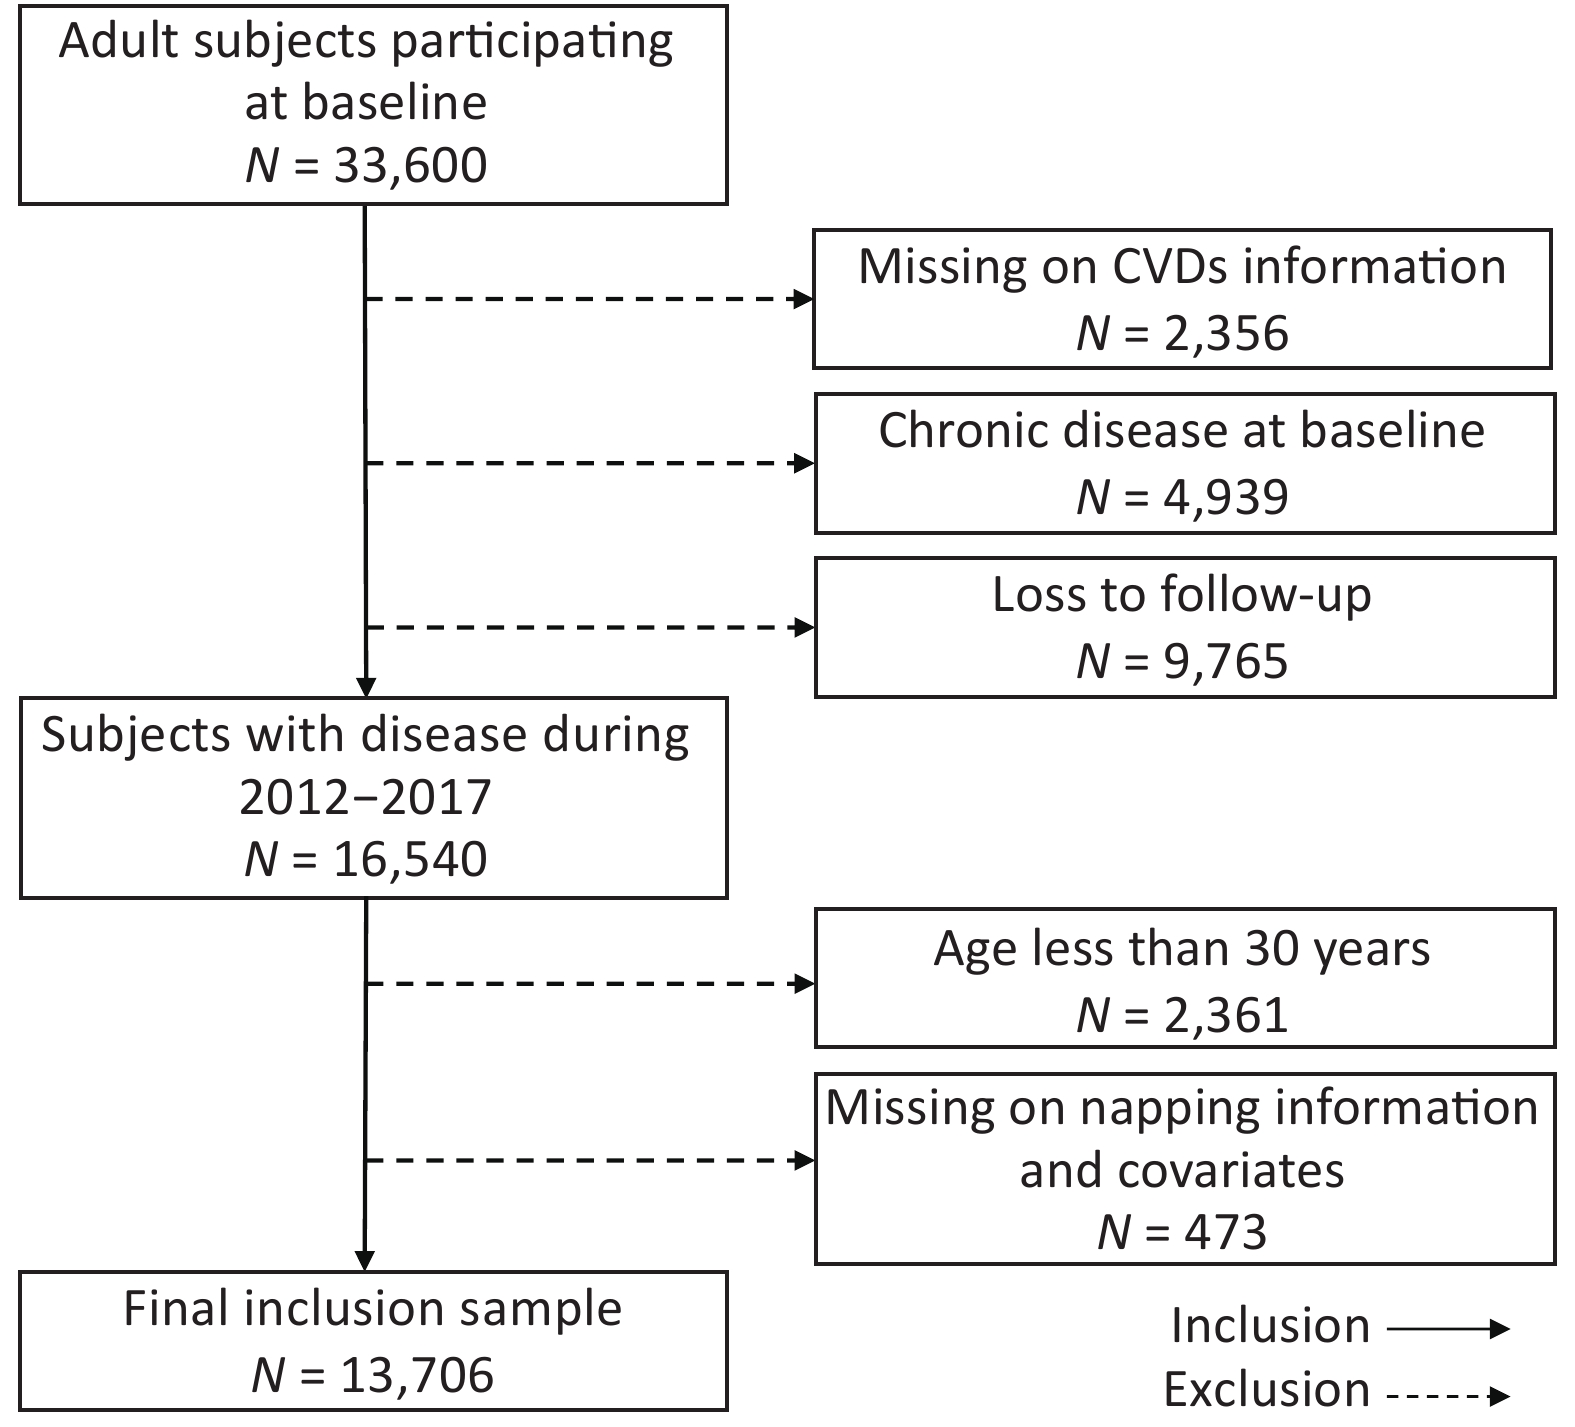
In this study, we used four waves of CFPS adult datasets (2010, 2012, 2014, and 2016). A total of 33,600 participants (age 16–105 years) completed the baseline questionnaire in 2010. The following exclusion criteria were applied to conceive a cohort design investigating nap-CVD associations in Chinese adults: (1) missing CVD information at baseline (n = 2,356), (2) self-reported chronic diseases at baseline (n = 4,939), (3) loss to follow-up (n = 9,765), (4) age < 30 years (n = 2,361), and (5) missing on napping information and covariates (n = 473). Finally, a cohort of 13,706 participants from 2010 to 2017 was included in our study (Figure 2).

Figure 2. Inclusion process of our nap-CVD cohort study from CFPS adult datasets 2010–2017.
-
Self-reported napping habits and nap duration were ascertained based on these questions: “Do you have the habit of taking afternoon naps?” “If yes, how long a nap do you usually take?” Daytime napping was classified into four categories: 0 min (no napping), < 30 min, 30 to 60 min, and ≥ 60 min. Based on a scientific clinical trial that recommended a minimum nap time of 30 min/day for human health[31] and previous similar studies on the classification of napping duration [12], we regarded napping < 30 min and ≥ 30 min as short and long naps, respectively. The nocturnal sleep duration was also calculated by subtracting previously obtained nap duration from the total daily sleep time in the questionnaire. Nighttime sleep duration was categorized into three groups: < 6 h, 6–8 h, and ≥ 8 h [32].
-
The occurrence of CVDs was determined by asking the following question: “During the past 6 months, have you had any doctor-diagnosed chronic diseases?” The respondents have CVD if they answered “yes” to the above question and could list two major chronic diseases. According to the Disease Classification Codebook and Text Coding Technical Report for Chinese Family Panel Studies, we defined three cardiovascular events as health outcomes of interest for the analysis: (1) total CVD, including but not limited to HTN and stroke, (2) HTN, and (3) stroke. We did not include other subtypes of CVD for analysis because these incident cases were rare during the follow-up periods. We redefined the date of diagnosis as the intermediate time point between the last interview date and the next visit date during the predefined follow-up period. Previous studies have reported the validity of self-reported and physician-diagnosed chronic diseases [33]. Person-years of follow-up were calculated as the interval from the dates of baseline interviews (2010 or 2011) to the dates of the final follow-up interviews (2016 or 2017) or the occurrence of a CVD event.
-
Standardized questionnaires were used to obtain information about demographic and socioeconomic factors and lifestyle behaviors. Demographic and socioeconomic status included gender (male and female), age (30–44, 45–59, and ≥ 60 years), body mass index (BMI) (underweight, < 18.5 kg/m2; normal, 18.5–23.9 kg/m2; overweight, 24–27.9 kg/m2; obese, ≥ 28 kg/m2), ethnicity (Han and minority), marital status (married, widowed, and single), residential region (urban and rural areas), geolocation (north and south), educational attainment (illiterate, 1–6, 7–12, and > 12 years), employment status (current, former, and never), and annual household income (RMB) (low, 0–15,000; medium, 15,000–40,000; high, ≥ 40,000). Behavioral factors also were assessed, including physical activity (0, 1–150, and > 150 min/week), smoking status (yes and no), and alcohol consumption (yes and no). Specifically, BMI was calculated by dividing weight in kilograms by the square of height in meters and grouped according to the guidelines for prevention and control of overweight and obesity in Chinese adults [34]. The northern and southern regions were divided according to China’s geographical boundaries, namely, the Qinling Mountains and Huai River. Moderate physical exercise was defined as at least 1–150 min/week of physical activity based on 2020 WHO physical activity guidelines [35] and Chinese Dietary Guideline (2021) (
http://dg.cnsoc.org/ ). Smoking and drinking status were assessed with the question: “Have you used at least one cigarette/drink alcohol during the recent month?” and “Have you ever smoked/drunk alcohol?” [36, 37]. -
Baseline characteristics of the participants were described using mean ± SD (standard deviation) for continuous variables (e.g., age and BMI) and percentages for categorical covariates (e.g., gender, ethnicity, and educational attainment) among nappers (< 30, 30–60, and ≥ 60 min) versus non-nappers. Cox frailty models with random intercepts for surveyed provinces were applied to calculate the adjusted hazard ratios (HRs) and to account for clustering within provinces [38]. A previous epidemiologic study applied Cox frailty models to explore the effects of sleep on mortality and morbidity outcomes [11]. The global test for proportional hazards assumption in the adjusted Cox model was verified by evaluating the weighted Schoenfeld residuals, and we detected no violations with all P values > 0.05 [39]. In our nap-CVD analyses, we used (1) age- and gender-adjusted model and (2) multivariate models adjusting for gender, age, BMI, ethnicity, marital status, residential region, educational attainment, employment status, annual household income, physical activity, smoking status, alcohol consumption, and sleep duration.
We also conducted subgroup analyses by gender (male versus female), age (< 50 versus ≥ 50 years), BMI (< 24 versus ≥ 24 kg/m2), residential region (urban versus rural area), geolocation (north versus south), physical activity (no versus yes), smoking status (no versus yes), alcohol consumption (no versus yes), and sleep duration (< 7 versus ≥ 7 h/night). The BMI cut-off value of 24 kg/m2 was in line with the Chinese adults’ standard of WS/T 428–2013 proposed by the Working Group on Obesity [40]. The joint consensus statement of the American Academy of Sleep Medicine and Sleep Research Society suggested an optimal sleep duration of 7 h per day [41], and we defined short and long sleep duration using 7 h/night as a cut-off point. P for trend was calculated to examine the linear trend between CVDs and nap duration in the overall and subgroup analyses.
Several sensitivity analyses were performed to check the robustness of the main findings by changing regression modeling choices. To address the potential reverse causation that relatively unhealthy individuals may disturb nap patterns, first, lagged analysis was conducted by excluding individuals who developed the interested outcomes 1 year after the baseline survey [9]. Second, given that napping is more prevalent in older adults than in younger ones, the analysis was restricted to participants aged < 75 years [42]. Sensitivity analysis was also performed by excluding those who had changed nap behaviors during follow-ups to eliminate the potential influence of temporal changes in daytime-napping behaviors. All nap-CVD associations were reported using HRs and corresponding 95% confidence intervals (CIs). A two-sided P value < 0.05 was considered significant. All statistical analyses were implemented by R software (version 3.6.2, R Foundation for Statistical Computing, Vienna, Austria), using the package “coxme” for Cox frailty modeling.
-
Table 1 describes the baseline characteristics of the adults stratified by napping duration. A total of 13,706 participants (6,676 men and 7,030 women, 49.5 ± 11.3 years old) were involved, with 1,526 CVD, 1,098 HTN, and 413 stroke incidents during the 97,415.82 person-years of follow-up (median follow-up, 6.1 years). The proportions of the population with napping duration of < 30, 30 to 60, and ≥ 60 min were 9.4%, 24.7%, and 15.6%, respectively. More than half of the participants lived in rural communities (56.8%) and were from the northern regions (59.2%). The participants had an average of 6.7 years of academic education, wherein > 20% were illiterate. Approximately 75.6% of adults responded “no” to participating in any physical activity, and over three-fifths were never-smokers (60.9%) and never-drinkers (77.2%). As regards nighttime sleep, participants who reported a sleep duration of < 6 h and ≥ 8 h per night accounted for 18.5% and 25.4%, respectively.
Items Total Nap duration 0 min < 30 min 30 to 60 min ≥ 60 min Population Persons, n 13,706 6,884 1,292 3,383 2,147 Incident CVD, n 1,526 665 147 428 286 Incident HTN, n 1,098 474 97 307 220 Incident stroke, n 413 183 31 132 67 Individual covariates Male, % 48.7 47.7 43.0 50.1 53.1 Age, years 49.5 ± 11.3 49.0 ± 11.3 48.4 ± 11.1 49.9 ± 11.3 50.1 ± 11.5 BMI, kg/m2 22.9 ± 3.3 22.4 ± 3.2 23.0 ± 3.3 22.9 ± 3.3 23.1 ± 3.3 Han ethnicity, % 93.5 91.3 95.6 95.3 95.9 Married, % 93.3 92.8 93.0 93.7 92.9 Urban, % 43.2 43.1 51.1 44.5 36.4 North, % 59.2 51.2 63.5 65.0 73.5 Educational attainment, % Illiteracy 22.4 25.4 15.8 19.0 21.8 1–6 years 26.3 26.2 22.1 26.3 29.0 7–12 years 46.1 44.6 52.6 48.2 46.4 > 12 years 5.2 3.8 9.5 6.5 2.7 Employment status, % Current 55.3 55.0 59.8 53.7 56.1 Former 28.6 27.8 27.3 30.9 28.3 Never 16.1 17.2 12.8 15.5 15.6 Annual household income, % Low 28.8 30.6 23.8 27.1 28.9 Medium 43.4 42.1 45.0 43.6 46.0 High 27.8 27.3 31.2 29.4 25.1 Physical activity, % 0 min/week 75.6 80.2 64.2 70.9 75.1 1–150 min/week 23.9 19.4 34.9 28.6 24.1 > 150 min/week 0.5 0.4 0.9 0.5 0.8 Smoking status, % Yes 39.0 38.1 33.9 39.5 44.8 No 60.9 61.9 66.1 60.5 55.2 Alcohol consumption, % Yes 22.8 21.3 21.5 23.4 27.4 No 77.2 78.7 78.6 76.6 72.7 Sleep duration, % < 6 hours/night 18.5 12.0 12.9 20.0 40.0 6 to 8 hours/night 56.1 57.3 59.2 59.4 45.0 ≥ 8 hours/night 25.4 30.8 27.9 20.6 15.0 Note. Data are presented using mean ± SD for continuous variables and percentages for categorical variables. BMI, body mass index; CVD, cardiovascular disease; HTN, hypertension. Table 1. Baseline characteristics of included participants (n = 13,706) by daytime napping
-
Table 2 outlines the crude and adjusted HRs for the associations between daytime napping and CVD and HTN. Compared with non-nappers, both crude and multivariate models revealed higher risks of incident CVD and HTN in nappers ≥ 30 min and a greater risk of stroke in medium nappers (30–60 min), while no significant associations were found in short nappers (0–30 min). The trend analysis of nap-CVD associations demonstrated significantly elevated incident risks with napping duration. For instance, incident risks increased respectively by 22% (1.22, 1.08–1.39) for CVD and 21% (1.21, 1.04–1.41) for HTN in 30 to < 60 min nappers, with corresponding HRs of 1.27 (1.09–1.47) and 1.38 (1.16–1.65) among nappers ≥ 60 min.
Diseases Groups Age- and gender-adjusted model Multivariate modela HR (95% CI) P value P for trend HR (95% CI) P value P for trend CVD < 0.001 < 0.001 0 min 1 (Ref) 1 (Ref) < 30 min 1.17 (0.98 to 1.40) 0.087 1.07 (0.89 to 1.29) 0.448 30 to 60 min 1.29 (1.14 to 1.46) < 0.001 1.22 (1.08 to 1.39) 0.002 ≥ 60 min 1.36 (1.18 to 1.57) < 0.001 1.27 (1.09 to 1.47) 0.002 HTN < 0.001 < 0.001 0 min 1 (Ref) 1 (Ref) < 30 min 1.12 (0.90 to 1.40) 0.308 1.04 (0.83 to 1.30) 0.752 30 to 60 min 1.29 (1.12 to 1.50) 0.001 1.21 (1.04 to 1.41) 0.012 ≥ 60 min 1.48 (1.25 to 1.75) < 0.001 1.38 (1.16 to 1.65) < 0.001 Stroke 0.140 0.137 0 min 1 (Ref) 1 (Ref) < 30 min 0.89 (0.61 to 1.30) 0.544 0.96 (0.65 to 1.42) 0.845 30 to 60 min 1.39 (1.11 to 1.75) 0.004 1.39 (1.10 to 1.76) 0.006 ≥ 60 min 1.07 (0.80 to 1.43) 0.625 1.04 (0.77 to 1.40) 0.602 Note. aWe adjusted gender, age, BMI, ethnicity, marital status, residential region, geolocation, educational attainment, employment status, annual household income, physical activity, smoking status, alcohol consumption, and sleep duration. HR, hazard ratio; 95% CI, 95% confidence interval. Table 2. Effects of daytime napping on cardiovascular disease
-
Table 3 and Table 4 summarize subgroup-specific estimates for associations of CVD and HTN risks with daytime napping. Overall, evident nap-incidence associations were consistently observed in 30+ min nappers, while nap-associated risks tended to be more profound among nappers with > 1 h/day. Significant trends for greater risks of CVD and HTN associated with longer naps were observed in all strata except for urban dwellers, south, and active physical exercise (Ptrend
> 0.05). Stratified analyses for stroke incidence are presented in Supplementary Table S1 (available in www.besjournal.com), where in associations with medium midday napping existed in female, older participants, underweight adults (BMI < 24 kg/m2), rural and north residents, smokers, non-drinkers, and long sleepers. Subgroup Hazard ratioa (95% CI) P for trend P for interaction < 30 min 30 to 60 min ≥ 60 min Gender 0.640 Male (n = 6,676) 1.03 (0.75 to 1.41) 1.20 (0.98 to 1.46) 1.38 (1.11 to 1.73)** 0.003 Female (n = 7,030) 1.09 (0.87 to 1.37) 1.25 (1.06 to 1.48)** 1.21 (0.98 to 1.49) 0.010 Age, years 0.539 30–49 (n = 7,411) 1.11 (0.80 to 1.55) 1.36 (1.08 to 1.73)** 1.23 (0.91 to 1.65) 0.028 ≥ 50 (n = 6,295) 1.08 (0.86 to 1.35) 1.17 (1.01 to 1.37)* 1.31 (1.10 to 1.56)** 0.001 BMI, kg/m² 0.382 < 24 (n = 9,449) 1.22 (0.96 to 1.57) 1.30 (1.10 to 1.54)** 1.32 (1.08 to 1.62)** 0.001 ≥ 24 (n = 4,257) 0.97 (0.74 to 1.29) 1.15 (0.95 to 1.40) 1.24 (0.99 to 1.55) 0.036 Residential region 0.191 Urban (n = 5,914) 1.00 (0.78 to 1.29) 1.08 (0.90 to 1.30) 1.09 (0.87 to 1.38) 0.344 Rural (n = 7,792) 1.17 (0.89 to 1.53) 1.34 (1.12 to 1.60)** 1.41 (1.15 to 1.72)** < 0.001 Geolocation 0.043 North (n = 8,120) 1.06 (0.84 to 1.34) 1.30 (1.11 to 1.53)** 1.33 (1.11 to 1.60)** < 0.001 South (n = 5,586) 1.11 (0.81 to 1.51) 1.09 (0.88 to 1.35) 1.14 (0.86 to 1.51) 0.283 Physical activity 0.189 Yes (n = 3,345) 1.10 (0.82 to 1.46) 1.11 (0.89 to 1.39) 1.01 (0.76 to 1.34) 0.642 No (n = 10,361) 1.03 (0.80 to 1.32) 1.26 (1.07 to 1.47)** 1.38 (1.16 to 1.65)*** < 0.001 Smoking status 0.790 Yes (n = 5,356) 1.02 (0.71 to 1.46) 1.34 (1.08 to 1.67)* 1.42 (1.12 to 1.81)** 0.001 No (n = 8,350) 1.10 (0.89 to 1.37) 1.18 (1.01 to 1.38)* 1.20 (0.99 to 1.46) 0.020 Alcohol consumption 0.007 Yes (n = 3,121) 1.29 (0.86 to 1.92) 1.11 (0.83 to 1.47) 1.46 (1.08 to 1.97)* 0.031 No (n = 10,585) 1.02 (0.83 to 1.26) 1.26 (1.09 to 1.45)** 1.18 (0.99 to 1.43) 0.001 Sleep duration, hours/night 0.168 < 7 (n = 5,599) 0.96 (0.69 to 1.33) 1.17 (0.96 to 1.42) 1.22 (0.97 to 1.52) 0.357 ≥ 7 (n = 8,072) 1.13 (0.90 to 1.42) 1.30 (1.09 to 1.55)** 1.30 (1.05 to 1.61)** 0.001 Note. aWe adjusted gender, age, BMI, ethnicity, marital status, residential region, educational attainment, employment status, annual household income, physical activity, smo, king status, alcohol consumption, and sleep duration. 95% CI, 95% confidence interval. *P < 0.05; **P < 0.01; ***P < 0.001. Table 3. Subgroup analysis for the association of nap duration with cardiovascular disease
Subgroup Hazard ratioa (95% CI) P for trend P for interaction < 30 min 30 to < 60 min ≥ 60 min Gender 0.670 Male (n = 6,676) 0.87 (0.60 to 1.28) 1.18 (0.94 to 1.48) 1.42 (1.11 to 1.83)*** 0.006 Female (n =7,030) 1.12 (0.84 to 1.49) 1.24 (1.01 to 1.52)** 1.36 (1.06 to 1.73)** 0.006 Age, years 0.092 30–49 (n = 7,411) 1.13 (0.76 to 1.69) 1.45 (1.09 to 1.92)*** 1.46 (1.03 to 2.05)** 0.006 ≥ 50 (n = 6,295) 1.01 (0.77 to 1.33) 1.13 (0.95 to 1.35) 1.38 (1.13 to 1.69)*** 0.003 BMI, kg/m² 0.396 < 24 (n = 9,449) 1.18 (0.87 to 1.61) 1.26 (1.02 to 1.55)** 1.46 (1.14 to 1.85)*** 0.001 ≥ 24 (n = 4,257) 0.95 (0.68 to 1.31) 1.20 (0.97 to 1.50) 1.38 (1.07 to 1.77)** 0.008 Residential region 0.244 Urban (n = 5,914) 1.08 (0.80 to 1.44) 1.06 (0.85 to 1.31) 1.20 (0.92 to 1.57) 0.230 Rural (n = 7,792) 0.97 (0.68 to 1.39) 1.37 (1.10 to 169)*** 1.52 (1.20 to 1.92)**** < 0.001 Geolocation 0.027 North (n = 8,120) 1.10 (0.82 to 1.47) 1.36 (1.11 to 1.66)*** 1.58 (1.26 to 1.97)**** < 0.001 South (n = 5,586) 1.99 (0.69 to 1.41) 1.08 (0.85 to 1.36) 1.15 (0.84 to 1.55) 0.351 Physical activity 0.040 Yes (n = 3,345) 1.14 (0.82 to 1.58) 1.06 (0.81 to 1.38) 1.01 (0.73 to 1.41) 0.824 No (n=10,361) 0.91 (0.66 to 1.24) 1.27 (1.06 to 1.53)** 1.57 (1.28 to 1.93)**** < 0.001 Smoking status 0.538 Yes (n = 5,356) 0.84 (0.53 to 1.33) 1.34 (1.04 to 1.73)** 1.50 (1.14 to 1.99)*** 0.002 No (n = 8,350) 1.11 (0.86 to 1.44) 1.15 (0.95 to 1.39) 1.32 (1.05 to 1.65)** 0.015 Alcohol consumption 0.272 Yes (n = 3,121) 1.25 (0.78 to 2.01) 1.23 (0.89 to 1.70) 1.56 (1.11 to 2.20)** 0.016 No (n = 10,585) 0.98 (0.76 to 1.27) 1.21 (1.02 to 1.43)** 1.34 (1.09 to 1.64)*** 0.004 Sleep duration, hours/night 0.370 < 7 (n = 5,599) 0.86 (0.57 to 1.29) 1.13 (0.90 to 1.43) 1.34 (1.04 to 1.72)** 0.023 ≥ 7 (n = 8,072) 1.11 (0.85 to 1.46) 1.31 (1.06 to 1.62)** 1.41 (1.10 to 1.79)*** 0.001 Note. aWe adjusted gender, age, BMI, ethnicity, marital status, residential region, educational attainment, employment status, annual household income, physical activity, smoking status, alcohol consumption, and sleep duration. 95% CI, 95% confidence interval. *P < 0.05; **P < 0.01; ***P < 0.001; ****P < 0.0001. Table 4. Subgroup analysis for the association of nap duration with hypertension
In gender-specific associations, both men and women exhibited increased risks with longer napping duration (Ptrend < 0.02). Generally, larger risks were identified in adults aged 30–49 years, particularly for HTN, with a p value for interaction of 0.092. Higher nap-associated risks mainly existed in participants with lower BMI (< 24 kg/m2), except for HTN in 60+ min nappers. We found some evidence of regional differences in nap-CVD associations, where increased risks occurred in rural and northern residents only. Specifically, significant effect modification by geolocation (north China versus south China) was identified for total CVD (P = 0.043) and HTN (P = 0.027).
Our results also highlighted that the nap-CVD association was modified by physical activity, with larger incident risks found among physically inactive adults. Smokers and alcohol drinkers were observed to have higher CVD risks induced by longer napping. Specifically, the incidence of CVD and HTN remarkably increased among smokers with 30+ min naps, while risks elevated significantly only in drinkers who napped ≥ 60 min. Moreover, associations of long napping duration with CVDs appear to be more evident among adults who had longer nocturnal sleep. For instance, 30–60 min of napping resulted in 30% (9%–55%) and 31% (6%–62%) higher risks of CVD and HTN in adults who slept ≥ 7 h/night, respectively, corresponding to insignificant HRs of 1.17 (0.96–1.42) and 1.13 (0.90–1.43) in those slept < 7 h/night.
Sensitivity analyses (Supplementary Table S2 available in www.besjournal.com) demonstrated the robustness of our main findings that nap ≥ 30 min was associated with an increased risk of CVD events. In terms of total CVD outcome in relation to napping duration of 30 to < 60 min, the risk estimates kept unchanged when we excluded CVD cases diagnosed in the initial first year after the baseline study or excluded those aged > 75 years, with HRs ranging from 1.22 (1.08, 1.39) to 1.23 (1.09, 1.40) (model 1) and 1.25 (1.10, 1.42) (model 2), respectively. The estimated HRs slightly increased when restricting our analysis to participants without changes in daytime-napping behaviors, while our main findings remained [HR = 1.38 (1.20, 1.57), model 3].
Diseases Groups HR (95% CI) Main model Model 1 Model 2 Model 3 CVD < 30 min 1.07 (0.89, 1.29) 1.10 (0.92, 1.33) 1.10 (0.91, 1.33) 1.25 (1.03, 1.51)* 30 to 60 min 1.22 (1.08, 1.39)** 1.23 (1.09, 1.40)** 1.25 (1.10, 1.42)** 1.38 (1.20, 1.57)*** ≥ 60 min 1.27 (1.09, 1.47)** 1.28 (1.11, 1.48)*** 1.33 (1.15, 1.54)*** 1.42 (1.22, 1.66)*** HTN < 30 min 1.04 (0.83, 1.30) 1.04 (0.83, 1.30) 1.05 (0.84, 1.31) 1.14 (0.90, 1.45) 30 to 60 min 1.21 (1.04, 1.41)* 1.22 (1.05, 1.42)** 1.23 (1.06, 1.44)** 1.36 (1.16, 1.60)*** ≥ 60 min 1.38 (1.16, 1.65)*** 1.41 (1.19, 1.67)*** 1.44 (1.12, 1.71)*** 1.57 (1.31, 1.88)*** Stroke < 30 min 0.96 (0.65, 1.42) 1.01 (0.69, 1.49) 1.04 (0.71, 1.54) 1.06 (0.70, 1.59) 30 to 60 min 1.39 (1.10, 1.76)** 1.40 (1.11, 1.77)** 1.43 (1.13, 1.81)** 1.52 (1.19, 1.95)*** ≥ 60 min 1.04 (0.77, 1.40) 1.06 (0.79, 1.42) 1.09 (0.81, 1.47) 1.14 (0.84, 1.55) Note. Abbreviations: HR, hazard ratio; CI, confidence interval; CVDs, cardiovascular diseases; HTN, hypertension. Model 1: restricting our study outcomes beyond the initial first year. Model 2: restricting participants aged < 75 years. Model 3: restricting the analysis to adults who had not changed daytime-napping behaviors during follow-ups. *P < 0.05, **P < 0.01, ***P < 0.001. Table S2. Sensitive analysis of hazard ratios (95% CIs) for incident CVDs associated with napping duration, by excluding those who developed outcomes in 1 year after baseline survey, study participants aged > 75 years and participants who had changed daytime-napping behaviors during follow-ups
-
To the best of our knowledge, this is the first nationwide population-based cohort study assessing the effects of daytime napping on major CVDs and HTN in China. In this study, we found that a napping duration of ≥ 30 min per day was associated with higher risks of CVD and HTN, while no significant associations were observed among those who napped for 0–30 min.
-
Existing epidemiologic evidence was generally inconsistent worldwide regarding the effects of daytime napping on CVD [16, 43]. A few previous studies have demonstrated that midday napping was not associated with CVD events [24, 25], while a recent Greek [22] and Swiss [21] prospective cohort study revealed that daytime napping may play as a protective factor in the development of incident CVD. In our study, a long napping duration (≥ 30 min) was an independent risk factor for CVD. Our findings were highly consistent with those of the Sleep Heart Health Study [44], which suggested that regular long nappers (> 30 min) had a higher prevalence of incident CVD. Nonetheless, great heterogeneity still existed in terms of the effects of various napping durations. Specifically, a meta-analysis of 11 prospective cohort studies [45] presented that a long daytime nap (≥ 60 min/day) was associated with an increased risk of CVD, whereas a short nap (< 60 min) was not. Furthermore, two Chinese studies from the Dongfeng-Tongji cohort [26, 46] linked elevated CVD risk with napping of 90+ min/day only. This discrepancy in nap-CVD associations across studies remained largely unclear but could possibly be related to the different study designs, nap categorizations, or populations [10].
Increasing research interest has been focused on daytime napping in studies assessing risk factors of HTN, while epidemiologic findings to date for nap-HTN associations were far from consistent. The Alzheimer Caregiver Coping Study from California [47] reported that daytime naps were not significantly associated with the odds of having HTN, and a cross-sectional study in Beijing, China, [28] reported a remarkably lower HTN risk in participants with 1 h of napping. On the contrary, a meta-analysis of nine observational studies [48] summarized that a long afternoon nap (> 30 min) was possibly associated with a higher risk of HTN. Similar results were also identified in our analysis in that elevated risk of HTN was associated with long napping duration (≥ 30 min). However, evidence was still conflicting on the effects of various napping durations on HTN risk in a few studies. For instance, the Dongfeng-Tongji Cohort study [12] and the cross-sectional study of CFPS [37] illustrated negative associations of daytime napping with HTN following a long napping duration of > 60 min per day only. Relevant researchers should pay more attention to the heterogeneous results regarding the effects of different napping durations.
-
Gender and age differences in associations of napping duration with CVDs have generated widespread interest in public health epidemiology, but findings were not well consistent. In the present study, we observed that a stronger nap-CVD association occurred in men, in line with the results of a British Regional Heart Study and an American community-based study on men [44, 49]. However, our results revealed that HTN risk exists in both genders, and this finding was incompletely supported by related studies. For instance, two nationwide cross-sectional studies have reported that extended afternoon napping was linked with HTN in women but not in men [27, 37]. Gender discrepancies for HTN risk should be further explored in future investigations. Moreover, increasing evidence highlighted that the napping-associated CVD risks usually increase with age, especially in older groups ≥ 65 years [46, 50]. However, in our study, significant effects of long daytime napping on CVD risks were profound in middle-aged adults, not only in the elderly. Future napping epidemiology research is still needed to focus on the effect modification by age.
Obesity predicts a broad range of health risks, including CVDs, HTN, diabetes, and lower quality of life [51, 52]. Interestingly, our analysis found stronger nap-CVD associations in participants who were underweight. However, most studies demonstrated that obesity (BMI ≥ 24 kg/m2) may amplify the adverse effects of naps on chronic diseases [26, 53]. Besides, we observed nap-CVD associations varied by region, with higher risks occurring in rural areas and northern China. Similar associations were also observed in a cross-sectional rural study of middle-aged Chinese populations from Henan province [54]. In contrast to this nationwide study, two regional surveys among community-based rural elderly populations in Beijing [28] and Hunan [55] reported that long napping duration was not associated with an increased risk of HTN. A possible explanation for this discrepancy could be the great heterogeneity (e.g., age and napping habits) between study populations. Our findings on geographical variations may have significant public health implications for targeted patterns of naps and vulnerable populations, locally and regionally.
Nap-CVD associations could be possibly modified by physical activity, smoking, and alcohol drinking habits. As regards physical activity, we observed higher nap-associated risks in physically inactive persons. However, a previous study with Dongfeng-Tongji Cohort noted slightly stronger effects of long daytime napping on incident coronary heart diseases in adults who are physically active [46]. This inconsistency across studies might be attributable to discrepancies in regions and demographic characteristics. Our results also indicate that long daytime napping was associated with cardiovascular incidences across smoking groups, consistent with the results of a previous study of a predominantly American population with various smoking profiles [44]. Among alcohol drinkers, only the association with ≥ 60 min napping was noted in our study, and no well-documented evidence to date has been detected regarding napping-CVD association variations by drinking status. Further investigations are needed to fully clarify the potential modifying effect of alcohol consumption.
The combined effect of daytime napping with nighttime sleep on CVD was a common concern in epidemiologic research. A recent cohort study with 116,632 participants from 21 countries revealed that midday napping was linked to increased risks of major CVD events in those with > 6 h of nighttime sleep [11]. Two Chinese analyses also reported higher risks of stroke in participants who napped ≥ 1 h and slept ≥ 9 h/night [26, 56]. The result of our subgroup analysis of nap-CVD association by nighttime sleep was largely consistent with the aforementioned research, suggesting a possibly higher nap-associated risk for CVD among adults with excessively long nighttime sleep. Furthermore, the nap-associated risk of HTN was found in those who slept > 7 h/night in our analysis. However, existing epidemiologic evidence generally focused on the association of daytime napping with HTN only, and no sufficient studies have considered nocturnal sleep as a potential effect modifier. More sophisticated nap-CVD investigations are greatly necessary to distinguish the independent and combined effects of afternoon napping and nighttime sleep on human health.
-
The mechanism underlying the association of daytime napping with CVD and HTN is not completely clear. Several mechanisms may explain the associations between napping and major CVD events. First, fluctuations in blood pressure and heart rate caused by the excitement of the sympathetic nervous system after a nap in the morning or noon may be closely related to an increased CVD risk[57-59]. Second, inflammation might mediate the relationship between frequent daytime napping and poor health outcomes [60, 61]. Third, long napping may regulate the endocrine hormones and body metabolisms, such as insulin and leptin, leading to alterations in glucose metabolism and appetite that may accelerate the development of diabetes and obesity [14, 62].
-
This study has some limitations. First, the CFPS survey only released data at baseline and of three subsequent waves of follow-up during the preparation of this work. Therefore, our napping-CVD analysis is limited to a relatively shorter follow-up period. Second, self-reported sleep information from the questionnaire may have recall bias compared with objective biological sleep. However, objective measurements of nighttime sleep and naps are not feasible in large prospective population studies, and the self-management questionnaire is the most commonly used method to assess sleep and disease, which have been reported in many studies [11, 44, 49]. Third, the ascertainment of CVD outcomes in our study may lead to null findings because individuals with events may be included in the non-event group based on self-reported diagnoses of CVDs. However, we still found a significant positive association between daytime napping and CVD, and the findings may provide valuable hints for further studies. Finally, some confounders were not included for adjustment in our study, such as dietary factors (salt consumption, etc.) [63], psychological status (anxiety, depression, etc.) [64], biomarker (CRP, IL-6, TC, HDL-C, etc.), [61] and sleep disorders (sleep apnea, insomnia, sleep quality, etc.) [65], and these factors and other undetected covariates might be potential confounders related to CVD or HTN.
-
Briefly, this study provided strong evidence that daytime napping was associated with increased risks of CVD and HTN in Chinese adults. Specifically, significant associations of CVD and HTN with naps ≥ 30 min per day were found, but not with short naps (< 30 min). Higher nap-associated risks were observed in adults with BMI of < 24 kg/m2, persons who are physically inactive, smokers, and sleepers of ≥ 7 h/night. Significant effect modification by geolocation was also identified in our analysis. These findings may have important implications in public health policymaking to improve the prevention and management of CVDs and provide scientific guidance for reasonable sleep arrangements. More future studies are warranted worldwide to focus on the long-term effects of daytime napping on human health.
-
We thank the China Family Panel Studies participants, staff, and investigators for their contributions to the collection, collation, and interpretation of data. We appreciated the anonymous reviewers very much, whose comments and suggestions contributed a lot to improving the quality of the manuscript.
-
ZHANG Yun Quan conceived and designed the study. WANG Lu, WANG Ke, ZHOU Pei Xuan, SHU Hai Uan, and WANG Kai collected and cleaned the data. WANG Lu and ZHANG Yun Quan performed the data analysis and drafted the original manuscript. WANG Ke, LIU Lin Jiong, and ZHANG Yuan Yuan helped revise the manuscript. All authors read and approved the final manuscript.
-
The authors declare they have no conflicts of interest.
Subgroup Hazard ratioa (95% CI) P for trend P for interaction < 30 min 30 to 60 min ≥ 60 min Gender 0.339 Male (n = 6,676) 0.81 (0.42 to 1.58) 1.36 (0.96 to 1.91) 1.17 (0.78 to 1.75) 0.183 Female (n = 7,030) 1.08 (0.67 to 1.75) 1.39 (1.01 to 1.93)* 0.86 (0.54 to 1.37) 0.549 Age, years 0.815 30–49 (n = 7,411) 0.67 (0.26 to 1.71) 1.20 (0.70 to 2.04) 0.75 (0.36 to 1.54) 0.810 ≥ 50 (n = 6,295) 1.07 (0.70 to 1.64) 1.43 (1.10 to 1.86)** 1.13 (0.81 to 1.58) 0.077 BMI, kg/m2 0.464 < 24 (n = 9,449) 0.71 (0.41 to 1.22) 1.39 (1.06 to 1.84)* 0.91 (0.63 to 1.33) 0.417 ≥ 24 (n = 4,257) 1.47 (0.82 to 2.61) 1.30 (0.84 to 2.02) 1.30 (0.77 to 2.19) 0.227 Residential region 0.351 Urban (n = 5,914) 0.88 (0.49 to 1.57) 1.18 (0.81 to 1.73) 0.99 (0.59 to 1.67) 0.653 Rural (n = 7,792) 1.05 (0.62 to 1.77) 1.59 (1.17 to 2.16)** 1.09 (0.75 to 1.59) 0.108 Geolocation < 0.001 North (n = 8,120) 0.94 (0.60 to 1.46) 1.32 (1.00 to 1.74)* 0.89 (0.63 to 1.26) 0.695 South (n = 5,586) 0.95 (0.43 to 2.13) 1.33 (0.84 to 2.13) 1.44 (0.78 to 2.65) 0.139 Physical activity 0.787 Yes (n = 3,345) 0.84 (0.42 to 1.69) 1.51 (0.98 to 2.33) 0.81 (0.42 to 1.53) 0.570 No (n = 10,361) 1.07 (0.67 to 1.71) 1.31 (0.98 to 1.73) 1.08 (0.77 to 1.52) 0.240 Smoking status 0.380 Yes (n = 5,356) 0.73 (0.33 to 1.61) 1.61 (1.11 to 2.34)* 1.19 (0.76 to 1.86) 0.104 No (n = 8,350) 1.08 (0.69 to 1.69) 1.29 (0.95 to 1.75) 0.91 (0.60 to 1.38) 0.602 Alcohol consumption 0.751 Yes (n = 3,121) 0.69 (0.24 to 1.97) 1.31 (0.79 to 2.17) 1.12 (0.64 to 1.99) 0.449 No (n = 10,585) 1.04 (0.68 to 1.58) 1.43 (1.10 to 1.86)** 1.02 (0.71 to 1.45) 0.165 Sleep duration, hours/night 0.364 < 7 (n = 5,599) 0.70 (0.36 to 1.37) 0.97 (0.69 to 1.37) 0.84 (0.55 to 1.26) 0.528 ≥ 7 (n = 8,072) 1.12 (0.69 to 1.80) 1.86 (1.35 to 2.57)*** 1.20 (0.78 to 1.86) 0.012 Note. aWe adjusted gender, age, BMI, ethnicity, marital status, residential region, educational attainment, employment status, annual household income, physical activity, smoking status, alcohol consumption, and sleep duration. 95% CI, 95% confidence interval. *P < 0.05; **P < 0.01; ***P < 0.001. Table S1. Subgroup analysis for the association of nap duration with stroke
Funds:
This study was supported by the Science and Technology Research Project of Hubei Provincial Department of Education [Grant No. Q20201104] and the Open Fund Project of Hubei Province Key Laboratory of Occupational Hazard Identification and Control [Grant No. OHIC2020Y01]
&These authors contributed equally to this work.
 Quick Links
 DownLoad: