


-
Metabolic syndrome (MetS), a cluster of modifiable metabolic conditions (including abdominal obesity, dyslipidemia, elevated blood pressure, and hyperglycemia), has become an essential contributor to the global health burden and public health challenges worldwide. The prevalence of MetS was approximately 25% in adults worldwide and 20% in Western countries [1]. A similar prevalence has been reported in China [2]. Moreover, MetS is a highly age-dependent determinant of both type 2 diabetes mellitus (T2DM) and cardiovascular diseases. Effective prevention and control measures are urgently needed to reduce the risk and disease burden of MetS.
Evidence of the etiology of MetS has suggested that the risk factors for MetS consist of both non-preventable (genetic variation) and preventable (diet, behavioral, and environmental) factors. In addition, recent studies indicated that higher residential greenness was associated with lower risk of MetS [3, 4], by protecting residents against environmental exposures such as heat and high air pollutants levels. A nationwide sister study in the US has revealed that greenness was associated with physical activity, and the association of greenness with obesity could be attenuated by 32% by physical activity [5]. However, a recent finding from a cohort study in Germany has shown a negative but non-significant relationship between residential greenness and MetS [6]. In addition, epidemiological evidence of this association was not found in rural areas with limited medical resources. Therefore, the current study aims to explore the association between long-term residential greenness exposure and MetS in rural China, and to assess whether physical activity and air pollution mediate this association.
The Henan Rural Cohort Study was conducted in five counties of Henan province in central China between July 2015 and September 2017. A multistage, stratified cluster sampling method was used to recruit the participants. A total of 39,259 local permanent residents (18−79 years of age) completely accomplished the baseline survey of the cohort study. After exclusion of people missing important information, 39,081 participants were eligible for the final analyses. The Zhengzhou University Life Science Ethics Committee approved the protocol of this prospective cohort study in a large population. Each participant provided signed written informed consent before the start of the baseline survey.
In the current study, MetS was assessed on the basis of the International Diabetes Federation (IDF) definition, according to the suggested ancestry-specific cutoffs [7]: participants with a waist circumference ≥ 90 cm in men or ≥ 80 cm in women and with any two of the following criteria were defined as having MetS: (1) triglycerides ≥ 1.7 mmol/L or drug treatment for lipid abnormalities; (2) high-density lipoprotein cholesterol < 1.04 mmol/L in men or < 1.3 mmol/L in women, or drug treatment for lipid abnormalities; (3) systolic blood pressure ≥ 130 mmHg or diastolic blood pressure ≥ 85 mmHg, or anti-hypertensive drug treatment; and (4) fasting blood glucose ≥ 5.6 mmol/L or anti-diabetes drug treatment.
Two satellite-based vegetation indices, the Enhanced Vegetation Index (EVI) and Normalized Difference Vegetation Index (NDVI), were used to assess residential greenness. Both the EVI and NDVI were obtained from the 16-day Moderate Resolution Imaging Spectroradiometer (MODIS) Terra onboard the TERRA satellite (
http://modis.gsfc.nasa.gov/data/dataprod/mod13.php ). These two vegetation indices were calculated with the land surface reflectance of near-infrared and visible red light. These indices differed in that EVI additionally introduced a blue light band to minimize canopy-soil variations and to improve sensitivity in high biomass regions. The values of these two indices ranged from −0.2 to +1, with negative values representing water, zero value denoting bare soil, and with higher values indicating more greenness exposure. In the main analyses, greenness within 500 m buffer radii and during a 3 year period before the baseline survey was determined and used to indicate long-term exposure in the current study.Several underlying confounders were considered on the basis of previous literature and the directed acyclic graph (Supplementary Figure S1, available in www.besjournal.com). The continuous variable was age. The categorical variables included sex (male and female), education levels (elementary school or below, junior high school, and high school or above), marital status (married/cohabitating and unmarried/divorced/widowed), average monthly family income (< 500 RMB, 500–1,000 RMB, and ≥ 1,000 RMB). Air pollution and physical activity were considered as the mediating variables in the current study. Air pollutants included nitrogen dioxide (NO2) and particulate matters (PM1, PM2.5, and PM10, with an aerodynamic diameter ≤ 1.0 µm, ≤ 2.5 µm, and ≤ 10 µm, respectively). The daily concentrations of these ambient air pollutants for each participant were estimated at a spatial resolution of 0.1° × 0.1°, and the average exposure concentrations during a three years period before the baseline survey were considered and used to indicate long-term air pollutants exposure. Physical activity was estimated on the basis of metabolic equivalent-hours/week (MET-hours/week) according to the Compendium of Physical Activities, and MET-hours/day was used in the current study.
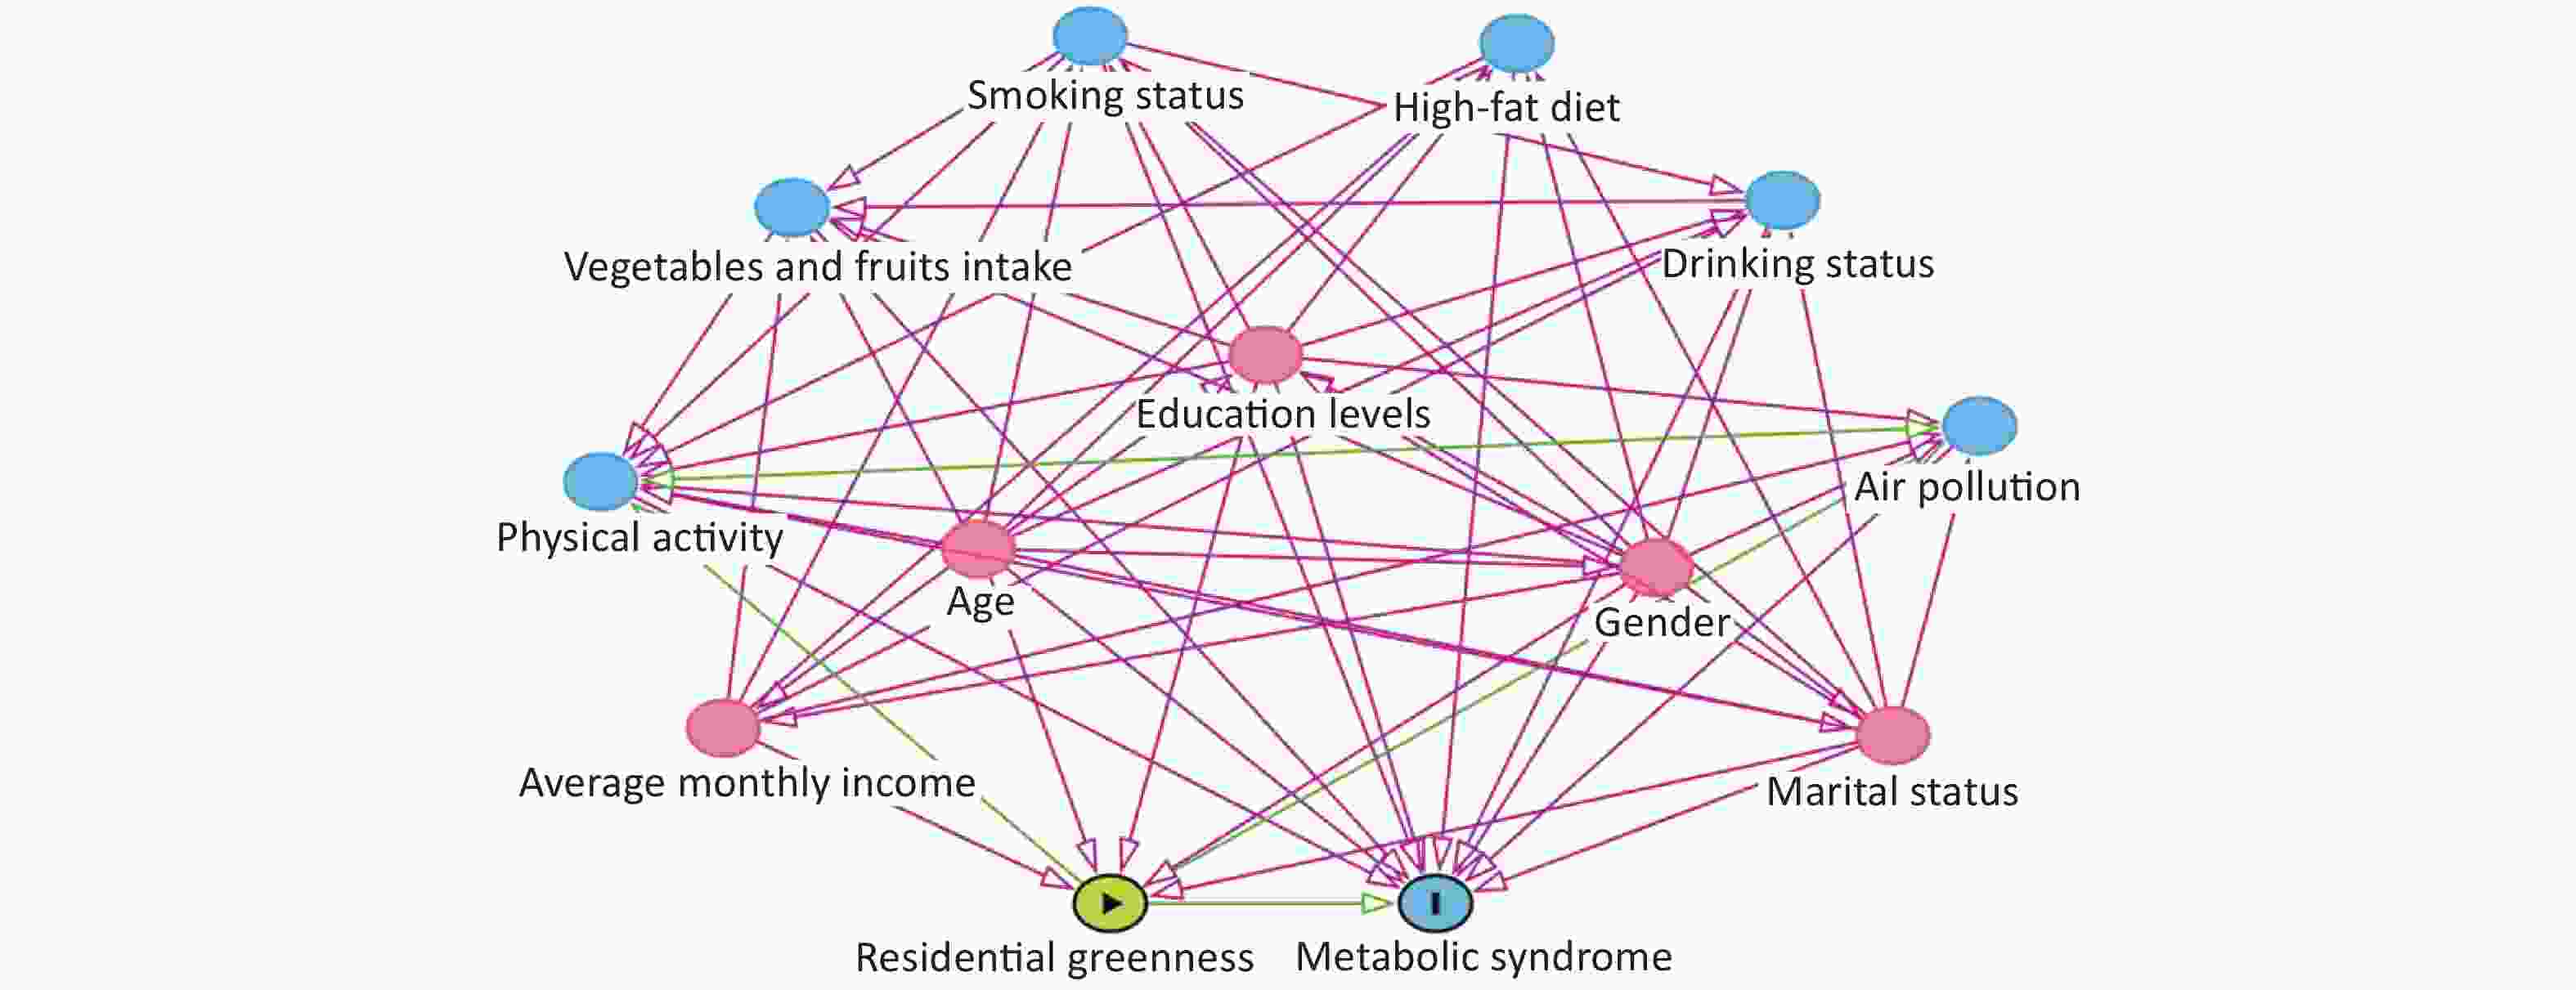
Figure S1. Directed acyclic graph for the associations of residential greenness with MetS. Pink lines indicate potential confounders and green lines indicate potential mediators.
Mann-Whitney U-test was performed to assess the differences between MetS and non-MetS groups for continuous variables, and Pearson's chi-square test was used to evaluate that differences among groups for categorical variables. The logistic regression model was fitted to examine the association of long-term residential greenness exposure with MetS risk, and the effect estimates were expressed as odds ratios [ORs, 95% confidence intervals (CIs)]. Restrictive cubic spline analyses were performed to explore the concentration-response relationships (three knots located at the 25 th, 50 th, and 75 th percentiles of residential greenness exposure level, respectively). We also examined whether the association was potentially modified by age, sex, and average monthly family income. Moreover, a cross-product term of each potential modifier and greenness indicator was included in the adjusted model to assess the existence of a multiplicative interaction effect on MetS.
Spearman’s rank correlation was conducted to estimate the pairwise correlations between the four air pollutants, physical activity and two vegetation indices. And the association of air pollutants and physical activity with MetS were also estimated. In the current study, mediation analyses were performed. And the product-of-coefficients approach was used to test potential pathways on assocition of residential greenness with MetS, in which the indirect effect could be estimated directly. The total effects, direct effects, and indirect effects were estimated, and standard errors were calculated by generation of 5,000 bootstrap resamples. Moreover, the proportion of the mediation effect was calculated as (βindirect effect/βtotal effect) × 100% [8]. In addition, to assess the robustness of the findings, we performed several sensitivity analyses, with different definitions of MetS (Supplementary Table S1, available in www.besjournal.com), different buffer radii of greenness (500 m, 1,000 m, and 3,000 m), different exposure years of greenness (1, 2, 3, 4, and 5 years), and different approach to test mediating effects (bootstrap and causal stepwise regression approaches). Besides, the associations of greenness with components of MetS were also assessed. and Z score method was used to calculate the continuous MetS severity score, then the relationship between greenness and this score was examined. All statistical analyses were performed in R software (version 3.6.1, R Development Core Team) and SAS 9.1 software package (SAS Institute, USA).
Criteria IDF (2005) NCEP/ATP III (2004) AHA (2005) JIS (2009) CDS (2013) Insulin resistance None None, but any 3 of the following 5 features None, but any 3 of the following 5 features None, but any 3of the following 5 features None, but any 3 of the following 5 features Elevated waist circumference (WC) ≥ 90 cm in men or ≥
80 cm women plus any
2 of the following≥ 90 cm in men;
≥ 80 cm in women≥ 90 cm in men;
≥ 80 cm in women≥ 90 cm in men;
≥ 80 cm in women≥ 90 cm in men;
≥ 80 cm in womenElevated triglycerides ≥ 1.7 mmol/L or
specific treatment for
this lipid
abnormality≥ 1.7 mmol/L or on drug treatment for elevated triglycerides ≥ 1.7 mmol/L or on drug
treatment for elevated
triglycerides≥ 1.7 mmol/L or drug
treatment for elevated
triglycerides is an
alternate indicator≥ 1.7 mmol/L Reduced
HDL-C< 1.03 mmol/L in men;
< 1.29 mmol/L in
women or specific
treatment for this
lipid abnormality< 1.03 mmol/L in men;
< 1.3 mmol/L in women
or on drug treatment
for reduced HDL-C< 1.03 mmol/L in men;
< 1.3 mmol/L in women
or on drug treatment
for reduced HDL-C< 1.03 mmol/L in men;
< 1.29 mmol/L in women
or drug treatment for
reduced HDL-C is
an alternate indicator< 1.04 mmol/L Elevated
blood
pressure≥ 130 mmHg systolic
blood pressure or ≥
85 mmHg diastolic
blood pressure or
treatment of
previously diagnosed
hypertension≥ 130 mmHg systolic blood pressure or ≥ 85 mmHg diastolic blood pressure or on antihypertensive drug treatment in a patient with a history of hypertension ≥ 130 mmHg systolic blood pressure or ≥ 85 mmHg diastolic blood pressure; on antihypertensive drug treatment in a patient with a history of hypertension ≥ 130 mmHg systolic blood pressure or ≥ 85 mmHg diastolic blood pressure or antihypertensive drug treatment in a patient with a history of hypertension is an alternate indicator ≥ 130 mmHg systolic blood pressure or ≥ 85 mmHg diastolic blood pressure or on antihypertensive drug treatment in a patient with a history of hypertension Elevated
fasting
glucose≥ 5.6 mmol/L or previously diagnosed Type 2 diabetes ≥ 100 mg/dL or on drug treatment for elevated glucose ≥ 100 mg/dL or on drug treatment for elevated glucose ≥ 100 mg/dL or drug treatment of elevated glucose is an alternate indicator ≥ 6.1 mmol/L or previously diagnosed Type 2diabetes Note. MetS, metabolic syndrome; IDF, the International Diabetes Federation; NCEP/ATP III, the National Cholesterol Education Program/Adult Treatment Panel III Criteria; AHA, the American Heart Association; JIS, the International Association for the Study of Obesity; CDS, the Chinese Diabetes Society; HDL-C, high-density lipoprotein cholesterol. Table S1. The diagnosis criteria of MetS based on the different definitions
Table 1 describes the distributions of the characteristics of all participants. Among the 39,081 participants in the current study, 23,666 (60.6%) were women, and a total of 12,052 participants (30.8%) had MetS. The average age was 57.2 ± 10.7 years in participants with MetS, and a higher proportion was observed in those who reported having elementary school education or below (49.5%) as well as being married/cohabitating (90.2%). In addition, the mean levels of exposure to EVI500-m and NDVI500-m in the total population were 0.34 and 0.49, with interquartile ranges (IQRs) of 0.11 and 0.12, respectively.
Variables Total (n = 39,081) Non-MetS (n = 27,029) MetS (n = 12,052) P-valuea Age (years, mean ± SD) 55.6 ± 12.2 54.9 ± 12.7 57.2 ± 10.7 < 0.001 Sex, n (%) < 0.001 Male 15,415 (39.4) 12,012 (44.4) 3,403 (28.2) Female 23,666 (60.6) 15,017 (55.6) 8,649 (71.8) Education levels, n (%) < 0.001 Elementary school or below 17,490 (44.8) 11,523 (42.6) 5,967 (49.5) Junior high school 15,581 (39.9) 11,145 (41.2) 4,436 (36.8) High school or above 6,010 (15.4) 4,361 (16.1) 1,649 (13.7) Marital status, n (%) 0.084 Married/cohabitating 35,090 (89.8) 24,221 (89.6) 10,869 (90.2) Unmarried/divorced/widowed 3,991 (10.2) 2,808 (10.4) 1,183 (9.8) Average monthly family income (RMB), n (%) 0.002 < 500 13,947 (35.7) 9,683 (35.8) 4,264 (35.4) 500–1,000 12,851 (32.9) 8,746 (32.4) 4,105 (34.1) ≥ 1,000 12,283 (31.4) 8,600 (31.8) 3,683 (30.6) EVI500-m (mean, IQR) 0.34 (0.11) 0.34 (0.11) 0.33 (0.11) < 0.001 NDVI500-m (mean, IQR) 0.49 (0.12) 0.50 (0.10) 0.48 (0.14) < 0.001 NO2 (μg/m3, mean ± SD) 39.87 ± 3.60 39.58 ± 3.63 40.52 ± 3.46 < 0.001 PM1 (μg/m3, mean ± SD) 57.45 ± 2.66 57.33 ± 2.66 57.71 ± 2.65 < 0.001 PM2.5 (μg/m3, mean ± SD) 73.42 ± 2.57 73.26 ± 2.59 73.79 ± 2.48 < 0.001 PM10 (μg/m3, mean ± SD) 132.46 ± 5.81 132.01 ± 5.86 133.48 ± 5.56 < 0.001 Physical activity (MET-hours/day, mean ± SD) 18.10 ± 10.11 18.65 ± 10.26 16.86 ± 9.64 < 0.001 Note. MetS, metabolic syndrome; SD, standard deviation; T2DM, type 2 diabetes; EVI500-m, Enhanced Vegetation Index across buffers of 500 m, NDVI500-m, Normalized Difference Vegetation Index across buffers of 500 m; IQR, interquartile range; NO2, nitrogen dioxide; PM1, particulate matter with an aerodynamic diameter ≤ 1.0 m; PM2.5, particulate matter with an aerodynamic diameter ≤ 2.5 m; PM10, particulate matter with an aerodynamic diameter ≤ 10 m. aP-value for the difference between MetS and non-MetS groups for continuous or categorical variables. Table 1. The basic characteristics of the participants
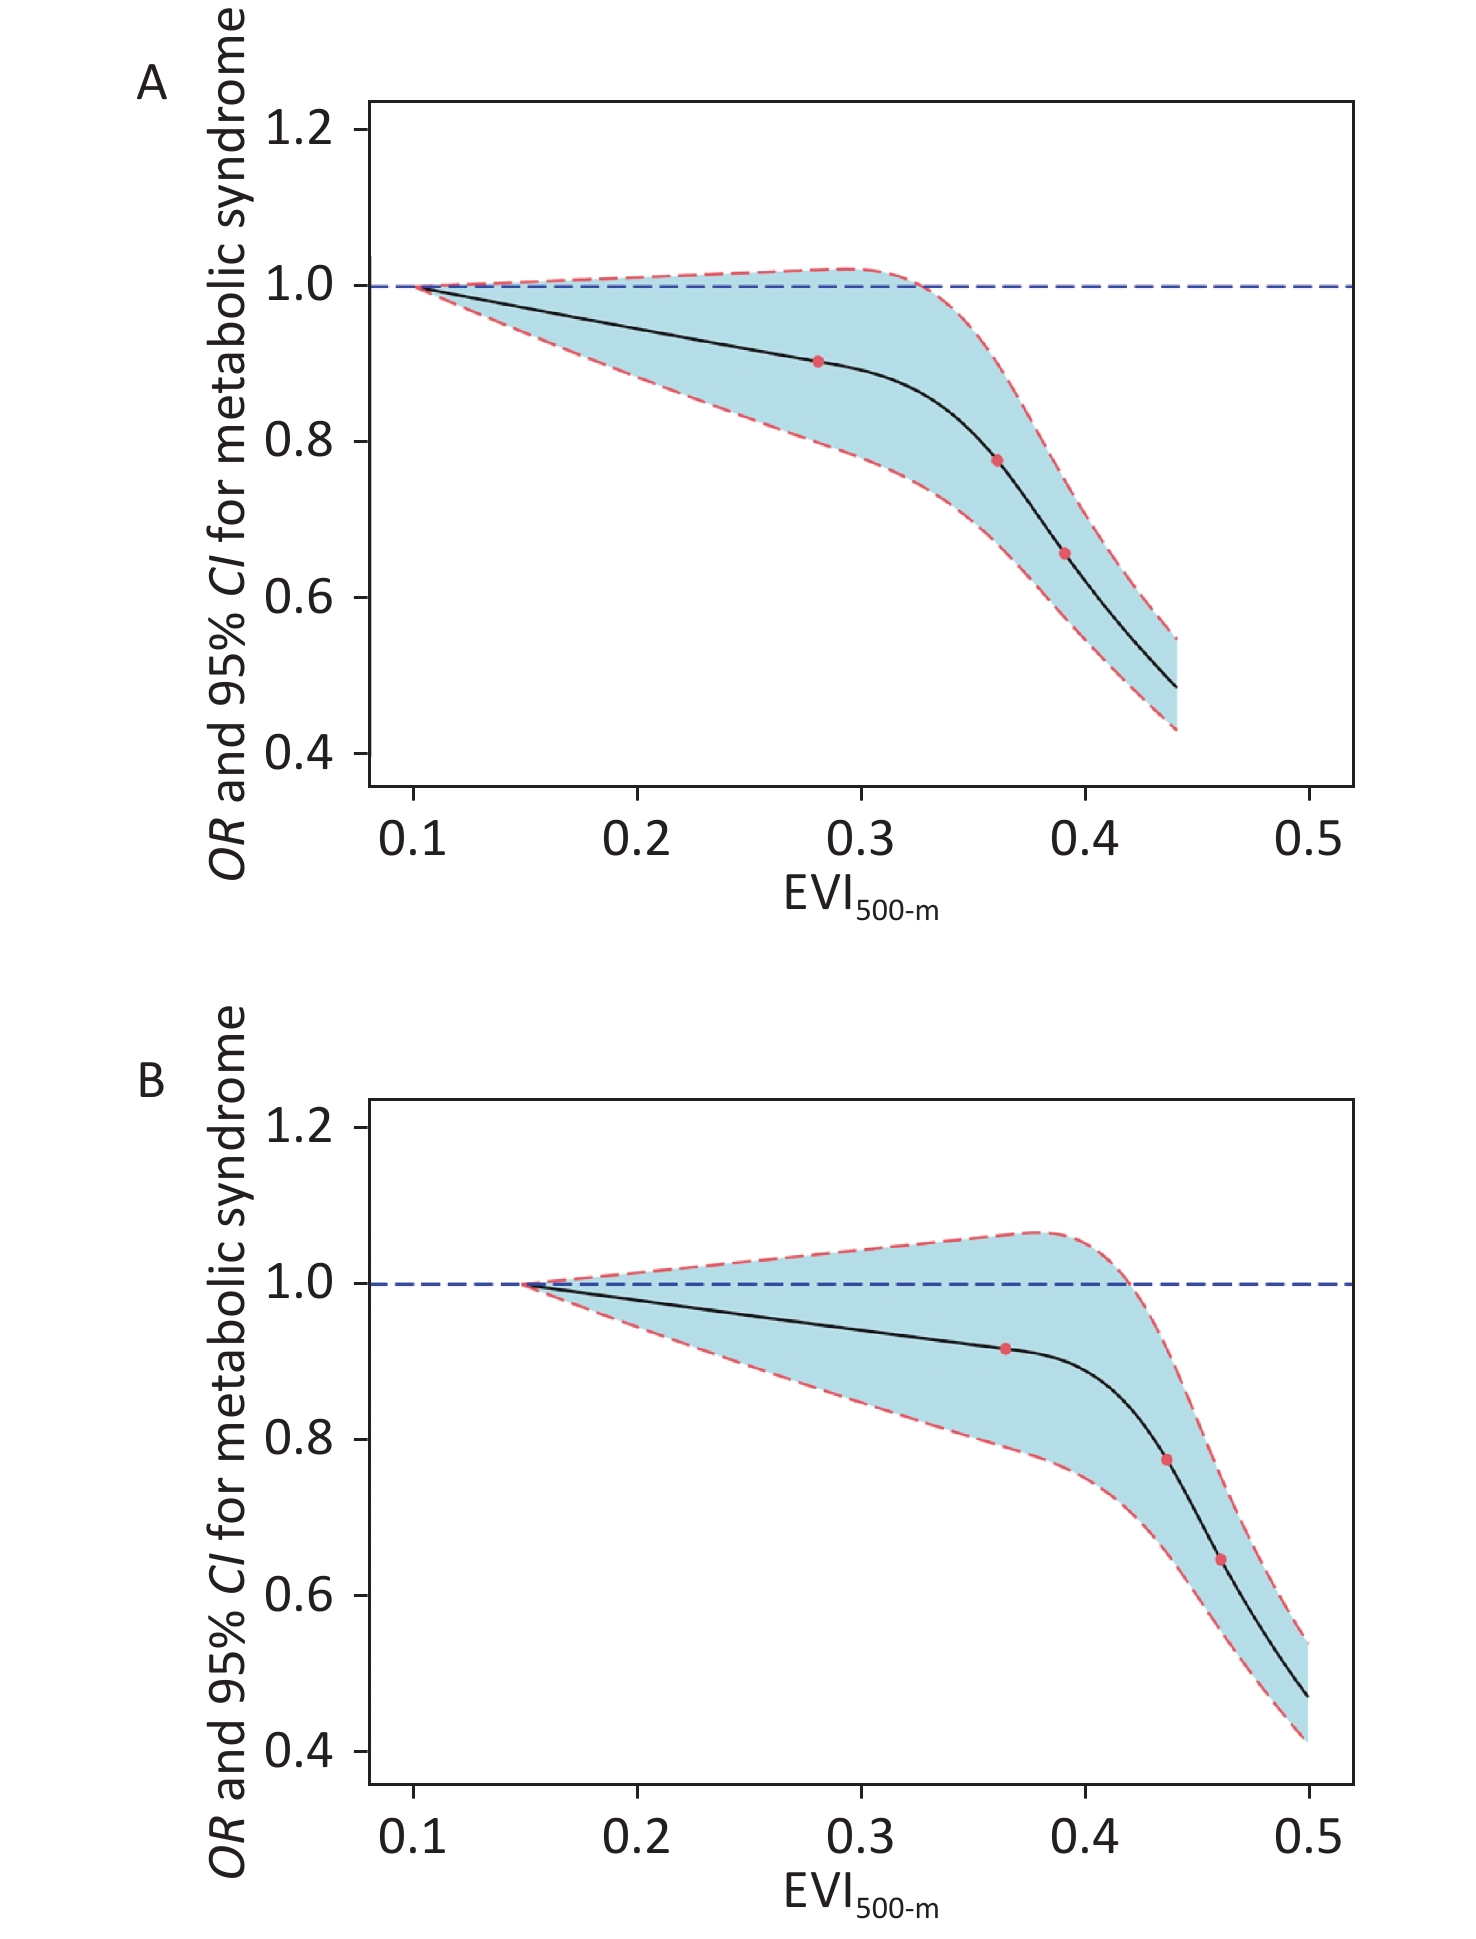
In agreement with previous studies [3, 4], our findings demonstrated an inverse association between residential greenness exposure and MetS prevalence (Table 2). Specifically, for an IQR increment in EVI500-m and NDVI500-m, the ORs (95% CIs) for MetS were 0.771 (0.743, 0.800) and 0.778 (0.752, 0.805), respectively, in the adjusted models. Compared with the first quartile level of greenness exposure, the ORs (95% CIs) for the fourth quartile of EVI500-m and NDVI500-m were 0.683 (0.642, 0.727) and 0.662 (0.625, 0.701), respectively. Moreover, restrictive cubic spline analyses indicated non-linear concentration-response relationships between residential greenness exposure (EVI500-m and NDVI500-m) and MetS (Supplementary Figure S2, available in www.besjournal.com; both the overall association tests and the non-linear association tests were P < 0.001).
Residential greenness Crude model Adjusted modela ORs (95% CIs) P-value ORs (95% CIs) P-value EVI500-m Q1 reference reference Q2 0.979 (0.919, 1.043) 0.514 0.989 (0.927, 1.055) 0.741 Q3 0.895 (0.840, 0.954) 0.001 0.894 (0.838, 0.954) 0.001 Q4 0.683 (0.643, 0.726) < 0.001 0.683 (0.642, 0.727) < 0.001 Continuous 0.773 (0.745, 0.801) < 0.001 0.771 (0.743, 0.800) < 0.001 NDVI500-m Q1 reference reference Q2 0.888 (0.837, 0.943) < 0.001 0.914 (0.860, 0.971) 0.004 Q3 0.602 (0.558, 0.649) < 0.001 0.591 (0.547, 0.638) < 0.001 Q4 0.655 (0.619, 0.692) < 0.001 0.662 (0.625, 0.701) < 0.001 Continuous 0.776 (0.750, 0.802) < 0.001 0.778 (0.752, 0.805) < 0.001 Note. MetS, metabolic syndrome; EVI500-m, Enhanced Vegetation Index across buffers of 500 m, NDVI500-m, Normalized Difference Vegetation Index across buffers of 500 m; Q1, the first quartile; Q2, the second quartile; Q3, the third quartile; Q4, the fourth quartile; ORs, odds ratios; CIs, confidence intervals. aAdjusted for age, sex, education levels, marital status, average monthly family income. Table 2. Effect estimates of residential greenness on MetS
A previous study conducted among 6,076 civil servants of London reported that an IQR increase in NDVI500-m was associated with a 13% (95% CI: 1%, 23%) lower risk of MetS [3]. In comparison with the results from an earlier study in the Chinese urban population, the same increase in greenness might have more significant health effects in rural areas than in urban areas [urban vs. rural: the means of NDVI500-m exposure were 0.32 vs. 0.49; for an IQR increment in NDVI500-m (0.17 vs. 0.12), the effect estimates on MetS (0.81 and 0.778) were comparable in the two areas]. However, a recent research from the population-based KORA F4/FF4 cohort has found no significant association (P > 0.05) [6]. Because of the differences in participants’ ancestries (European vs. Chinese) and regions (urban vs. rural), the findings of the current study provide additional evidence of the effect of residential greenness on MetS.
Supplementary Figure S3 (available in www.besjournal.com) presents the relationship between residential greenness exposure and MetS prevalence, stratified by age, sex, and average monthly family income. Stronger associations were found in participants ≥ 60 years of age, men, and those with average monthly family income ≥ 1,000 RMB. Significant multiplicative interaction effects were detected for age and sex on the associations (all P values for interaction < 0.001). We speculate that the findings may be explained by the typical characteristics of rural China. For example, men may spend more time doing agricultural work on farms or labor with more outdoor greenness exposure than women. Older people in rural areas prefer to take walks after meals and look after preschool children in their homes. Furthermore, families with higher incomes may prefer greener living conditions and have better eating habits, thus, potentially affecting the association.
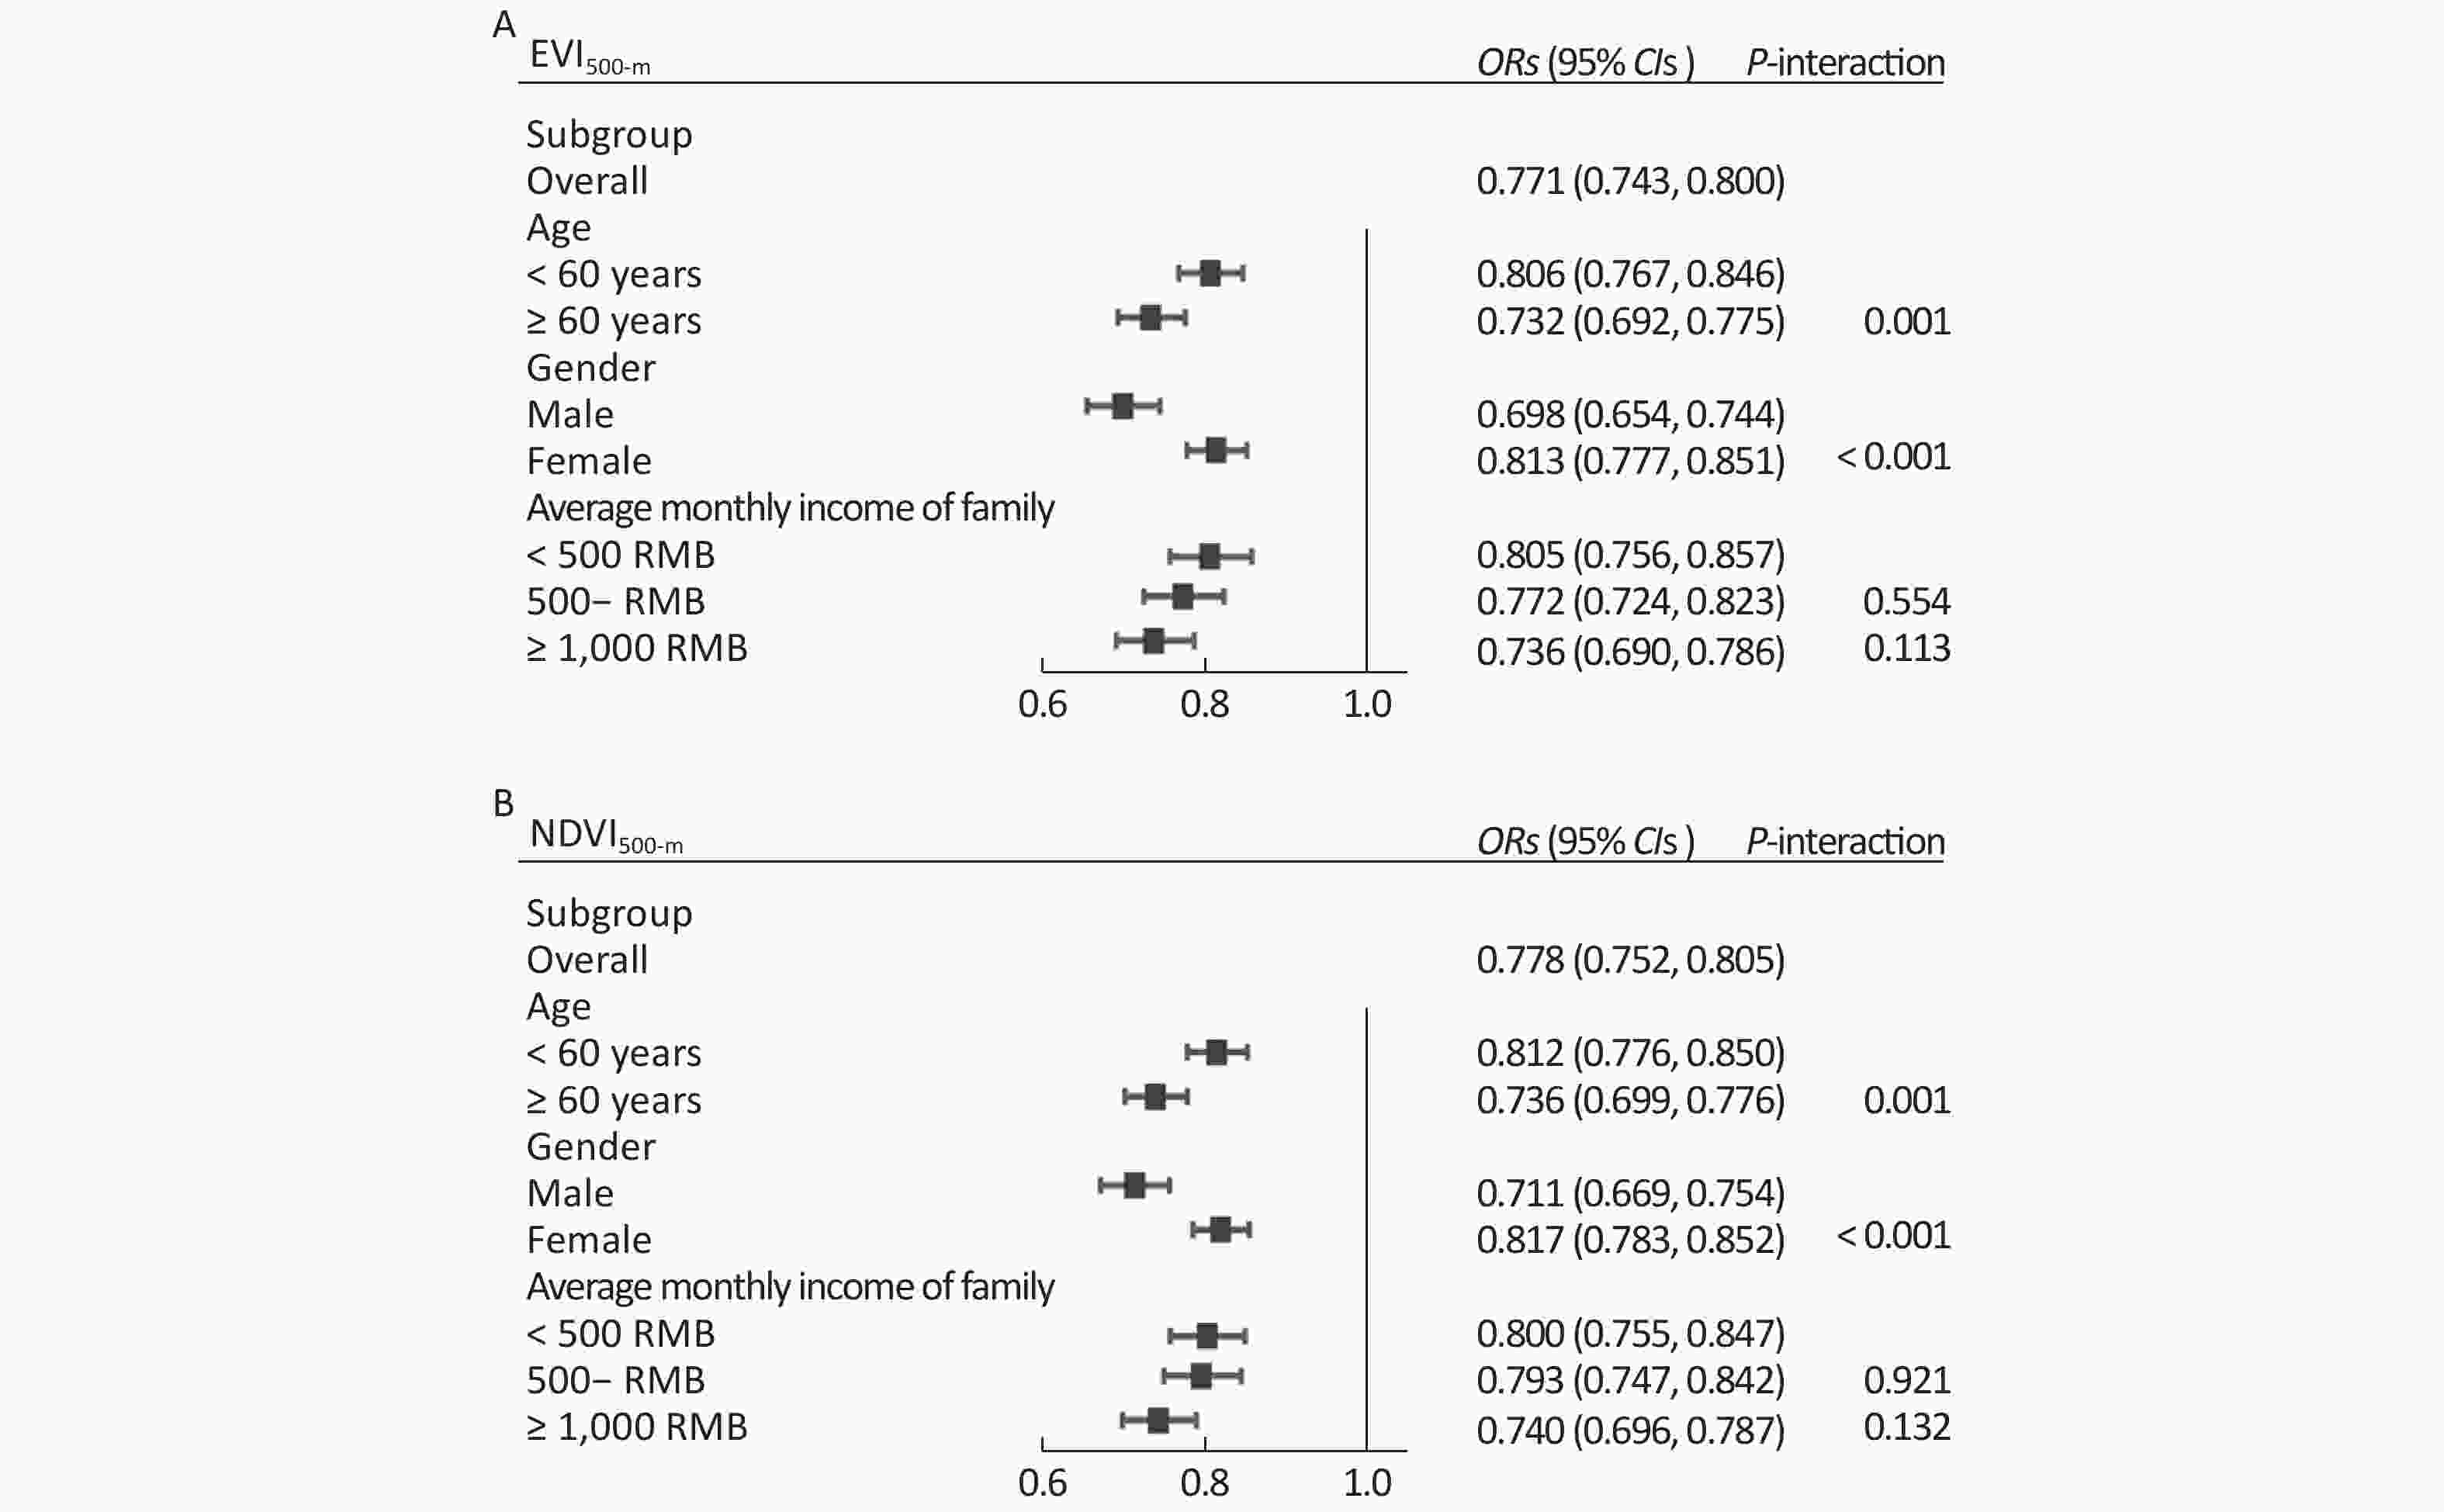
Figure S3. The estimated effects of long-term exposure to residential greenness on MetS stratified by potential confounders. (A) estimated effect of EVI500-m on MetS; (B) estimated effect of NDVI500-m on MetS. Adjusted for age, gender, education levels, marital status, and average monthly income of family. MetS, metabolic syndrome; EVI500-m, Enhanced Vegetation Index across buffers of 500 m; NDVI500-m, Normalized Difference Vegetation Index across buffers of 500 m; ORs, odds ratio; CIs, confidence intervals; P-interaction, P for interaction.
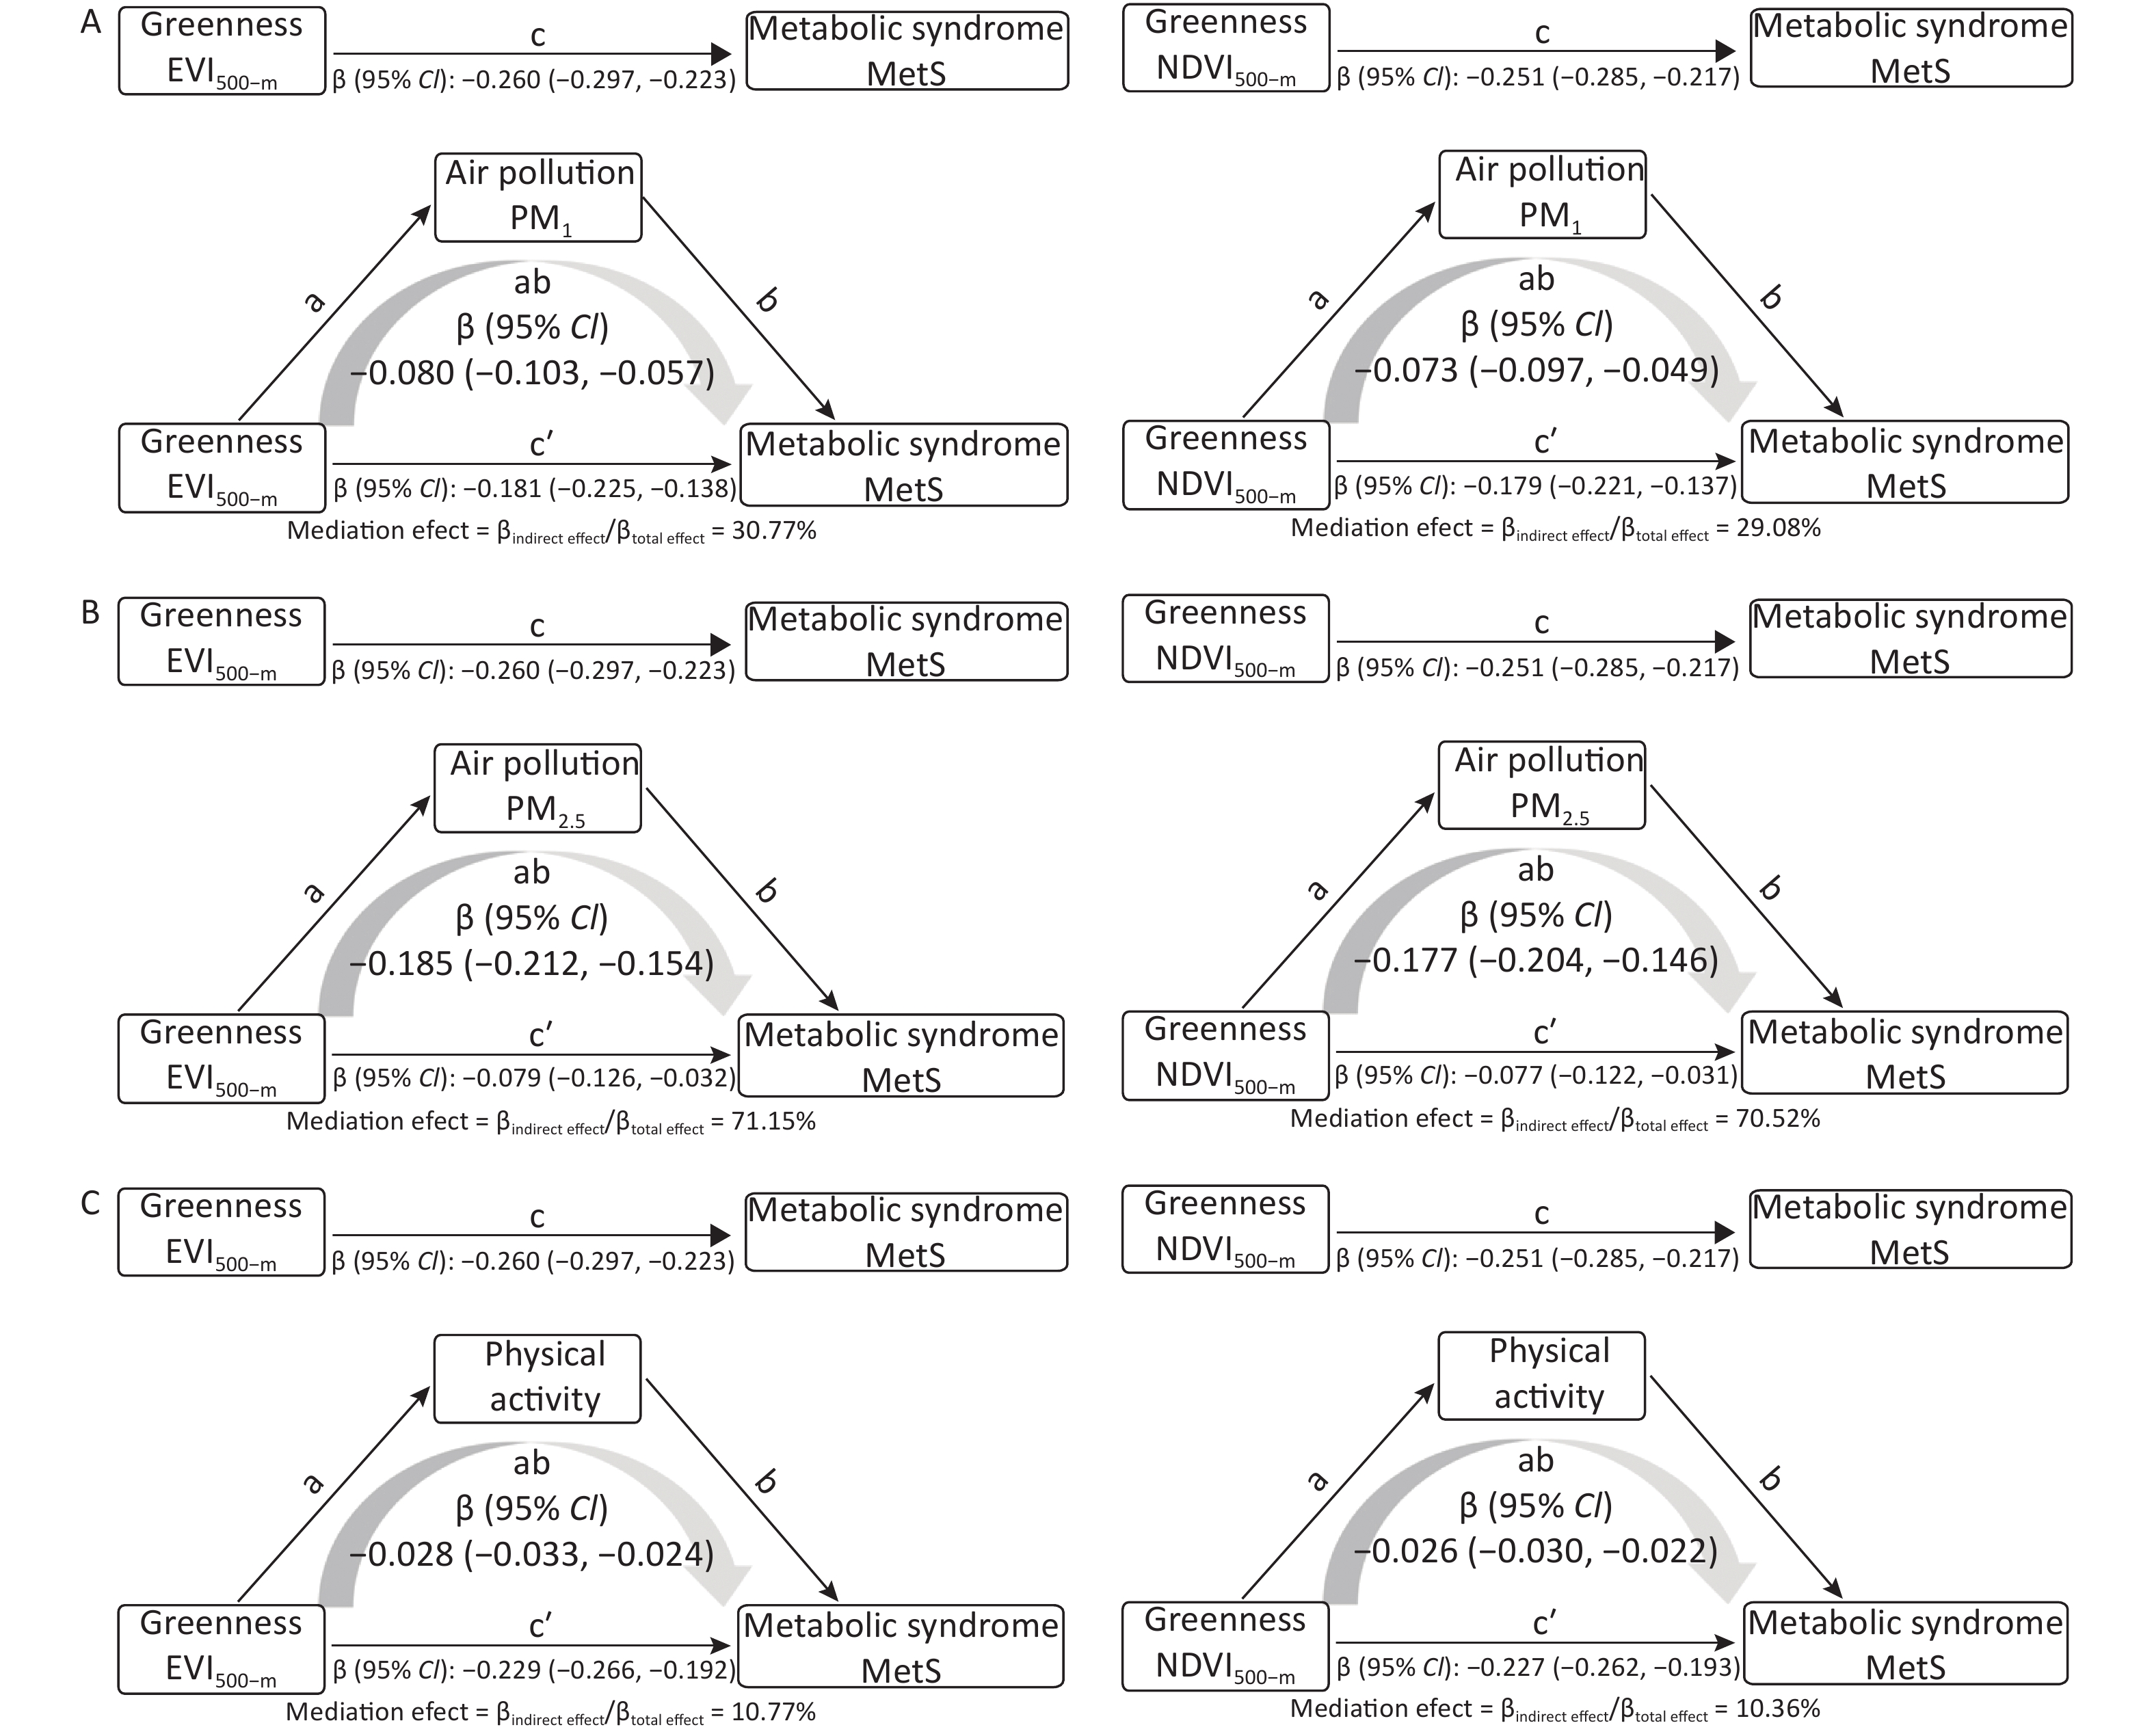
As shown in Supplementary Table S2 (available in www.besjournal.com), the pairwise correlations between air pollutants were highly positive (Spearman's rank correlation coefficients ranged from 0.83 to 0.96), and the correlations between air pollutants and greenness were moderately positive. The associations of air pollutants and physical activity with MetS are shown in Supplementary Table S3 (available in www.besjournal.com). Figure 1 and Supplementary Table S4 (available in www.besjournal.com) show the results of mediation analyses, which suggested that PM1, PM2.5, and physical activity (MET-hours/day) significantly mediated the association between residential greenness and MetS, and explained 30.8%, 71.2%, and 10.8% of the effects between EVI500-m and MetS and 29.1%, 70.5%, 10.4% of the effects between NDVI500-m and MetS, respectively. These findings may be due to the fact that residential greenness helps mitigate air pollution from motor vehicles and other combustion sources, and residential greenness may stimulate a desire for outdoor physical activity among the population. In the mediation analyses, the total effect was the sum of many potentially different causal pathways (including some that were unmeasured). But we analyzed air pollution (reducing harm) and physical activity (building capacities) in isolation in the current study, which might obscure other unmeasured pathways [9]. The interconnected pathways should be considered in future studies. However, in the current study, no significant mediation effects were found for NO2 and PM10 exposure. That may be explained by the different compositions and origins of air pollutants in different regions, and the strong correlation between NO2/PM10 and greenness.
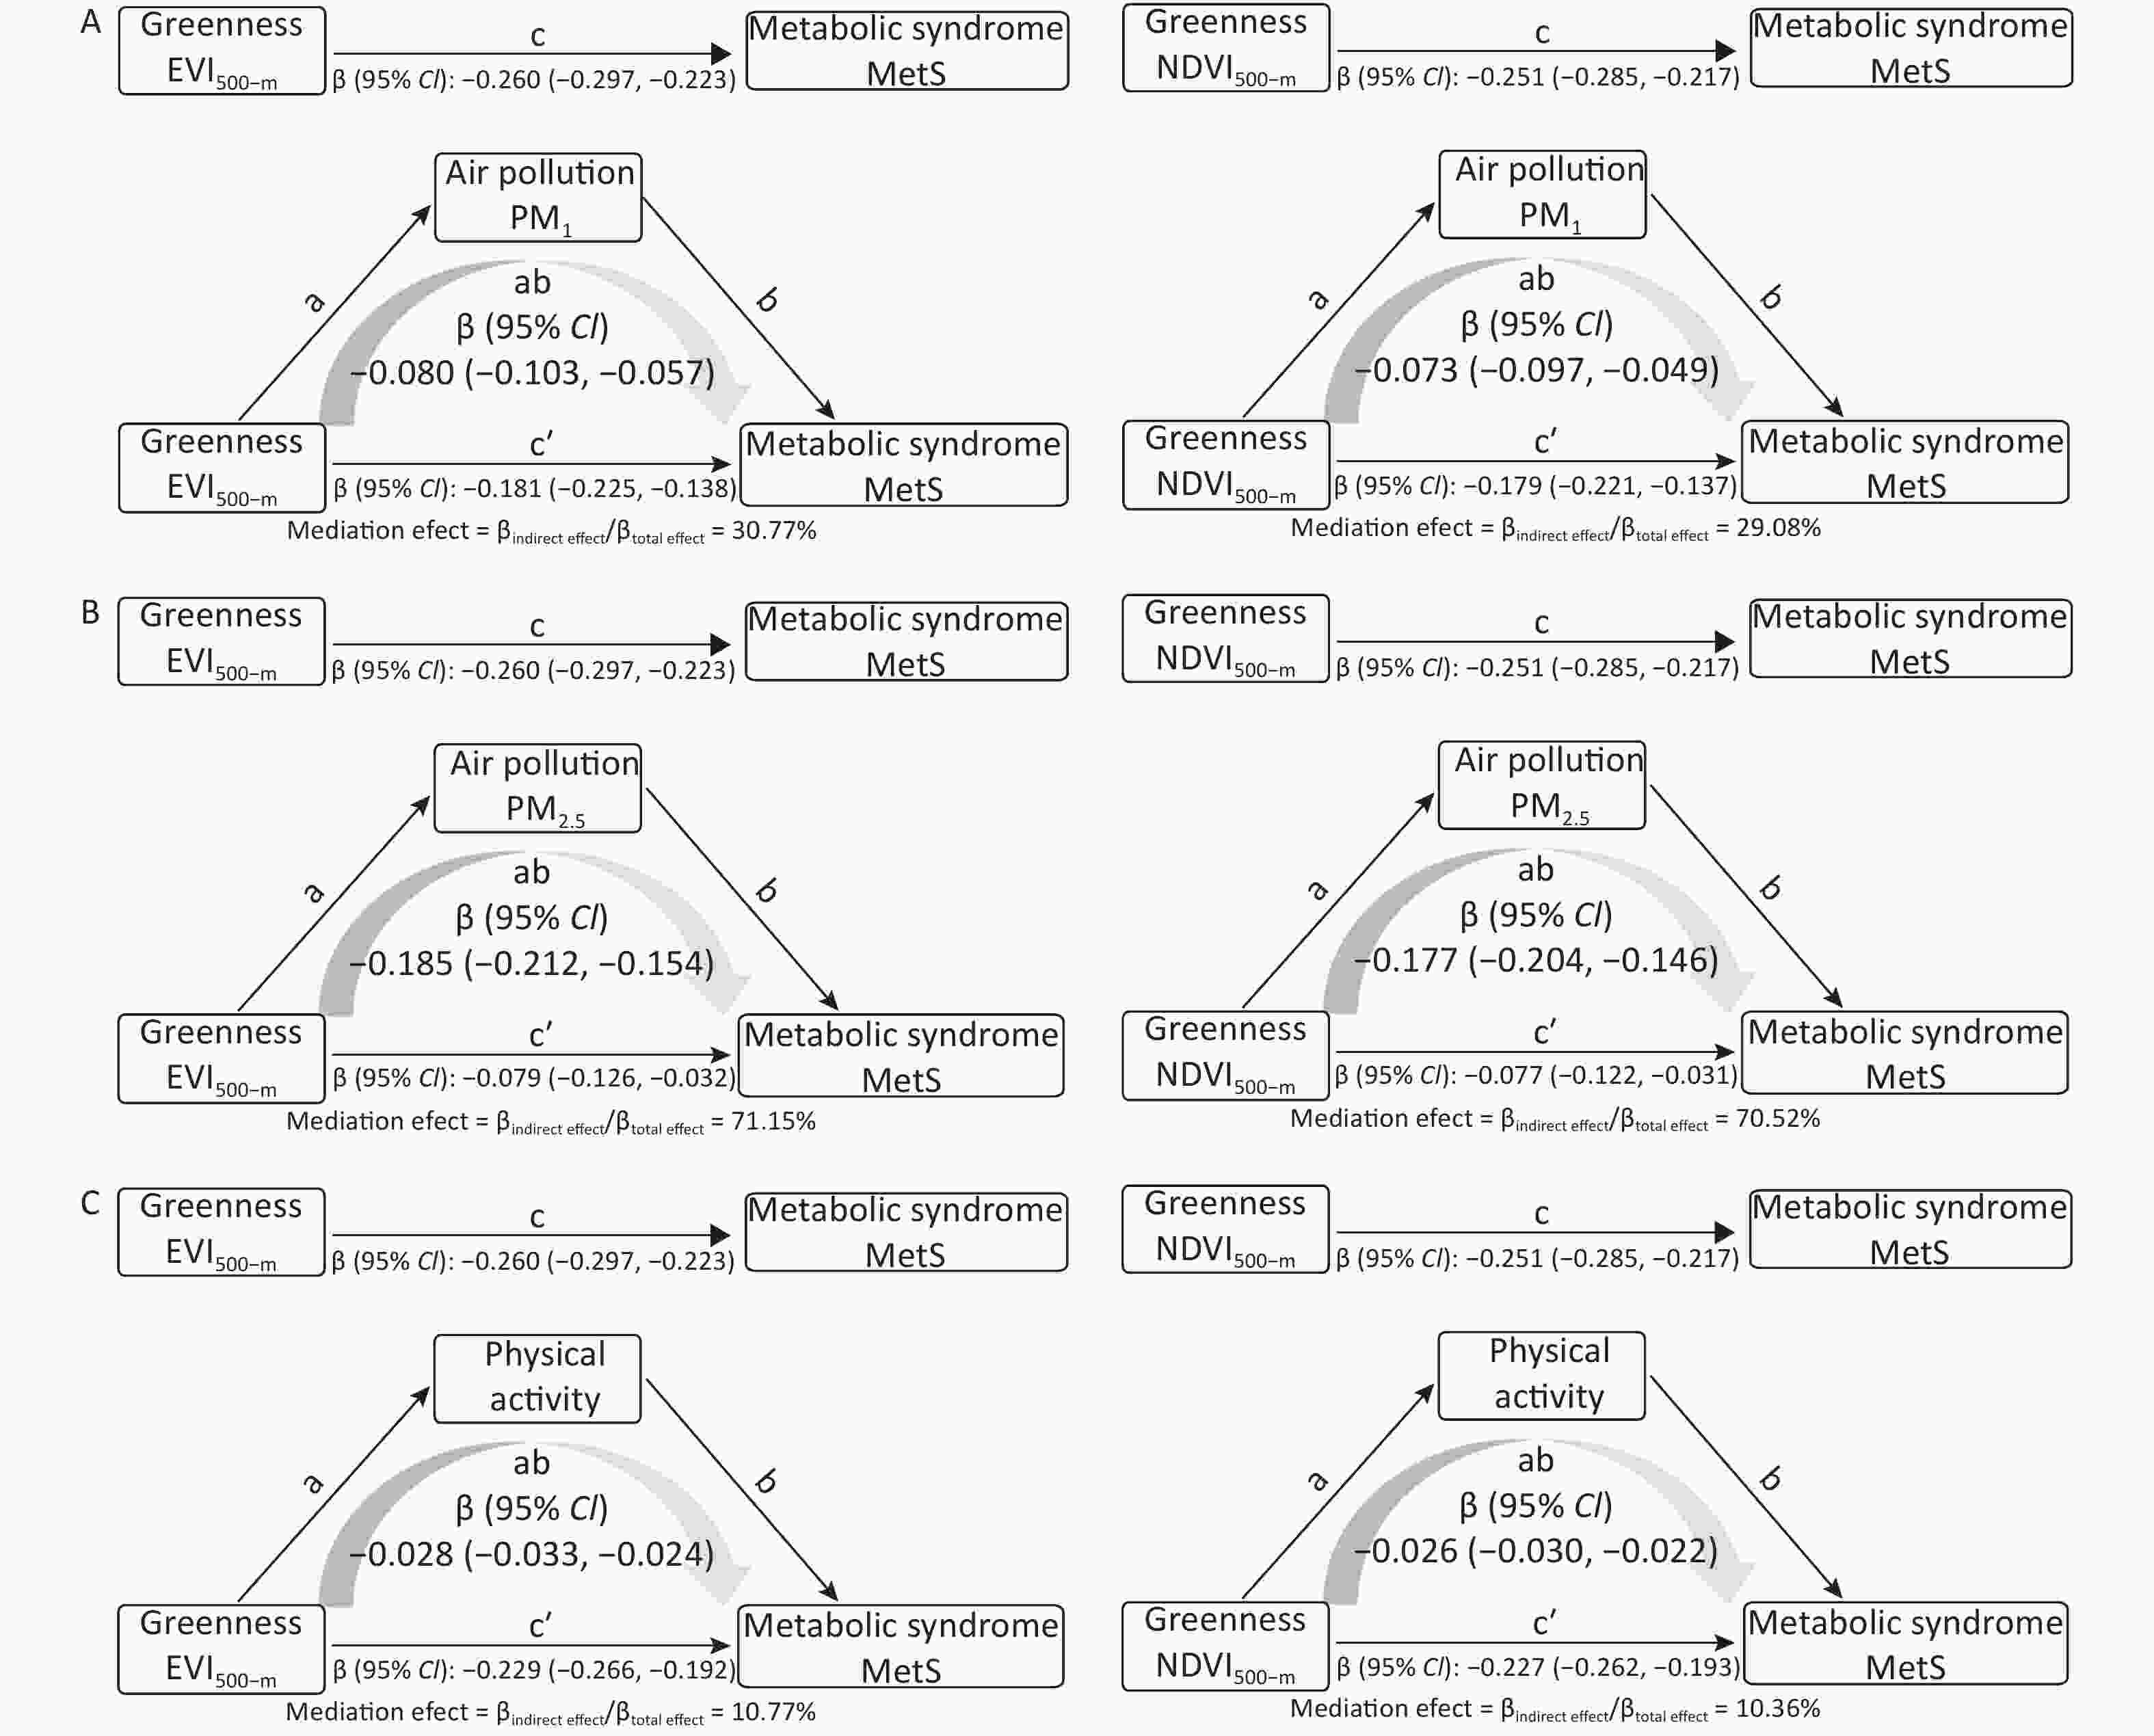
Figure 1. Mediation effects of PM1, PM2.5, and physical activity on the associations of residential greenness with MetS. (A) mediation effects of PM1; (B) mediation effects of PM2.5; (C) mediation effects of physical activity. Adjusted for age, sex, education level, marital status, and average monthly family income. MetS, metabolic syndrome; EVI500-m, Enhanced Vegetation Index across buffers of 500 m; NDVI500-m, Normalized Difference Vegetation Index across buffers of 500 m; PM1, particulate matter with an aerodynamic diameter ≤ 1.0 µm; PM2.5, particulate matter with an aerodynamic diameter ≤ 2.5 µm; CI, confidence interval.
Air pollutants Min P25 P50 P75 Max PM1 PM2.5 PM10 NO2 EVI500-m NDVI500-m Physical activity PM1 (μg/m3) 49.10 55.48 56.99 58.96 70.93 1.00 PM2.5 (μg/m3) 68.04 71.48 73.29 76.03 84.95 0.96 1.00 PM10 (μg/m3) 122.36 127.83 133.10 138.72 148.78 0.88 0.95 1.00 NO2 (μg/m3) 31.00 36.27 40.29 42.67 49.81 0.83 0.90 0.96 1.00 EVI500-m 0.10 0.28 0.36 0.39 0.44 −0.62 −0.68 −0.76 −0.70 1.00 NDVI500-m 0.16 0.43 0.52 0.55 0.61 −0.61 −0.67 −0.73 −0.67 0.95 1.00 Physical activity 0.00 11.87 16.60 21.90 45.90 −0.07 −0.05 −0.09 −0.10 0.11 0.08 1.00 Note. SD, standard deviation; IQR, interquartile range; NO2, nitrogen dioxide; PM1, particulate matter with an aerodynamic diameter ≤ 1.0 m; PM2.5, articulate matter with an aerodynamic diameter ≤ 2.5 m; PM10, articulate matter with an aerodynamic diameter ≤ 10 m; EVI500−m, Enhanced Vegetation Index across buffers of 500 m, NDVI500−m, Normalized Difference Vegetation Index across buffers of 500 m. Table S2. Average concentrations and the pairwise correlations of air pollutants, greenness and physical activity
Air pollutants ORs (95% CIs) P-value PM1 1.046 (1.037, 1.055) < 0.001 PM2.5 1.074 (1.064, 1.083) < 0.001 PM10 1.042 (1.038, 1.046) < 0.001 NO2 1.071 (1.064, 1.078) < 0.001 Physical activity 0.982 (0.980, 0.984) < 0.001 Note. NO2, nitrogen dioxide; PM1, particulate matter with an aerodynamic diameter ≤ 1.0 m; PM2.5, articulate matter with an aerodynamic diameter ≤ 2.5 m; PM10, articulate matter with an aerodynamic diameter ≤ 10 m; EVI500−m, Enhanced Vegetation Index across buffers of 500 m, NDVI500−m, Normalized Difference Vegetation Index across buffers of 500 m; ORs, odds ratio; CIs, confidence intervals. aAdjusted for age, gender, education levels, marital status, average monthly income of family. Table S3. Associations of air pollutants (PM1, PM2.5, PM10, NO2) and physical activity with MetSa
When MetS was defined by four different definition criteria (Supplementary Table S1), the associations between residential greenness and MetS were similar to the results of using the IDF definition (Supplementary Table S5, available in www.besjournal.com). The effect estimates were stable under different MetS definitions. In addition, Supplementary Table S6 (available in www.besjournal.com) shows that the associations between average residential greenness exposure levels and MetS risk were robust to different buffer radii (1,000 m and 3,000 m) as well as different exposure periods (1, 2, 4, and 5 years). Moreover, the results of mediation analyses with the causal stepwise regression approach were generally consistent with those of the bootstrap approach (Supplementary Table S7, available in www.besjournal.com). Furthermore, the results of mediation analyses with the bootstrap approach in different greenness exposure years were similar to the findings of the main analyses in general (Supplementary Table S8, available in www.besjournal.com). Besides, Supplementary Table S9 (available in www.besjournal.com) demonstrates the associations of residential greenness with the individual components of MetS as well as continuous MetS severity score.
Variables Crude model Adjusted modela ORs (95% CIs) P-value ORs (95% CIs) P-value EVI500-m IDF 0.772 (0.745, 0.800) < 0.001 0.769 (0.741, 0.798) < 0.001 NCEP/ATP III 0.794 (0.767, 0.823) < 0.001 0.787 (0.759, 0.816) < 0.001 AHA 0.794 (0.767, 0.823) < 0.001 0.787 (0.759, 0.816) < 0.001 JIS 0.794 (0.767, 0.822) < 0.001 0.787 (0.759, 0.816) < 0.001 CDS 0.775 (0.745, 0.806) < 0.001 0.761 (0.731, 0.792) < 0.001 NDVI500-m IDF 0.776 (0.750, 0.802) < 0.001 0.776 (0.750, 0.804) < 0.001 NCEP/ATP III 0.792 (0.767, 0.819) < 0.001 0.790 (0.764, 0.817) < 0.001 AHA 0.792 (0.767, 0.819) < 0.001 0.790 (0.764, 0.817) < 0.001 JIS 0.792 (0.767, 0.818) < 0.001 0.790 (0.764, 0.817) < 0.001 CDS 0.777 (0.749, 0.806) < 0.001 0.766 (0.739, 0.795) < 0.001 Note. MetS, metabolic syndrome; IDF, the International Diabetes Federation; NCEP/ATP III, the National Cholesterol Education Program/Adult Treatment Panel III Criteria; AHA, the American Heart Association; JIS, the International Association for the Study of Obesity; CDS, the Chinese Diabetes Society; ORs, odds ratio; CIs, confidence intervals. aAdjusted for age, gender, education levels, marital status, average monthly income of family. Table S5. Sensitivity analyses for the associations between residential greenness and MetS with different definitions of MetS
Variables Crude model Adjusted modela ORs (95% CIs) P-value ORs (95% CIs) P-value Different buffers (3 years) 500 m EVI 0.773 (0.745, 0.801) < 0.001 0.771 (0.743, 0.800) < 0.001 NDVI 0.776 (0.750, 0.802) < 0.001 0.778 (0.751, 0.805) < 0.001 1,000 m EVI 0.823 (0.799, 0.848) < 0.001 0.831 (0.806, 0.857) < 0.001 NDVI 0.822 (0.799, 0.845) < 0.001 0.832 (0.808, 0.856) < 0.001 3,000 m EVI 0.760 (0.733, 0.787) < 0.001 0.764 (0.737, 0.793) < 0.001 NDVI 0.779 (0.756, 0.802) < 0.001 0.783 (0.760, 0.807) < 0.001 Different years (500 m) 1 year EVI 0.814 (0.788, 0.842) < 0.001 0.813 (0.786, 0.841) < 0.001 NDVI 0.837 (0.812, 0.864) < 0.001 0.839 (0.813, 0.866) < 0.001 2 years EVI 0.783 (0.755, 0.812) < 0.001 0.783 (0.755, 0.813) < 0.001 NDVI 0.789 (0.764, 0.815) < 0.001 0.792 (0.766, 0.818) < 0.001 3 years EVI 0.773 (0.745, 0.801) < 0.001 0.771 (0.743, 0.800) < 0.001 NDVI 0.776 (0.750, 0.802) < 0.001 0.778 (0.751, 0.805) < 0.001 4 years EVI 0.756 (0.727, 0.786) < 0.001 0.754 (0.724, 0.785) < 0.001 NDVI 0.749 (0.720, 0.779) < 0.001 0.752 (0.723, 0.783) < 0.001 5 years EVI 0.765 (0.738, 0.793) < 0.001 0.765 (0.737, 0.794) < 0.001 NDVI 0.771 (0.746, 0.797) < 0.001 0.773 (0.747, 0.799) < 0.001 Note. MetS, metabolic syndrome; EVI, Enhanced Vegetation Index; NDVI, Normalized Difference Vegetation Index; ORs, odds ratios; CIs, confidence intervals. aAdjusted for age, gender, education levels, marital status, average monthly income of family. Table S6. Sensitivity analyses for the associations between residential greenness and MetS with different buffers or exposure years of greenness
Parameters β (95% CIs) EVI500-m NDVI500-m NO2 Total effect −0.260 (−0.297, −0.223) −0.252 (−0.286, −0.217) Path a −4.158 (−4.203, −4.113) −3.971 (−4.012, −3.930) Path b 0.081 (0.073, 0.089) 0.081 (0.073, 0.089) Direct effect-path c' 0.073 (0.022, 0.124) 0.066 (0.019, 0.113) PM1 Total effect −0.260 (−0.297, −0.223) −0.252 (−0.286, −0.217) Path a −2.403 (−2.441, −2.365) −2.415 (−2.450, −2.381) Path b 0.033 (0.023, 0.043) 0.030 (0.020, 0.040) Direct effect-path c' −0.181 (−0.224, −0.138) −0.179 (−0.220, −0.138) PM2.5 Total effect −0.260 (−0.297, −0.223) −0.252 (−0.286, −0.217) Path a −2.729 (−2.763, −2.695) −2.667 (−2.698, −2.637) Path b 0.068 (0.056, 0.080) 0.067 (0.055, 0.079) Direct effect-path c' −0.079 (−0.126, −0.032) −0.077 (−0.122, −0.032) PM10 Total effect −0.260 (−0.297, −0.223) −0.252 (−0.286, −0.217) Path a −7.107 (−7.176, −7.039) −6.675 (−6.738, −6.611) Path b 0.050 (0.044, 0.056) 0.049 (0.043, 0.055) Direct effect-path c' 0.092 (0.039, 0.145) 0.072 (0.023, 0.121) Physical activity Total effect −0.260 (−0.297, −0.223) −0.252 (−0.286, −0.217) Path a 1.759 (1.589, 1.929) 1.363 (1.205, 1.522) Path b −0.019 (−0.021, −0.017) −0.019 (−0.021, −0.017) Direct effect-path c' −0.229 (−0.266, −0.192) −0.227 (−0.262, −0.192) Note. MetS, metabolic syndrome; EVI500-m, Enhanced Vegetation Index across buffers of 500 m; NDVI500-m, Normalized Difference Vegetation Index across buffers of 500 m; NO2, nitrogen dioxide; PM1, particulate matter with an aerodynamic diameter ≤ 1.0 m; PM2.5, articulate matter with an aerodynamic diameter ≤ 2.5 m; PM10, articulate matter with an aerodynamic diameter ≤ 10 m; CIs, confidence intervals. aAdjusted for age, gender, education levels, marital status, and average monthly income of family. Table S7. Associations between residential greenness and MetS mediated by air pollution and physical activity by causal step regression approacha
Variables Total effect (c) (β, 95% CIs ) Direct effect (c') (β, 95% CIs ) Indirect effect (ab) (β, 95% CIs) 1 year EVI500-m NO2 −0.207 (−0.241, −0.173) 0.038 (−0.003, 0.080) −0.249 (−0.274, −0.228) PM1 −0.207 (−0.241, −0.173) −0.135 (−0.173, −0.097) −0.074 (−0.091, −0.057) PM2.5 −0.207 (−0.241, −0.173) −0.056 (−0.097, −0.016) −0.155 (−0.178, −0.135) PM10 −0.207 (−0.241, −0.173) 0.068 (0.024, 0.112) −0.281 (−0.312, −0.256) Physical activity −0.207 (−0.241, −0.173) −0.184 (−0.219, −0.150) −0.025 (−0.030, −0.021) NDVI500-m NO2 −0.175 (−0.207, −0.144) 0.042 (0.004, 0.080) −0.220 (−0.242, −0.201) PM1 −0.175 (−0.207, −0.144) −0.101 (−0.137, −0.066) −0.074 (−0.090, −0.058) PM2.5 −0.175 (−0.207, −0.144) −0.029 (−0.066, 0.009) −0.149 (−0.171, −0.130) PM10 −0.175 (−0.207, −0.144) 0.066 (0.026, 0.105) −0.245 (−0.272, −0.224) Physical activity −0.175 (−0.207, −0.144) −0.160 (−0.192, −0.128) −0.016 (−0.020, −0.013) 2 years EVI500-m NO2 −0.244 (−0.281, −0.207) 0.063 (0.015, 0.112) −0.311 (−0.343, −0.284) PM1 −0.244 (−0.281, −0.207) −0.163 (−0.205, −0.120) −0.083 (−0.105, −0.062) PM2.5 −0.244 (−0.281, −0.207) −0.064 (−0.110, −0.018) −0.184 (−0.213, −0.159) PM10 −0.244 (−0.281, −0.207) 0.093 (0.042, 0.144) −0.343 (−0.381, −0.312) Physical activity −0.244 (−0.281, −0.207) −0.218 (−0.255, −0.180) −0.028 (−0.034, −0.024) NDVI500-m NO2 −0.233 (−0.266, −0.200) 0.034 (−0.009, 0.077) −0.271 (−0.301, −0.245) PM1 −0.233 (−0.266, −0.200) −0.163 (−0.202, −0.125) −0.071 (−0.091, −0.050) PM2.5 −0.233 (−0.266, −0.200) −0.073 (−0.115, −0.031) −0.163 (−0.192, −0.140) PM10 −0.233 (−0.266, −0.200) 0.049 (0.004, 0.094) −0.288 (−0.322, −0.258) Physical activity −0.233 (−0.266, −0.200) −0.214 (−0.247, −0.181) −0.021 (−0.025, −0.018) 3 years EVI500-m NO2 −0.260 (−0.297, −0.223) 0.072 (0.022, 0.122) −0.335 (−0.371, −0.305) PM1 −0.260 (−0.297, −0.223) −0.181 (−0.225, −0.138) −0.080 (−0.103, −0.057) PM2.5 −0.260 (−0.297, −0.223) −0.079 (−0.127, −0.032) −0.185 (−0.215, −0.157) PM10 −0.260 (−0.297, −0.223) 0.091 (0.038, 0.144) −0.358 (−0.399, −0.323) Physical activity −0.260 (−0.297, −0.223) −0.229 (−0.266, −0.192) −0.033 (−0.039, −0.029) NDVI500-m NO2 −0.252 (−0.286, −0.217) 0.066 (0.018, 0.114) −0.321 (−0.357, −0.291) PM1 −0.252 (−0.286, −0.217) −0.179 (−0.221, −0.138) −0.073 (−0.097, −0.050) PM2.5 −0.252 (−0.286, −0.217) −0.077 (−0.123, −0.032) −0.178 (−0.208, −0.149) PM10 −0.252 (−0.286, −0.217) 0.072 (0.022, 0.122) −0.330 (−0.369, −0.295) Physical activity −0.252 (−0.286, −0.217) −0.228 (−0.262, −0.193) −0.026 (−0.031, −0.022) 4 years EVI500-m NO2 −0.283 (−0.323, −0.242) 0.069 (0.014, 0.123) −0.354 (−0.391, −0.322) PM1 −0.283 (−0.323, −0.242) −0.199 (−0.246, −0.153) −0.085 (−0.109, −0.061) PM2.5 −0.283 (−0.323, −0.242) −0.092 (−0.143, −0.041) −0.195 (−0.226, −0.164) PM10 −0.283 (−0.323, −0.242) 0.090 (0.033, 0.147) −0.379 (−0.422, −0.342) Physical activity −0.283 (−0.323, −0.242) −0.249 (−0.289, −0.208) −0.036 (−0.043, −0.032) NDVI500-m NO2 −0.285 (−0.325, −0.244) 0.083 (0.028, 0.138) −0.371 (−0.410, −0.336) PM1 −0.285 (−0.325, −0.244) −0.196 (−0.245, −0.148) −0.089 (−0.115, −0.062) PM2.5 −0.285 (−0.325, −0.244) −0.079 (−0.132, −0.027) −0.208 (−0.243, −0.177) PM10 −0.285 (−0.325, −0.244) 0.093 (0.036, 0.151) −0.384 (−0.431, −0.344) Physical activity −0.285 (−0.325, −0.244) −0.256 (−0.297, −0.216) −0.031 (−0.036, −0.026) 5 years EVI500-m NO2 −0.268 (−0.305, −0.231) 0.057 (0.007, 0.108) −0.329 (−0.365, −0.299) PM1 −0.268 (−0.305, −0.231) −0.195 (−0.238, −0.152) −0.075 (−0.097, −0.054) PM2.5 −0.268 (−0.305, −0.231) −0.096 (−0.142, −0.049) −0.177 (−0.207, −0.149) PM10 −0.268 (−0.305, −0.231) 0.078 (0.025, 0.132) −0.352 (−0.393, −0.317) Physical activity −0.268 (−0.305, −0.231) −0.238 (−0.275, −0.201) −0.032 (−0.038, −0.028) NDVI500-m NO2 −0.258 (−0.292, −0.224) 0.043 (−0.004, 0.090) −0.304 (−0.338, −0.274) PM1 −0.258 (−0.292, −0.224) −0.191 (−0.231, −0.150) −0.068 (−0.090, −0.046) PM2.5 −0.258 (−0.292, −0.224) −0.094 (−0.139, −0.050) −0.167 (−0.197, −0.140) PM10 −0.258 (−0.292, −0.224) 0.054 (0.004, 0.103) −0.318 (−0.357, −0.283) Physical activity −0.258 (−0.292, −0.224) −0.233 (−0.267, −0.198) −0.027 (−0.032, −0.023) Note. MetS, metabolic syndrome; EVI500-m, Enhanced Vegetation Index across buffers of 500 m; NDVI500-m, Normalized Difference Vegetation Index across buffers of 500 m; NO2, nitrogen dioxide; PM1, particulate matter with an aerodynamic diameter ≤ 1.0 m; PM2.5, articulate matter with an aerodynamic diameter ≤ 2.5 m; PM10, articulate matter with an aerodynamic diameter ≤ 10 m; CIs, confidence interval. aAdjusted for age, gender, education levels, marital status, and average monthly income of family. Table S8. Associations between residential greenness and MetS mediated by air pollution and physical activity in different exposure years of greenness by bootstrap approacha
Variables EVI500-m NDVI500-m Effect estimate (95% CIs) P-value Effect estimate (95% CIs) P-value Elevated WC* 0.716 (0.691, 0.742) < 0.001 0.725 (0.701, 0.750) < 0.001 Elevated FBG * 0.807 (0.778, 0.838) < 0.001 0.798 (0.771, 0.826) < 0.001 Elevated BP* 0.748 (0.722, 0.776) < 0.001 0.748 (0.722, 0.776) < 0.001 Elevated TG* 1.103 (1.065, 1.143) < 0.001 1.090 (1.055, 1.127) < 0.001 Reduced HDL-C* 0.836 (0.807, 0.866) < 0.001 0.849 (0.821, 0.878) < 0.001 MetS severity Z score** -0.278 (-0.317, -0.238) < 0.001 −0.294 (−0.331, −0.258) < 0.001 Note. WC, waist circumference; FBG, fasting blood glucose; BP, blood pressure; TG, triglyceride; HDL-C, high-density lipoprotein cholesterol. aAdjusted for age, gender, education levels, marital status, average monthly income of family. *Effect estimates expressed as odds ratios [ORs, 95% confidence intervals (CIs)]. **Effect estimate expressed as beta [β, 95% confidence intervals (CIs) ]. Table S9. Associations of greenness with components of MetS and MetS severity scorea
This study was based on a large sample of the Chinese rural population, and the findings might have notable policy implications for increasing residential greenness in rural China. However, several limitations of this study should be noted. Firstly, causality could not be determined due to the cross-sectional study design. Secondly, since the information on variables came mainly from a retrospective questionnaire, the recall bias was inevitable. Thirdly, the greenness was assessed on the basis of geocoded residential addresses from remote sensing, which is a relatively crude exposure assessment approach. More studies should be conducted in the future to assess the health effects of exposure to different vegetation types (such as trees, grass, and shrubs). Furthermore, because vegetation indices represent the overall level of vegetation, in future studies, we may use Google Street View (GSV) and deep learning to calculate the Green Landscape Index (GVI), which refers to greenness from the visual perspective of pedestrians [10]. Fourthly, the current study considered only the type (vigorous, moderate, walking, and sitting), frequency and duration of physical activity, but not whether the activity was performed in green areas or in other settings. Finally, the source of the study population in this cohort was relatively concentrated (Henan province, China), thus, limiting the ability to make comparisons between regions. Comparative analyses of participants from different cohorts could be considered in future studies.
In conclusion, residential greenness exposure was inversely associated with MetS prevalence in rural China, particularly in men, older people, and those with a high average monthly family income. PM1, PM2.5, and physical activity may be involved in the mechanisms underlying the beneficial effect of residential greenness on MetS. Future longitudinal studies are needed to verify our findings.
All authors declare that they have no competing or financial interests to disclose.
The authors thank all participants and coordinators for their support during the research. In addition, the authors thank Dr. Tanko Abdulai for his critical reading of the manuscript.
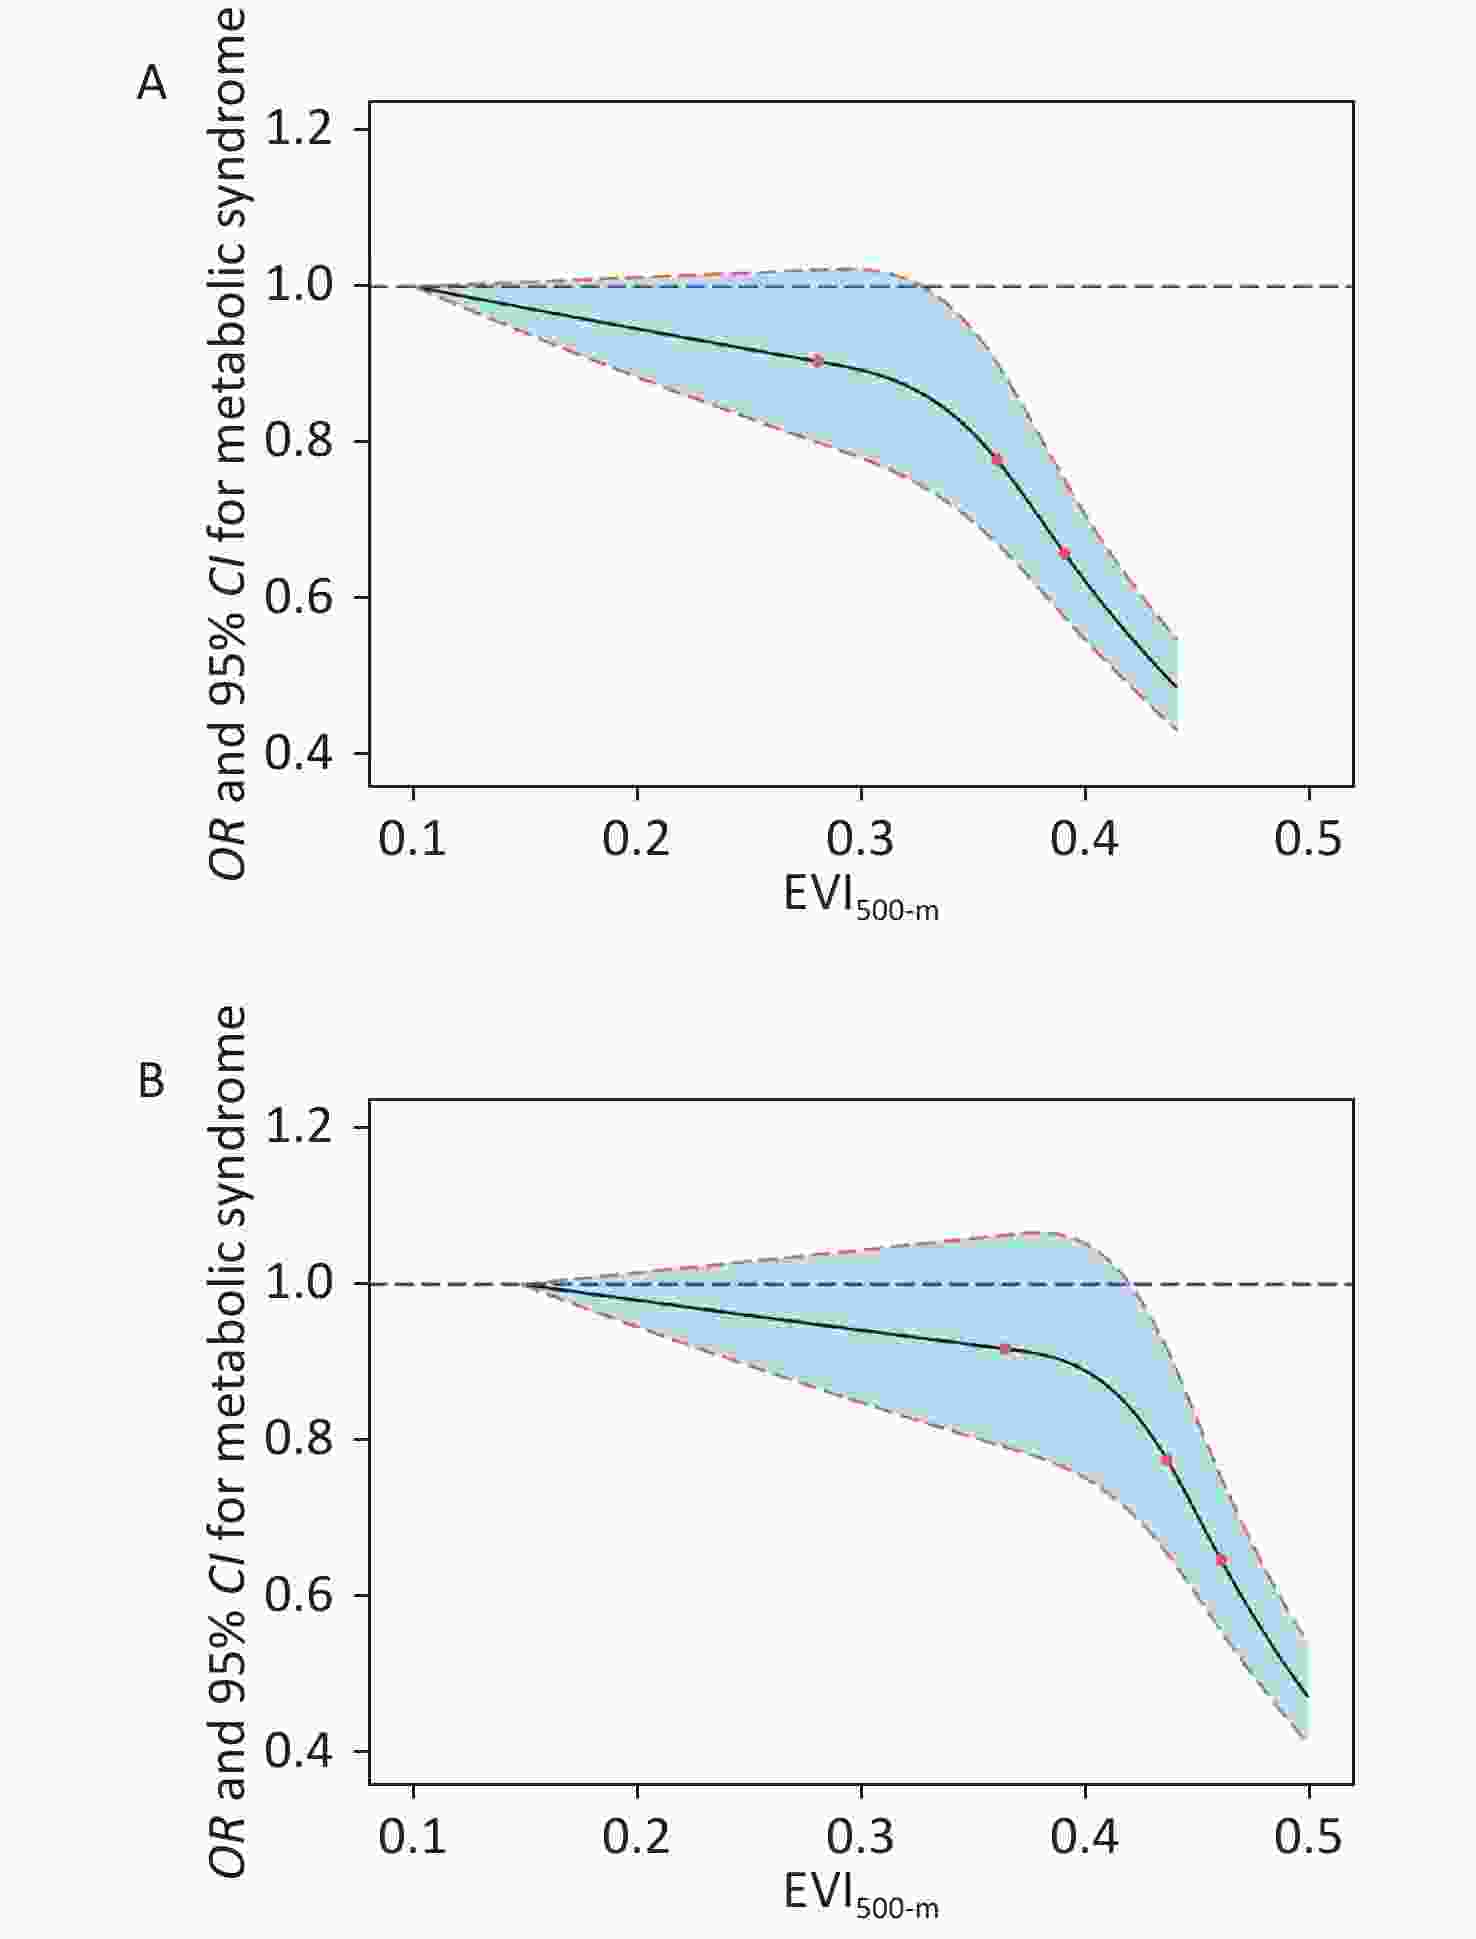
Figure S2. The concentration-response relationship for MetS with long-term residential greenness exposure (solid lines, ORs; dashed lines, 95% CIs). (A) relationship with EVI500-m; (B) relationship with NDVI500-m. Adjusted for age, gender, education levels, marital status, and average monthly income of family. MetS, metabolic syndrome; EVI500-m, Enhanced Vegetation Index across buffers of 500 m; NDVI500-m, Normalized Difference Vegetation Index across buffers of 500 m.
Variables Total effect (c) Direct effect (c′) Indirect effect (ab) Proportionb (β, 95% CIs) (β, 95% CIs) (β, 95% CIs) ab/c (%) | ab/c′ | EVI500-m NO2 −0.260 (−0.297, −0.223) 0.073 (0.022, 0.123) −0.336 (−0.370, −0.301) 4.60 PM1 −0.260 (−0.297, −0.223) −0.181 (−0.225, −0.138) −0.080 (−0.103, −0.057) 30.77 PM2.5 −0.260 (−0.297, −0.223) −0.079 (−0.126, −0.032) −0.185 (−0.212, −0.154) 71.15 PM10 −0.260 (−0.297, −0.223) 0.092 (0.039, 0.145) −0.358 (−0.396, −0.320) 3.89 Physical activity −0.260 (−0.297, −0.223) −0.229 (−0.266, −0.192) −0.028 (−0.033, −0.024) 10.77 NDVI500-m NO2 −0.251 (−0.285, −0.217) 0.066 (0.018, 0.114) −0.321 (−0.353, −0.286) 4.86 PM1 −0.251 (−0.285, −0.217) −0.179 (−0.221, −0.137) −0.073 (−0.097, −0.049) 29.08 PM2.5 −0.251 (−0.285, −0.217) −0.077 (−0.122, −0.031) −0.177 (−0.204, −0.146) 70.52 PM10 −0.251 (−0.285, −0.217) 0.072 (0.023, 0.122) −0.330 (−0.366, −0.292) 4.38 Physical activity −0.251 (−0.285, −0.217) −0.227 (−0.262, −0.193) −0.026 (−0.030, −0.022) 10.36 Note. MetS, metabolic syndrome; EVI500−m, Enhanced Vegetation Index across buffers of 500 m; NDVI500−m, Normalized Difference Vegetation Index across buffers of 500 m; NO2, nitrogen dioxide; PM1, particulate matter with an aerodynamic diameter ≤ 1.0 m; PM2.5, articulate matter with an aerodynamic diameter ≤ 2.5 m; PM10, articulate matter with an aerodynamic diameter ≤ 10 m; CIs, confidence interval. aAdjusted for age, gender, education levels, marital status, average monthly income of family. bIt indicates a mediation effect when the directions of indirect effect and direct effect are the same, while it means a suppressing effect when the directions are opposite. The proportion of mediation effect was calculated as (βindirect effect / βtotal effect) (ab/c) ×100% and suppressing effect was expressed as (βindirect effect / βdirect effect) (| ab/c′ |). Table S4. Associations between residential greenness and MetS mediated by air pollution and physical activity by Bootstrap approacha
HTML
Reference
 Supplementary Materials21146.pdf
|

|

 Quick Links
 DownLoad: