


-
Cardiovascular disease (CVD) caused by atherosclerosis (AS) is one of the most common causes of death worldwide. In 2015, more than 170 million people died of CVD, accounting for 31% of global deaths[1]. How to prevent the occurrence of AS, delay pathological development and decrease the extent of vascular disease has been a major global medical issue. Current studies have found many risk factors for AS, including vascular endothelial dysfunction, dyslipidemia, inflammatory factors, immune factors, plaque rupture and smoking. Inflammatory factors such as monocyte chemoattractant protein-1 (MCP-1), nuclear factor kappa B (NF-κB) and interleukin-6 (IL-6) increase when inflammation occurs in early stages of AS formation[2]. The level of inflammation has been shown to be strongly correlated with the production of AS, and the ameliorating inflammation decreases the occurrence and development of AS and ultimately decreases the incidence of CVD.
Emerging evidence indicates that dietary fatty acids play important roles in blood lipid levels and inflammation, and dietary trans fatty acids and long-chain saturated fatty acids are currently believed to increase the incidence of AS[3,4]. A recent study has found that saturated fatty acids (SFAs) activate the lipopolysaccharide (LPS)-mediated Toll-like receptor (TLR) pathway and stimulate the release of inflammatory factors. Administration of excessive SFAs in animal experiments also increases serum inflammatory factors in animals[5], and the level of inflammation may be associated with the length of the fatty acid carbon chain. For example, dodecanoic acid has a greater effect on inflammation than myristic acid and octadecanoic acid[6]. Moreover, palmitic acid (C16:0) and stearic acid promote macrophage production of inflammatory factors, such as tumor necrosis factor-α (TNF-α) and interleukin-1β (IL-1β)[7].
Medium-chain fatty acids (MCFAs) are dietary fats containing 6–12 carbon atoms. The most common MCFAs are caprylic acid (C8:0) and capric acid (C10:0), which are widely found in foods such as human breast milk, cow’s milk and coconut oil. MCFAs combine with glycerol, thus, forming medium-chain triglyceride (MCT). In population studies, MCT, compared with long-chain triglyceride, has been found to improve body composition and decrease body fat content. Moreover, MCT decreases the level of serum total cholesterol (TC) and low density lipoprotein cholesterol (LDL-C) while increasing the level of high density lipoprotein cholesterol (HDL-C)[8]. We previously reported that MCT attenuates apoE-/- AS plaque formation, improves AS formation and up-regulates the expression of ATP-binding cassette transporter A1 (ABCA1) in the liver[9].
ABCA1, a membrane protein, has been reported to decrease AS through two main mechanisms: the transportation of excess cholesterol from macrophages and the inhibition of inflammation. ABCA1 inhibits inflammation through many classic pathways, including those involving Janus kinase 2 (JAk2)/signal transducer and activator of transcription 3 (STAT3), Rho GTPase CDC42, protein kinase A (PKA) and protein kinase C (PKC)[10]. The JAK2/STAT3 signal pathway transports excess cholesterol and causes anti-inflammatory effects. The anti-inflammatory pathway involves the activation of STAT3 phosphorylation after the phosphorylation of JAK2, thus, ultimately regulating downstream inflammatory factors, such as TNF-α, IL-6, MCP-1 and pNF-κBp65 (p65), whose increase can lead to AS[11,12]. In this study, we performed further animal and cell experiments with LPS treatment to observe the influence of C8:0 on the ABCA1/JAK2/STAT3 signaling pathway and related inflammatory factors.
-
To high-fat feed, we added the same amounts of various fatty acids to the following groups: high fat base group (HFD group), 2% caprylic acid feed (C8:0 group), 2% palmitic acid feed (C16:0 group) and 2% eicosapentaenoic acid feed (EPA group). The proportion of energy from fat in the HFD group was 37.11%, whereas that in the other groups was 39.68%. The feed, as previously described[13], was provided by Beijing Huafukang Company (license No.: SCXK Beijing 2014-0008).
-
The experimental animals included 56 male 6-week-old C57BL/6J mice, which were purchased from SPF (Beijing) biotechnology Co, Ltd. The mice were randomly divided into four groups according to body weight. High fat feed was provided for 1 week and then replaced by intervention feed. The experiment was completed at 12 weeks. During the experiment, fasting weight was measured once per month (drinking water was not limited during fasting the night before measurements). The mouse bedding and drinking water were replaced every 2–3 days, and the remaining amount and added amount of mouse feed were recorded. The daily average feed consumption of each mice was calculated. All experimental procedures were performed in strict accordance with the regulations of the Ethics Committee of the International Association for the Study of Pain (Zimmermann, 1983) and National Guidelines for the Care and Use of Laboratory Animals (The Ministry of Science and Technology of China, 2006). This research was approved by the Animal Care and Use Committee of the Chinese PLA General Hospital.
-
The RAW246.7 cell line was obtained from the American Type Culture Collection, and the cells were cultured in Roswell Park Memorial Institute (RPMI)-1640 medium (Invitrogen, Carlsbad, CA, USA) with 10% fetal bovine serum (HyClone, Logan, UT, USA), 100 U/mL penicillin (Invitrogen), 0.1 mg/mL streptomycin (HyClone) and 1 mm sodium pyruvate at 37 ℃ under humidified air and 5% CO2. The cell count was adjusted to 4 × 10⁵ – 8 × 10⁵/mL (measured with a hemocytometer: cell number/mL = 100 cells per 100 cells/400 × 10,000 dilution factor), were harvested for subsequent assays.
-
Various fatty acids were diluted with 95% ethanol solution and serum-free medium (containing 20 mg/mL BSA); 200 mmol/L was added to culture wells, and 0.3 mmol/L with cAMP was added to culture wells.
Experimental groups and treatments: RAW 264.7 cells were seeded in 24-well plates at approximately 2 × 10⁵ per well and randomly divided into five groups (n = 6): normal group, LPS group (final LPS concentration 50 ng/mL), LPS+C8:0 group (LPS final concentration 50 ng/mL and C8:0 final concentration 200 mmol/L), LPS+EPA group (LPS final concentration 50 ng/mL and EPA final concentration 200 mmol/L) and LPS+cAMP group (LPS final concentration 50 ng/mL and cAMP final concentration is 0.3 mmol/L). After 24 h, the cells were collected and isolated to extract RNA and proteins for analysis after being washed three times with refrigerated PBS.
-
The levels of serum lipid were determined using commercial kits. TC and triglycerides (TG) (Wako, Osaka, Japan), and HDL-C and LDL-C (Abcam, Cambridge, UK) were measured with commercial kits, and the ratio of HDL-C to LDL-C was subsequently calculated.
-
After the addition of fatty acids, the cells were continuously cultured for 24 h, and cell lysates were collected from each group. After 4 ℃, 3,000 r/min centrifugation for 10 min, the supernatant was collected. TNF-α, IL-1β, IL-6, interleukin-10 (IL-10) and MCP-1 were determined in cells and serum according to the manufacturer’s instructions for the ELISA kit (R&D Systems, Minneapolis, MN, USA).
-
Total RNA from RAW cells and aorta samples (approximately 50 mg) was isolated with TRIzol reagent (Invitrogen, Carlsbad, CA, USA) and then reverse transcribed with a reverse transcription system kit (NEB, M-MLV kit). The cycling conditions were 25 ℃ for 5 min, 50 ℃ for 15 min, 85 ℃ for 5 min and 4 ℃ for 10 min for cDNA, then 50 ℃ for 2 min, 95 ℃ for 10 min, 95 ℃ for 30 s and 60 ℃ for 30 s. After 40 cycles, dissolution curves were analyzed, and only the sample with a single dissolution peak was collected. With normalization to the β-actin gene, the relative expression levels were calculated with the △Ct method, and the experiments were repeated in triplicate. The primers used in the current study are listed in Table 1.
Indicators Primer Sequence (5‘−3’) Size (bp) β-actin Forward GGCCGAGGAGCAAGAATGG 118 Reverse CATGCACTCTGCGATACGCT ACBA1 Forward GCTTGTTGGCCTCAGTTAAGG 135 Reverse GTAGCTCAGGCGTACAGAGAT JAK2 Forward AGTGGCGGCATGATTTTGTT 181 Reverse GCTCGAACGCACTTTGGTAA STAT3 Forward GTAGAGCCATACACCAAGCAGCAG 123 Reverse AATGTCGGGGTAGAGGTAGACAAGT p65 Forward CACCGGATTGAAGAGAAGCG 194 Reverse AAGTTGATGGTGCTGAGGGA Note. ABCA1, ATP-binding cassette transporter A1; JAK2, Janus kinase 2; STAT3, signal transducer and activator of transcription 3; p65, pNF-κBp65. Table 1. RT-PCR primer list
-
The cells were extracted with RIPA buffer (CST). Immunoblotting for STAT3 (1:1,000), JAK2 (1:1,000), p-STAT3 (1:1,000), p-JAK2 (1:1,000), p65 (1:1,000), β-actin (1:1,000) and ABCA1 (1:200) was performed with established procedures. Bands were visualized with a chemiluminescence detection system (Vilber Lourmat, France) according to the manufacturer’s instructions.
-
On the basis of a preliminary experiment, G*Power 3.1.9.2 software (Heinrich-Heine University, Germany) was used to calculate the minimum sample size required for the detection of a significant difference (P < 0.05). All data in this report are presented as the mean ± standard derivation, and significance was defined as P < 0.05 (two-tailed). A one-way analysis of variance was performed for data analysis. The Tukey-Kramer multiple comparison was used to determine the statistical significance of differences among various groups. SPSS 26.0 (SPSS, Inc., Chicago, IL, USA) was used for all statistical analyses.
-
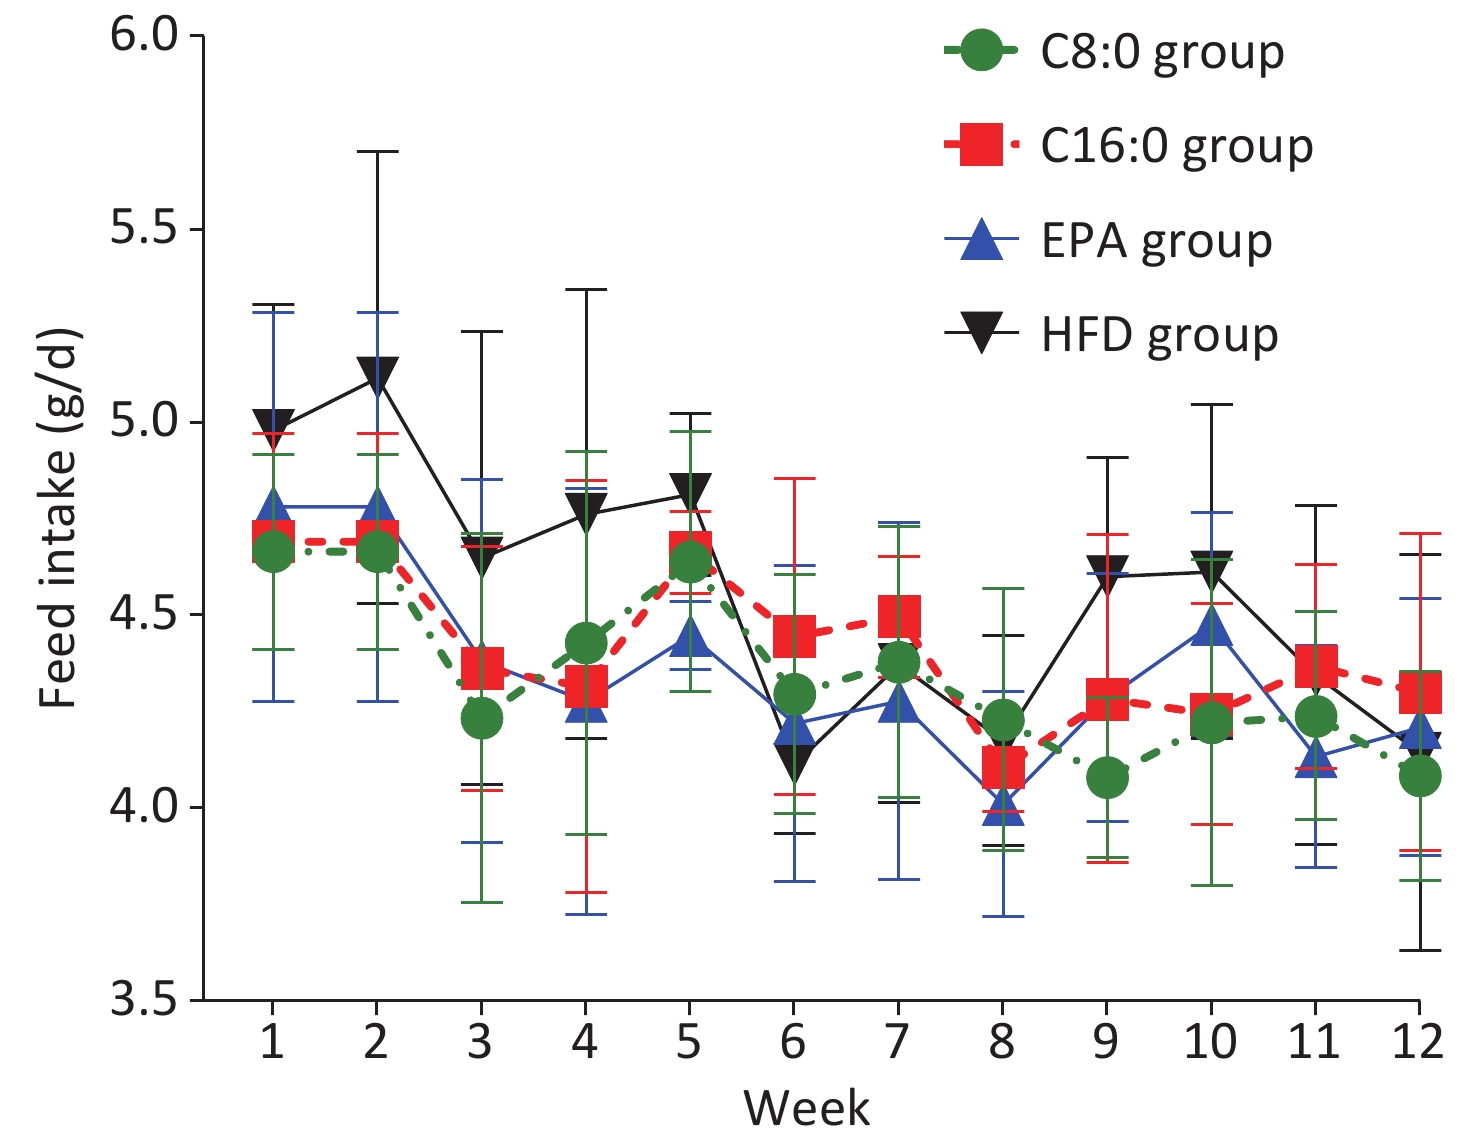
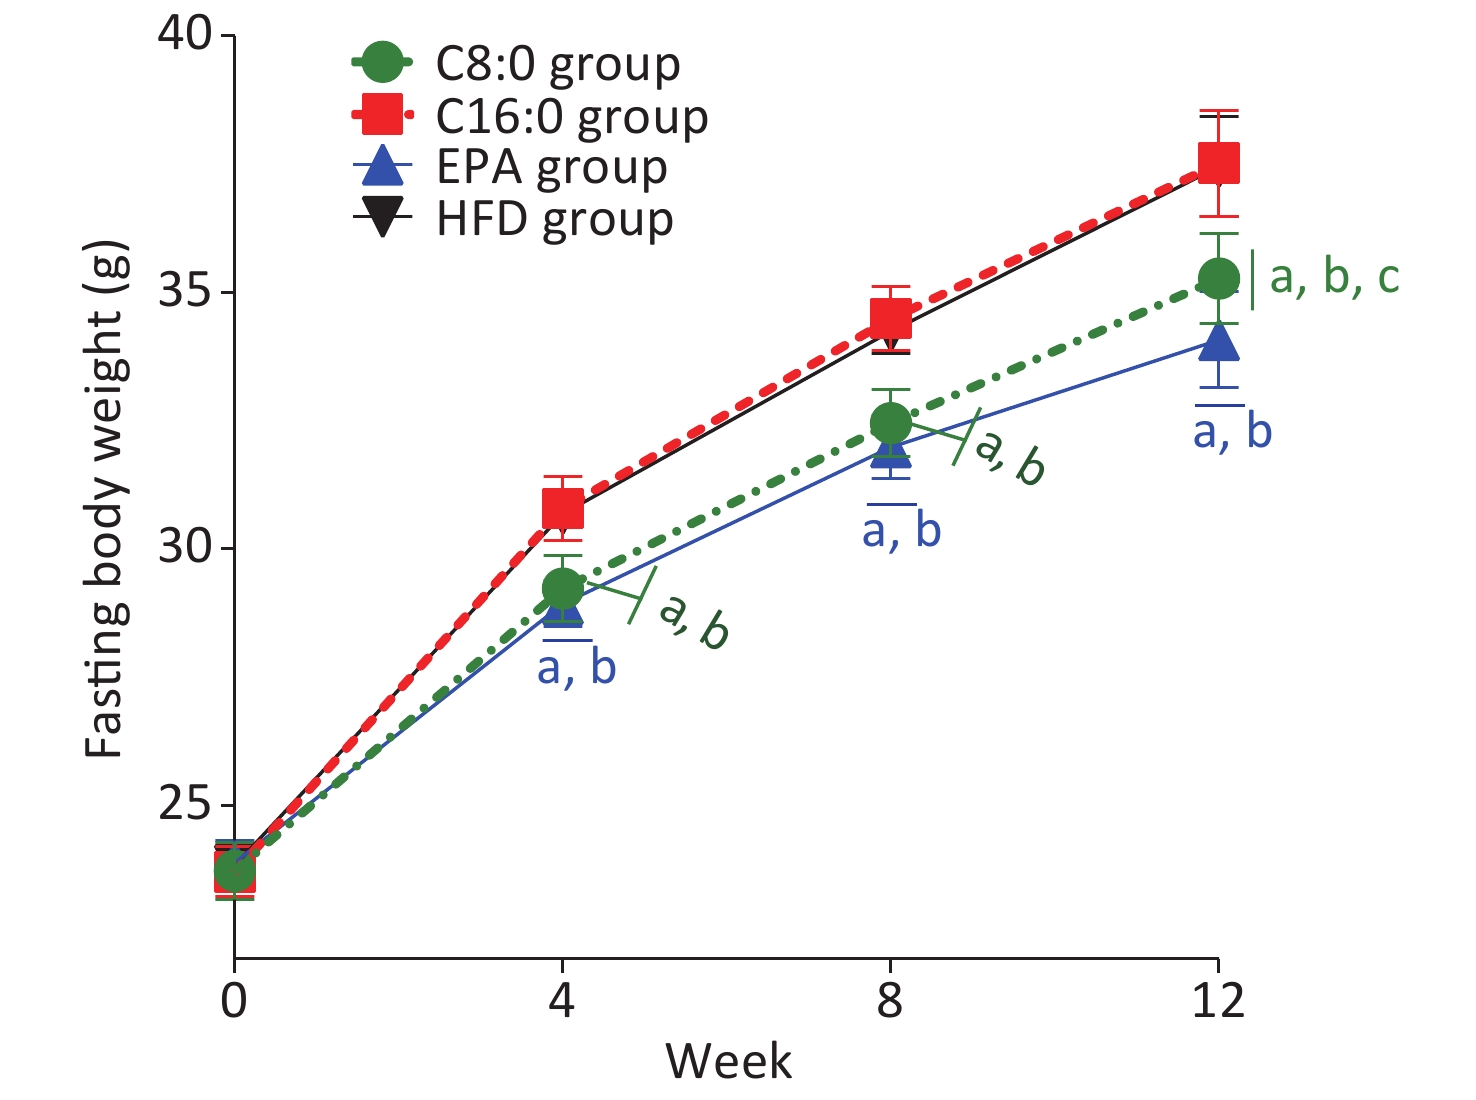
At 4, 8 and 12 weeks during the intervention, the fasting body weights in the C8:0 group and EPA group were found to be significantly lower than those in the HFD group and C16:0 group (P < 0.05) (Figure 1). During the study, no significant difference in average feed intake was observed (P > 0.05) (Figure 2).
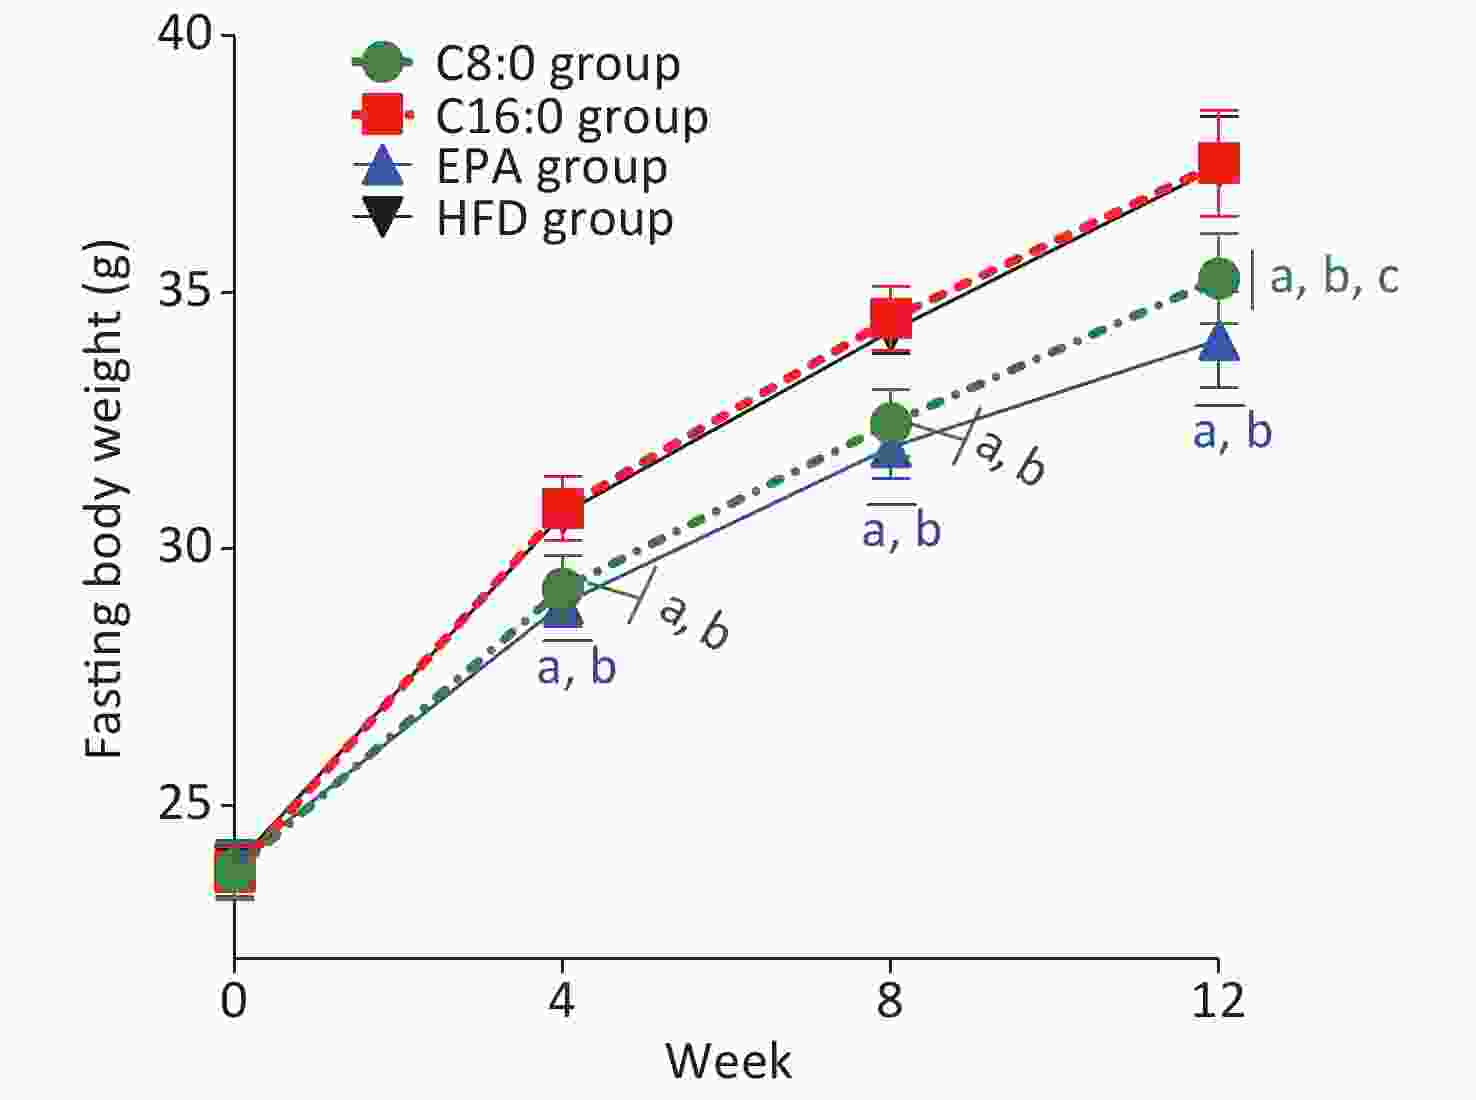
Figure 1. Effects of different fatty acids (C8:0, C16:0 and EPA) on fasting body weight of C57BL/6J mice. C8:0, caprylic acid; C16:0, palmitic acid; EPA, eicosapentaenoic acid; HFD, high-fat diet. Data in the figure are expressed as the mean ± SD with 14 samples in each group (n = 14). aP < 0.05, versus high-fat group; bP < 0.05, versus C16:0 group; cP < 0.05, versus EPA group
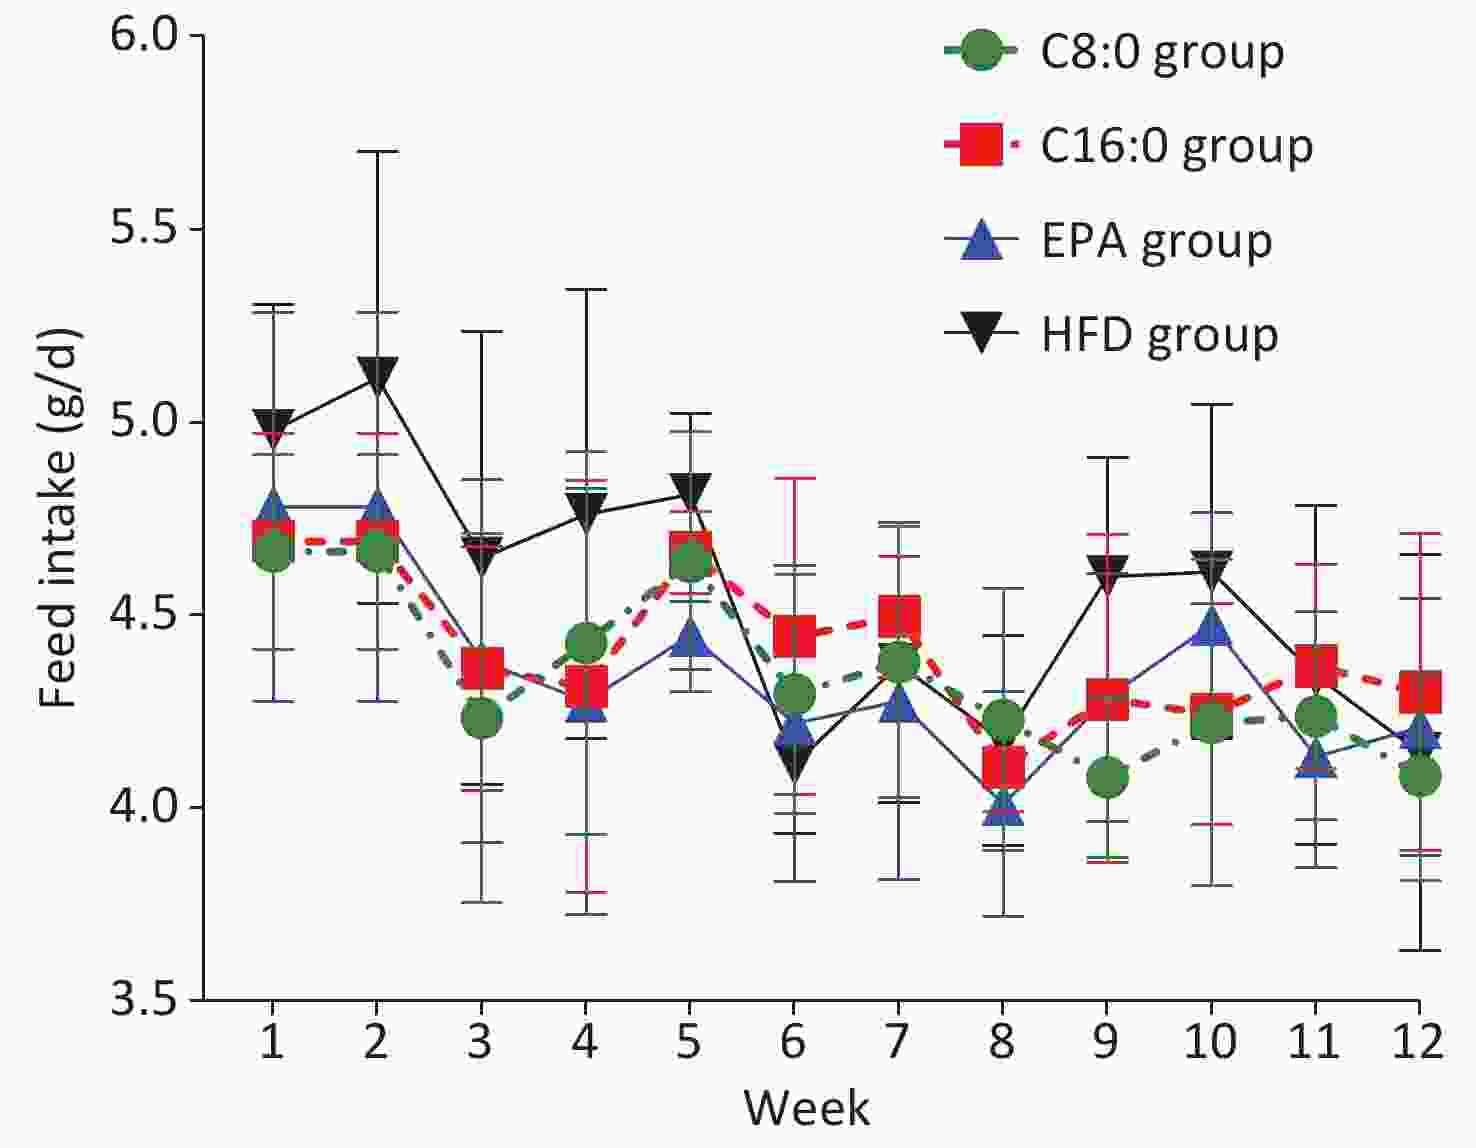
Figure 2. Effects of different fatty acids (C8:0, C16:0 and EPA) on the feed intake of C57BL/6J mice. C8:0, caprylic acid; C16:0, palmitic acid; EPA, eicosapentaenoic acid; HFD, high-fat diet. Data in the figure are expressed as the mean ± SD with 14 samples in each group (n = 14)
-
After 12 weeks of intervention, half the mice (n = 7) were randomly selected from each group and intraperitoneally injected with LPS. The expression levels of lipid metabolism indexes, inflammatory factors and mRNA of ABCA1 and JAK2/STAT3, pathway related factors in arteries were measured.
At the end of the intervention, compared with that in the HFD group, the serum TC in the C8:0 group was significantly lower (P < 0.05). The levels of serum TC and LDL-C were significantly lower in the EPA group than the HFD group, whereas the LDL-C levels were significantly higher, and the HDL-C/LDL-C ratio was clearly higher, than that in the C16:0 group (P < 0.05) (Table 2). Our data showed that C8:0 decreased the level of TC. EPA decreased the TC and LDL-C, and up-regulated the HDL-C/LDL-C ratio (P > 0.05).
Indicators −LPS +LPS C8:0 C16:0 EPA HFD C8:0 C16:0 EPA HFD TC (mmol/L) 3.27 ± 0.14a 3.49 ± 0.29 3.15 ± 0.38a 3.67 ± 0.16 3.47 ± 0.23a 3.95 ± 0.40 2.86 ± 0.48a,b 4.26 ± 0.80 TG (mmol/L) 0.67 ± 0.11 0.62 ± 0.21 0.71 ± 0.24 0.93 ± 0.35 0.71 ± 0.19 0.66 ± 0.11 0.63 ± 0.27 0.57 ± 0.09 HDL-C (mmol/L) 1.39 ± 0.13 1.19 ± 0.25 1.28 ± 0.16 1.40 ± 0.16 1.47 ± 0.13 1.44 ± 0.08 1.38 ± 0.18 1.29 ± 0.11 LDL-C (mmol/L) 0.56 ± 0.07c 0.55 ± 0.01c 0.45 ± 0.03a,b 0.55 ± 0.03c 0.44 ± 0.04a 0.52 ± 0.07 0.39 ± 0.07a,b 0.54 ± 0.08 HDL-C/LDL-C 2.52 ± 0.45 2.17 ± 0.46 2.82 ± 0.42b 2.55 ± 0.27 3.32 ± 0.25a 2.83 ± 0.44 3.69 ± 0.75a,b 2.45 ± 0.56 Note. C8:0, caprylic acid; C16:0, palmitic acid; EPA, eicosapentaenoic acid; HFD, high-fat diet; LPS, lipopolysaccharide; TC, total cholesterol; TG, triglyceride; HDL-C, high density lipoprotein cholesterol; LDL-C, low density lipoprotein cholesterol; aP < 0.05, versus HFD group; bP < 0.05, versus C16:0 group; cP < 0.05, versus EPA group. Table 2. Effects of different fatty acids on blood lipids in C57BL/6j mice without or with LPS injection (
$\bar x$ ± s, n = 7)At the end of the intervention, after injection of LPS, the serum TC and LDL-C levels were significantly lower, and the HDL-C/LDL-C ratio was clearly higher, in the C8:0 group than the HFD group (P < 0.05). Moreover, the serum TC and LDL-C levels were significantly lower, and the HDL-C/LDL-C ratio was clearly higher, in the EPA group than the C16:0 and HFD groups (P < 0.05) (Table 2). Our study indicated that both C8:0 and EPA decreased the TC and LDL-C levels and increased the HDL-C/LDL-C ratio after LPS treatment.
-
At the end of the intervention, the levels of IL-1β and TNF-α in the HFD group (+LPS) were significantly higher, and those of IL-10 were significantly lower, than those in the HFD group (-LPS) (P < 0.05). The levels of TNF-α and MCP-1 clearly increased in the C16:0 group (+LPS), thus indicating that LPS increased the serum inflammation in the mice (P < 0.05) (Table 3).
Indicators −LPS +LPS C8:0 C16:0 EPA HFD C8:0 C16:0 EPA HFD IL-1β 4.89 ± 0.53 4.81 ± 1.37 4.67 ± 0.82 4.65 ± 0.48* 4.81 ± 0.91 5.33 ± 1.08 5.10 ± 0.68 5.43 ± 0.46 IL-6 110.78 ± 17.19 117.18 ± 24.29 114.56 ± 19.85 113.53 ± 15.99 119.89 ± 13.51 127.49 ± 30.40 119.46 ± 16.80 119.42 ± 22.97 IL-10 3.29 ± 1.09 2.42 ± 1.09 2.62 ± 0.60 2.57 ± 0.54* 4.85 ± 1.06a,b,c 2.50 ± 1.00 2.66 ± 0.90 1.89 ± 0.28 MCP-1 44.75 ± 10.54 51.93 ± 6.02* 44.08 ± 9.04 52.54 ± 6.04 48.51 ± 10.38b 61.65 ± 3.60 51.70 ± 4.97b 58.86 ± 6.47 TNF-α 4.00 ± 0.69 4.73 ± 0.92* 3.87 ± 0.97 4.78 ± 0.80* 4.05 ± 1.09a,b 6.23 ± 1.01 4.26 ± 0.70a,b 6.91 ± 0.86 Note. C8:0, caprylic acid; C16:0, palmitic acid; EPA, eicosapentaenoic acid; HFD, high-fat diet; LPS, lipopolysaccharide; TNF-α, tumor necrosis factor α; IL-1β, interleukin-1β; IL-6, interleukin-6; IL-10, interleukin-10; MCP-1, monocyte chemoattractant protein-1; *P < 0.05, versus LPS group; aP < 0.05, versus HFD group; bP < 0.05, versus C16:0 group; cP < 0.05, versus EPA group. Table 3. Effects of different fatty acids on serum inflammatory factors in C57BL/6j mice (
$\bar x$ ± s, n = 7)After intraperitoneal injection of LPS, the levels of MCP-1 in the C8:0 group were significantly lower than those in the C16:0 group, and the level of TNF-α was significantly lower than those in the HFD group and the C16:0 group (P < 0.05). Compared with those in the other three groups, the IL-10 levels in the C8:0 group were significantly higher, whereas the TNF-α levels in the EPA group were significantly lower than those in the HFD group and C16:0 group. In addition, the MCP-1 levels in the EPA group were significantly lower than those in the C16:0 group (P < 0.05). Our data suggested that C8:0 significantly inhibited LPS-stimulated serum inflammation in mice (Table 3).
-
By the end of the intervention, the mRNA levels of JAK2/STAT3 significantly increased; those of NF-κB and TNF-α dramatically decreased in each group after LPS injection; and those of ABCA1 also significantly increased in the C8:0 and EPA groups (P < 0.05) (Table 4). Compared with those in the other three groups, the expression levels of ABCA1 in the C8:0 group were significantly higher, whereas those of TNF-α and NF-κB in the C8:0 group and EPA group were significantly lower than those in the HFD group and C16:0 group. JAK2 in the C8:0 group was significantly higher than that in the C16:0 group, and STAT3 in the C8:0 group was significantly higher than that in the HFD group (P < 0.05).
Indicators −LPS +LPS C8:0 C16:0 EPA HFD C8:0 C16:0 EPA HFD ABCA1 0.17 ± 0.04a,b,c,* 0.09 ± 0.02 0.11 ± 0.01* 0.09 ± 0.02 0.22 ± 0.02a,b,c 0.07 ± 0.03 0.14 ± 0.01b 0.10 ± 0.05 JAK2 0.21 ± 0.03b,* 0.14 ± 0.04* 0.18 ± 0.05 0.16 ± 0.04* 0.57 ± 0.23a,b,c 0.29 ± 0.15 0.17 ± 0.02 0.26 ± 0.10 STAT3 0.23 ± 0.05a,* 0.17 ± 0.06* 0.19 ± 0.03* 0.15 ± 0.03* 0.93 ± 0.30a,b,c 0.26 ± 0.05 0.34 ± 0.15 0.38 ± 0.16 TNF-α 0.08 ± 0.01a,b,* 0.15 ± 0.04* 0.08 ± 0.02a,b,* 0.17 ± 0.06* 0.15 ± 0.06a,b 0.27 ± 0.08 0.14 ± 0.06a,b 0.26 ± 0.07 NF-κB 0.08 ± 0.03a,b,* 0.13 ± 0.03* 0.09 ± 0.02a,b 0.15 ± 0.03* 0.12 ± 0.02a 0.18 ± 0.04 0.10 ± 0.04a 0.24 ± 0.08 Note. C8:0, caprylic acid; C16:0, palmitic acid; EPA, eicosapentaenoic acid; HFD, high-fat diet; LPS, lipopolysaccharide; ABCA1, ATP-binding cassette transporter A1; JAK2, Janus kinase 2; STAT3, signal transducer and activator of transcription 3; TNF-α, tumor necrosis factor α; NF-κB, nuclear factor kappa B; *P < 0.05, versus +LPS (comparison in the same group ±LPS); aP < 0.05, versus HFD group; bP < 0.05, versus C16:0 group;
cP < 0.05, versus EPA group.Table 4. Effects of different fatty acids on the mRNA expression of ABCA1/JAK2/STAT3 pathway-related molecules in the aorta in C57BL/6j mice (
$\bar x$ ± s, n = 7)After intraperitoneal injection with LPS, the expression levels of ABCA1 and JAK2/STAT3 were significantly higher in the C8:0 group than the HFD, C16:0 and EPA groups, the mRNA levels of NF-κB, TNF-α were lower than those in the HFD group (P < 0.05), and the mRNA levels of TNF-α were also lower than those in the C16:0 group (P < 0.05). Meanwhile, compared with that in the C16:0 group, the expression of ABCA1 mRNA in the EPA group was significantly higher, and the expression of TNF-α mRNA was inhibited. Moreover, compared with that in the HFD group, the expression of NF-κB and TNF-α mRNA in the EPA group was inhibited (P < 0.05) (Table 4). Our data revealed that C8:0 up-regulated ABCA1 and resulted in downstream inhibition of the mRNA levels of NF-κB and TNF-α.
-
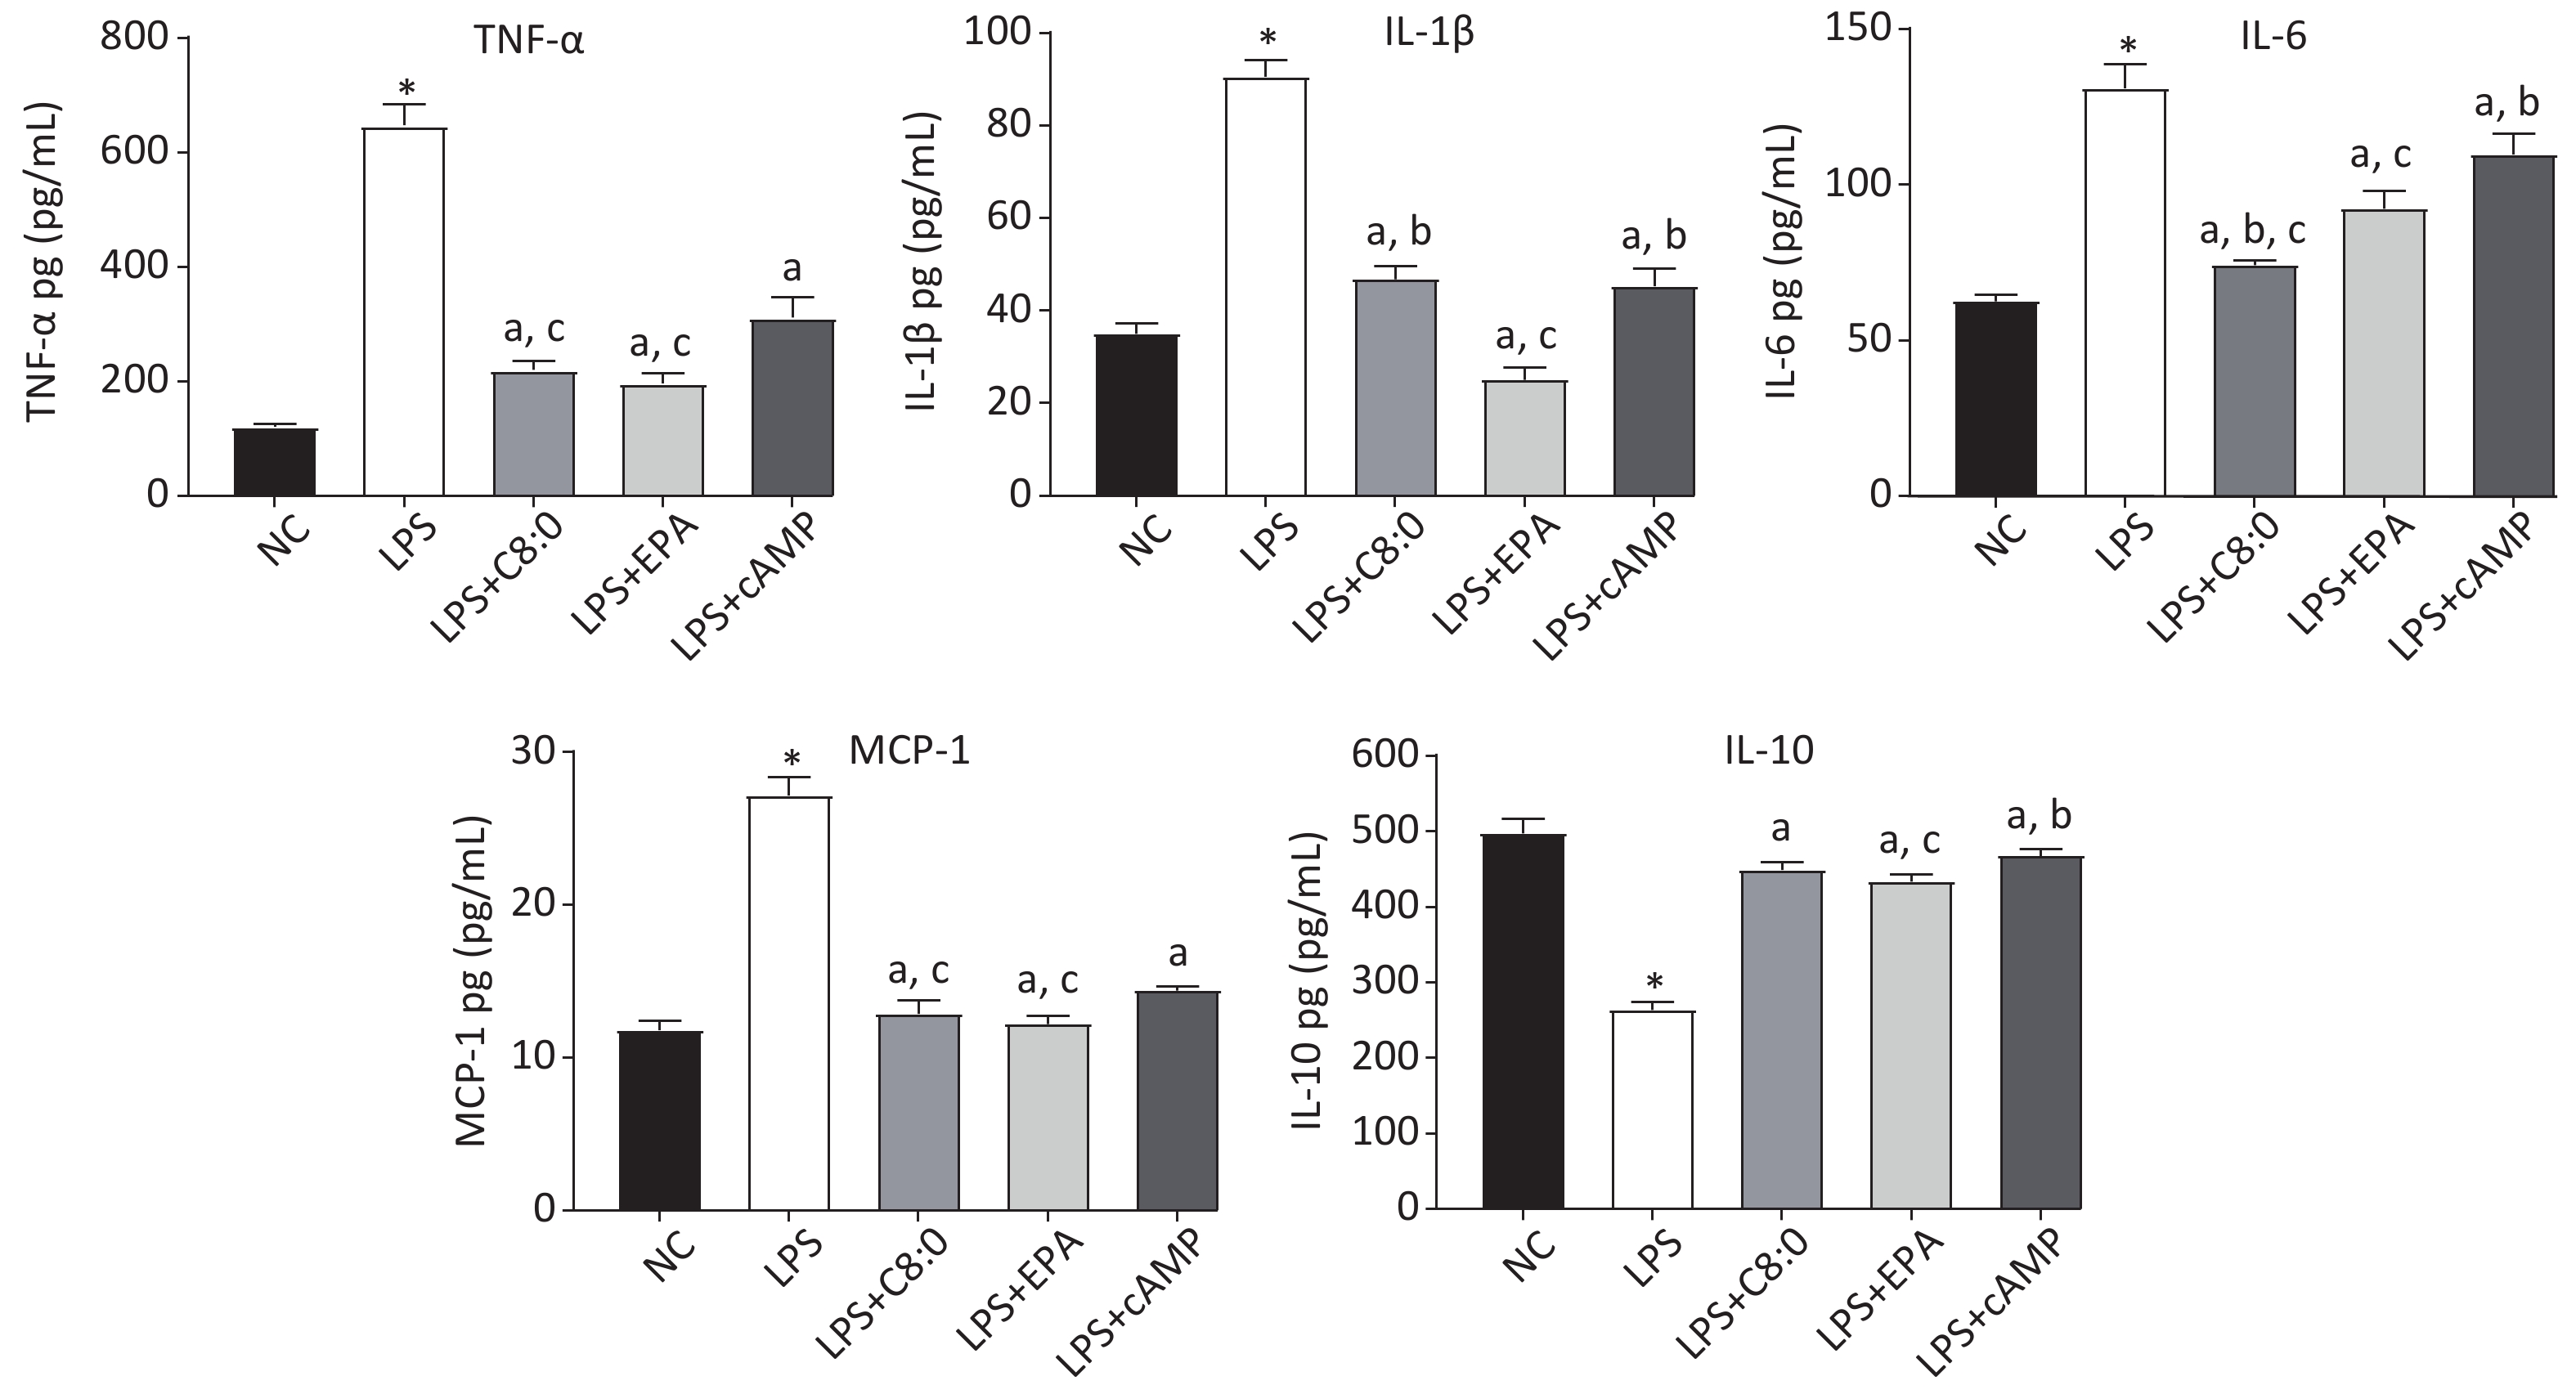
After LPS treatment, the levels of cytokines in RAW264.7 cells significantly increased, and consequently the levels of TNF-α, MCP-1, IL-6 and IL-1β were significantly higher than those in the normal group, whereas those of IL-10 were significantly lower (P < 0.05). The levels of TNF-α, MCP-1, IL-6 and IL-1β in the LPS+C8:0 group, LPS+EPA group and LPS+cAMP group were significantly lower than those in the LPS group, but the levels of IL-10 were higher (P < 0.05). The levels of TNF-α, IL-6 and MCP-1 were significantly lower in the LPS+C8:0 group and LPS+EPA group than the LPS+cAMP group (P < 0.05) (Figure 3). Compared with those in the LPS+EPA group, the levels of IL-1β were higher, and the levels of IL-6 were lower, in the LPS+C8:0 group. Our findings indicated that C8:0 inhibited the expression of inflammatory factors in RAW264.7 cells stimulated by LPS.
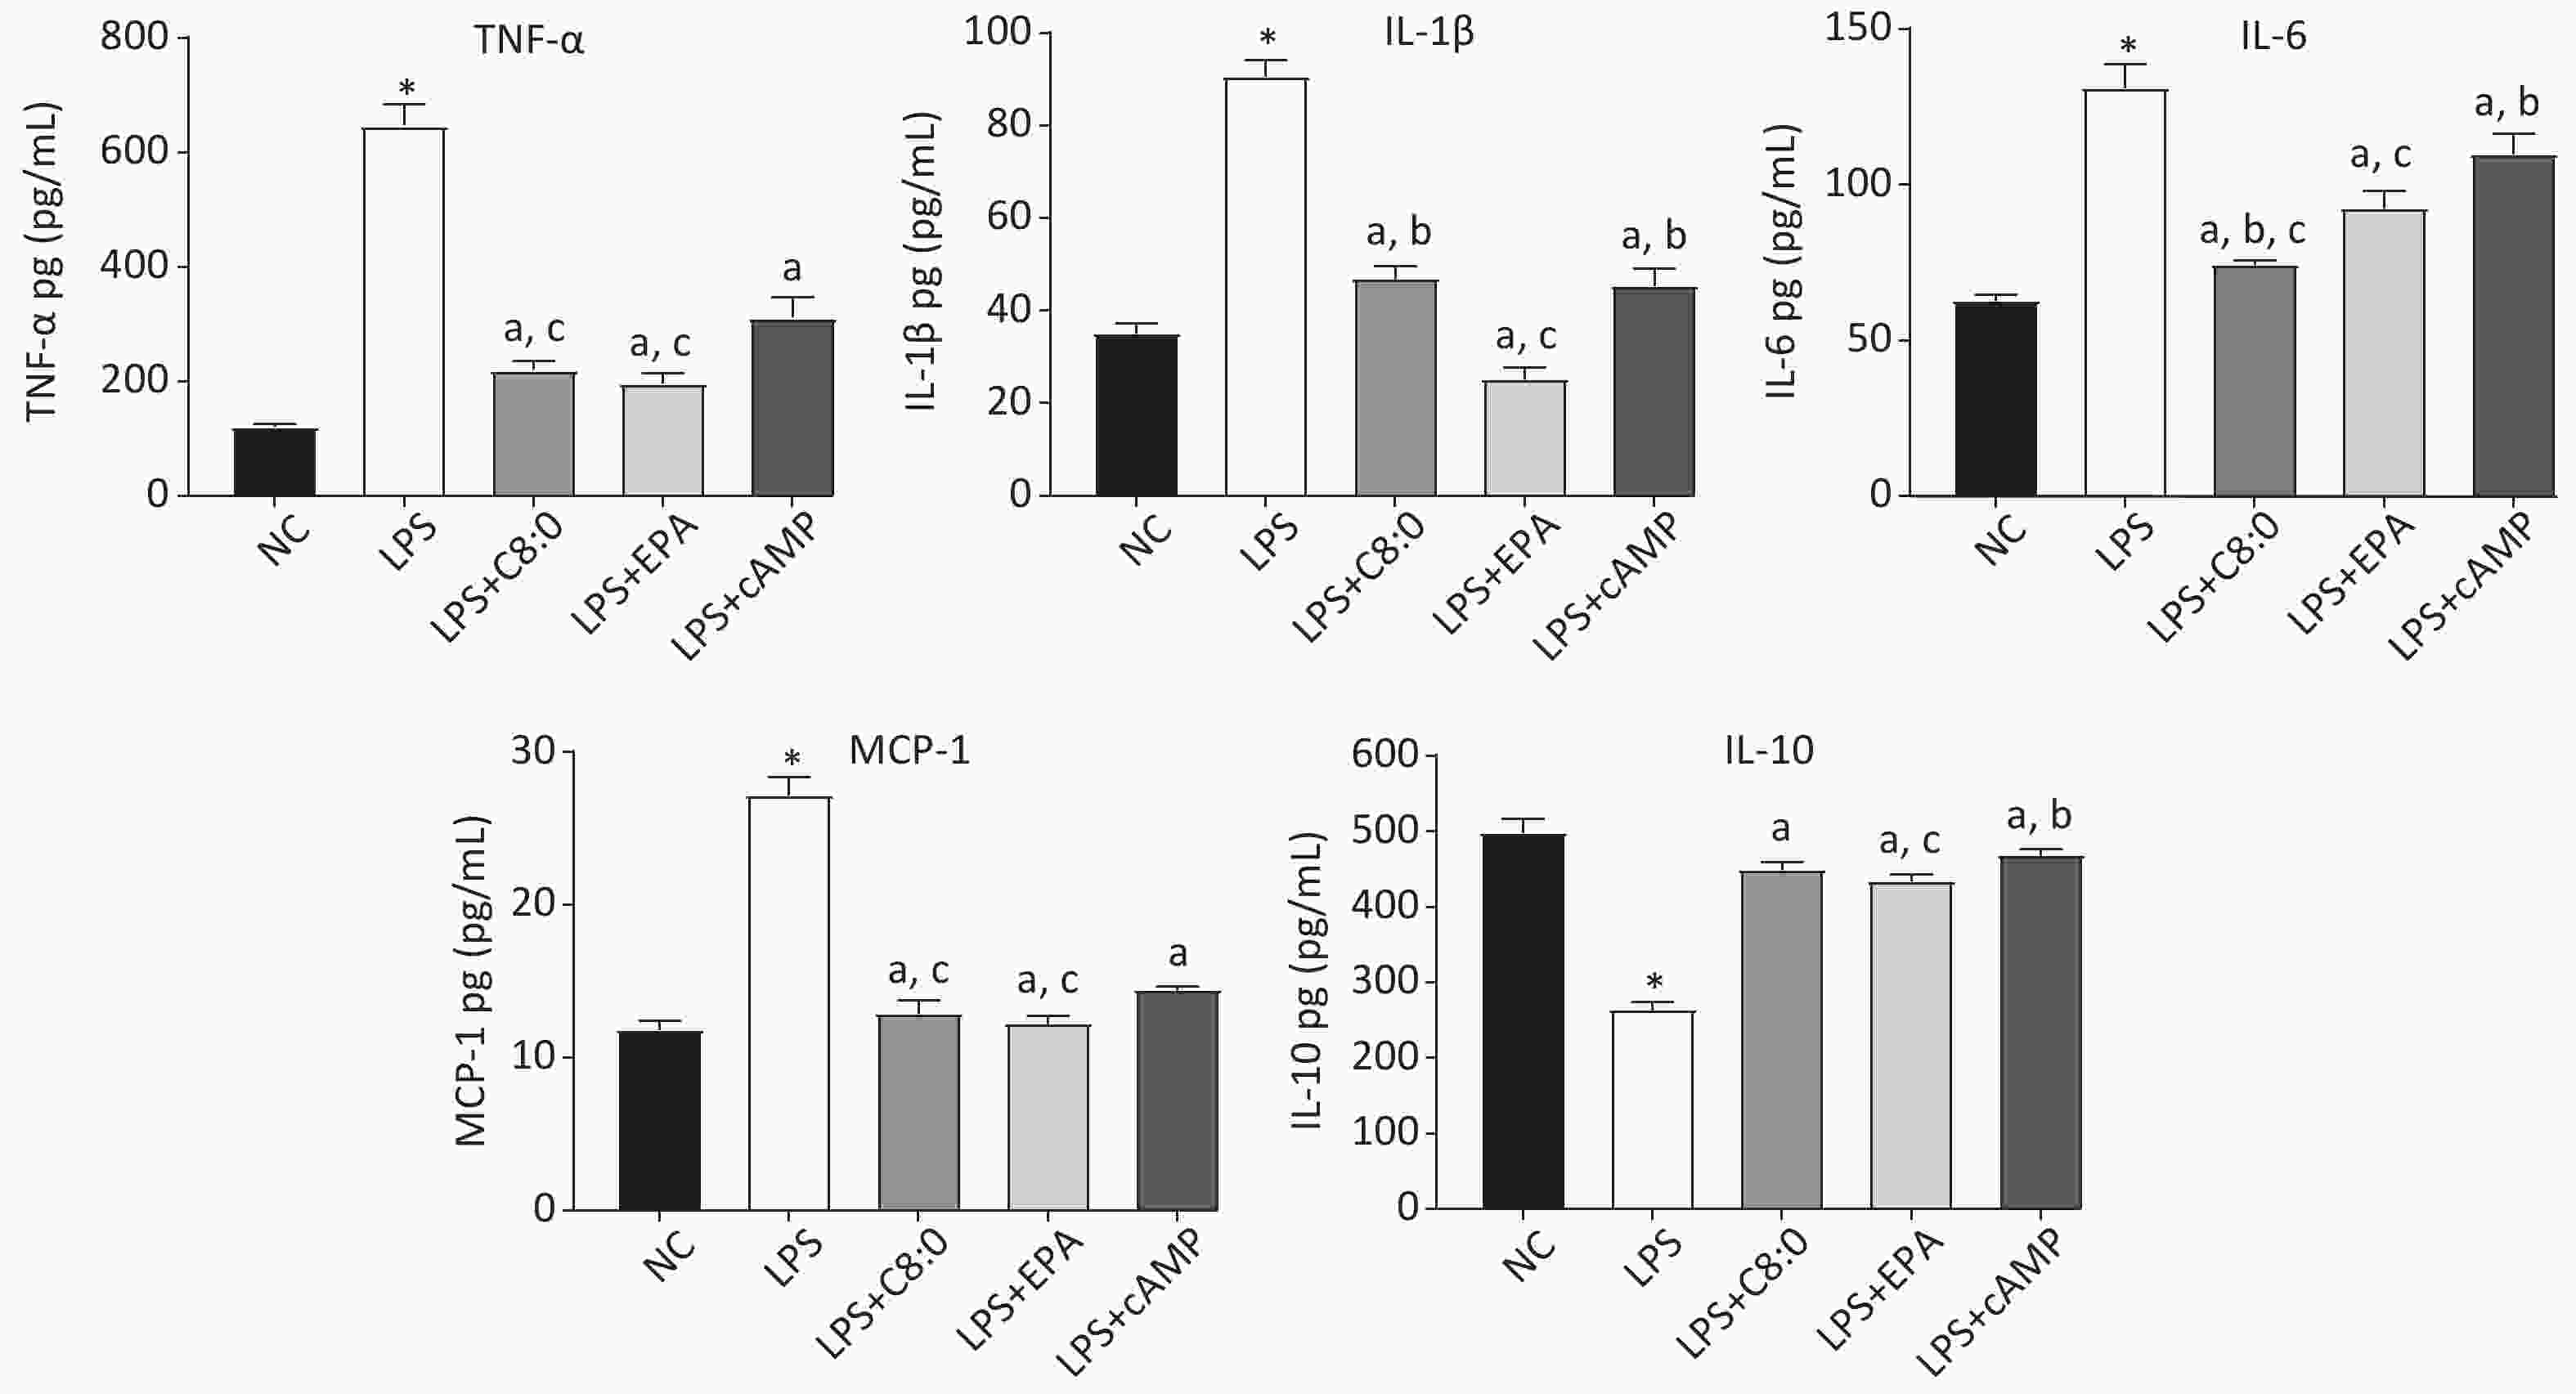
Figure 3. Effects of C8:0 and EPA on inflammatory factors of RAW264.7 cells stimulated by LPS. TNF-α, tumor necrosis factor α; IL-1β, interleukin-1β; IL-6, interleukin-6; IL-10, interleukin-10; MCP-1, monocyte chemoattractant protein-1; NC, normal contrast; LPS, lipopolysaccharide; C8:0; caprylic acid; EPA, eicosapentaenoic acid; cAMP, cyclic adenosine monophosphate. Data in the figure are expressed as the mean ± SD with 6 samples in each group (n = 6). *P < 0.05, versus NC group; aP < 0.05, versus LPS group; bP < 0.05, versus LPS+EPA group; cP < 0.05, versus LPS+cAMP group
-
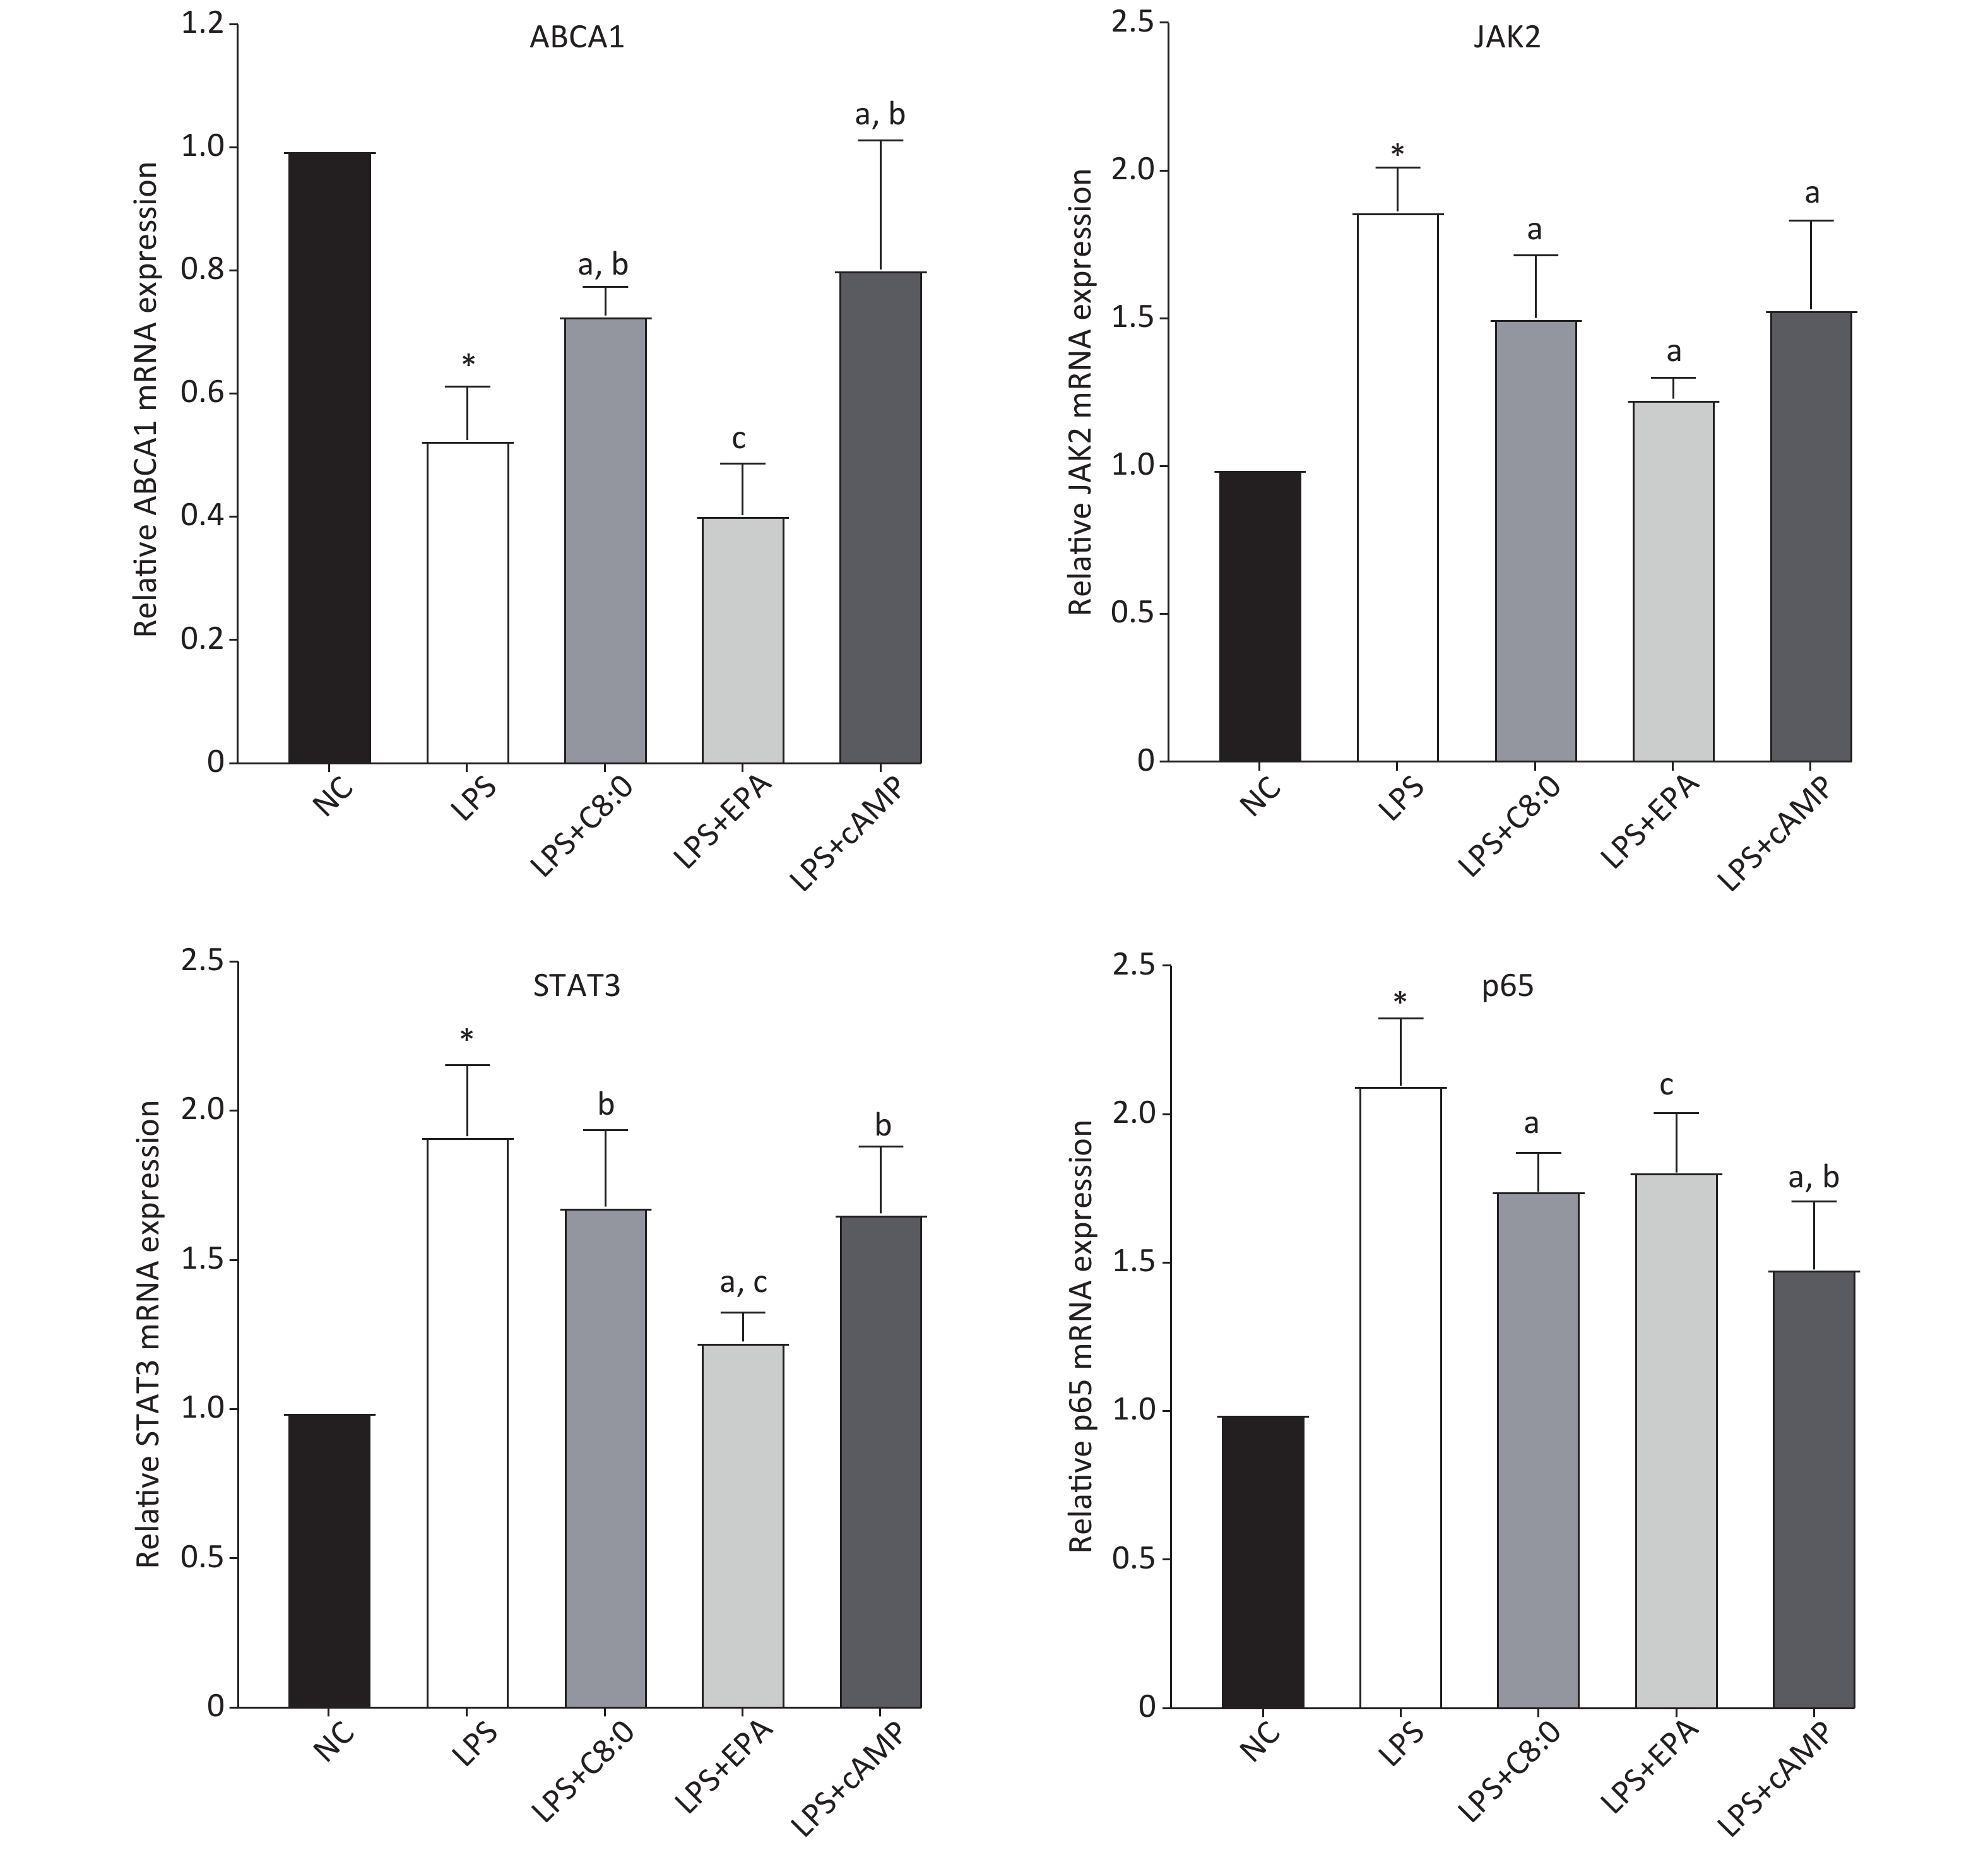
Compared with that in the normal group, the expression level of ABCA1 mRNA in RAW264.7 cells treated with LPS was clearly lower, and the expression of JAK2, STAT3 and p65 mRNA was higher (P < 0.05). Moreover, the expression of ABCA1 mRNA in the LPS+C8:0 group was clearly higher than that in the LPS and LPS+EPA group and the expression of JAK2 and p65 mRNA was significantly lower than that in the LPS group (P < 0.05). Furthermore, the mRNA expression level of STAT3 in the LPS+C8:0 group was significantly higher than that in the LPS+EPA group (P < 0.05). However, the mRNA expression of ABCA1, JAK2, STAT3 and p65 in the LPS+C8:0 group was no different from that in the LPS+cAMP group (P > 0.05). Compared with that in the LPS+cAMP group, the mRNA expression of ABCA1 and STAT3 was lower, and the expression of p65 was higher, in the LPS+EPA group (Figure 4). Thus, C8:0 up-regulated the ABCA1 and STAT3 pathway in RAW264.7 cells stimulated by LPS and decreased the mRNA expression of p65.
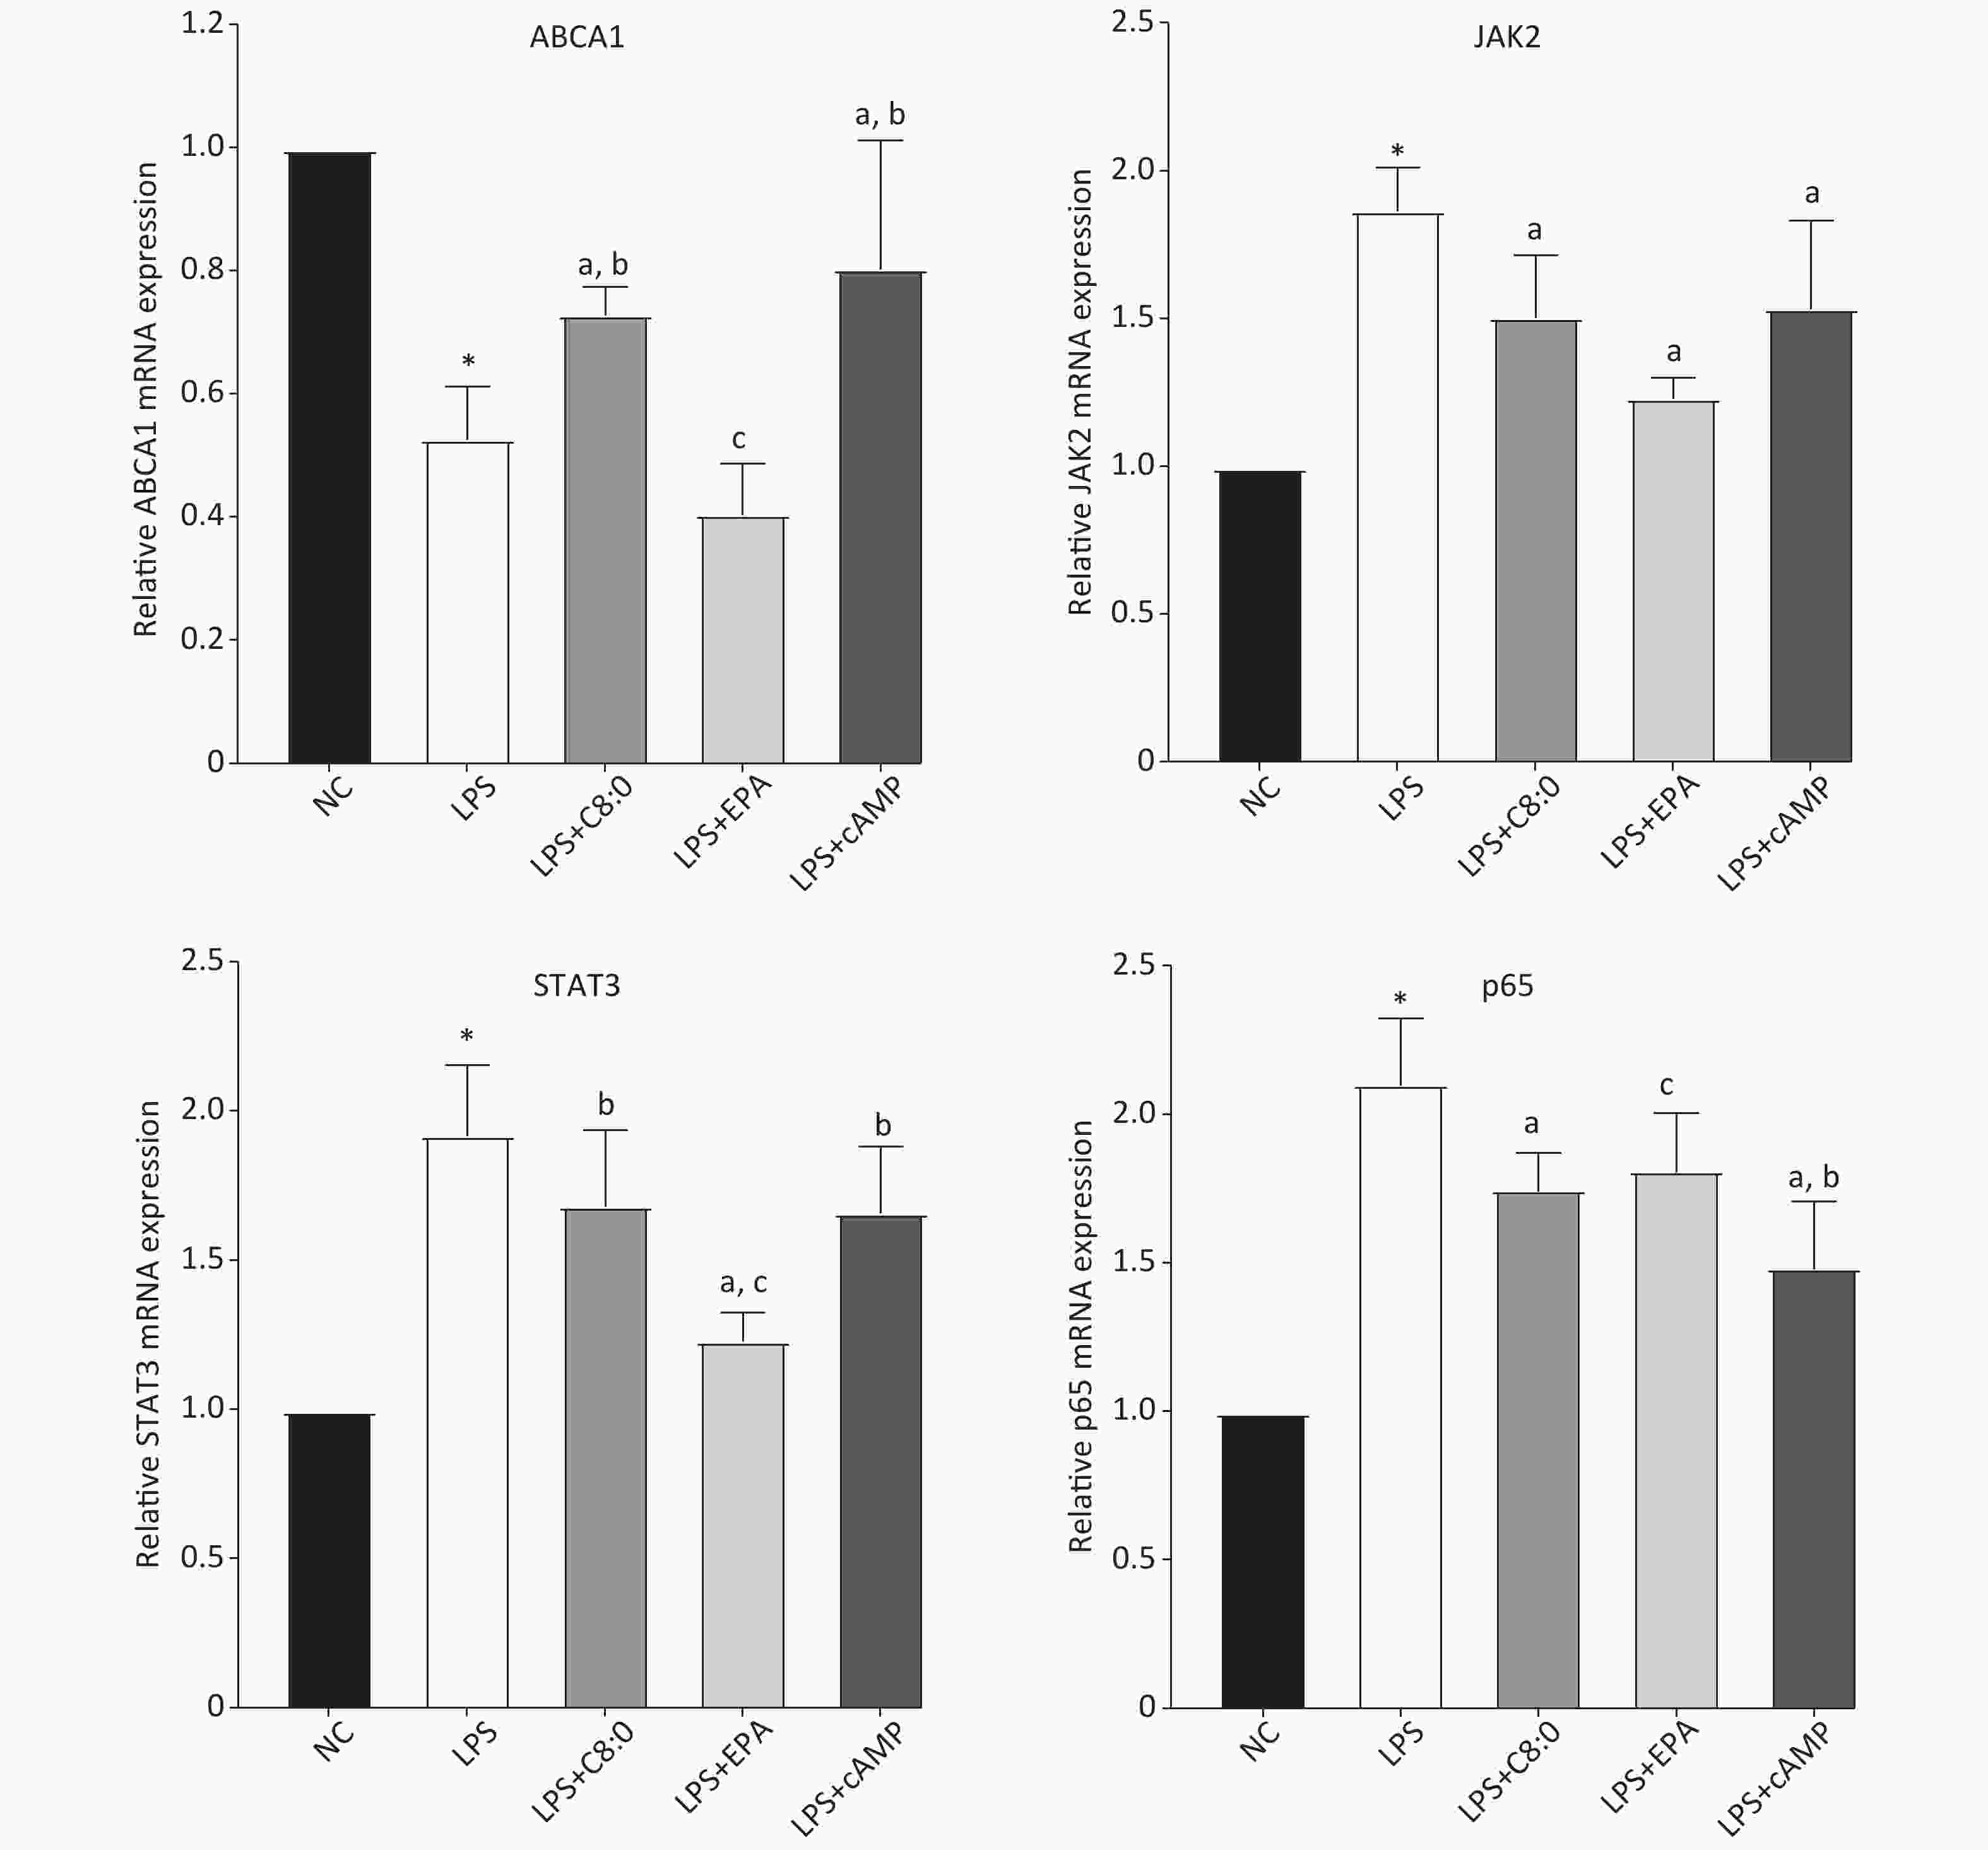
Figure 4. Effects of C8:0 and EPA on JAK2/STAT3 mRNA expression in RAW264.7 cells stimulated by LPS. NC, normal contrast; LPS, lipopolysaccharide; C8:0, caprylic acid; EPA, eicosapentaenoic acid; cAMP, cyclic adenosine monophosphate; ABCA1, ATP-binding cassette transporter A1; JAK2, Janus Kinase 2; STAT3, signal transducer and activator of transcription 3; p65, pNF-κBP65. Data in the figure are expressed as the mean ± SD with 6 samples in each group (n = 6). *P < 0.05, versus NC group; aP < 0.05, versus LPS group; bP < 0.05, versus LPS+EPA group; cP < 0.05, versus LPS+cAMP group
-
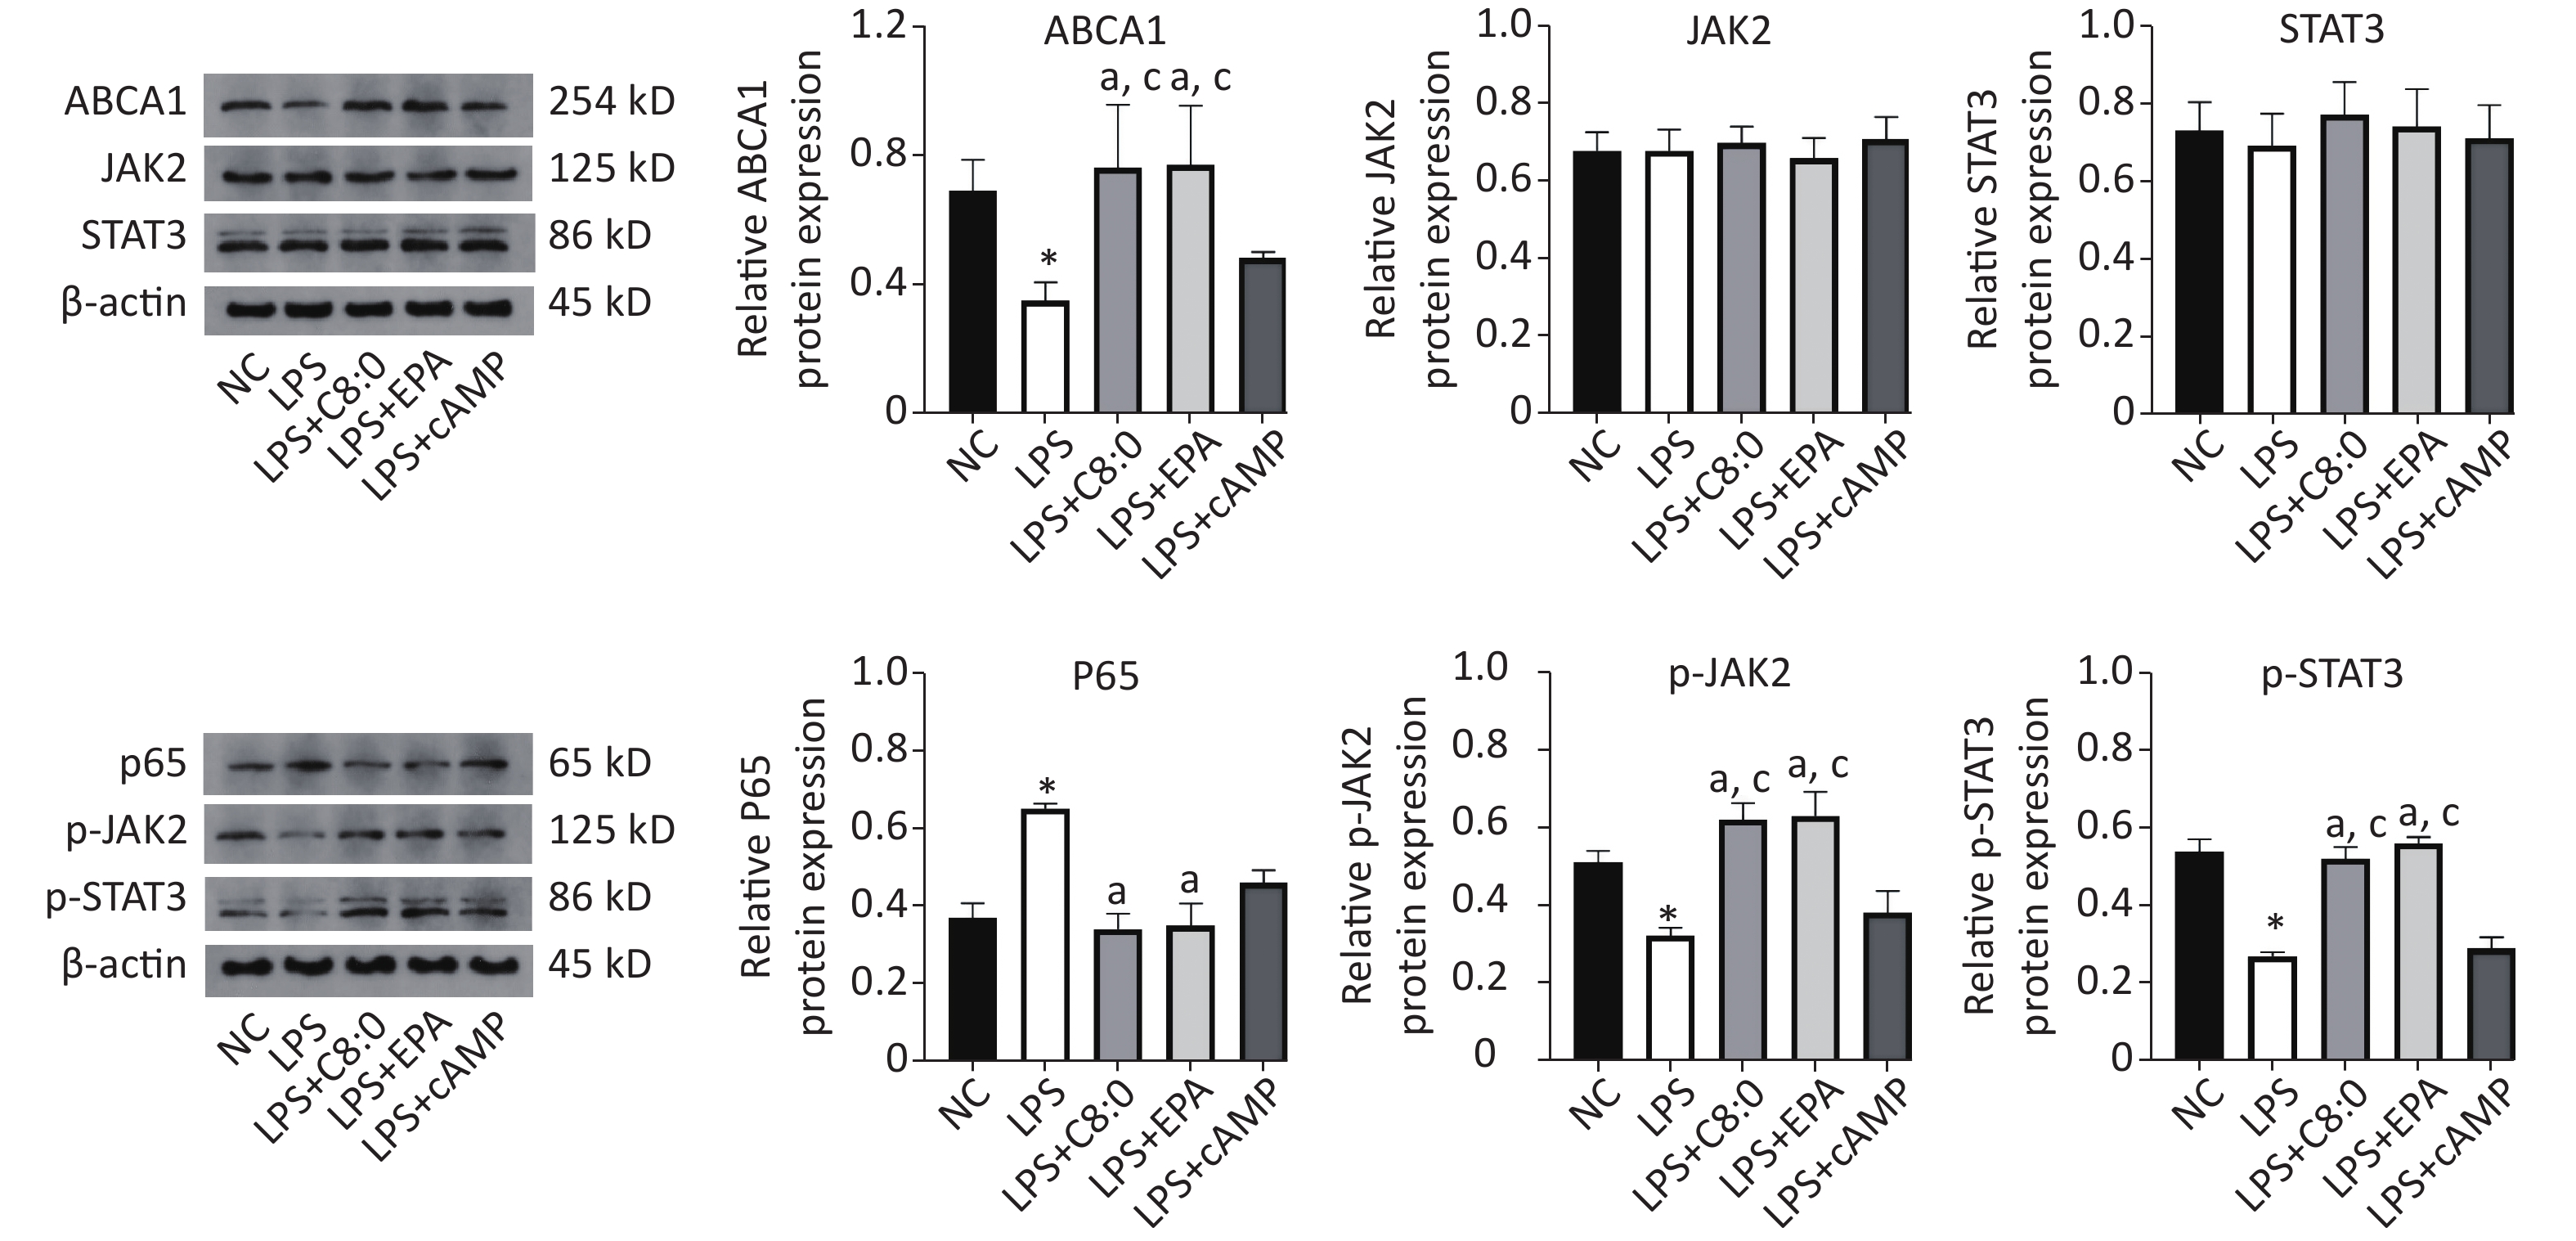
Compared with that in the normal group, the expression of ABCA1, p-JAK2 and p-STAT3 protein was significantly lower after LPS treatment, whereas the expression of p65 protein was significantly higher (P < 0.05). Meanwhile, in the LPS+C8:0 group and LPS+EPA group, compared with the LPS group and LPS+cAMP group, the protein expression levels of ABCA1, p-JAK2 and p-STAT3 were significantly higher (P < 0.05). Compared with that in the LPS group, p65 protein expression was significantly lower in the LPS+C8:0 group and LPS+EPA group (P < 0.05). Therefore, C8:0 up-regulated ABCA1 and the p-JAK2/p-STAT3 pathway in RAW264.7 cells stimulated by LPS and decreased the expression of p65 inflammatory factor protein (Figure 5).
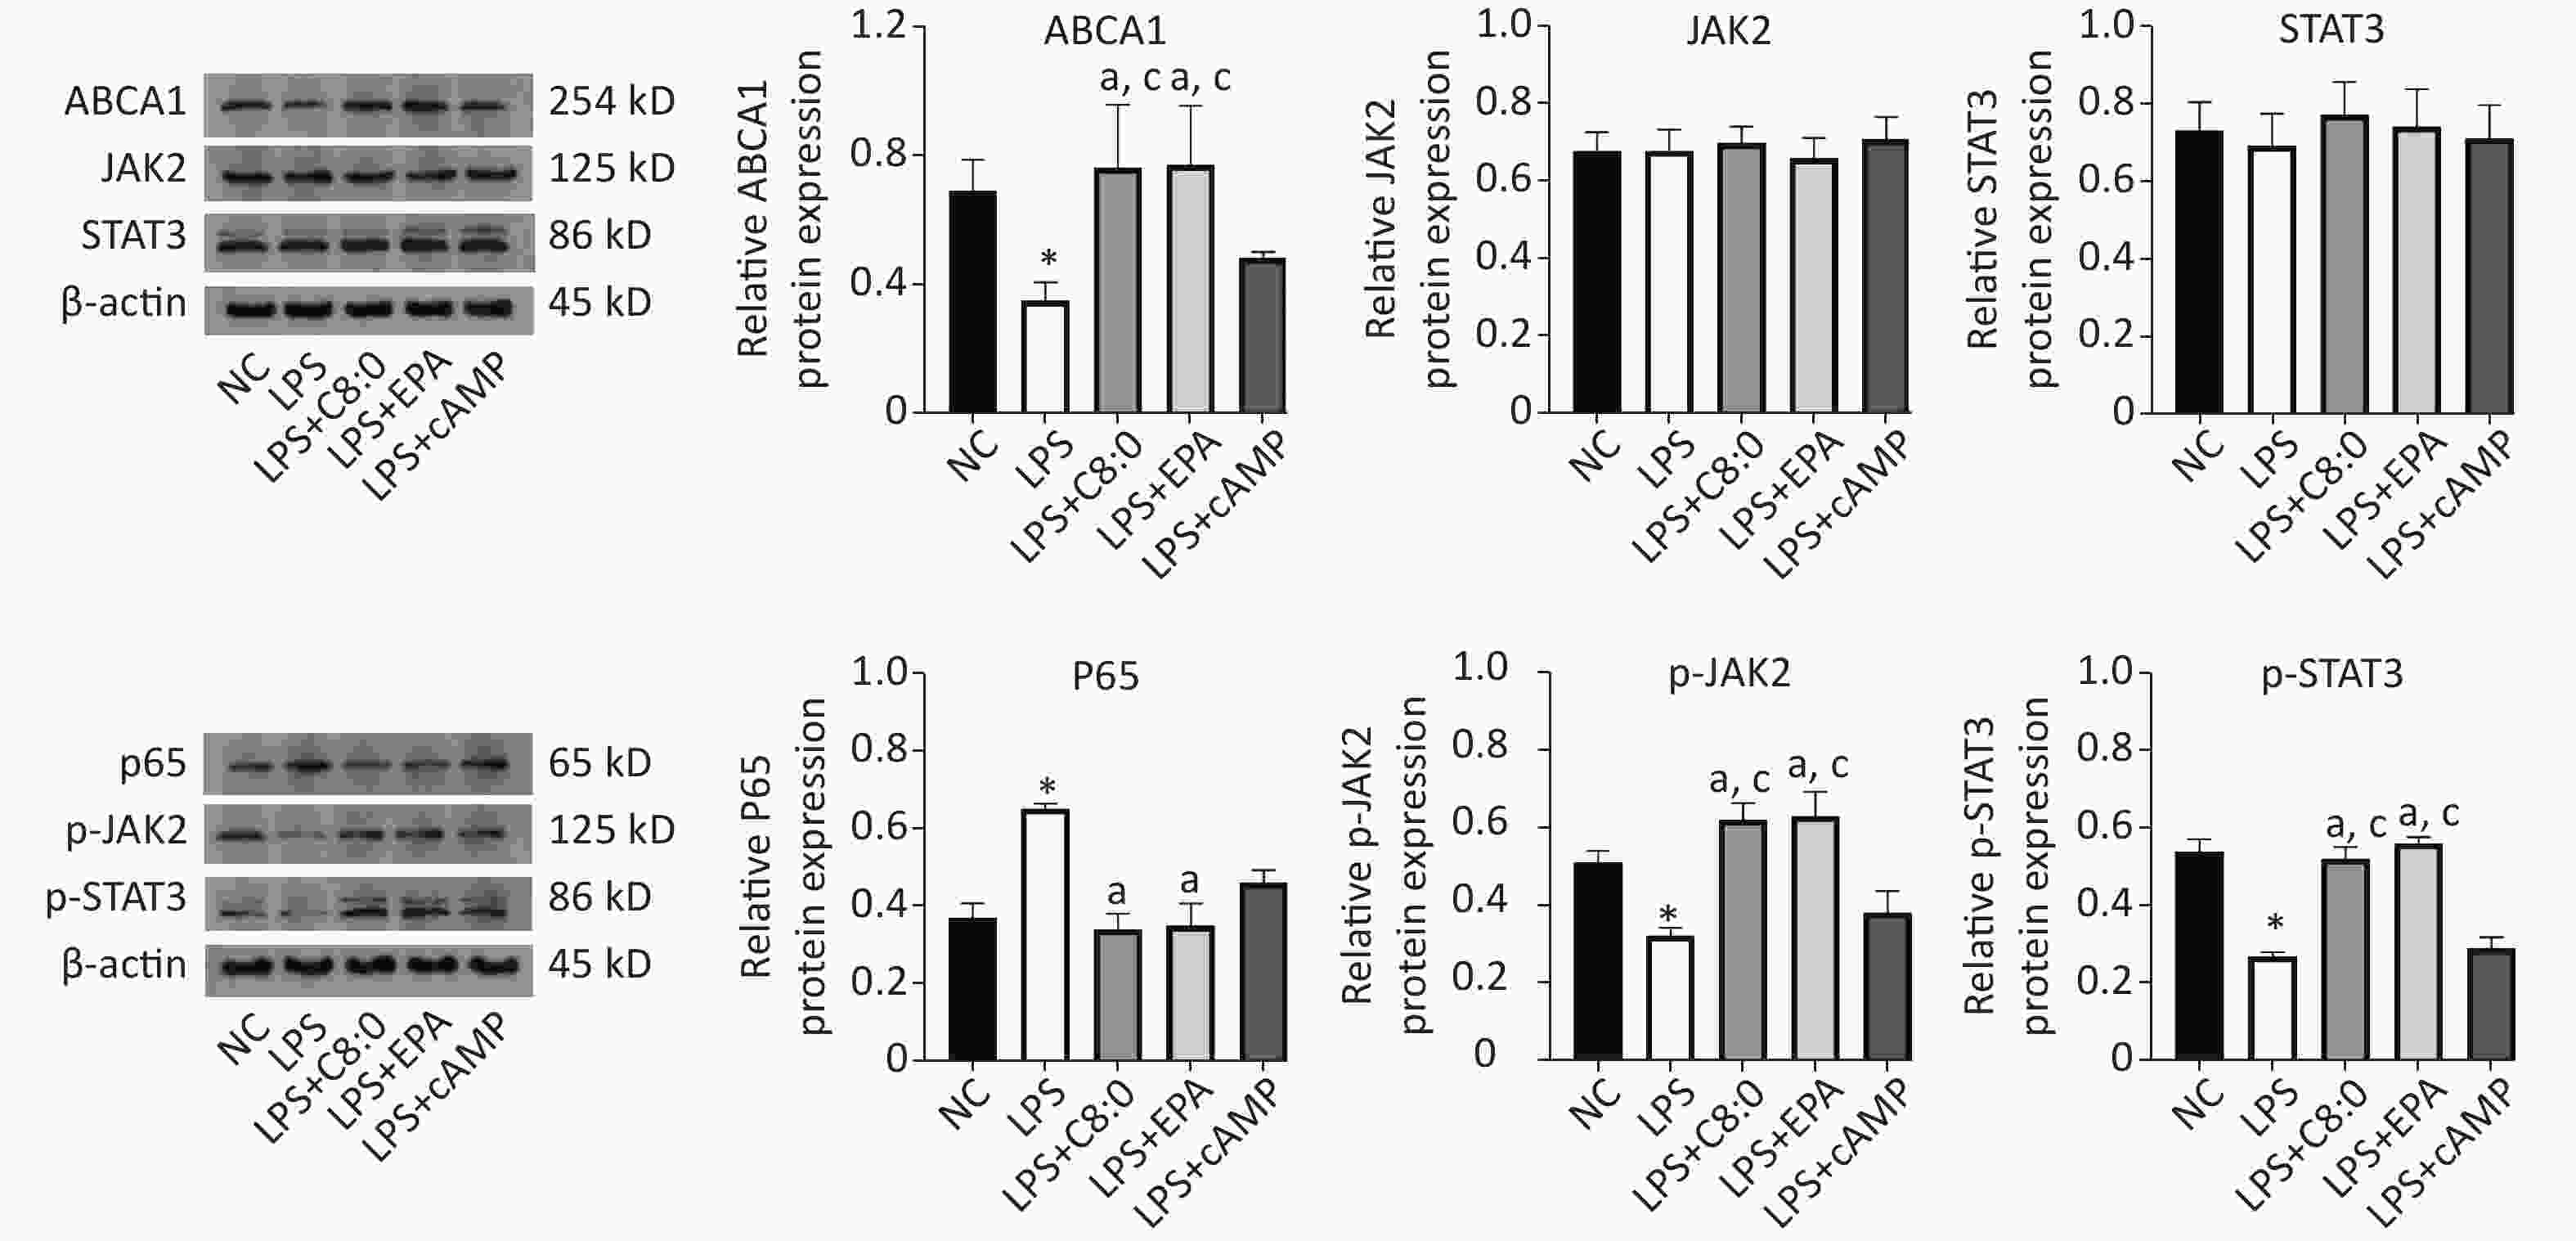
Figure 5. Effects of C8:0 and EPA on JAK2/STAT3 protein expression in RAW264.7 cells stimulated by LPS. NC, normal contrast; LPS, lipopolysaccharide; C8:0, caprylic acid; EPA, eicosapentaenoic acid; cAMP, cyclic adenosine monophosphate; ABCA1, ATP-binding cassette transporter A1; JAK2, Janus Kinase 2; STAT3, signal transducer and activator of transcription 3; p65, pNF-κBP65. Data in the figure are expressed as the mean ± SD with 4 samples in each group (n = 4). *P < 0.05, versus NC group; aP < 0.05, versus LPS group; bP < 0.05, versus LPS+EPA group; cP < 0.05, versus LPS+cAMP group
-
In our study, no significant differences in food intake were observed among all groups of mice within 12 weeks. Starting from the 4th week of intervention, the fasting body weight in C57BL/6J mice in the C8:0 group and EPA group was significantly lower than that in the HFD group and the C16:0 group, in agreement with the results of our previous studies[9,14]. The finding that EPA decreased the body weight in mice was also supported by previously published findings[15]. In this study, the weight loss in the C8:0 group was less than that in the EPA group, thus suggesting that EPA might be better than C8:0 in promoting weight loss. According to the general consensus, fatty acid intake contributes to weight gain, and excess weight is an independent risk factor for cardiovascular disease, as well as diabetes, cancer and other diseases. C8:0 decreases weight and inflammation and thus may be a future direction in fatty acid research.
C8:0 and EPA both decreased the TC and LDL-C levels, and increased the HDL-C/LDL-C ratio in lipid metabolism after LPS treatment, whereas EPA decreased the TC and LDL-C levels, and increased the HDL-C/LDL-C ratio to a greater extent than C8:0. EPA has been found to improve blood lipid levels by increasing fatty acid oxidation, decreasing LDL-C production[16], decreasing LDL synthesis and promoting reverse cholesterol transport[17]. In previous experiments[14,18], we found that dietary MCT decreases the concentrations of TG, TC and LDL-C, and increases the level of HDL-C and the ratio of HDL-C/LDL-C, through a mechanism of action potentially associated with up-regulation of the beta 3 adrenergic receptor, adipose triglyceride lipase and hormone-sensitive lipase signaling. In this study, C8:0 decreased the level of TC, and after LPS treatment, C8:0 also decreased the TC and LDL-C, and up-regulated the HDL-C/LDL-C ratio. However, no significant differences were observed in improvements in the blood lipid level of TG and HDL-C. These findings suggests that C8:0 may favorably regulate cholesterol metabolism, whereas C10:0 might have a better effect on TG metabolism. However, further studies are needed to explore the differences in blood lipid levels. The mechanisms through which C8:0 improves blood lipid levels, include increasing apoA1 expression and HDL apolipoprotein synthesis[19], promoting cholesterol conversion into bile acids for excretion, inhibiting intestinal absorption and decreasing serum cholesterol[20]. C8:0 and EPA are better than long-chain saturated fatty acids in improving blood lipid levels, but further studies are needed to explore the differences in the decrease in LDL-C.
In terms of serum inflammatory factors, C8:0 significantly decreased the levels of TNF-α and MCP-1, and increased IL-10 in LPS-stimulated mice, and EPA also significantly decreased TNF-α and MCP-1 levels, thus suggesting that C8:0 and EPA improve inflammation levels. Although different fatty acids have different effects on inflammation, the prevailing view is that most SFAs do not decrease and can even stimulate some inflammation, whereas some unsaturated fatty acids decrease inflammation. For example, the levels of TNF-α and IL-6 in mouse serum have been found to decrease with EPA intake[21], and MCP-1 and TNF-α have been found to decrease with the addition of EPA after coronary artery surgery[22]. An MCT-rich formula appears to exert stronger anti-inflammatory effects than a long-chain triglyceride-rich formula in trinitrobenzene sulphonic acid colitis, and an MCT-rich diet has been found to decrease IL-6, IL-8 and intercellular adhesion molecule-1 levels[23]. However, which MCFAs have anti-inflammatory effects remains unclear. C8:0 triglycerides significantly attenuate the increased expression of pro-inflammatory cytokines or chemokines, such as TNF-α, IL-18, macrophage inflammatory protein-2 and MCP-1 in the ileum[24]. In this experiment, we demonstrated that C8:0 decreased serum TNF-α, MCP-1, and increased IL-10, in line with previous findings[14].
ABCA1 mediates the rate-limiting step in HDL biogenesis by interacting with apoA-I and suppressing inflammation in macrophages[25]. Our previous study has shown that MCT up-regulates the gene and protein expression of ABCA1 in apoE-/- mouse liver[14] and promotes cholesterol efflux from macrophages[9]. The activators of LXR, PPARγ and cAMP have been used to increase the activity of ABCA1[25]. Furthermore, the hepatic overexpression of ABCA1, through infusion of adenovirus for expression of ABCA1 into mice, induces apoAI-dependent cholesterol efflux from primary hepatocytes and also increases plasma HDL and apoAI levels[26,27]. Therefore, further studies are needed to determine the molecular factors involved in C8:0’s regulation of ABCA1 expression and HDL function.
ABCA1/JAK2/STAT3 is a classic inflammatory response pathway that inhibits inflammation and decreases the formation and development of AS. The JAK2/STAT3 pathway is an important signaling pathway through which ABCA1 inhibits inflammation[28]. In this experiment, we revealed that C8:0 up-regulated the mRNA levels of ABCA1, JAK2 and STAT3, and down-regulates NF-κB and TNF-α in the aorta in C57BL/6J mice after LPS treatment. We then treated RAW264.7 cells with 200 µmol/L C8:0 for 24 hours and found that C8:0 up-regulated the ABCA1/p-JAK2/p-STAT3 pathway, and decreased the mRNA and protein expression of p65 inflammatory factors after LPS treatment.
Recent studies have indicated that the major signaling pathways through which ABCA1 inhibits inflammation are JAK2/STAT3, Rho GTPase CDC42 and cAMP/PKA[10]. The JAK2/STAT3 signaling pathway is involved in the transport of excess cholesterol and has anti-inflammatory effects. In the anti-inflammatory pathway, ABCA1 activates JAK2 phosphorylation, thus forming p-JAK2, then further activates STAT3 phosphorylation, thereby decreasing the expression of inflammatory factors such as TNF-α, IL-6, MCP-1 and p65. An increase in these factors results in interactions with macrophages and eventually leads to AS[12]. When ABCA1 is lacking in mouse macrophages, the inflammatory response to LPS increases[29]. Studies have reported that ABCA1 directly inhibits the inflammatory factors produced by LPS stimulated macrophages through the phosphorylation of the STAT3 pathway, in a manner independent of the cholesterol efflux pathway[12]. However, LPS stimulation leads to an increase in p-JAK2 and p-STAT3, as reported in the literature[30]. The downstream inflammatory factor p65 is also highly expressed, and the mechanism of its increased phosphorylation must be further explored. The above findings together illustrate the importance of ABCA1 in improving inflammation.
EPA was selected as a parallel control in the experiment to examine the effect of EPA in improving inflammation in animal experiments. In human and animal experiments, EPA decreases AS through anti-inflammatory actions[31], diminishes the levels of the macrophage inflammatory factors TNF-α and IL-6 induced by LPS[32], and inhibits vascular cell adhesion in human vascular endothelial cells. Attachment molecule 1[33] decreases the activation of IL-6 in macrophages through the nucleotide binding oligomerization domain (NOD) like receptor family 3 inflammasome pathway[34]. We selected cAMP as a positive control, because it increases the expression of ABCA1 in macrophages and inhibits the downstream inflammatory factors of the JAK2/STAT3 pathway[11]. However, in this study, cAMP increased ABCA1 and JAK2/STAT3 mRNA expression in RAW264.7 cells stimulated by LPS, but the protein expression of ABCA1 and JAK2/STAT3 did not significantly increase, thus suggesting that cAMP may be involved in the inhibition of inflammatory response through other pathways. Palmitic acid was not selected as a control in RAW264.7 cells experiments, because no clear difference has been found between palmitic acid administration and a high-fat diet in animal experiments. LPS has an inflammatory stimulating effect similar to that of SFAs[6], and because LPS was used in the intervention in the experiment, so SFAs was not selected as a control.
In terms of inflammatory factors, C8:0 and EPA decreased TNF-α, MCP-1, IL-6 and IL-1β, and increased IL-10. Both C8:0 and EPA decreased the inflammatory process, but their effects were different, thus indicating that dietary fatty acids have different effects on inflammation. In addition, different metabolic pathways are involved: C8:0 is directly transported to the liver via the hepatic portal circulation and is rapidly oxidized to ketones[35], whereas EPA is transported in the body in the form of phospholipids or triglycerides. This difference may be one reason why these fatty acids affect inflammation differently. Because no direct study has compared C8:0’s and EPA’s anti-inflammatory effects, the specific reasons for the differences must be further explored.
However, this study has some limitations. Although C8:0 suppresses inflammation via ABCA1 and the p-JAK2/p-STAT3 signaling pathway, it does not necessarily play a role in humans and in AS. Our previous study has shown that C8:0 inhibits TLR4/NF-κB signaling, thereby suppressing inflammation. This study found that C8:0 suppresses inflammation through ABCA1 and the p-JAK2/p-STAT3 signaling pathway. Multiple mechanisms might be involved in the suppression of inflammation, and the specific protein-coupled receptor to which C8:0 binds, and the mechanism through which C8:0 binds TLR4 or ABCA1 are unknown. Therefore, further studies are warranted.
-
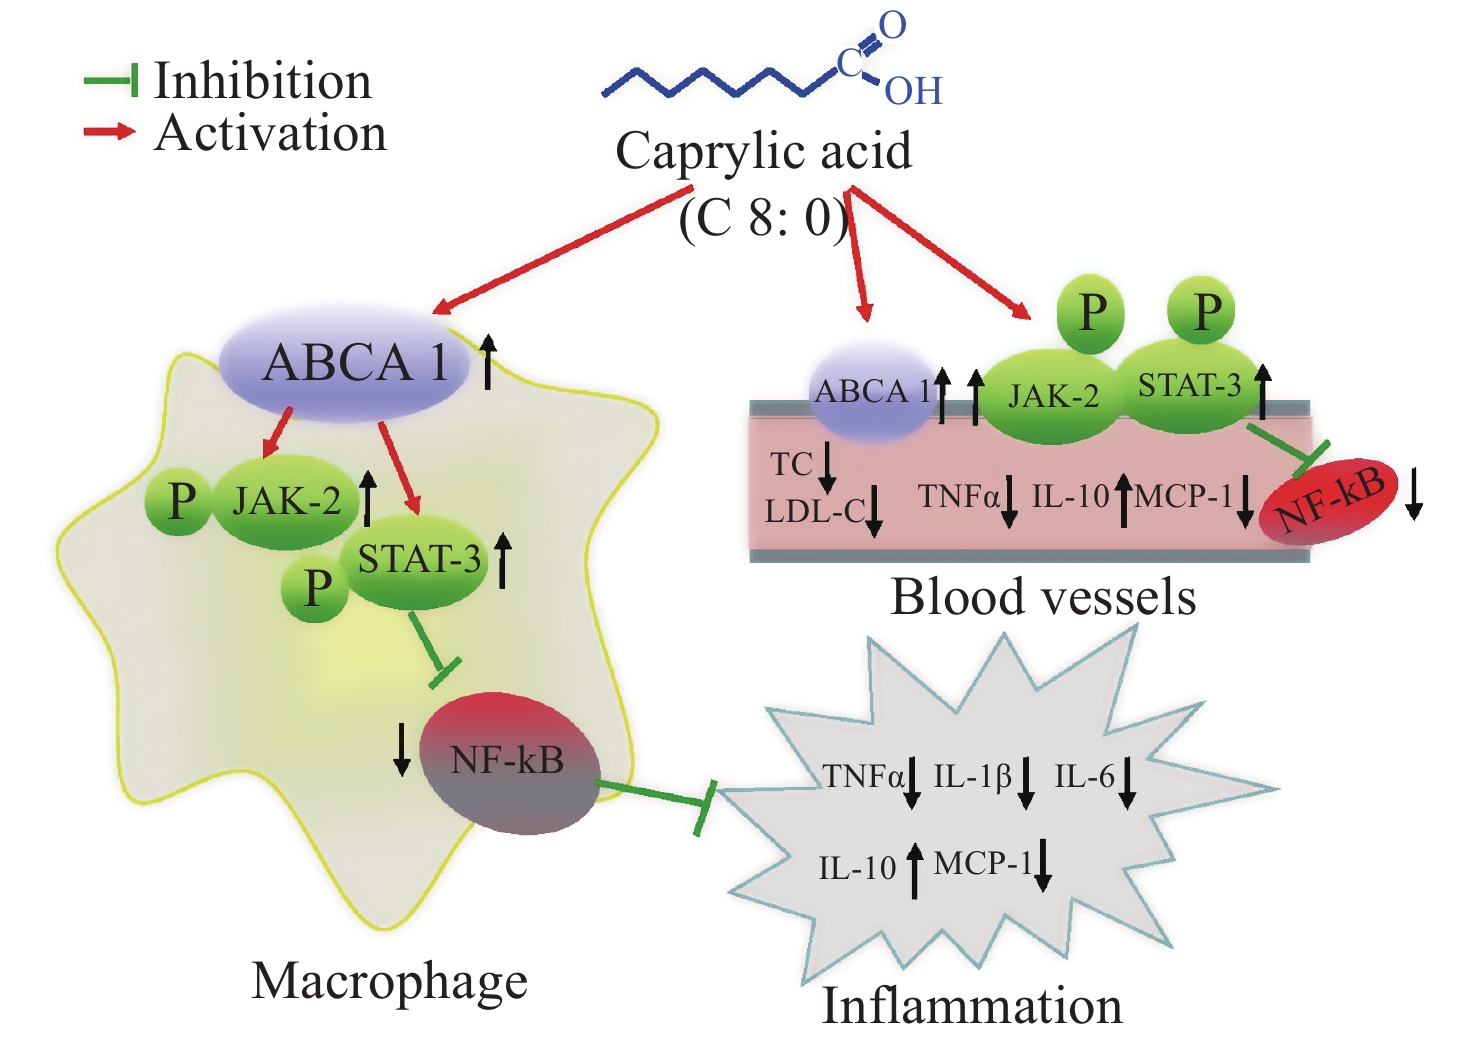
Our data showed that both C8:0 and EPA decreased the levels of TC and LDL-C, and increased the ratio of HDL-C/LDL-C in C57BL/6J mice after LPS treatment. Moreover, EPA decreased the LDL-C levels in our study, and EPA was superior to C8:0 in improving TC and LDL-C levels. C8:0 inhibited the level of serum inflammation in mice after LPS stimulation and up-regulated ABCA1 mRNA in the mouse aorta, thereby inhibiting the related mRNA expression of NF-κB, p65 and TNF-α inflammatory factors. In cell experiments, C8:0 up-regulated the ABCA1 and p-JAK2/p-STAT3 pathways in RAW264.7 cells after LPS stimulation, thereby decreasing the mRNA and protein expression of p65 inflammatory factors, and inhibiting the expression of inflammatory factors in RAW264.7 cells stimulated by LPS. Our studies demonstrated that C8:0 may play an important role in lipid metabolism and the inflammatory response, through a mechanism potentially associated with ABCA1 and the p-JAK2/p-STAT3 signaling pathway Graphical Abstract.
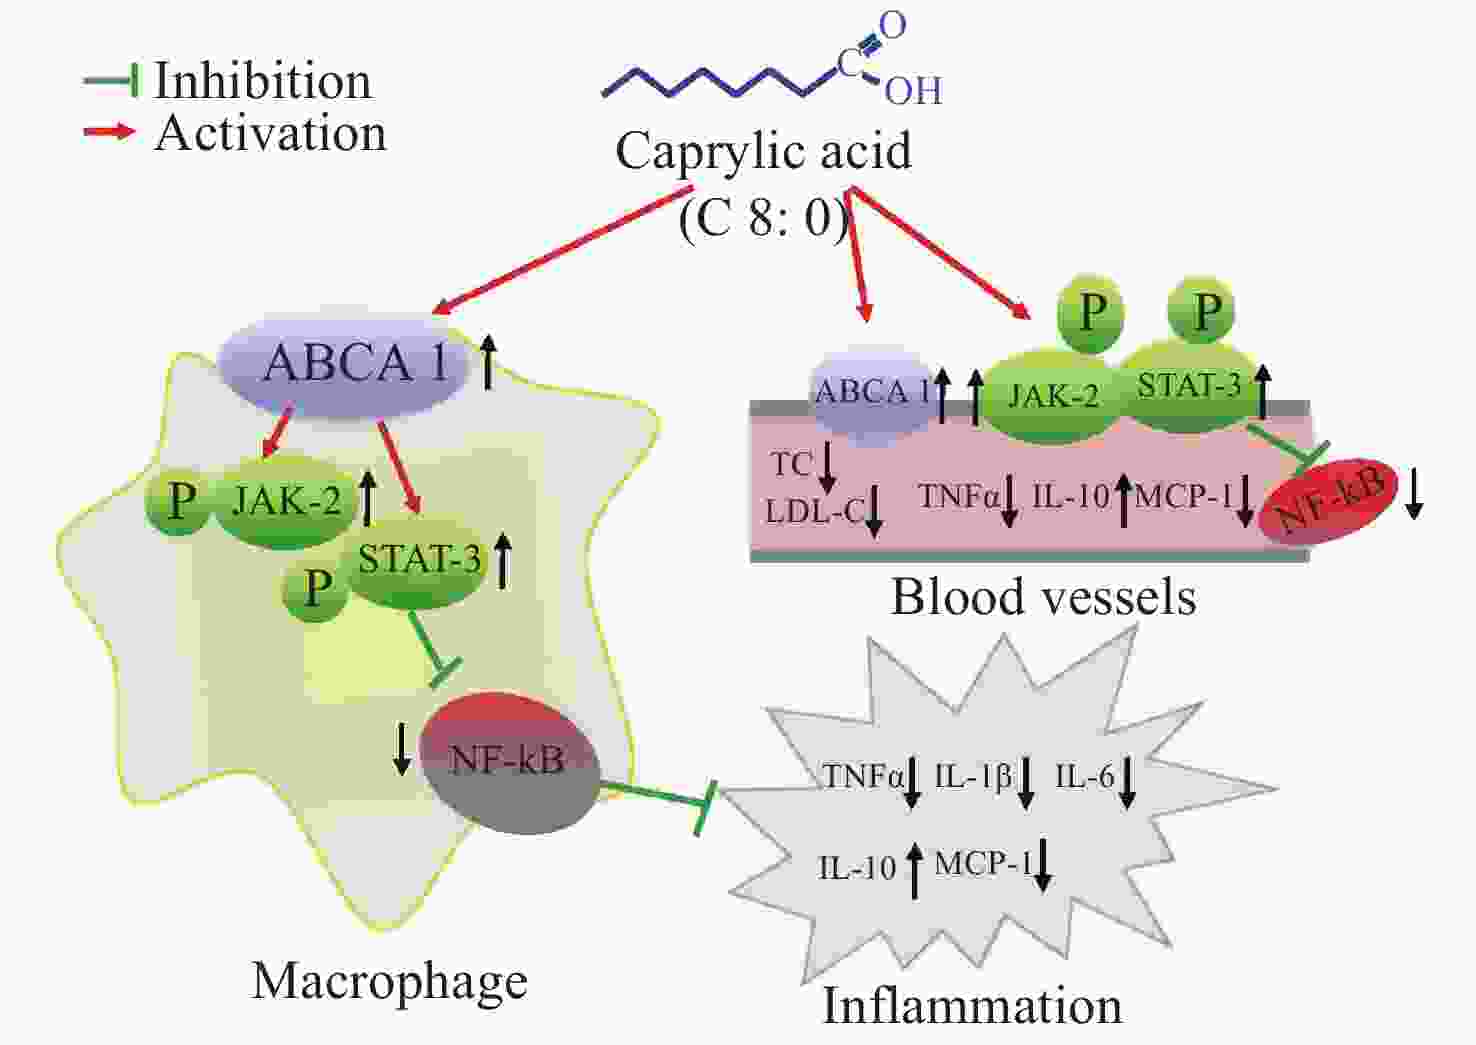
Figure S1. The effect of caprylic acid on lipid metabolism and inflammatory response and its proposed mechanism. Arrows (↓) represent a decreasing level and downregulation of activity or protein or mRNA expression. Arrows (↑) represent an increasing level and upregulation of activity or protein or mRNA expression. ABCA1, ATP-binding cassette transporter A1; JAK2, Janus Kinase 2; STAT3, signal transducer and activator of transcription 3; NF-κB, nuclear factor kappa B; TNF-α, tumor necrosis factor α; IL-1β, interleukin-1β; IL-6, interleukin-6; IL-10, interleukin-10; MCP-1, monocyte chemoattractant protein-1; TC, total cholesterol; LDL-C, low density lipoprotein cholesterol
-
There are no conflicts of interest to declare.
-
We gratefully acknowledge the cooperation of the study participants, without whom the study would not have been possible.
HTML
Feed Composition
Experimental Animals
Cell Culture
Preparation of Fatty Acids[13]
Serum Lipid Level Measurements
Inflammatory Factor Detection
RNA Extraction
Western Blot Analysis
Statistical Analysis
Effects of Different Fatty Acids on Feed Intake and Body Weight in C57BL/6J Mice
Effects of Different Fatty Acids on Blood Lipids in C57BL/6J Mice

Effects of Different Fatty Acids on Serum Inflammatory Factors in C57BL/6J Mice

Effects of Different Fatty Acids on the mRNA Expression of ABCA1 and JAK2/STAT3 Pathway-Related Molecules in C57BL/6j Mouse Aorta

Effects of Caprylic Acid on Inflammatory Factors in RAW264.7 Cells Stimulated by LPS
Effects of Caprylic Acid on JAK2/STAT3 mRNA Expression in RAW264.7 Cells Stimulated by LPS
Effects of Caprylic Acid on the Expression of JAK2/STAT3 Pathway Proteins in RAW264.7 Cells Stimulated by LPS
 21166Supplementary Materials.pdf
|

|

 Quick Links
 DownLoad: