


-
Sodium dehydroacetate (DHA-Na), which has broad-spectrum bacteriostatic [1-3] and antifungal properties [4], is widely used in foods, beverages, pharmaceutical drugs, animal feed, and cosmetics [1, 2, 5]; its range and dosage have been specified by several regulatory agencies. DHA-Na is classified as “toxic” or “harmful” only for products used around the mouth/lips by the European Union and is designated as “safe” for general, specific, or limited use in food or cosmetics by the EU and US Food and Drug Administration [6]. In the USA, ≤ 65.0 mg/kg DHA-NA and dehydroacetic acid are allowed in cut or peeled squash [7]. In Japan, DHA-Na has also been used as a food preservative for cheese, butter, and margarine at a concentration of 0.5 g/kg or less in the form of dehydroacetic acid [8, 9]. In China, 0.3–1.0 mg/kg DHA-Na and dehydroacetic acid are allowed in bakery products, pickled vegetables, fruit juices, starch products, and fermented soybean products [10].
However, several studies have reported toxicities associated with DHA-Na, including lipid peroxidation, allergic contact dermatitis, and cellular damage [5, 11,12]. Studies on human have shown that DHA-Na used in cosmetics may cause contact dermatitis [13, 14], and several patients with chronic leg ulcers have reported sensitization to DHA-Na [15, 16]. In a study of the sub-chronic toxicity of DHA-Na toward dogs, body weight loss, hemorrhage in the stomach, and an increase in blood urea nitrogen (BUN) were observed, and they were attributed to the lack of appetite and subsequent weight loss [17]. From other animal studies, DHA-Na has anticoagulant effects and induces stomach hemorrhage in rats [18, 19]. DHA-Na induces cardiovascular toxicity associated with Ca2+ imbalance and decreases locomotor persistence and hypoxia tolerance in zebrafish [20, 21]. Dehydroacetic acid has been used as a food additive in China for numerous years, but the relevant toxicological data and risk assessment are still lacking. In recent years, food-borne diseases related to DHA have been reported [22]; thus, the safety of DHA and its sodium salt as a food additive has attracted increasing public attention. Experts should study whether DHA-Na has a potential impact on human health through food intake and the allowable daily intake of DHA-Na. For such reasons, the China National Center for Food Safety Assessment (CFSA) initiated a reassessment program for DHA-Na in 2017. To provide basic toxicological data for the risk assessment of DHA-Na, we carried out a series of toxicity tests, including acute toxicity, genotoxicity, and 28- and 90-day repeated oral dose test and extended one-generation reproductive toxicity study. The protocol of a 90-day repeated-oral dose test was performed in accordance with the Organization of Economic Cooperation and Development (OECD) Test Guideline 408 (OECD, 2018). The study was conducted in compliance with the Principles of Good Laboratory Practice (GLP).
The present study was intended to determine the non-observed adverse effect level (NOAEL) of DHA-Na. Furthermore, we used the benchmark dose (BMD) method to calculate the limit of the BMD (BMDL), which was used as a point of departure (POD) to develop an acceptable dietary intake (ADI) and evaluate the risk of DHA-Na.
-
DHA-Na was purchased from Nantongaokai Biotechnology Development Co. Ltd. The sample was stored at room temperature. Samples for gavage administration were dissolved with double-purified water, adjusted to the required concentration, and prepared twice in one week. According to the requirements of “national food safety standards for food additive sodium dehydroacetate” (GB25547-2010, China National Standards), the quality specifications of DHA-Na were tested by Agilent liquid chromatography (1200), and the results showed that the sample met the quality specifications of relevant standards (Table 1).
Items (Unit) Results Colour and luster White State of organization Powder Sodium dehydroacetate
(C8H7NaO4, dry basis)99.3 Free base test PASS Moisture (w/%) 8.6 Chloride (in terms of CL) (w/%) ≤ 0.011 Arsenic (As) (mg/kg) Did not check out (< 0.05) Lead (Pb) (mg/kg) 0.48 Table 1. Test results of quality specification of sodium dehydroacetate
-
The 90-day oral toxicity study was performed in compliance with the relevant Organization for Economic Co-operation and Development (OECD) Test Guidelines and Good Laboratory Practice (GLP) regulations by the China National Accreditation Service of Conformity Assessment (CNAS). The study was conducted at the Animal Institute of Huizhitaikang Biotechnology (Beijing) Co. Ltd. (CNAS GLP 0010) (SYXK 2018-0009). SPF, weanling Sprague–Dawley (SD) rats (4 weeks, 50–60 g) were obtained from Beijing Vital River Laboratories Animal Technology Co. Ltd. (SCXK 2016-0006). The animals were quarantined for 6 days before the start of the study and before they were randomly assigned to four groups. Male and female rats were given DHA-Na solution by gavage daily at dose levels of 0.0, 31.0, 62.0, and 124.0 mg/kg BW/day for 13 weeks, whereas the satellite group (five rats for each sex and each group) in the highest-dose (124.0 mg/kg BW/day) and control groups were followed by a recovery period of 4 weeks.
Animal rooms were maintained at temperatures of 20–23 °C and relative humidity of 40%–55% and were artificially illuminated (fluorescent lights) with a 12 h light/dark cycle and air exchanges of 10–15 times per hour. The rats were individually housed in suspended stainless steel, open-mesh cages and allowed free access to pellet feed and tap water during the experiments. Metabolic cages were used to collect urine. The protocol for the study was reviewed and approved by the Animal Experimental Welfare & Ethical Inspection Committee of China National Center for Food Safety Risk Assessment (Permit Number: 2019018).
Ten rats per sex in each group were subjected to necropsy one day after the last administration (the end of the treatment period), and the remaining five rats per sex in the satellite group were subjected to necropsy 28 days after the last administration (the end of the recovery period). All surgeries were performed under sodium pentobarbital anesthesia, and every effort was exerted to minimize the suffering of rats.
-
The mortality, signs of morbidity, or other noteworthy signs of toxicity-like behavioral changes of each rat were observed and recorded daily (data not shown). The body weights of rats were measured before the test, one week after, and at sacrifice after fasting. Food consumption was measured once a week during the experiment. After 90 days of DHA-Na exposure and the recovery, all the animals were euthanized by exsanguination from the abdominal aorta under sodium pentobarbital anesthesia.
-
On day 91, urine was collected overnight prior to necropsy from animals in the main groups, which were housed in metabolic cages, whereas that from satellite groups was obtained on days 46 and 129. All urine samples were analyzed for glucose, bilirubin, ketone bodies, urine specific gravity, occult blood, pH, urine protein, uric bravery former, nitrite, and white blood cells using a urine analyzer (Mindray, UA-66).
-
On day 46, all the animals in the satellite groups were anesthetized with 3% sodium pentobarbital solution, and blood samples were collected from the tail vein. On days 91 and 129, all rats in the main and satellite groups were anesthetized with 3% sodium pentobarbital solution, and blood samples were collected from the abdominal aorta. Blood samples for hematology were collected into tubes containing ethylenediaminetetraacetic acid anticoagulant. A fully automatic hematology analyzer (Mindray, BC-5000VET) was employed to measure parameters, such as red blood cell (RBC) count, hemoglobin (HGB), erythrocyte volume, mean corpuscular HGB (MCH), MCH concentration (MCHC), platelet count (PLT), white blood cell (WBC) count, and WBC differential count of lymphocytes, neutrophils, and monocytes.
Blood samples for serum biochemistry were collected into tubes containing no anticoagulant and centrifuged to obtain serum. Clinical chemistry parameters of serum were measured using a fully automatic biochemical analyzer (Mindray, BS-220); they included the enzyme activities of alanine aminotransferase (ALT), aspartate aminotransferase (AST), alkaline phosphatase (ALP), and concentrations of albumin (ALB), cholesterol, creatine, glucose (GLU), blood urea nitrogen (BUN), total protein (TP), and triglycerides (TC). The electrolytes, including Na, potassium (K), chloride (Cl), and calcium (Ca), were measured by an automatic electrolyte analyzer (B&E BIO-TECH, CBS-400). Prothrombin time and activated partial thromboplastin time were analyzed using a blood coagulation analyzer (semi-automatic hemagglutination analysis, PERLONG, PUN-2048B).
-
Blood samples for endocrine hormone levels were the same as those used for biochemistry tests, and detection was conducted on days 49, 91, and day 119. 3′-Triiodothyronine (T3), thyroxine (T4), and thyroid stimulating hormone (TSH) were measured using an enzyme-linked immunosorbent assay microplate reader (BioTek Elx808).
-
A complete gross pathology inspection was conducted on all the animals during the necropsy by a senior pathologist assisted by a trained team. The brain, heart, liver, kidneys, spleen, thymus, and testes were trimmed of extraneous fat and weighed immediately. Paired organs were weighed together. The ratios of organ weight to terminal body weights were calculated. Tissue sections from the brain, spinal cord, pituitary gland, thyroid, parathyroid, thymus, esophagus, salivary glands, stomach, duodenum, jejunum (including Peyer’s patches), ileum, cecum, colon, liver, pancreas, kidneys, adrenals, spleen, heart, trachea and lungs, aorta, ovaries, uterus, cervix, vagina, testes, epididymides, prostate, seminal vesicles, coagulation glands, urinary bladder, lymph nodes (mesentery and mandibular), salivary gland (mandibular), muscles (including nerve), bone marrow (sternum), mammary gland (female), eyes (including the eyeball, optic nerve, and Harley’s gland), and skin were fixed with 4% formalin for 24 h, embedded in paraffin, sectioned to 5 µm, and stained in hematoxylin and eosin for microscopic observation.
Histopathological examination of tissue sections was confined to the control group and 124.0 mg/kg BW group in the main group and all animals in the satellite group. Histopathological examination of other dose groups was conducted in case of abnormal lesions.
-
SPSS software (v11.5, Chicago, IL, USA) was employed to evaluate any statistically significant differences attributable to organ and body weight, hematological and blood biochemical data, and food consumption data compared with the highest-dose or control group. Homogeneous data were analyzed using analysis of variance. In addition, the least-square difference model or Dunnett’s multiple comparison was used to determine whether any significant difference existed between these groups. Values of P < 0.05 were considered statistically significant. Data were presented as mean ± standard deviation (SD).
-
The US Environmental Protection Agency’s (USEPA) BMD software (BMDS) version 2.6.0 was used to estimate the BMD. Data from our study were modeled using the BMDS of continuous models (exponential, Hill, polynomial, power, and linear), and the benchmark response (BMR) of 10% was selected for the response. Model results were evaluated for the goodness of fit, and the BMD and BMDL of the models with the lowest Akaike information criterion (AIC) value and adequate Chi-square P values (> 0.1) were selected as the POD of DHA-Na.
-
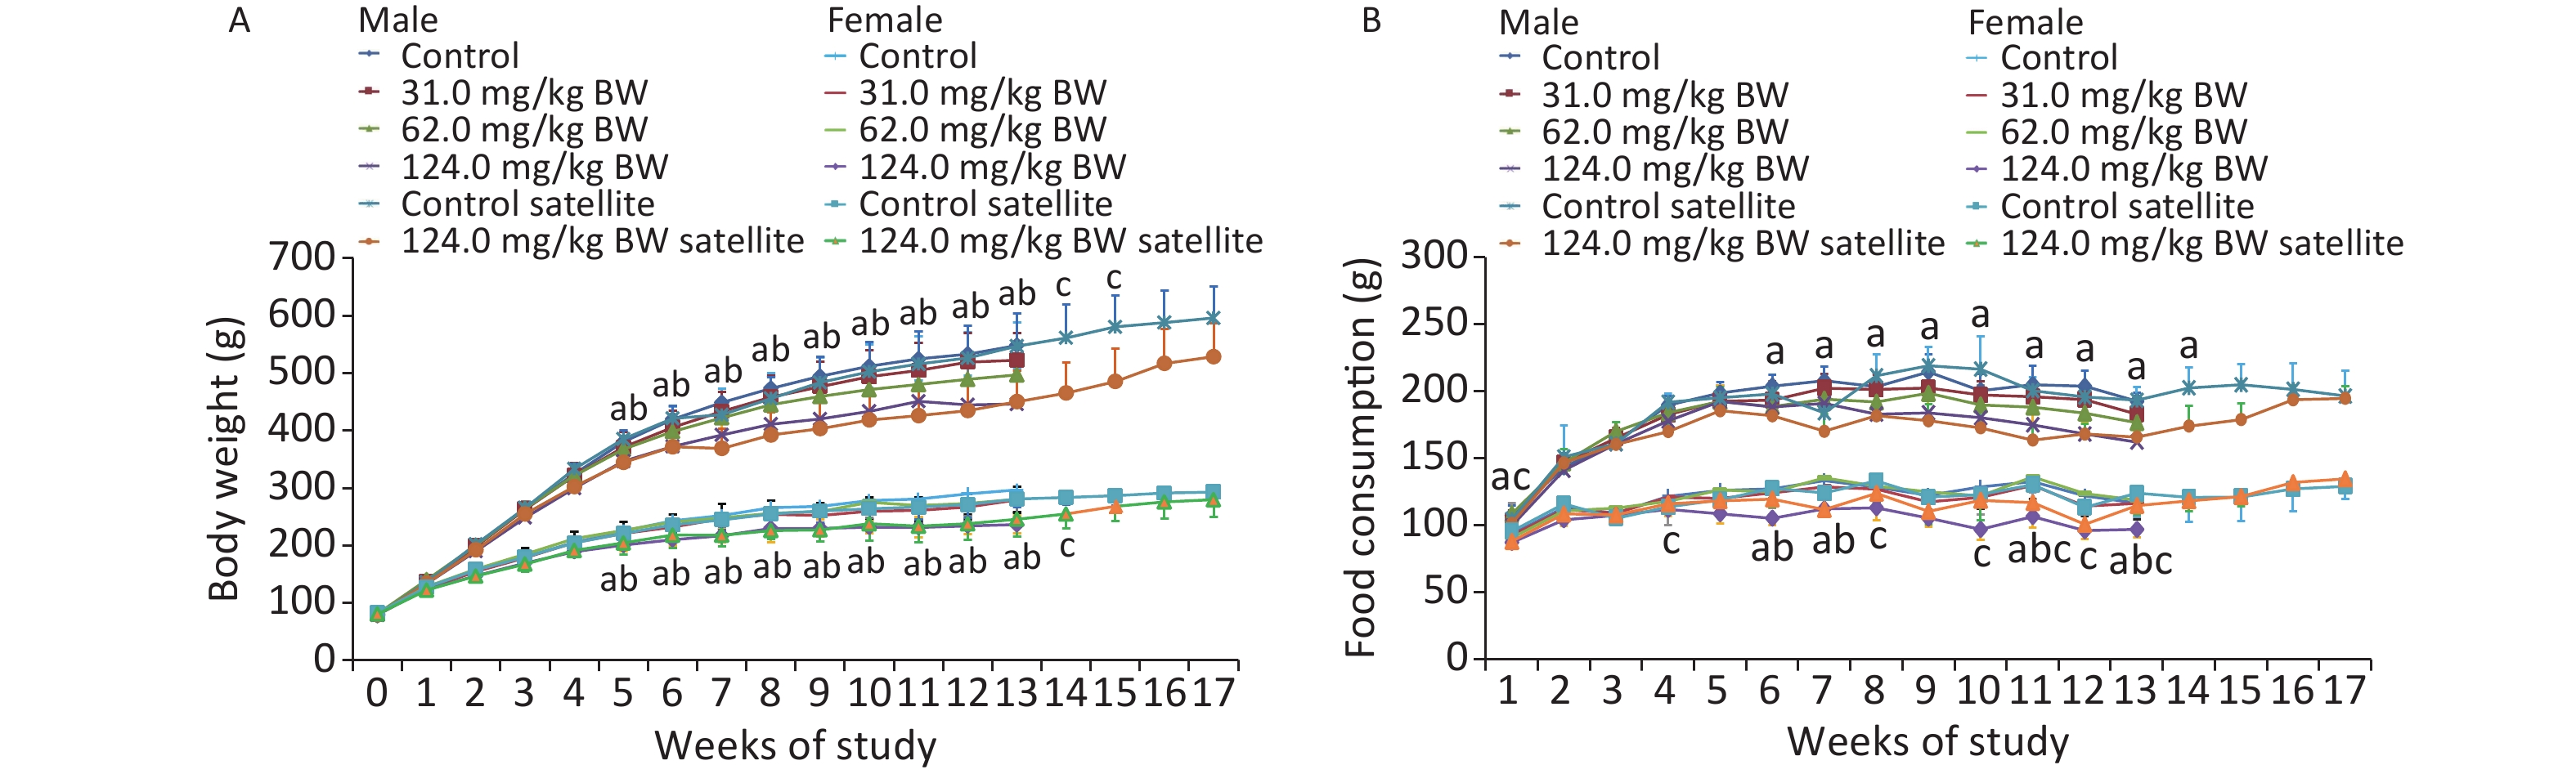
Throughout the 90-day study, all the animals survived well during the feeding trial and were healthy. No clinical signs of toxicity observed in the behavior, activity, posture, or other external appearances were observed (data not shown). Compared with the controls, the body weights of male and female rats in the 124.0 mg/kg BW treatment group showed a downward trend from the first week and decreased significantly from week 6 (W6) until the end of the administration and recovery periods (Figure 1). The results showed that the weight of male animals in the middle- and high-dose groups was significantly lower than that in the control group and exhibited a dose-response relationship. The weight of female rats in the high-dose group of the main experimental group was significantly lower than that in the control group and manifested a dose-response relationship. In the recovery period, the weight of female and male animals in the high-dose satellite group was significantly lower than that in the satellite group. Although no significant difference was observed in the weight of animals in the high-dose W16–17 (male) and W15–17 (female) groups compared with the control group, the weight of animals in the high-dose W16–17 (male) and W15–17 (female) groups continually decreased. This weight loss was therefore considered to be of toxicological significance.
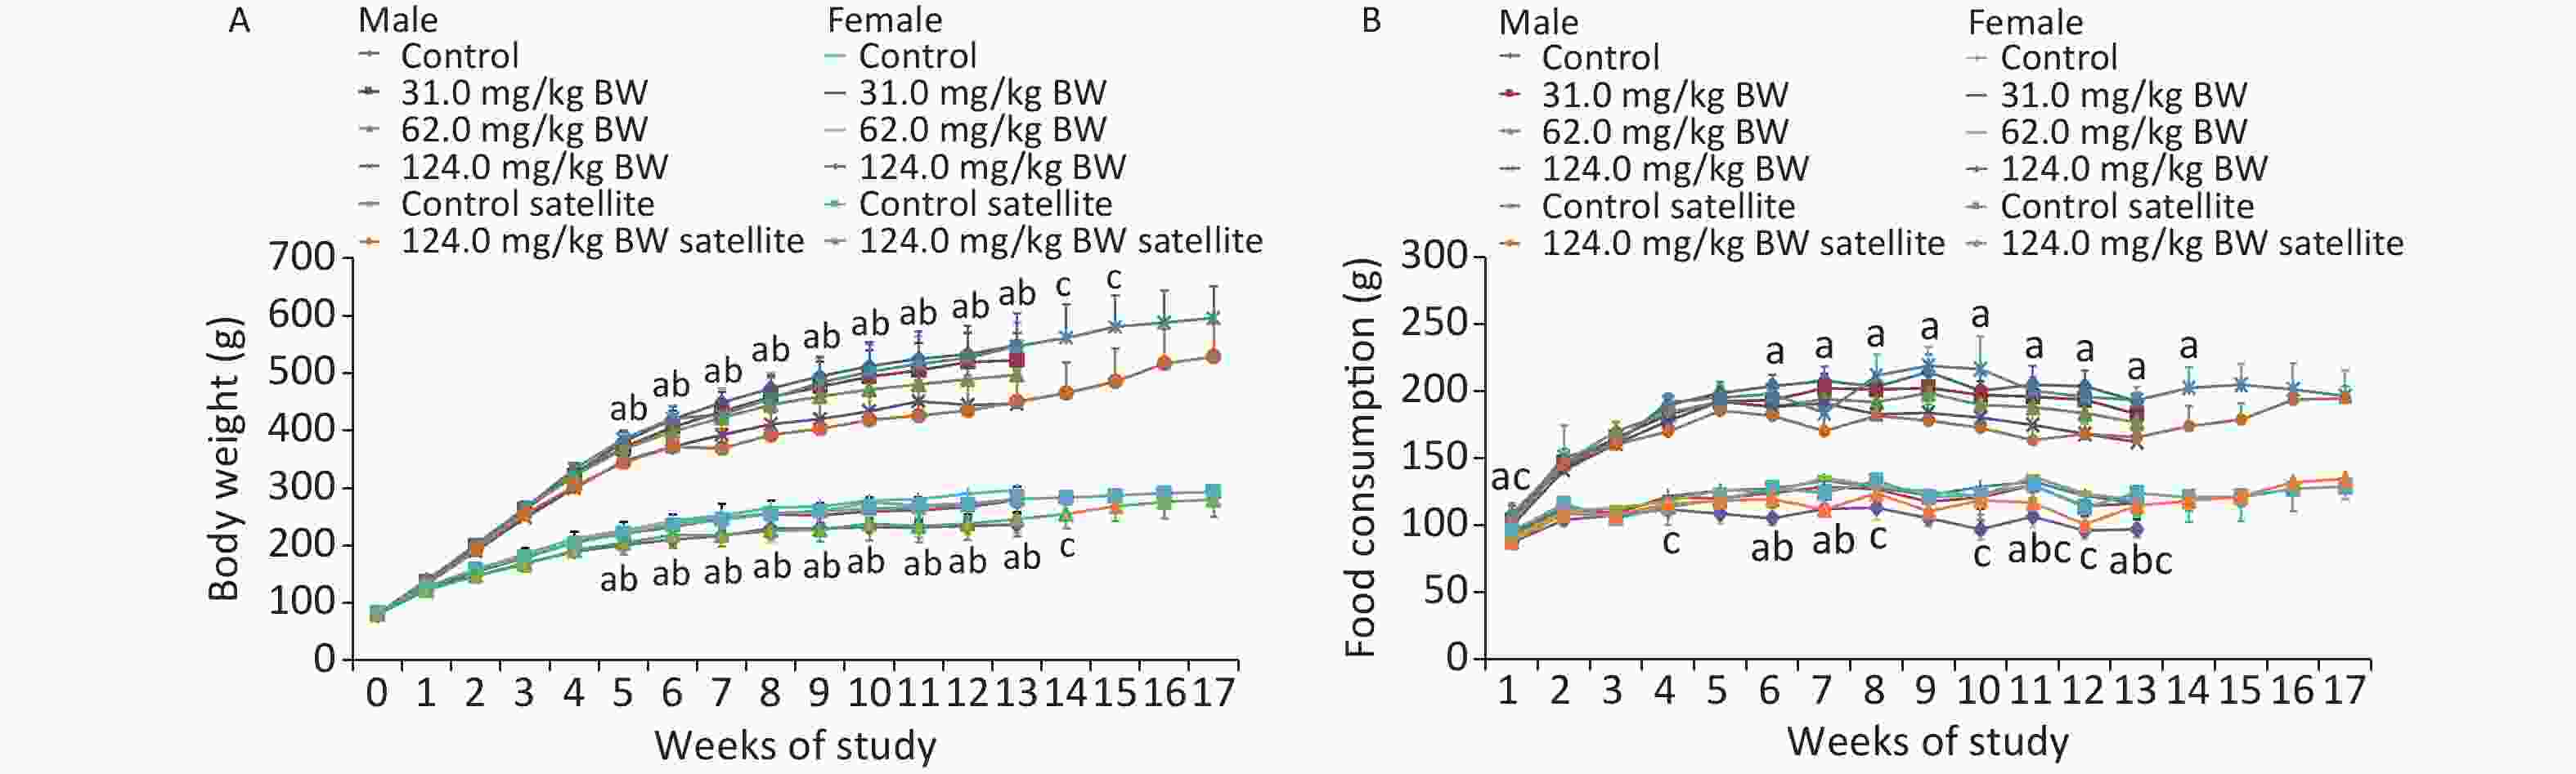
Figure 1. Weekly body weight (A) and weekly food consumption (B) of rats gavaged by different doses of DHA-Na for 90 (13 weeks) or 119 days (4 week recovery period) (n = 10 in each test group; n = 5 in recovery group; mean ± SD). a: The 124.0 mg/kg BW treatment group compared with control group, P < 0.05. b: The 62.0 mg/kg BW treatment group compared with control group, P < 0.05. c: The 124.0 mg/kg BW treatment group of the satellite group compared with the control group of the satellite group (P < 0.05).
Compared with the controls, the food consumption of male rats in the 62.0 and 124.0 mg/kg BW groups decreased significantly on W6, W7, W11, and W13. The food consumption of male rats in the 124.0 mg/kg BW group in the satellite group was lower than in the control group on W4, W8, W10, W11, W12, and W13. Among the female animals, the food intake of 124.0 mg/kg BW group reduced on W1, W5, W6, W7, W8, W9, W10, W11, W12, and W13, and the food consumption in the 124.0 mg/kg BW group in the satellite group was lower than in the control group on W1. Such statistical difference was not considered adverse nor related to the DHA-Na treatment because the changes were not dose-related nor time-related.
Compared with the controls, the food utilization of male and female rats in individual dose groups decreased significantly at individual time points. A significant decrease was observed in the total food utilization of male and female rats in the 62.0 and 124.0 mg/kg BW treatment groups compared with controls. In the recovery period, no significant difference was noticed in the food utilization between satellite groups. The difference in food utilization was related to the intake of the subjects, and the change was of toxicological significance.
-
On day 46 (Table 2), compared with the control group of the satellite group, the EOS values of male rats were significantly lower in the 124.0 mg/kg BW treatment group of the satellite group. However, the MCH and MCHC values of male rats were significantly higher. The MCH and MCHC values of female rats were significantly higher in the 124.0 mg/kg BW treatment group of the satellite group, but their PLT values were significantly lower. On day 91 (Table 3), compared with the control group, the Bas, MCV, MCH, MCHC, and Cl values of the males in the 31.0 mg/kg BW treatment group were significantly higher, and the nCa and iCa values were significantly lower; the MCV, MCH, and MCHC values of the males in the 62.0 mg/kg BW treatment group were significantly higher, but their RBC values were significantly lower. The K, nCa, and iCa values of males were significantly lower in the 124.0 mg/kg BW treatment group. The PLT values of female rats were significantly lower in the 31.0 mg/kg BW treatment group. The MCV and MCH of female rats were significantly higher in the 62.0 mg/kg BW treatment group, whereas the iCa values of males were significantly lower in the 124.0 mg/kg BW treatment group. The HGB, MCV, MCH, and MCHC of females were significantly higher in the 124.0 mg/kg BW treatment group. On day 119, compared with the control group of the satellite group, the MCV values of females were significantly higher in the 124.0 mg/kg BW treatment group of the satellite group. No statistically significant differences were observed between the treatment and control groups in terms of other hematological parameters.
Parameters Sex 0 mg/kg BW 124.0 mg/kg BW WBC (109/L) F 11.9 ± 0.5 10.3 ± 3.1 M 14.5 ± 1.8 12.6 ± 2.4 Neu (109/L) F 1.9 ± 0.2 1.4 ± 0.5 M 2.2 ± 0.5 2.0 ± 1.1 Lym (109/L) F 9.3 ± 0.5 8.3 ± 2.7 M 11.5 ± 1.7 9.8 ± 1.8 Mon (109/L) F 0.6 ± 0.1 0.5 ± 0.1 M 0.6 ± 0.1 0.6 ± 0.2 Eos (109/L) F 0.1 ± 0.0 0.1 ± 0.0 M 0.2 ± 0.0 0.1 ± 0.0** Bas (109/L) F 0.1 ± 0.0 0.1 ± 0.0 M 0.1 ± 0.0 0.1 ± 0.0 Neu (%) F 16.1 ± 1.7 13.5 ± 4.0 M 15.3 ± 3.3 15.7 ± 6.4 Lym (%) F 77.9 ± 1.9 79.4 ± 4.9 M 79.4 ± 3.4 78.2 ± 7.1 Mon (%) F 4.8 ± 1.1 5.2 ± 0.7 M 3.7 ± 0.2 4.6 ± 1.1 Eos (%) F 0.9 ± 0.2 1.4 ± 0.9 M 1.2 ± 0.2 1.0 ± 0.2 Bas (%) F 0.4 ± 0.1 0.5 ± 0.2 M 0.4 ± 0.1 0.4 ± 0.2 RBC (1012/L) F 7.4 ± 0.4 7.1 ± 0.4 M 7.5 ± 0.2 7.2 ± 0.4 HGB (g/L) F 154.0 ± 4.0 158.0 ± 9.0 M 162.0 ± 4.0 167.0 ± 4.0 HCT (%) F 42.3 ± 1.0 42.3 ± 2.4 M 44.8 ± 1.1 44.5 ± 1.2 MCV (fL) F 57.2 ± 2.2 59.8 ± 2.7 M 60.0 ± 2.4 61.6 ± 1.4 MCH (pg) F 20.8 ± 0.8 22.2 ± 1.4* M 21.7 ± 1.0 23.0 ± 0.5* MCHC (g/L) F 364.0 ± 2.0 371.0 ± 6.0** M 362.0 ± 4.0 374.0 ± 3.0** PLT (109/L) F 952.0 ± 42.0 799.0 ± 103.0** M 864.0 ± 69.0 858.0 ± 30.0 Note. WBC: white blood cell; Neu: neutrophilic cell; Lym: lymphocytes; Mon: monocytes; Eos: eosinophils; Bas: basophil; Neu%: neutrophil ratio; Lym%: lymphocyte ratio; Mon%: monocyte ratio; Eos%: eosinophil ratio; Bas%: basophil ratio; RBC: red blood cell; HGB: hemoglobin; HCT: erythrocyte volume; MCV: mean RBC volume; MCH: mean erythrocyte hemoglobin; MCHC: mean hemoglobin concentration; PLT: platelet count; MPV: mean platelet volume; *P < 0.05, **P < 0.01; significantly different from controls. F, female. M, male. Table 2. Hematology values of rats in satellite group gavaged with sodium dehydroacetate on day 46 (n = 5/group; mean ± SD)
Parameters Sex End of treatment period dosage
(mg/kg BW)End of recovery period
dosage (mg/kg BW)0 31.0 62.0 124.0 0 124.0 WBC (109/L) F 10.4 ± 4.2 9.1 ± 3.7 11.5 ± 1.9 9.0 ± 1.5 6.6 ± 1.2 8.0 ± 1.8 M 13.6 ± 2.4 16.3 ± 4.8 14.1 ± 1.1 12.8 ± 4.7 12.5 ± 2.5 13.1 ± 2.9 Neu (109/L) F 1.4 ± 0.7 1.2 ± 0.5 1.3 ± 0.7 1.2 ± 0.3 0.9 ± 0.2 0.8 ± 0.2 M 1.8 ± 0.5 1.9 ± 0.6 1.6 ± 0.4 1.3 ± 0.5* 2.0 ± 0.8 1.8 ± 0.9 Lym (109/L) F 8.4 ± 3.6 7.4 ± 3.2 9.4 ± 1.7 7.2 ± 1.4 5.3 ± 1.1 6.7 ± 1.8 M 10.8 ± 2.3 13.1 ± 4.3 11.5 ± 0.9 10.6 ± 4.0 9.5 ± 2.3 10.5 ± 2.2 Mon (109/L) F 0.5 ± 0.1 0.5 ± 0.2 0.6 ± 0.3 0.6 ± 0.2 0.3 ± 0.1 0.4 ± 0.1 M 0.8 ± 0.2 0.9 ± 0.3 0.7 ± 0.2 0.7 ± 0.3 0.8 ± 0.1 0.6 ± 0.2 Eos (109/L) F 0.1 ± 0.0 0.1 ± 0.0 0.1 ± 0.1 0.1 ± 0.0 0.1 ± 0.0 0.1 ± 0.1 F 0.2 ± 0.1 0.2 ± 0.1 0.2 ± 0.0 0.2 ± 0.2 0.1 ± 0.0 0.2 ± 0.0 Bas (109/L) M 0.0 ± 0.0 0.0 ± 0.0 0.0 ± 0.0 0.0 ± 0.0 0.0 ± 0.0 0.0 ± 0.0 F 0.1 ± 0.0 0.1 ± 0.0* 0.1 ± 0.0 0.16 ± 0.0 0.1 ± 0.0 0.0 ± 0.0 Neu (%) F 13.2 ± 4.7 13.3 ± 3.0 10.8 ± 5.4 13.0 ± 2.9 13.9 ± 2.8 10.9 ± 4.1 M 13.2 ± 3.8 12.6 ± 4.9 11.4 ± 1.8 10.3 ± 2.7 16.3 ± 6.0 13.5 ± 4.0 Lym (%) F 80.8 ± 5.4 80.3 ± 4.1 82.5 ± 8.1 79.0 ± 4.4 80.2 ± 3.1 82.4 ± 6.6 M 79.2 ± 4.1 79.8 ± 5.9 81.7 ± 2.1 82.5 ± 4.7 75.4 ± 6.2 80.2 ± 4.8 Mon (%) F 4.8 ± 1.4 5.2 ± 1.5 5.2 ± 2.4 6.3 ± 1.8 4.3 ± 0.7 4.9 ± 2.2 M 5.7 ± 1.1 5.9 ± 1.3 5.3 ± 1.1 5.4 ± 2.2 6.6 ± 1.8 4.8 ± 1.5 Eos (%) F 1.0 ± 0.1 0.9 ± 0.4 1.2 ± 0.5 1.4 ± 0.5 1.2 ± 0.3 1.3 ± 0.6 M 1.4 ± 0.4 1.2 ± 0.2 1.1 ± 0.4 1.3 ± 0.5 1.2 ± 0.4 1.2 ± 0.3 Bas (%) F 0.3 ± 0.2 0.3 ± 0.1 0.3 ± 0.1 0.3 ± 0.1 0.4 ± 0.1 0.4 ± 0.2 M 0.5 ± 0.1 0.5 ± 0.2 0.6 ± 0.1 0.5 ± 0.2 0.6 ± 0.2 0.4 ± 0.1 RBC (1012/L) F 8.0 ± 0.5 7.8 ± 0.5 7.9 ± 0.4 7.9 ± 0.4 7.9 ± 0.5 7.9 ± 0.4 M 8.1 ± 0.4 7.9 ± 0.3 7.7 ± 0.3** 7.7 ± 0.2** 9.0 ± 0.4 8.8 ± 0.5 HGB (g/L) F 156.0 ± 8.0 155.0 ± 8.0 158.0 ± 4.0 164.0 ± 8.0* 154.0 ± 6.0 159.0 ± 7.0 M 158.0 ± 4.0 162.0 ± 7.0 161.0 ± 8.0 166.0 ± 4.0** 167.0 ± 8.7 169.0 ± 7.4 HCT (%) F 44.6 ± 2.5 43.8 ± 2.3 45.1 ± 1.6 45.8 ± 2.0 44.2 ± 1.7 46.0 ± 2.1 M 43.4 ± 1.3 43.3 ± 1.6 42.7 ± 1.7 43.8 ± 0.7 49.0 ± 1.9 50.0 ± 2.5 MCV (fL) F 55.8 ± 1.2 56.1 ± 1.3 57.5 ± 1.4** 58.1 ± 1.3** 55.8 ± 2.3 58.6 ± 1.8* M 53.3 ± 1.2 54.5 ± 1.1* 55.2 ± 1.3** 57.3 ± 1.3** 54.4 ± 3.1 56.8 ± 0.6 MCH (pg) F 19.6 ± 0.6 19.8 ± 0.6 20.1 ± 0.7* 20.8 ± 0.5** 19.5 ± 0.8 20.2 ± 0.7 M 19.4 ± 0.7 20.4 ± 0.7** 20.8 ± 0.7** 21.7 ± 0.7** 18.6 ± 1.3 19.2 ± 0.3 MCHC (g/L) F 350.0 ± 5.0 353.0 ± 4.0 351.0 ± 7.0 357.0 ± 4.0* 349.0 ± 4.3 346.0 ± 4.2 M 364.0 ± 7.0 374.0 ± 8.0** 377.0 ± 7.0** 378.0 ± 5.0** 341.0 ± 7.0 337.0 ± 3.0 PLT (109/L) F 1066.0 ± 113.0 908.0 ± 304.0* 1038.0 ± 66.0 953.0 ± 109.0 978.0 ± 100.0 980.0 ± 64.0 M 1019.0 ± 7.0 1037.0 ± 124.0 1026.0 ± 98.0 927.0 ± 102.0 950.0 ± 217.0 1073.0 ± 101.0 Note. WBC: white blood cell; Neu: neutrophilic cell; Lym: lymphocytes; Mon: monocytes; Eos: eosinophils; Bas: basophil; Neu%: neutrophil ratio; Lym%: lymphocyte ratio; Mon%: monocyte ratio; Eos%: eosinophil ratio; Bas%: basophil ratio; RBC: red blood cell; HGB: hemoglobin; HCT: erythrocyte volume; MCV: mean RBC volume; MCH: mean erythrocyte hemoglobin; MCHC: mean hemoglobin concentration; PLT: platelet count; MPV: mean platelet volume; *P < 0.05, **P < 0.01; significantly different from controls. F, female. M, male. Table 3. Hematology values of rats gavaged with different concentrations of sodium dehydroacetate for 90 days (n = 10/group; mean ± SD)
-
On day 46 (Table 4), compared with the control group of the satellite group, the ALP and GLU values of the male rats were significantly lower in the 124.0 mg/kg BW treatment group of the satellite group, the BUN and GLU of female rats were significantly lower, whereas the TG values of female rats were significantly higher in the 124.0 mg/kg BW treatment group of the satellite group. On day 91 (Table 5), compared with the control group, the ALT, CK, and GLU values of males in the 31.0 mg/kg BW treatment group were significantly lower; the AST and CK values of males in the 62.0 mg/kg BW treatment group were significantly lower; the TP and ALB values of males in the 62.0 mg/kg BW treatment group were significantly higher; the AST, ALP, CK, and GLU of males in the 124.0 mg/kg BW treatment group were significantly lower, whereas the TP, ALB, and GLOB values of males in the 124.0 mg/kg BW treatment group were significantly higher. The CK values of the 31.0 mg/kg BW treatment group were significantly lower, the GLU and TG values were significantly lower in the 62.0 mg/kg BW treatment group, and the ALT and GLU values were significantly lower in the 124.0 mg/kg BW treatment group. On day 119 (recovery period), compared with the control group of the satellite group, the BUN values of the female rats were significantly higher, whereas the GLOB values were significantly lower in the 124.0 mg/kg BW treatment group of the satellite group. No statistically significant differences were observed between the treatment groups and control group in relation to other serum chemistry parameters.
Parameters Sex 0 mg/kg BW 124.0 mg/kg BW ALT (U/L) F 37.0 ± 7.3 39.0 ± 3.8 M 46.1 ± 4.8 45.4 ± 6.5 AST (U/L) F 127.9 ± 15.1 110.7 ± 25.4 M 147.8 ± 11.5 99.2 ± 17.8 TP (g/L) F 71.0 ± 2.4 67.1 ± 3.0 M 65.8 ± 3.9 66.1 ± 2.1 ALB (g/L) F 38.9 ± 0.7 38.2 ± 1.4 M 35.3 ± 1.0 36.6 ± 0.6 ALP (U/L) F 139.3 ± 59.3 104.5 ± 30.9 M 230.8 ± 26.5 166.1 ± 40.5* CK (U/L) F 377.7 ± 154.6 337.1 ± 124.6 M 397.8 ± 237.2 257.1 ± 66.3 GLU (mmol/L) F 5.5 ± 0.5 4.5 ± 0.3** M 5.6 ± 0.5 4.1 ± 0.7** BUN (mmol/L) F 5.6 ± 0.2 4.7 ± 0.2* M 4.7 ± 0.8 5.0 ± 0.4 CREA (μmol/L) F 29.2 ± 4.5 25.9 ± 3.9 M 29.8 ± 9.3 27.7 ± 2.9 TC (mmol/L) F 1.8 ± 0.4 2.1 ± 0.3 M 1.9 ± 0.2 1.7 ± 0.1 TG (mmol/L) F 0.3 ± 0.1 0.6 ± 0.1** M 0.5 ± 0.2 0.5 ± 0.2 γ-GT (U/L) F 0.9 ± 0.2 1.1 ± 1.0 M 0.7 ± 0.4 1.0 ± 0.3 GLOB (g/L) F 32.1 ± 2.2 28.9 ± 2.5 M 30.5 ± 4.0 29.6 ± 1.6 Note. ALT, alanine aminotransferase; AST, aspartate aminotransferase; TP, total protein content; ALB, albumin content; T-BIL, total bilirubin content; ALP, alkaline phosphatase activity; CK, creatine kinase; GLU, blood glucose level; BUN, urea nitrogen content; CREA, creatinine content; TC, total cholesterol; TG, triglyceride; γ-GT: glutamyl transpeptidase; GLOB, GLOB content; *P < 0.05, **P < 0.01; significantly different from controls. F, female. M, male. Table 4. Serum chemistry values of rats in satellite group gavaged with sodium dehydroacetate on day 46 (n = 5/group; mean ± SD)
Parameters Sex End of treatment period dosage
(mg/kg BW)End of recovery period
dosage (mg/kg BW)0 31.0 62.0 124.0 0 124.0 ALT (U/L) F 58.4 ± 11.3 52.9 ± 10.6 49.7 ± 20.7 45.1 ± 6.2* 57.7 ± 26.5 52.9 ± 8.4 M 61.8 ± 6.3 53.5 ± 9.2* 54.0 ± 10.5 55.5 ± 8.5 53.9 ± 11.4 51.1 ± 11.7 AST (U/L) F 87.4 ± 40.9 83.0 ± 11.8 87.7 ± 30.0 74.4 ± 10.7 105.5 ± 46.0 76.2 ± 10.4 M 92.0 ± 10.1 91.0 ± 12.7 80.0 ± 9.6* 75.4 ± 7.3** 94.6 ± 8.8 71.8 ± 11.7 TP (g/L) F 78.3 ± 5.7 78.1 ± 4.2 78.5 ± 5.6 76.7 ± 4.5 79.2 ± 4.0 73.9 ± 3.8 M 68.8 ± 3.0 70.0 ± 2.6 71.5 ± 1.7* 72.4 ± 2.1** 70.0 ± 2.5 72.9 ± 2.8 ALB (g/L) F 41.9 ± 3.2 41.4 ± 2.4 40.9 ± 2.7 41.0 ± 2.3 39.7 ± 2.4 37.8 ± 2.2 M 35.8 ± 1.3 36.3 ± 1.8 37.4 ± 1.2* 37.7 ± 1.1** 34.2 ± 1.0 35.0 ± 1.3 ALP (U/L) F 70.2 ± 14.2 88.1 ± 34.6 74.8 ± 25.6 64.9 ± 15.1 55.7 ± 33.2 74.4 ± 14.8 M 161.5 ± 25.3 152.1 ± 38.8 137.8 ± 25.2 115.8 ± 17.2** 113.7 ± 29.2 139.2 ± 33.1 CK (U/L) F 80.7 ± 14.0 66.2 ± 10.0** 74.8 ± 11.8 72.3 ± 7.6 78.6 ± 12.5 76.7 ± 11.2 M 100.4 ± 16.4 86.3 ± 10.1* 80.6 ± 14.7** 78.6 ± 9.5** 106.8 ± 11.5 93.3 ± 35.6 GLU (mmol/L) F 8.9 ± 1.4 7.9 ± 1.7 7.0 ± 1.5** 7.0 ± 1.1** 9.1 ± 1.9 10.3 ± 1.6 M 9.2 ± 1.3 8.0 ± 1.1* 8.42 ± 1.76 7.3 ± 0.9** 8.2 ± 1.1 10.6 ± 2.7 BUN (mmol/L) F 7.3 ± 1.3 7.6 ± 0.9 7.3 ± 0.8 6.9 ± 1.0 6.1 ± 0.5 7.3 ± 1.0* M 6.8 ± 1.0 6.9 ± 0.7 7.2 ± 0.8 7.2 ± 0.8 6.3 ± 1.0 6.7 ± 0.8 CREA (μmol/L) F 36.4 ± 3.9 38.5 ± 10.8 34.8 ± 2.4 35.6 ± 8.9 33.9 ± 4.1 42.6 ± 8.1 M 34.3 ± 4.6 34.0 ± 4.1 33.6 ± 11.2 33.1 ± 11.3 32.5 ± 2.6 39.3 ± 9.6 TC (mmol/L) F 2.44 ± 0.59 2.12 ± 0.45 2.40 ± 0.51 2.08 ± 0.40 2.90 ± 0.20 2.00 ± 0.40 M 1.91 ± 0.32 1.76 ± 0.33 1.68 ± 0.35 1.96 ± 0.49 2.10 ± 0.40 2.10 ± 0.20 TG (mmol/L) F 1.08 ± 0.28 1.05 ± 0.51 0.65 ± 0.24* 1.05 ± 0.40 0.70 ± 0.40 0.70 ± 0.20 M 0.76 ± 0.13 0.64 ± 0.17 0.76 ± 0.38 0.75 ± 0.29 1.00 ± 0.60 0.90 ± 0.30 γ-GT (U/L) F 0.7 ± 0.3 0.7 ± 0.3 0.8 ± 0.3 0.8 ± 0.4 0.4 ± 0.2 0.4 ± 0.1 M 0.6 ± 0.2 0.4 ± 0.3 0.6 ± 0.1 0.5 ± 0.3 0.0 ± 0.0 0.0 ± 0.1 GLOB (g/L) F 36.4 ± 2.8 36.7 ± 2.2 37.6 ± 3.3 35.8 ± 2.7 39.5 ± 1.8 36.1 ± 2.1* M 32.9 ± 2.4 33.7 ± 1.4 34.1 ± 1.1 34.8 ± 1.7* 35.8 ± 2.4 37.9 ± 2.2 K (mmol/L) F 6.3 ± 0.5 5.9 ± 0.7 6.2 ± 0.6 5.8 ± 0.6 7.4 ± 2.2 5.9 ± 0.7 M 6.6 ± 0.5 6.2 ± 0.4 6.2 ± 0.5 6.0* ± 0. 7 6.0 ± 1.5 6.2 ± 0.9 Na (mmol/L) F 151.2 ± 1.4 151.6 ± 2.1 151.6 ± 1.5 151.6 ± 1.4 150.3 ± 2.2 150.5 ± 0.9 M 151.8 ± 1.7 151.2 ± 1.5 151.9 ± 1.3 151.8 ± 1.8 139.1 ± 35.0 152.8 ± 4.0 Cl (mmol/L) F 96.8 ± 1.9 97.5 ± 2.7 96.0 ± 1.7 95.6 ± 1.8 95.6 ± 1.0 95.5 ± 3.0 M 95.4 ± 1.8 97.4* ± 3.2 94.6 ± 1.4 94.9 ± 1.2 126.5 ± 68.4 92.6 ± 3.5 iCa (mmol/L) F 1.9 ± 0.1 1.8 ± 0.1 1.8 ± 0.1 1.7** ± 0.1 1.5 ± 0.7 1.7 ± 0.0 M 1.8 ± 0.1 1.7** ± 0.2 1.8 ± 0.1 1.7** ± 0.1 1.3 ± 0.6 1.6 ± 0.1 nCa (mmol/L) F 1.5 ± 0.0 1.46 ± 0.1 1.4 ± 0.1 1.4 ± 0.1 1.1 ± 0.6 1.3 ± 0.0 M 1.5 ± 0.1 1.4* ± 0.0 1.4 ± 0.1 1.4 ± 0.0 1.0 ± 0.5 1.3 ± 0.1 TCa (mmol/L) F 2.9 ± 0.1 2.9 ± 0.1 2.9 ± 0.1 2.8 ± 0.2 2.3 ± 1.2 2.6 ± 0.1 M 2.9 ± 0.1 2.8 ± 0.09 2.9 ± 0.1 3.7 ± 3.1 2.1 ± 0.9 2.7 ± 0.2 APTT (S) F 13.9 ± 1.2 14.1 ± 0.7 14.2 ± 1.0 14.5 ± 0.8 12.9 ± 2.3 11.9 ± 2.5 M 14.8 ± 0.4 15.3 ± 0.8 15.9 ± 1.6 14.9 ± 0.7 14.5 ± 2.8 13.2 ± 2.7 PT (S) F 13.4 ± 1.8 13.1 ± 3.1 13.6 ± 2.3 13.5 ± 1.6 13.4 ± 0.6 13.8 ± 0.7 M 15.4 ± 3.1 14.3 ± 2.1 15.2 ± 2.4 16.2 ± 2.4 14.7 ± 0.6 13.8 ± 0.6 Note. ALT, alanine aminotransferase; AST, aspartate aminotransferase; TP, total protein content; ALB, albumin content; T-BIL, total bilirubin content; ALP, alkaline phosphatase activity; CK, creatine kinase; GLU, blood glucose level; BUN, urea nitrogen content; CREA, creatinine content; TC, total cholesterol; TG, triglyceride; GLOB, GLOB content; γ-GT, glutamyl transpeptidase; K, potassium ion content; Na, content of sodium ion; Cl, chloride ion content; TCa, total calcium ion content; iCa, content of ionic calcium; nCa, standard ion calcium content; APTT, activated partialthromboplastin time; PT, prolonged prothrombin time; *P < 0.05, **P < 0.01; significantly different from controls. F, female. M, male. Table 5. Serum chemistry values of rats gavaged with different concentrations of sodium dehydroacetate for 90 days (n = 10/group; mean ± SD)
-
No significant differences were observed in any of the urinary parameters between rats of both genders in the treatment groups and controls (Table 6).
Parameters Sex End of treatment period dosage
(mg/kg BW)End of recovery period
dosage (mg/kg BW)0 31.0 62.0 124.0 0 124.0 Colour F 0/10 0/10 0/10 0/10 0/5 0/5 M 0/10 0/10 0/10 0/10 0/5 0/5 Clarity F 0/10 0/10 0/10 0/10 0/5 0/5 M 0/10 0/10 0/10 0/10 0/5 0/5 WBC F 1/10 1/10 0/10 0/10 2/5 1/5 M 5/10 6/10 4/10 4/10 0/5 0/5 Nitrite F 3/10 0/10 5/10 0/10 3/5 2/5 M 1/10 6/10 0/10 3/10 0/5 0/5 Uro F 0/10 2/10 0/10 0/10 0/5 2/5 M 0/10 0/10 0/10 0/10 0/5 0/5 Protein F 1/10 0/10 0/10 0/10 2/5 0/5 M 7/10 9/10 6/10 5/10 3/5 4/5 PH F 8.4 ± 0.4 7.9 ± 1.3 8.4 ± 0.6 8.5 ± 0.3 8.2 ± 1.0 6.5 ± 1.5 M 8.4 ± 0.5 8.2 ± 0.9 8.6 ± 0.2 8.0 ± 0.9 8.2 ± 0.8 8.4 ± 0.2 Blood F 0/10 0/10 0/10 0/10 0/5 0/5 M 2/10 2/10 2/10 1/10 3/5 1/5 Proportion F 1.015 ± 0.003 1.014 ± 0.005 1.014 ± 0.005 1.016 ± 0.002 1.013 ± 0.007 1.007 ± 0.003 M 1.016 ± 0.005 1.012 ± 0.002 1.015 ± 0.002 1.014 ± 0.003 1.013 ± 0.006 1.016 ± 0.002 Acetone body F 0/10 0/10 0/10 0/10 1/5 1/5 M 7/10 5/10 4/10 0/10 1/5 2/5 Bilirubin F 0/10 0/10 0/10 0/10 1/5 2/5 M 4/10 1/10 1/10 1/10 0/5 0/5 Glucose F 0/10 0/10 0/10 0/10 0/5 3/5 M 1/10 2/10 0/10 1/10 1/5 0/5 Vitamin C F 0/10 1/10 0/10 0/10 1/5 0/5 M 0/10 2/10 0/10 1/10 0/5 0/5 Note. F, female. M, male. N/10 indicate the incidence of parameters. Table 6. Urinalysis of rats gavaged with different concentrations of sodium dehydroacetate for 90 days
-
On day 91 (Table 7), the TSH levels of male and female rats in the 124.0 mg/kg BW treatment group were higher than those in the control group. No difference was recorded in the T3, T4, and TSH hormone levels between the satellite and control groups on days 49 and 119.
Parameters Sex End of treatment period
dosage (mg/kg BW)End of recovery period
dosage (mg/kg BW)0 31.0 62.0 124.0 0 124.0 T3 (ng/mL) F 0.727 ± 0.080 0.772 ± 0.242 0.665 ± 0.179 0.740 ± 0.147 0.556 ± 0.070 0.758 ± 0.086 M 0.696 ± 0.165 0.618 ± 0.104 0.672 ± 0.078 0.704 ± 0.099 0.453 ± 0.062 0.458 ± 0.072 T4 (ng/mL) F 27.566 ± 3.884 29.813 ± 4.280 26.894 ± 7.147 29.211 ± 5.380 22.758 ± 6.201 20.349 ± 4.057 M 24.615 ± 6.001 23.373 ± 3.085 25.878 ± 4.891 26.967 ± 2.634 21.671 ± 3.057 18.401 ± 4.014 TSH (mU/L) F 1.583 ± 0.317 1.603 ± 0.492 1.623 ± 0.558 2.112 ± 0.352* 0.971 ± 0.206 0.939 ± 0.218 M 1.283 ± 0.332 1.450 ± 0.277 1.427 ± 0.506 1.713 ± 0.283* 1.033 ± 0.159 0.890 ± 0.158 Note. TSH: thyroid stimulating hormone; T3: 3′-triiodothyronine; T4: thyroxine; comparison between the main experimental dose group and the control group and the satellite group of the additional high-dose group and the control satellite group, *P < 0.05; significantly different from controls. F, female. M, male. Table 7. T3, T4, and TSH values of rats gavaged with different concentrations of sodium dehydroacetate for 90 days (n = 10/group; mean ± SD)
-
Compared with the control groups, the organ weight of the kidney in the 31.0 mg/kg BW treatment group was significantly lower than that in the control group. The organ weights of the liver, heart, and spleen of males in the 62.0 mg/kg BW treatment group and those of liver, kidney, heart, and brain in the 124.0 mg/kg BW treatment group were significantly lower than those of the control group. The organ weights of the kidney and brain in the 124.0 mg/kg BW treatment group of the satellite group were lower than those in the control group (Table 8).
Parameters Sex End of treatment period dosage
(mg/kg BW)End of recovery period
dosage (mg/kg BW)0 31.0 62.0 124.0 0 124.0 Liver (g) F 7.572 ± 1.271 7.743 ± 0.799 7.987 ± 0.719 6.862 ± 0.798 7.548 ± 0.564 7.538 ± 0.401 M 14.497 ± 1.606 13.351 ± 1.746 13.170 ± 0.838* 12.896 ± 1.350* 14.367 ± 1.711 14.077 ± 1.495 Spleen (g) F 0.548 ± 0.096 0.541 ± 0.085 0.611 ± 0.098 0.491 ± 0.065 0.564 ± 0.105 0.551 ± 0.071 M 0.991 ± 0.173 1.015 ± 0.113 0.868 ± 0.124* 0.876 ± 0.105 1.028 ± 0.137 0.962 ± 0.140 Kidney (g) F 1.975 ± 0.309 1.898 ± 0.270 1.903 ± 0.161 1.563 ± 0.313** 3.708 ± 0.358 3.244** ± 0.181 M 3.735 ± 0.381 3.368 ± 0.421* 3.565 ± 0.189 3.022 ± 0.215** 1.947 ± 0.124 1.823 ± 0.232 Adrenals (g) F 0.062 ± 0.011 0.065 ± 0.014 0.071 ± 0.014 0.056 ± 0.009 0.061 ± 0.006 0.055 ± 0.005 M 0.064 ± 0.010 0.065 ± 0.014 0.065 ± 0.007 0.065 ± 0.010 0.067 ± 0.011 0.058 ± 0.008 Thymus (g) F 0.351 ± 0.061 0.381 ± 0.068 0.409 ± 0.108 0.312 ± 0.059 0.269 ± 0.039 0.337 ± 0.052 M 0.410 ± 0.091 0.386 ± 0.062 0.384 ± 0.065 0.385 ± 0.166 0.305 ± 0.083 0.341 ± 0.100 Heart (g) F 1.026 ± 0.157 1.047 ± 0.110 1.059 ± 0.120 0.959 ± 0.101 1.136 ± 0.085 1.098 ± 0.099 M 1.924 ± 0.265 1.812 ± 0.203 1.672 ± 0.157** 1.452 ± 0.224** 1.911 ± 0.158 1.782 ± 0.189 Brain (g) F 1.882 ± 0.112 1.908 ± 0.059 1.896 ± 0.102 1.765 ± 0.060** 1.941 ± 0.067 1.825 ± 0.065 M 2.227 ± 0.128 2.158 ± 0.080 2.117 ± 0.063 1.995 ± 0.039** 2.243 ± 0.056 2.075 ± 0.050 Ovary (g) F 0.078 ± 0.026 0.084 ± 0.020 0.086 ± 0.016 0.068 ± 0.013 0.093 ± 0.009 0.085 ± 0.014 Uterus (g) F 0.501 ± 0.104 0.643 ± 0.180* 0.561 ± 0.131 0.511 ± 0.104 0.553 ± 0.168 0.626 ± 0.084 Testis (g) M 3.726 ± 0.273 3.767 ± 0.220 3.943 ± 0.259 3.818 ± 0.243 3.989 ± 0.291 3.852 ± 0.302 Epididymides (g) M 1.451 ± 0.084 1.456 ± 0.127 1.509 ± 0.102 1.406 ± 0.143 1.523 ± 0.100 1.483 ± 0.231 Note. *P < 0.05, **P < 0.01; significantly different from controls. F, female. M, male. Table 8. Absolute organ weights of rats gavaged with different concentrations of sodium dehydroacetate for 90 days (n = 10/group; mean ± SD)
The relative organ weights (organ-to body weight ratios) of testis and epididymis of males in the 62.0 mg/kg BW treatment group were significantly higher than those in the control group and those of the brain, liver, adrenal glands, testis, and epididymis of males in the 124.0 mg/kg BW treatment group. The relative organ weight of the brain of males in the 124.0 mg/kg BW treatment group was significantly lower than that in the control group, whereas that of the brain of females in the 31.0 mg/kg BW treatment group was significantly higher. The relative organ weights of the liver, spleen, adrenal gland, and thymus of females in the 62.0 mg/kg BW treatment group were significantly higher than those in the control group and those of the liver, brain, and heart of females in the 124.0 mg/kg BW treatment group. The organ-to-brain weight ratios of the testis and epididymis of males in the 62.0 mg/kg BW treatment group were significantly higher than those of the control group, whereas those of the heart and kidneyof males in the 124.0 mg/kg BW treatment group were significantly lower. The organ-to-brain weight ratio of the testis of males in the 124.0 mg/kg BW treatment group was significantly higher than that of the control group. The organ-to-brain weight ratio of the uterus of females in the 31.0 mg/kg BW treatment group was significantly higher than that of the control group, whereas that of the kidney of females in this group was significantly lower (Table 9).
Parameters Sex End of treatment period dosage
(mg/kg BW)End of recovery period
dosage (mg/kg BW)0 31.0 62.0 124.0 0 124.0 Liver/body weight (%) F 2.66 ± 0.19 2.91 ± 0.20 2.97 ± 0.21** 2.98 ± 0.23** 2.68 ± 0.18 2.79 ± 0.24 M 2.74 ± 0.15 2.65 ± 0.29 2.73 ± 0.17 2.96 ± 0.17* 2.50 ± 0.15 2.76 ± 0.06 Spleen/body weight (%) F 0.19 ± 0.02 0.20 ± 0.02 0.23 ± 0.03** 0.22 ± 0.04 0.20 ± 0.03 0.20 ± 0.01 M 0.19 ± 0.03 0.20 ± 0.02 0.18 ± 0.02 0.20 ± 0.02 0.18 ± 0.02 0.19 ± 0.03 Kidney/body weight (%) F 0.70 ± 0.06 0.71 ± 0.06 0.71 ± 0.06 0.68 ± 0.13 0.69 ± 0.03 0.67 ± 0.07 M 0.71 ± 0.06 0.67 ± 0.05 0.74 ± 0.04 0.70 ± 0.08 0.65 ± 0.07 0.64 ± 0.05 Adrenals/body weight (%) F 0.022 ± 0.004 0.024 ± 0.005 0.026 ± 0.005* 0.024 ± 0.004 0.022 ± 0.004 0.020 ± 0.000 M 0.012 ± 0.002 0.013 ± 0.002 0.013 ± 0.002 0.015 ± 0.002** 0.011 ± 0.000 0.010 ± 0.000 Thymus/body weight (%) F 0.12 ± 0.02 0.14 ± 0.02 0.15 ± 0.03* 0.14 ± 0.03 0.10 ± 0.01 0.12 ± 0.01 M 0.08 ± 0.02 0.08 ± 0.01 0.08 ± 0.01 0.09 ± 0.04 0.05 ± 0.01 0.07 ± 0.02 Heart/body weight (%) F 0.36 ± 0.03 0.39 ± 0.04 0.39 ± 0.03 0.42 ± 0.05** 0.40 ± 0.04 0.41 ± 0.03 M 0.36 ± 0.04 0.36 ± 0.04 0.35 ± 0.03 0.33 ± 0.02* 0.33 ± 0.03 0.35 ± 0.02 Brain/body weight (%) F 0.67 ± 0.06 0.72 ± 0.06* 0.71 ± 0.05 0.77 ± 0.04** 0.69 ± 0.05 0.68 ± 0.07 M 0.42 ± 0.02 0.43 ± 0.03 0.44 ± 0.03 0.46 ± 0.04** 0.39 ± 0.05 0.41 ± 0.04 Ovary/body weight (%) F 0.03 ± 0.01 0.03 ± 0.01 0.03 ± 0.01 0.03 ± 0.01 0.03 ± 0.00 0.03 ± 0.01 Uterus/body weight (%) F 0.18 ± 0.03 0.24 ± 0.08 0.21 ± 0.06 0.22 ± 0.05 0.20 ± 0.05 0.23 ± 0.04 Testis/body weight (%) M 0.71 ± 0.06 0.75 ± 0.05 0.82 ± 0.06** 0.88 ± 0.11** 0.70 ± 0.08 0.76 ± 0.10 Epididymides/body weight (%) M 0.28 ± 0.02 0.29 ± 0.03 0.31 ± 0.02** 0.32 ± 0.04** 0.27 ± 0.02 0.29 ± 0.03 Liver/brain weight (%) F 400.63 ± 48.09 406.33 ± 46.62 421.41 ± 31.44 388.20 ± 36.67 388.68 ± 23.32 413.30 ± 24.39 M 650.54 ± 56.38 618.64 ± 77.64 622.66 ± 42.82 646.06 ± 63.76 641.56 ± 85.42 677.92 ± 63.05 Spleen/brain weight (%) F 29.03 ± 3.99 28.39 ± 4.60 32.25 ± 5.31 27.88 ± 3.97 29.05 ± 5.49 30.26 ± 4.66 M 44.33 ± 6.09 47.01 ± 4.76 41.01 ± 5.96 43.85 ± 4.84 45.97 ± 6.90 46.31 ± 6.19 Kidney/brain weight (%) F 104.65 ± 12.56 99.53 ± 14.17 100.43 ± 7.45 88.58 ± 17.37** 100.40 ± 7.43 99.91 ± 12.61 M 167.49 ± 11.56 156.06 ± 18.61 168.50 ± 9.03 151.56 ± 11.89** 165.49 ± 17.60 156.35 ± 7.81 Adrenals/brain weight (%) F 3.28 ± 0.58 3.40 ± 0.72 3.74 ± 0.77 3.16 ± 0.48 3.42 ± 0.49 3.19 ± 0.53 M 2.87 ± 0.37 3.00 ± 0.65 3.08 ± 0.40 3.27 ± 0.53 2.72 ± 0.30 2.63 ± 0.22 Thymus/brain weight (%) F 18.66 ± 3.16 20.00 ± 3.67 21.48 ± 5.09 17.66 ± 3.44 13.88 ± 2.04 18.41 ± 2.47 M 18.38 ± 3.87 17.89 ± 2.81 18.15 ± 3.12 19.17 ± 8.02 13.65 ± 3.90 16.47 ± 4.89 Heart/brain weight (%) F 54.39 ± 6.15 54.88 ± 5.33 55.84 ± 5.14 54.30 ± 5.09 58.62 ± 5.82 60.17 ± 4.97 M 86.18 ± 8.70 84.07 ± 10.09 79.06 ± 7.54 72.66 ± 10.19** 85.22 ± 7.44 85.83 ± 8.44 Brain/brain weight (%) F 4.16 ± 1.32 4.41 ± 1.01 4.54 ± 0.98 3.83 ± 0.74 4.76 ± 0.32 4.66 ± 0.84 M 167.61 ± 12.75 174.70 ± 9.64 186.30 ± 11.06** 191.49 ± 13.95** 177.86 ± 13.14 185.93 ± 18.64 Ovary/brain weight (%) F 26.51 ± 4.41 33.71 ± 9.70* 29.73 ± 7.62 29.02 ± 5.98 28.65 ± 9.26 34.43 ± 5.42 Uterus/brain weight (%) F 65.30 ± 4.38 67.55 ± 6.19 71.34 ± 5.09* 70.44 ± 6.91 67.99 ± 5.54 71.46 ± 10.68 Testis/brain weight (%) M 400.63 ± 48.09 406.33 ± 46.62 421.41 ± 31.44 388.20 ± 36.67 388.68 ± 23.32 413.30 ± 24.39 Epididymides/brain weight (%) M 650.54 ± 56.38 618.64 ± 77.64 622.66 ± 42.82 646.06 ± 63.76 641.56 ± 85.42 677.92 ± 63.05 Note. *P < 0.05, **P < 0.01; significantly different from controls. F, female. M, male. Table 9. Relative organ weights of rats gavaged with different concentrations of sodium dehydroacetate for 90 days (n = 10/group; mean ± SD)
The body weight of male and female rats before dissection were significantly higher in controls than in the highest-treatment group. No macroscopic pathology findings were achieved in any of the males or females. Histopathological findings, which are summarized in Table 10, showed various lesions, including spotty necrosis and cellular infiltration in the liver, myocardial necrosis in the heart, cellular infiltration in the prostate, non-glandular gastric mucosal squamous epithelium hyperplasia and hyperkeratosis in the stomach, hemosiderin deposits, and extramedullary hematopoiesis in the spleen.
Microscopic iesions End of treatment period
dosage (mg/kg BW)End of recovery period
dosage (mg/kg BW)0 124.0 0 124.0 Heart Myocardial necrosis
Cellular infiltration− I (1/10M) − − Liver Spotty necrosis
Cellular infiltrationII (1/10F) I (2/10M)
II (1/10F)I (1/5F) − Prostate Cellular infiltration I (1/10M) − − − Stomach Non-glandular gastric
Mucosal squamous
Epithelium hyperplasiaI (2/10F, 2/10M)
II (4/10F, 2/10M)I (3/10M, 1/10F)
II (6/10F, 3/10M)I (2/5M)
II (4/5F, 1/5M)I (1/5F, 2/5M)
II (2/5F, 1/5M)
III (2/5F, 1/5M)Hyperkeratosis I (3/10F, 2/10M)
II (3/10F, 2/10M)I (1/10F, 4/10M)
II (7/10F, 2/10M)I (1/5M)
II (4/5F, 2/5M)II (4/5M, 4/5F)
III (1/5F)Spleen Hemosiderin deposits I (2/10F, 4/10M)
II (3/10F, 9/10M)
III (5/10F)I (2/10F, 1/10M)
II (3/10F, 4/10M)
III (8/10F, 5/10M)I (1/5F, 2/5M)
II (3/5M)
III (3/5F)I (1/5M)
II (1/5F, 1/5M)
III (3/15F, 2/5M)Extramedullary
HematopoiesisI (2/10F, 4/10M)
II (3/10F, 3/10M)I (2/10F, 1/10M)
II (2/10F, 2/10M)II (1/5F) I (2/5F) Note. Numbers before the brackets indicate the degree of histopathologic changes: I, minimal; II, mild; III, moderate; IV, Severe. Numbers in the brackets indicate the incidence of histopathologic changes. "−" means no observed changes. F, female. M, male. Table 10. Histopathological examination of rats after sodium dehydroacetate administration
The incidences and/or severities of these changes did not differ in any of the treatment and control groups. No histopathological lesions were observed in the brain, spinal cord, pituitary gland, thyroid, parathyroid, thymus, esophagus, salivary glands, duodenum, jejunum (including Peyer’s patches), ileum, cecum, colon, pancreas, kidneys, adrenals, trachea and lungs, aorta, ovaries, uterus, cervix, vagina, testes, epididymides, prostate, seminal vesicles, coagulation glands, urinary bladder, lymph nodes (mesentery and mandibular), salivary gland (mandibular), muscles (including nerve), bone marrow (sternum), mammary gland (female), and eyes (including the eyeball, optic nerve, Harley’s gland).
-
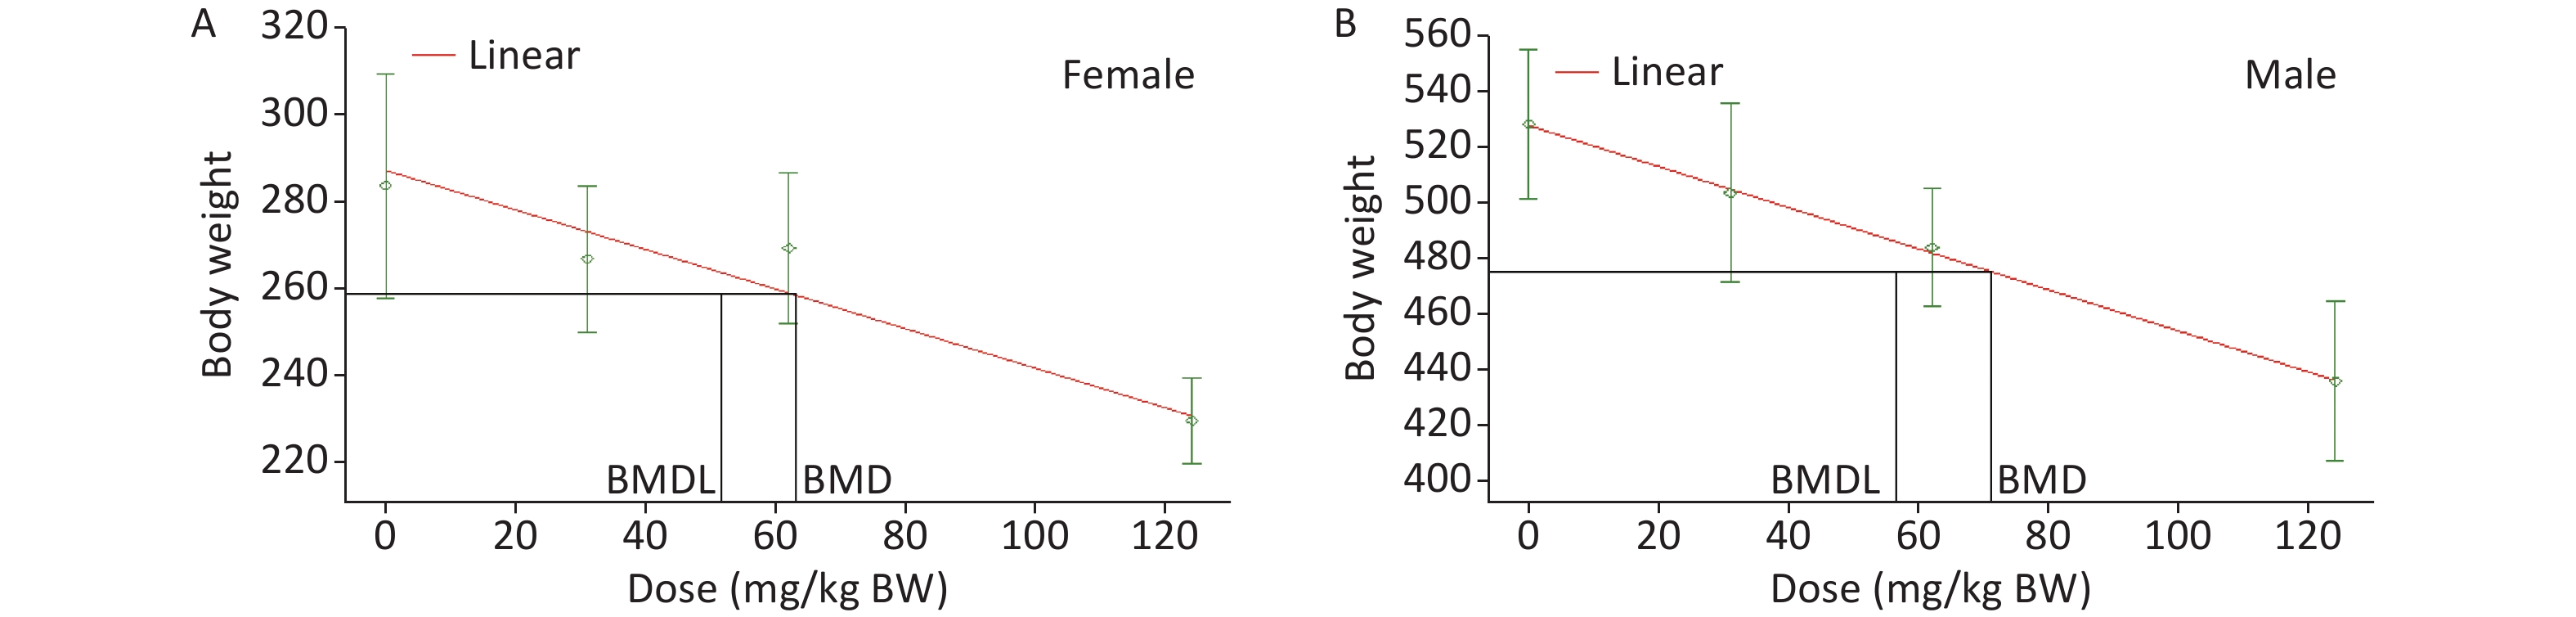
BMD analysis involved selecting the BMR and a set of appropriate models, assessing model fitness, and data reporting. The use of BMD methods involved fitting the mathematical models to dose-response data and using the different results to select a BMD that was associated with a predetermined BMR, such as a 1%, 5%, and 10%. The selection of a different BMR can lead to discrepancies in health-based guidance values (HBGV) between different regulatory bodies. For body weights and body weight gains, 10% weight change is usually considered biologically significant (WHO, 2015). In our study, body weight was evaluated for BMD determination, given that the BW is the most sensitive target to the effects of DHA-Na toxicity. The data were modeled using the BMDS of continuous models (exponential, Hill, polynomial, power, and linear), and the BMR of 10% was selected for the response. Table 11 summarizes the calculation of BMD and BMDL values.
Test model Male Female P for fit BMD BMDL P for fit BMD BMDL Exponential2 0.9548 68.1423 52.7465 0.1421 59.5476 46.9994 Exponential3 0.8095 70.9832 52.8257 0.1175 85.3528 50.4340 Exponential4 0.9548 68.1423 41.9106 0.1421 59.5476 42.2176 Exponential5 N/A 70.9832 52.8257 N/A 85.3527 50.4340 Hill NA 71.3181 55.8779 NA 85.1118 53.3557 Linear 0.9786 71.0244 56.4610 0.1846 63.1271 51.6753 Polynomial 0.8423 72.1095 56.4692 0.1423 83.9885 54.2101 Power 0.8360 71.3773 56.4621 0.1234 85.0905 53.6714 Table 11. BMDs and BMDLs of DHA-Na based on the boy weight from 90 day repeated dose study
Based on recommendations from the USEPA, the model results were evaluated for the goodness of fit. The BMD and BMDL of the models with the lowest AIC value and adequate Chi-square P values (> 0.1) were considered as PODs. Among a set of models, the model with the lowest AIC was considered the best[23]. According to the tests for goodness of fit, the exponential, linear, polynomial, and power models were acceptable to describe the data for male and female rats (Table 11). Then, as recommended by the USEPA [24], AIC was used for model comparison, and the linear model was identified for BMDL calculation. Finally, the lowest BMDL with the most appropriate model fit was selected as the POD for the estimation of the acceptable daily intake of DHA-Na. The BMDLs were 51.7 (Figure 2A) and 56.5 mg/kg BW (Figure 2B) for female and male animals, respectively. To protect the health of the entire population, we used BMDL = 51.7 mg/kg BW conservatively as the POD to estimate the HBGVs, such as the reference dose or ADI.
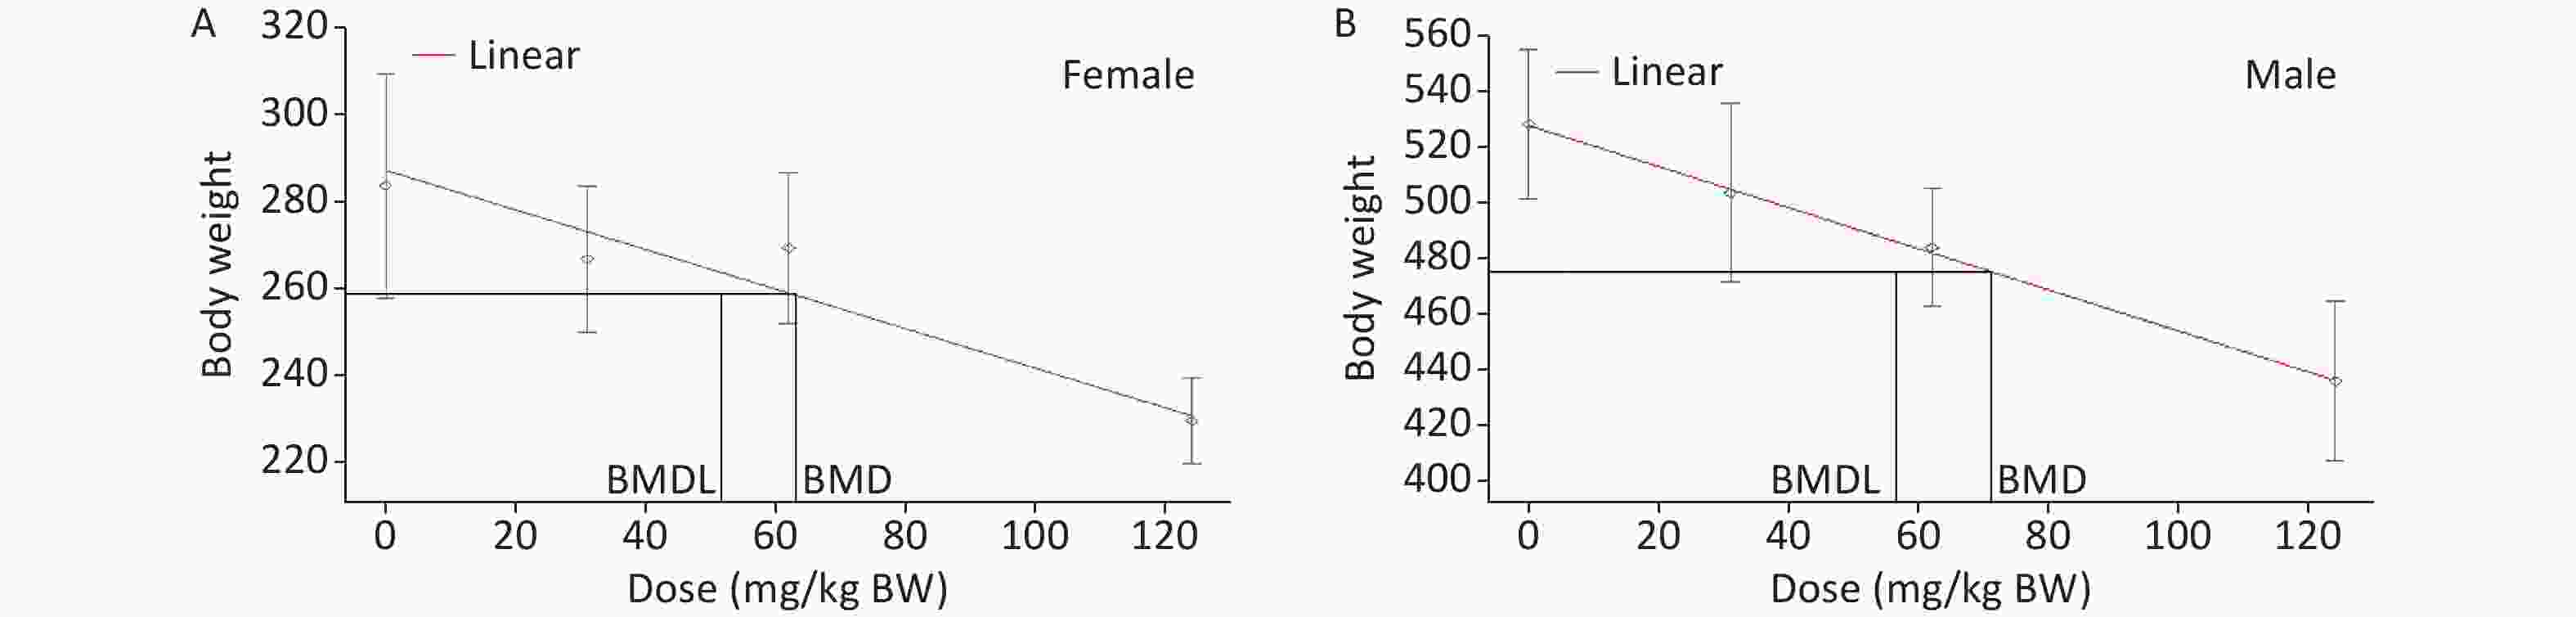
Figure 2. BMD model for the BW of rats in the subchronic oral toxicity study of DHA-Na. (A) Linear model fitting curve for female data. (B) Linear model fitting curve for male data. For each graph, the experimental data are shown in gray (mean ± SD) with the model fit depicted by the red line. The black lines represent the BMD and BMDL calculated based on BMR.
-
Absorption occurs rapidly when DHA-Na and dehydroacetic acid are administered orally to humans, monkeys, dogs, or rats [11,25-26]. The study about metabolic pathway and distribution of DHA in rats showed that when albino rats (160–400 g) were given 60–120 mg/kg BW DHA, about 90% of DHA was eliminated from the body after 4–5 days (20%–40% through urine, 10%–25% through carbon dioxide, and 10%–20% through feces), and the liver was the main metabolizing organ of DHA in rats; DHA was also distributed in high concentration in the blood, especially plasma[26]. The plasma concentration of dehydroacetic acid increases when the increase in dosage reaches the peak at 1–7 days after administration and slowly disappears. Trace dehydroacetic acid can remain for 3–4 days. It is distributed to all organs of the body, mainly excreted through urine, respiration, and feces and can be exposed to the offspring through the placental barrier. Dehydroacetic acid can be excreted by milk[25, 26]. The median lethal dose of DHA-Na is 500–1,500 mg/kg BW, with females showing higher sensitivity than males [10]. The results of genetic toxicity tests were negative [27, 28]. DHA-Na can induce a significant reduction in BW and food consumption at the dose level of 50–200 mg/kg and clear congestion or hemorrhage in various organs. Female Wistar rats are more sensitive to DHA-Na than male ones; DHA-Na can induce coagulation dysfunction by inhibiting liver vitamin K epoxide reductase complex subunit 1 in Wistar rats[5]. The results of the toxicity study in vitro showed that 0.5 mmol/L (approx. 95 mg/L) DHA-Na can cause liver cell lipid peroxidation and cell damage[29]. However, no carcinogenicity has been found[30].
Based on the above results, the rats were given DHA-Na by oral gavage for 90 days and allowed to recover for 4 weeks. No changes in toxicological significance were observed in general clinical indexes, food intake, blood biochemistry, hematology, or urine chemical analysis. Although several hematological and biochemical parameters were significantly different compared with the control group, none of the statistical differences were considered adverse nor attributable to the consumption of DHA-Na because these changes were not dose-related and were within the laboratory’s historical normal range of controls. In addition, certain differences were not consistent across genders. The average weights of male animals in the 62.0 and 124.0 mg/kg BW groups and female rats in the 124.0 mg/kg BW group of the main test group were significantly lower than those in the control group, and a dose-response relationship was observed. The total food consumption of male and female animals in the high-dose group was significantly lower than that in the control group. No significant change in food utilization was found in either DHA-Na treatment groups or controls, which indicated that no nutritional deficiencies and no loss of appetite occurred in any of these groups. The results also suggested that these significant decreases in BW and food consumption can be attributed to the long-term exposure to DHA-Na, coinciding with previous reports revealing that chronic exposure to DHA-Na at high concentrations (50–200 mg/kg) can depress growth [5].
TSH is a glycoprotein hormone produced by the anterior pituitary. It is the primary stimulus for thyroid hormone production by the thyroid gland. TSH also exerts growth effects on thyroid follicular cells, leading to thyroid enlargement. The hypothalamic-pituitary axis regulates TSH release. Specifically, neurons in the hypothalamus release thyroid-releasing hormone, which stimulates thyrotrophs of the anterior pituitary to secrete TSH, which in turn stimulates thyroid follicular cells to release thyroid hormones in the form of T3 or T4. T4 and T3 can then exert negative feedback on the anterior pituitary, with high levels of T3/T4 decreasing TSH secretion and low levels of T3/T4 increasing TSH release. Therefore, TSH is the first-line screening test for hypothyroidism and hyperthyroidism, given that changes occur earlier in TSH than in T3/T4[31].
OECD TG 408 was updated in 2018 with additional emphasis on endocrine endpoints to combine with the existing sensitivity to neurological, immunological, and reproductive effects. Required endpoints include the measurement of T4, T3, TSH, and thyroid gland weight, which are responsive to thyroid pathway perturbation (2). The results showed that the levels of TSH in the male and female animals of the high-dose (124.0 mg/kg BW) group at the end of the study were higher than those in the control group, and the difference was significant. However, at the end of the recovery period, no significant difference was observed between the high-dose and control groups. According to pathological findings, no organic changes occurred in the thyroid gland, suggesting that the high-dose intake of DHA-Na may promote the secretion of TSH by the pituitary gland, which affected the function of the thyroid gland. No related studies have been reported, and further in-depth investigation on this mechanism is needed.
In the past decades, researchers have obtained the POD value of dose-response assessment chiefly using the NOAEL approach, which, however, presents several disadvantages. Given that the NOAEL had the highest dose tested without evidence of an adverse effect in the study, its value is subject to dose selection and dependent upon the capability of the study to detect adverse effects. In general, the identification of the NOAEL is not always a purely statistically based decision, nor does it use all the dose-response information available. The BMD approach involves a statistical method, which uses all information in a complete dataset instead of making pair-wise comparisons using data subsets. In addition, the BMD approach can interpolate between applied doses, whereas the NOAEL approach is restricted to these doses. Furthermore, a BMDL is constantly associated with a predefined effect size for which the corresponding dose has been calculated, whereas a NOAEL represents a predefined dose, and the corresponding potential effect size is mostly left uncalculated. Therefore, a BMDL value provides more information than a NOAEL by explicitly indicating the upper bound of effect at that dose as defined by the BMR[32]. In this study, through BMD modeling with the data on BW, the BMDL for DHA-Na was determined as 51.7 mg/kg BW/day, ensuring an adequate safety margin. Sub-chronic oral toxicity study is critical for the derivation of the HBGV. Our present study may provide scientific data for the risk assessment of DHA-Na.
-
The authors declare that there are no conflicts of interest.
-
Thanks to Professor PENG Shuang Qing for revising the article.
Funds:
The program was supported by the National Key R&D Program of China [2019YFC1605203] and China Food Safety Talent Competency Development Initiative: CFSA 523 Program

 Quick Links
 DownLoad: