

-
Post-cardiac arrest syndrome (PCAS) is a highly intricate pathophysiological process that occurs after spontaneous circulation is restored and is closely associated with prognosis in patients with cardiac arrest (CA). Brain injury, myocardial dysfunction, systemic ischemia and/or reperfusion injury, as well as unmitigated pathological conditions that cause or promote CA and multiorgan failure, contribute to increased mortality. Among them, myocardial injury is considered one of the most important immediate causes of death[1]. The factors that lead to myocardial injury after resuscitation are highly complex, and the amelioration of microcirculation dysfunction and recovery of cardiac function are important influences on patient prognosis after cardiopulmonary resuscitation (CPR) [2]. Perturbed microcirculation continues to worsen after the recovery of spontaneous circulation (ROSC) [3], and the use of high dose vasoconstrictor drugs to maintain hemodynamic stability leads to further deterioration[4]. Nevertheless, the optimal treatment strategy for increase macrocirculation dysfunction to ultimately benefit patients with CA remains unknown. Anisodamine hydrobromide (654-1) inhibits the activation of the cholinergic anti-inflammatory pathway by blocking the M receptor. It also inhibits activation of the NF-κB signaling pathway, thus blocking excessive inflammatory responses and improving microcirculation. We designed this experiment to study the relationship between microcirculatory dysfunction and myocardial injury after CPR, as well as interventional methods and drugs that could restore microcirculation after resuscitation, to provide a theoretical basis for finding treatments that improve patient prognosis.
-
A total of 22 healthy Beijing Landrace pigs, 3–4 months of age, weighing 30 ± 1 kg, were purchased from the Beijing Registered Experimental Animal Center, with license number: SCXK 11-00-002. In this study, the use of laboratory animals followed the Capital Medical University's laboratory animal use management regulations and was approved by the Medical Ethics Committee of Beijing Chaoyang Hospital, which is affiliated with Capital Medical University. The entire experimental process was designed and executed in accordance with the international standard animal experiment Utstein-style guidelines[5].
-
The animals were fasted the night before surgery but were allowed to drink freely. Intramuscular injection of diazepam (30 mg, Jiangsu Enhua Pharmaceutical Co., Ltd.) together with intravenous injection of propofol (2.5 mg/kg, AstraZeneca) in the ear were performed to induce anesthesia and followed by administration of propofol 9 mg/(kg∙h) and fentanyl 4 μg/(kg∙h) (AstraZeneca) with a continual intravenous pump for maintenance. During the preparatory phase of the operation, if the heart rate of an experimental animal exceeded 120 beats/min and/or the aortic systolic pressure exceeded 120 mmHg, additional bolus injections of the anesthetic and analgesic doses were given. After anesthesia, each animal was placed in supine position on the operating table, and the limbs were tied and fixed. After tracheotomy, a tracheostomy cannula with a diameter of 7.5 F was inserted, and a ventilator (model Drager Evita 2 dura Dräger Medical and Safety Equipment Shanghai Co., Ltd.) was attached after intubation. The ventilator parameters were set to synchronized intermittent mandatory ventilation (SIMV)+preassure support ventilation (PSV) method, PSV 10 cm H2O, FiO2 21%, initial tidal volume 12 mL/kg, positive end-expiratory preassure (PEEP) 3 cm H2O, ventilation rate 12 times/min, and inhalation/expiration ratio 1:2.
-
After the skin on the animal’s chest area was prepared, electrode pads were attached and connected to an ECG monitor (model HP M1165, Hewlett-Packard Company) for monitoring of crucial signs. An end-tidal carbon dioxide pressure (ETCO2) detector (model Servo900c, Murrysville, USA) was attached between the tracheal intubation tube and the ventilator connector, and the ETCO2 was maintained between 35 and 40 mmHg by adjustment of the tidal volume.
-
Routine skin preparation and disinfection of the neck and right inguinal area were performed, followed by surgical separation of the right femoral artery, placement of a Pulsiocath PV2014L thermal catheter and attachment of a pressure transducer (model Deltran OR Pressure Transducers, UTAH Medical Products Co., Ltd.). The set-up used a PULSION PiCCO plus Monitor (model PULSIONCATH PV2015L20, PULSION Medical Systems AG, Germany) to monitor aortic blood pressure and mean arterial pressure (MAP) while drawing arterial blood. Surgery was performed to isolate the right internal jugular vein, insert a sheath tube for angiography with a diameter of 7 F, and connect the venous end of the PULSION PiCCO plus monitor to continuously monitor various hemodynamic parameters and use it as a central venous blood extraction channel. The right femoral vein was surgically separated, and a 7 F diameter angiographic sheath was placed as a channel for a bipolar temporary pacing electrode lead and for intravenous fluid administration in the right ventricle. Arterial blood and central venous blood were collected for immediate blood gas analysis (model GEM Premier 3000 blood gas analyzer, IL Laboratory Instrument Company, USA), whereas the remaining venous blood sample was centrifuged (4,000 rpm, 15 min, room temperature) and stored in a low-temperature refrigerator at −80 °C for later use.
-
After successful surgical catheterization, the experimental animals were observed for 60 min. Ventricular fibrillation was induced after the physiological indicators stabilized, and physiological data, hemodynamic data and blood samples at baseline were collected. The bipolar temporary pacing electrode lead in the right ventricle was connected to an external physiological and pharmacological experiment multi-purpose instrument (model SA-JL-D, Jiangsu Cylons Biotechnology Co., Ltd.) by using esophagus output S1S2 (300/200 ms) mode with an 8:1 ratio, and applying continuous electrical stimulation with a step length of −10 ms until ventricular fibrillation occurred. Ventricular fibrillation was operationally defined as a sharp decrease in arterial blood pressure together with the presence of a ventricular fibrillation waveform on the electrocardiogram[5]. After successful modeling, the time was recorded, and no intervention for ventricular fibrillation was performed for 8 min[6], during which mechanical ventilation was stopped. After 8 min, defibrillation (4 J/kg) was immediately instituted, and chest compressions were performed at a compression speed of at least 100 times per minute, with a compression depth of 1/3 of the anteroposterior diameter of the thorax. Simultaneously, a simple ventilator was used to assist with ventilation at a frequency of 1 breath every 6 s. Chest compression was continued for 2 min per cycle, after which the ECG waveform was analyzed. If ventricular fibrillation remained present, the chest compressions were resumed after the shock and defibrillation. If spontaneous circulation was not restored after 4 min of CPR, 0.02 mg/kg of epinephrine was diluted through the central vein and intravenously administered until the ROSC or resuscitation failure.
The time required for resuscitation, the doses of drugs used, the number of defibrillations conducted, ROSC time, observed complications and other relevant data were recorded. ROSC was defined by an aortic systolic pressure ≥ 50 mmHg or MAP > 30 mmHg for more than 10 min. If a pig did not regain spontaneous circulation after 30 min, it was declared dead[7]. A Philips HeartStart MRx defibrillation monitor with Q-CPR technology was used to control the frequency of extracardiac compressions (100 ± 10 times/min), compression depth and chest rebound to achieve the standard CPR quality required by the guidelines and minimize the effects of resuscitation quality on the experimental results.
-
The experimental animals were randomly divided into three groups. Of the 22 experimental animals (male-to-female ratio of 1:1.5), six were assigned to the sham operation group (S group, n = 6) in which only a catheter was placed. The 16 experimental animals that achieved successful ROSC were randomly divided into a ventricular fibrillation control group (VF-C group, n = 8), which received routine fluid resuscitation and vasoactive drugs to maintain a MAP > 90 mmHg, and a 654-1 intervention group (VF-I group, n = 8), which was given 654-1 (4 mg/kg) intravenous infusion for approximately 1.5 h starting 0.5 h after ROSC, in addition to routine fluid resuscitation and vasoactive drugs to maintain a MAP > 90 mmHg.
Blood test indicators and methods: Arterial blood and mixed venous blood were collected at baseline, immediately after ROSC, and 30 min, 1 h, 2 h, 4 h and 6 h after ROSC. The oxygenation index was measured with a blood gas analyzer (GEM Premier 3000, America) (OI), as well as the respiratory index, oxygen delivery, blood lactic acid, partial pressure of venous-arterial carbon dioxide (Pv-aCO2), and venous oxygen saturation (ScvO2), whereas the animal’s lung compliance (Cdyn) and airway resistance (Raw) were monitored simultaneously with Pulse index Continuous Cardiac Output (PiCCO). The instrument directly monitored and recorded the Cardiac output (CO), cardiac index (CI), stroke volume variation (SVV), dpmx, extravascular lung water index and pulmonary vascular permeability index of the experimental animals. The venous blood specimens were centrifuged (4,000 rpm, 15 min, room temperature) and stored in a refrigerator at −80 °C. Levels of syndecan-1 and TNF-α in the specimens were subsequently detected with an enzyme-linked immunosorbent assay (Cloud-Clone, catalog number: SEB966Po96T) kit purchased from Abcam. The detection steps were performed according to the kit’s operating instructions.
Tissue detection indicators: The animals were sacrificed 6 h after ROSC. Deep anesthesia was induced with 60 mg propofol injected intravenously, which was followed by 30 mL intravenous potassium chloride (10 mmol/L). The myocardial tissue was immediately harvested, and a left ventricular tissue specimen was collected and fixed in 10% formaldehyde and 4% paraformaldehyde solution, in preparation for histologic examination of H&E-stained sections and ultrastructural examination of the tissue through transmission electron microscopy. The rest of the left ventricular tissue was immediately immersed in liquid nitrogen, then quickly transferred for storage at −80 °C. Enzyme-linked immunosorbent assays were subsequently conducted to detect the levels of syndecan-1 and TNF-α in the specimens.
Visceral microcirculation monitoring: Sidestream dark field (SDF) imaging technology was used to monitor the microcirculatory status of the experimental animals. A MicroSee (Guangzhou Yiruan Intelligent Technology Co., Ltd., model T200) instrument was used, with the probe placed in the mesentery of the experimental animal's ileocecal area. The following time points were selected for monitoring microcirculatory status at the visceral microcirculation monitoring sites: baseline, ROSC, and 1 h, 2 h, 4 h, and 6 h thereafter. Each time a measurement was performed, three video recordings were made at different positions of the selected microcirculation monitoring site, with each position recorded for at least 15 s. The video was analyzed in professional software to document changes in small blood vessels (blood vessels with a diameter < 20 µm). Semi-quantitative characteristics of blood flow, including no flow (0), intermittent flow (1), slow flow (2) and continuous flow (3), as well as microcirculation flow index (MFI), total vessel density (TVD), perfusion, and other parameters such as the ratio of blood vessels (PPV), De-Backer score and perfusion vessel density (PVD) were documented. Because the heartbeat precludes use of SDF to directly observe the cardiac microcirculation, we indirectly simulated the visceral microcirculation and myocardial microcirculation by monitoring the microcirculation at the mesentery in the experiments[2].
-
Statistical data are expressed as mean ± standard deviation (
$\bar{\chi} \pm SD$ ). For continuous variables such as respiratory parameters, hemodynamic indicators and blood gas analysis indicators, repeated measurements and multi-factorial analysis of variance were used to compare other variables (such as the success rate of resuscitation) The chi-square test was also used. The data were processed in SPSS 11.5 statistical software (Inc, Chicago, IL, USA), with P < 0.05 indicating a significant difference and P < 0.01 indicating a highly significant difference. -
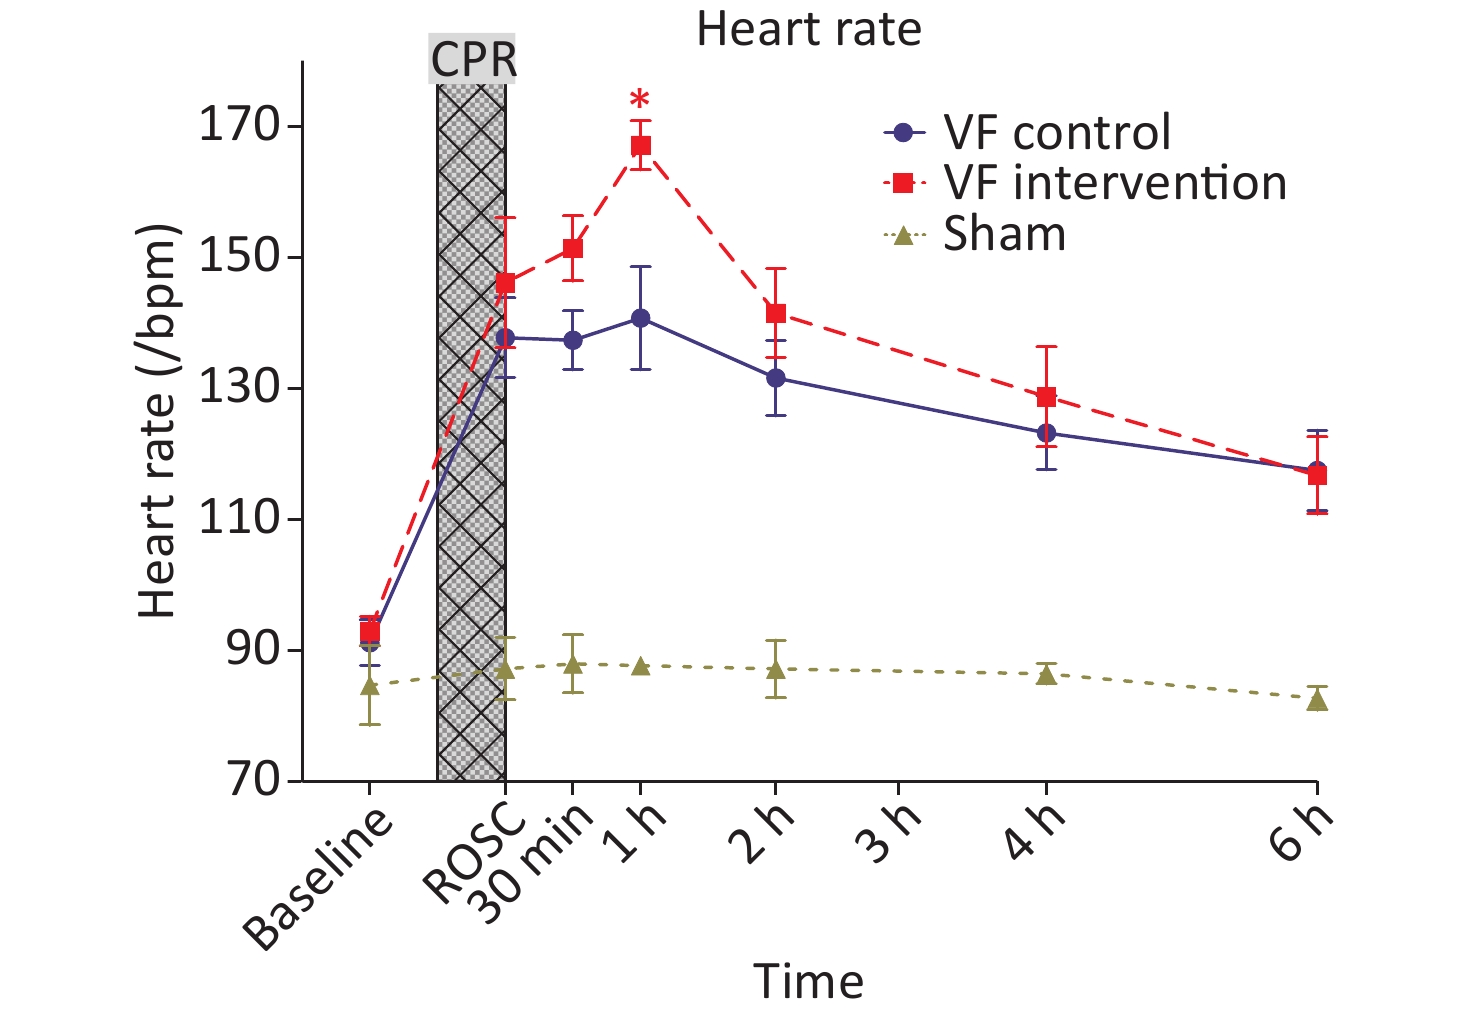
No significant differences were observed in the body temperatures of animals in the S group, VF-C group and VF-I group at each time point (Table 1). At a MAP > 90 mmHg, the heart rates of the animals in the VF-C group and VF-I group after ROSC were significantly higher than those in the S group. The heart rates in the two groups of animals reached their peak 1 h after ROSC and then decreased over time. At 6 h after ROSC, these values remained significantly higher than those in the S group.
Item Baseline ROSC immediate ROSC 30 min ROSC 1 h ROSC 2 h ROSC 4 h ROSC 6 h Sham operation 35.97 ± 1.11 36.30 ± 0.67 36.48 ± 0.33 36.55 ± 0.42 36.75 ± 0.33 36.58 ± 0.64 36.67 ± 0.52 VF control 35.65 ± 1.36 35.91 ± 1.17 36.55 ± 1.63 36.54 ± 1.69 36.85 ± 2.03 36.58 ± 2.50 36.49 ± 2.46 654-1 group 36.75 ± 1.54 36.11 ± 1.36 35.98 ± 1.85 36.29 ± 1.88 35.90 ± 1.97 35.91 ± 2.21 35.40 ± 2.48 Note. The unit is degrees Celsius. ROCS, recovery of spontaneous circulation. Table 1. Comparison of the body temperatures of the three groups of animals at different time points
At 0.5 h after ROSC, the VF-I group began to receive 654-1 intravenously, and the infusion lasted approximately 1.5 h. The heart rates of animals in the VF-I group were significantly higher than those in the VF-C group at 1 h after ROSC (0.5 h after medication); the heart rates then decreased starting 2 h after ROSC. From baseline until 6 h after ROSC, the heart rates in the VF-I group did not significantly differ from those in the VF-C group (Figure 1).
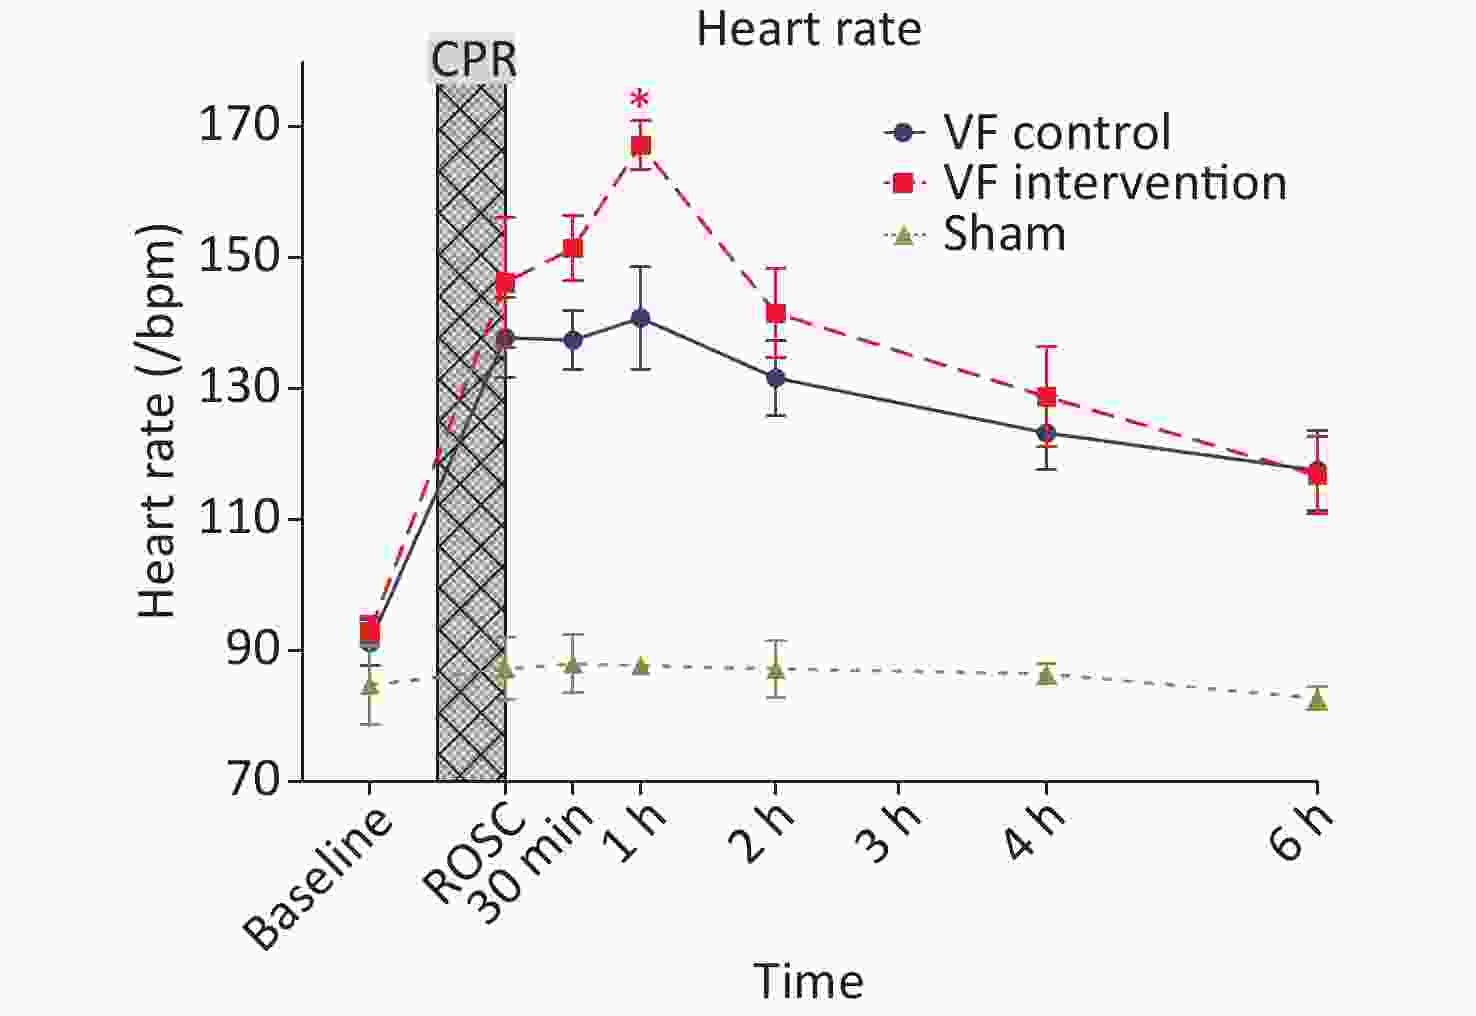
Figure 1. Comparison of the heart rates in the three groups of animals at different time points. The yellow curve represents the S group, the blue curve represents the VF-C group, and the red curve represents the VF-I group, *P < 0.05. The heart rates in the post-ROSC VF-C group and the VF-I group were significantly higher than those in the S group, reaching a peak at 1 h after ROSC. These rates remained significantly higher than those in the S group at 6 h after ROSC. The VF-I group began to receive 654-1 at 0.5 h after ROSC, and the infusion time was approximately 1.5 h. The heart rates in the VF-I group were significantly higher than those in the VF-C group at ROSC 1 h (0.5 h after medication). From 2 h after ROSC (1.5 h after medication) to 6 h after ROSC, the heart rates in the VF-I group did not significantly differ from those in the VF-C group. ROSC, return of spontaneous circulation; CPR, cardiopulmonary resuscitation.
-
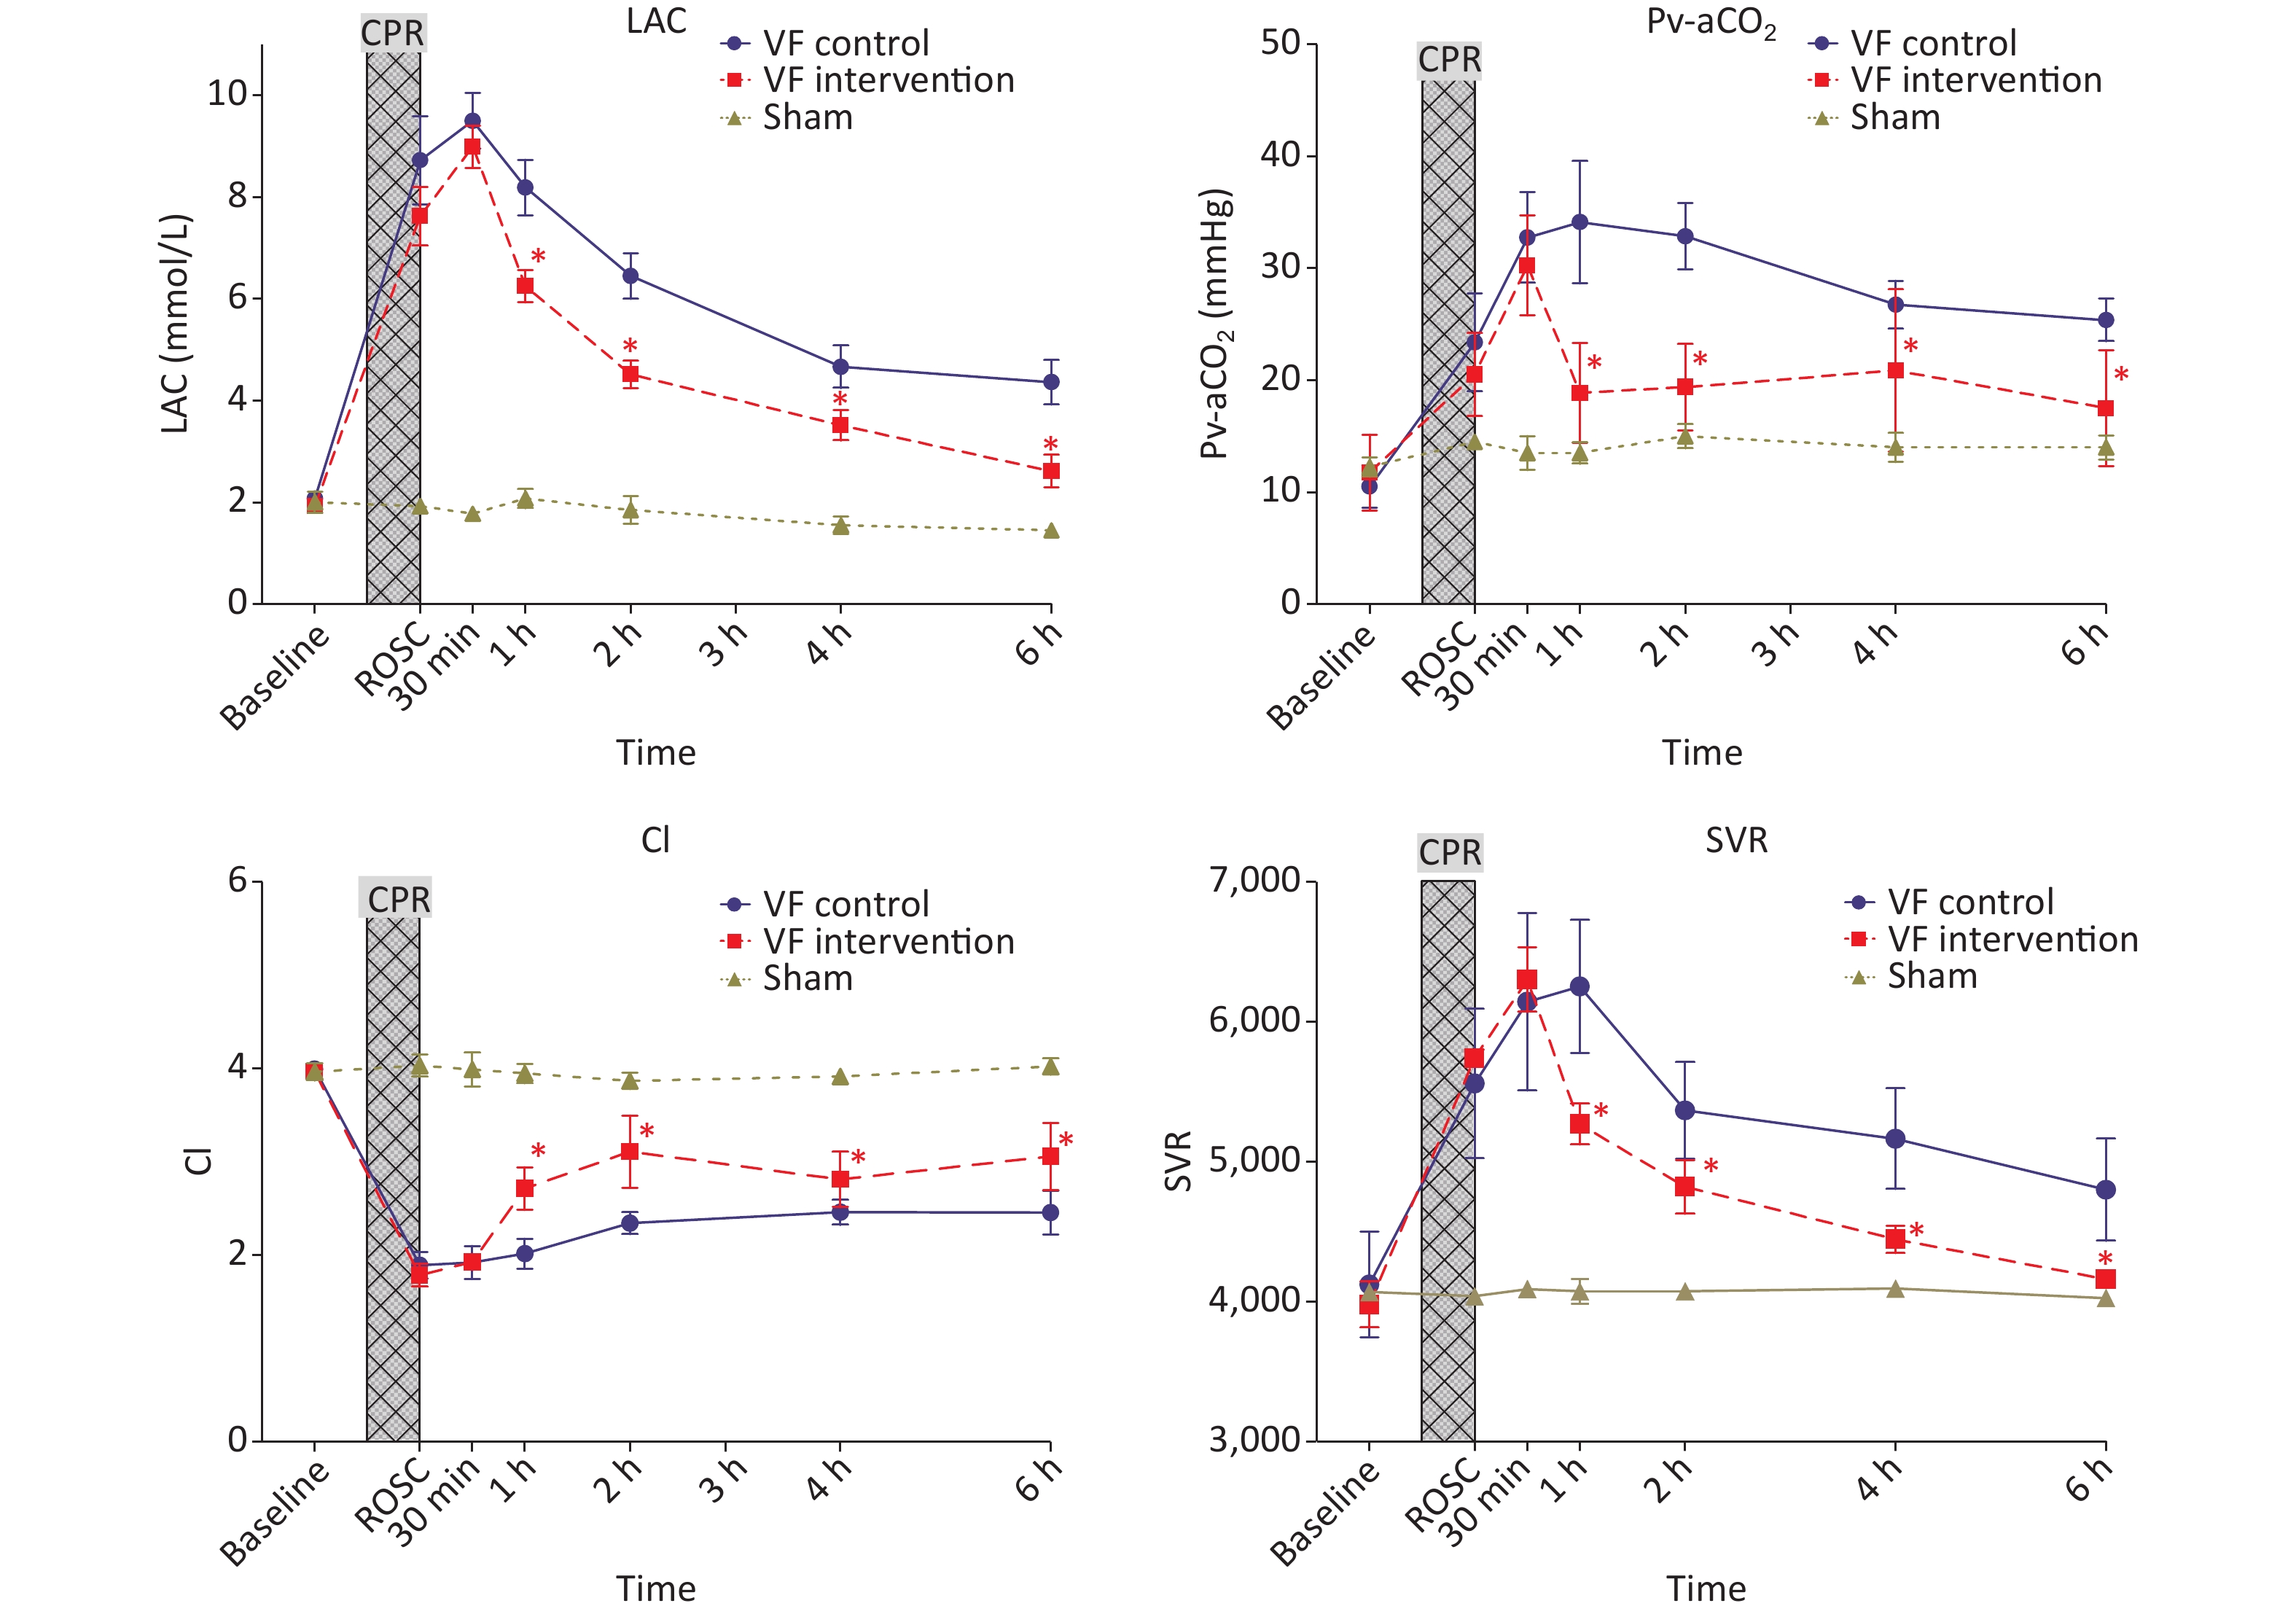
No significant difference was observed in Pv-aCO2 and lactic acid levels among the S groups, VF-C group and VF-I group at baseline and immediately after ROSC. However, at various time points after ROSC, the levels of Pv-aCO2 and lactic acid in the VF-C group were significantly higher than those in the S group. Pv-aCO2 peaked at 1 h after ROSC, then slowly decreased until 6 h after ROSC but remained significantly higher than that in the S group. Lactic acid peaked at 0.5 h after ROSC. Although it decreased significantly afterward, it remained significantly higher than that in the S group at 6 h after ROSC.
The Pv-aCO2 level in the VF-I group decreased rapidly at 0.5 h after ROSC after 654-1 administration and was significantly lower than that in the VF-C group at 1 h ROSC. It was also significantly lower than that in the VF-C group at each subsequent time point. No significant difference was observed with respect to that in the S group. After initiation of the 654-1 intervention, the blood lactic acid level also changed rapidly. At 1 h after ROSC and various time points thereafter, the indicators in the VF-I group were significantly lower than those in the VF-C group.
The cardiac ejection capacity of experimental animals significantly decreased after ROSC. The cardiac index (CI) in the VF-C group and VF-I group was significantly lower than that in the S group, and this effect persisted until 6 h after ROSC. However, the VF-I group began to receive 654-1 0.5 h after ROSC, and the CI was significantly higher than that in the VF-C group at each subsequent time point, although it remained lower than that in the sham operation group.
The small vessel resistance (SVR) of experimental animals in the VF-C group and VF-I group after ROSC was significantly higher than that in the S group. The SVR level in the VF-C group peaked 1 h post-ROSC, then slowly decreased, and remained significantly higher than that in the S group 6 h after ROSC. The SVR in the VF-I group did not differ from that in the VF-C group at the time of ROSC until 0.5 h afterward, but after administration of 654-1 at 0.5 h, the SVR level was significantly lower than that in the VF-C group; the SVR level was not significantly different from that in the S group at 6 h after ROSC (Figure 2).
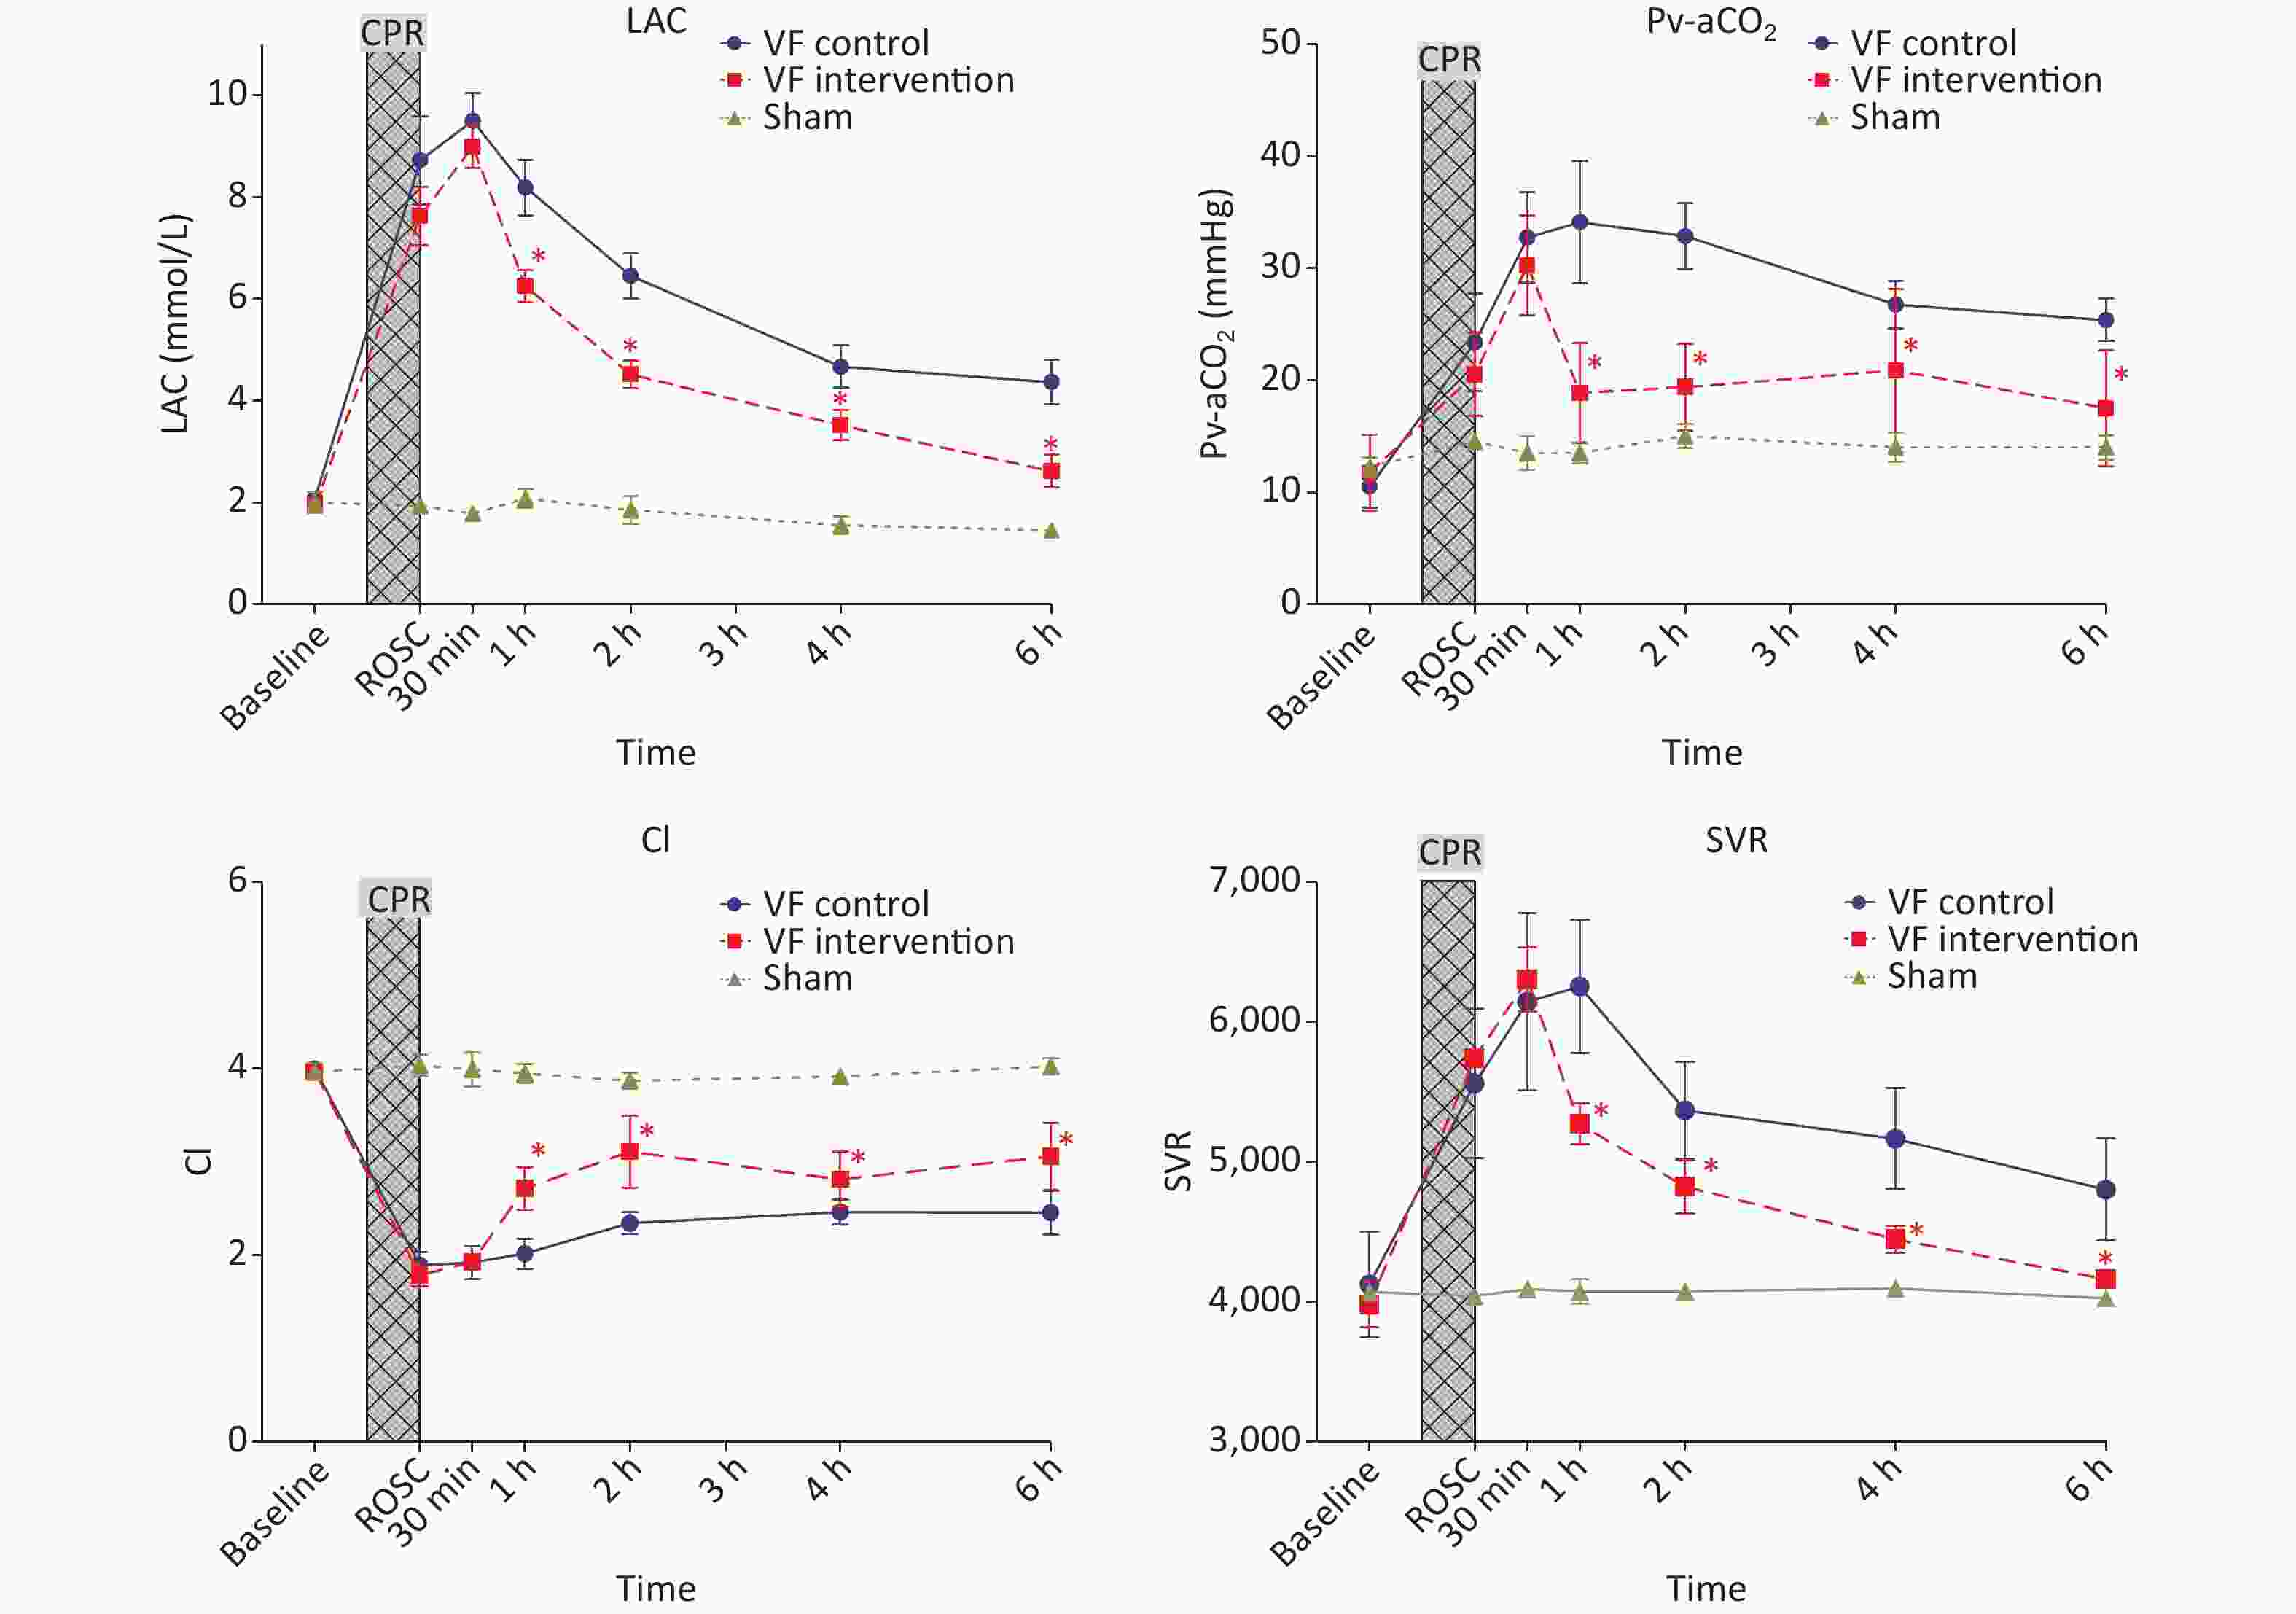
Figure 2. Comparison of lactic acid levels, Pv-aCO2, CI and SVR indicators at different time points in the three groups of animals. The yellow curve represents the S group, the blue curve represents the VF-C group, and the red curve represents the VF-I group, *P < 0.05. At various time points after ROSC, the levels of Pv-aCO2 and LAC in the VF-C group were significantly higher than those in the S group, then slowly decreased thereafter. These levels remained significantly higher than those in the S group at 6 h ROSC. After administration of 654-1, the blood lactic acid level and Pv-aCO2 were significantly lower than those in the VF-C group. The ejection capacity of the heart after ROSC was significantly diminished and remained significantly lower than that in the S group 6 h after ROSC. After administration of 654-1, the CI at each time point was significantly higher than that in the VF-C group but remained lower than that in the S group, whereas the SVR level was significantly lower than that in the VF-C group. No difference with respect to the S group was observed at 6 h ROSC. CPR, cardiopulmonary resuscitation; ROSC, return of spontaneous circulation; CI, cardiac index; SVR, small vessel resistance; LAC, Lactic acid.
-
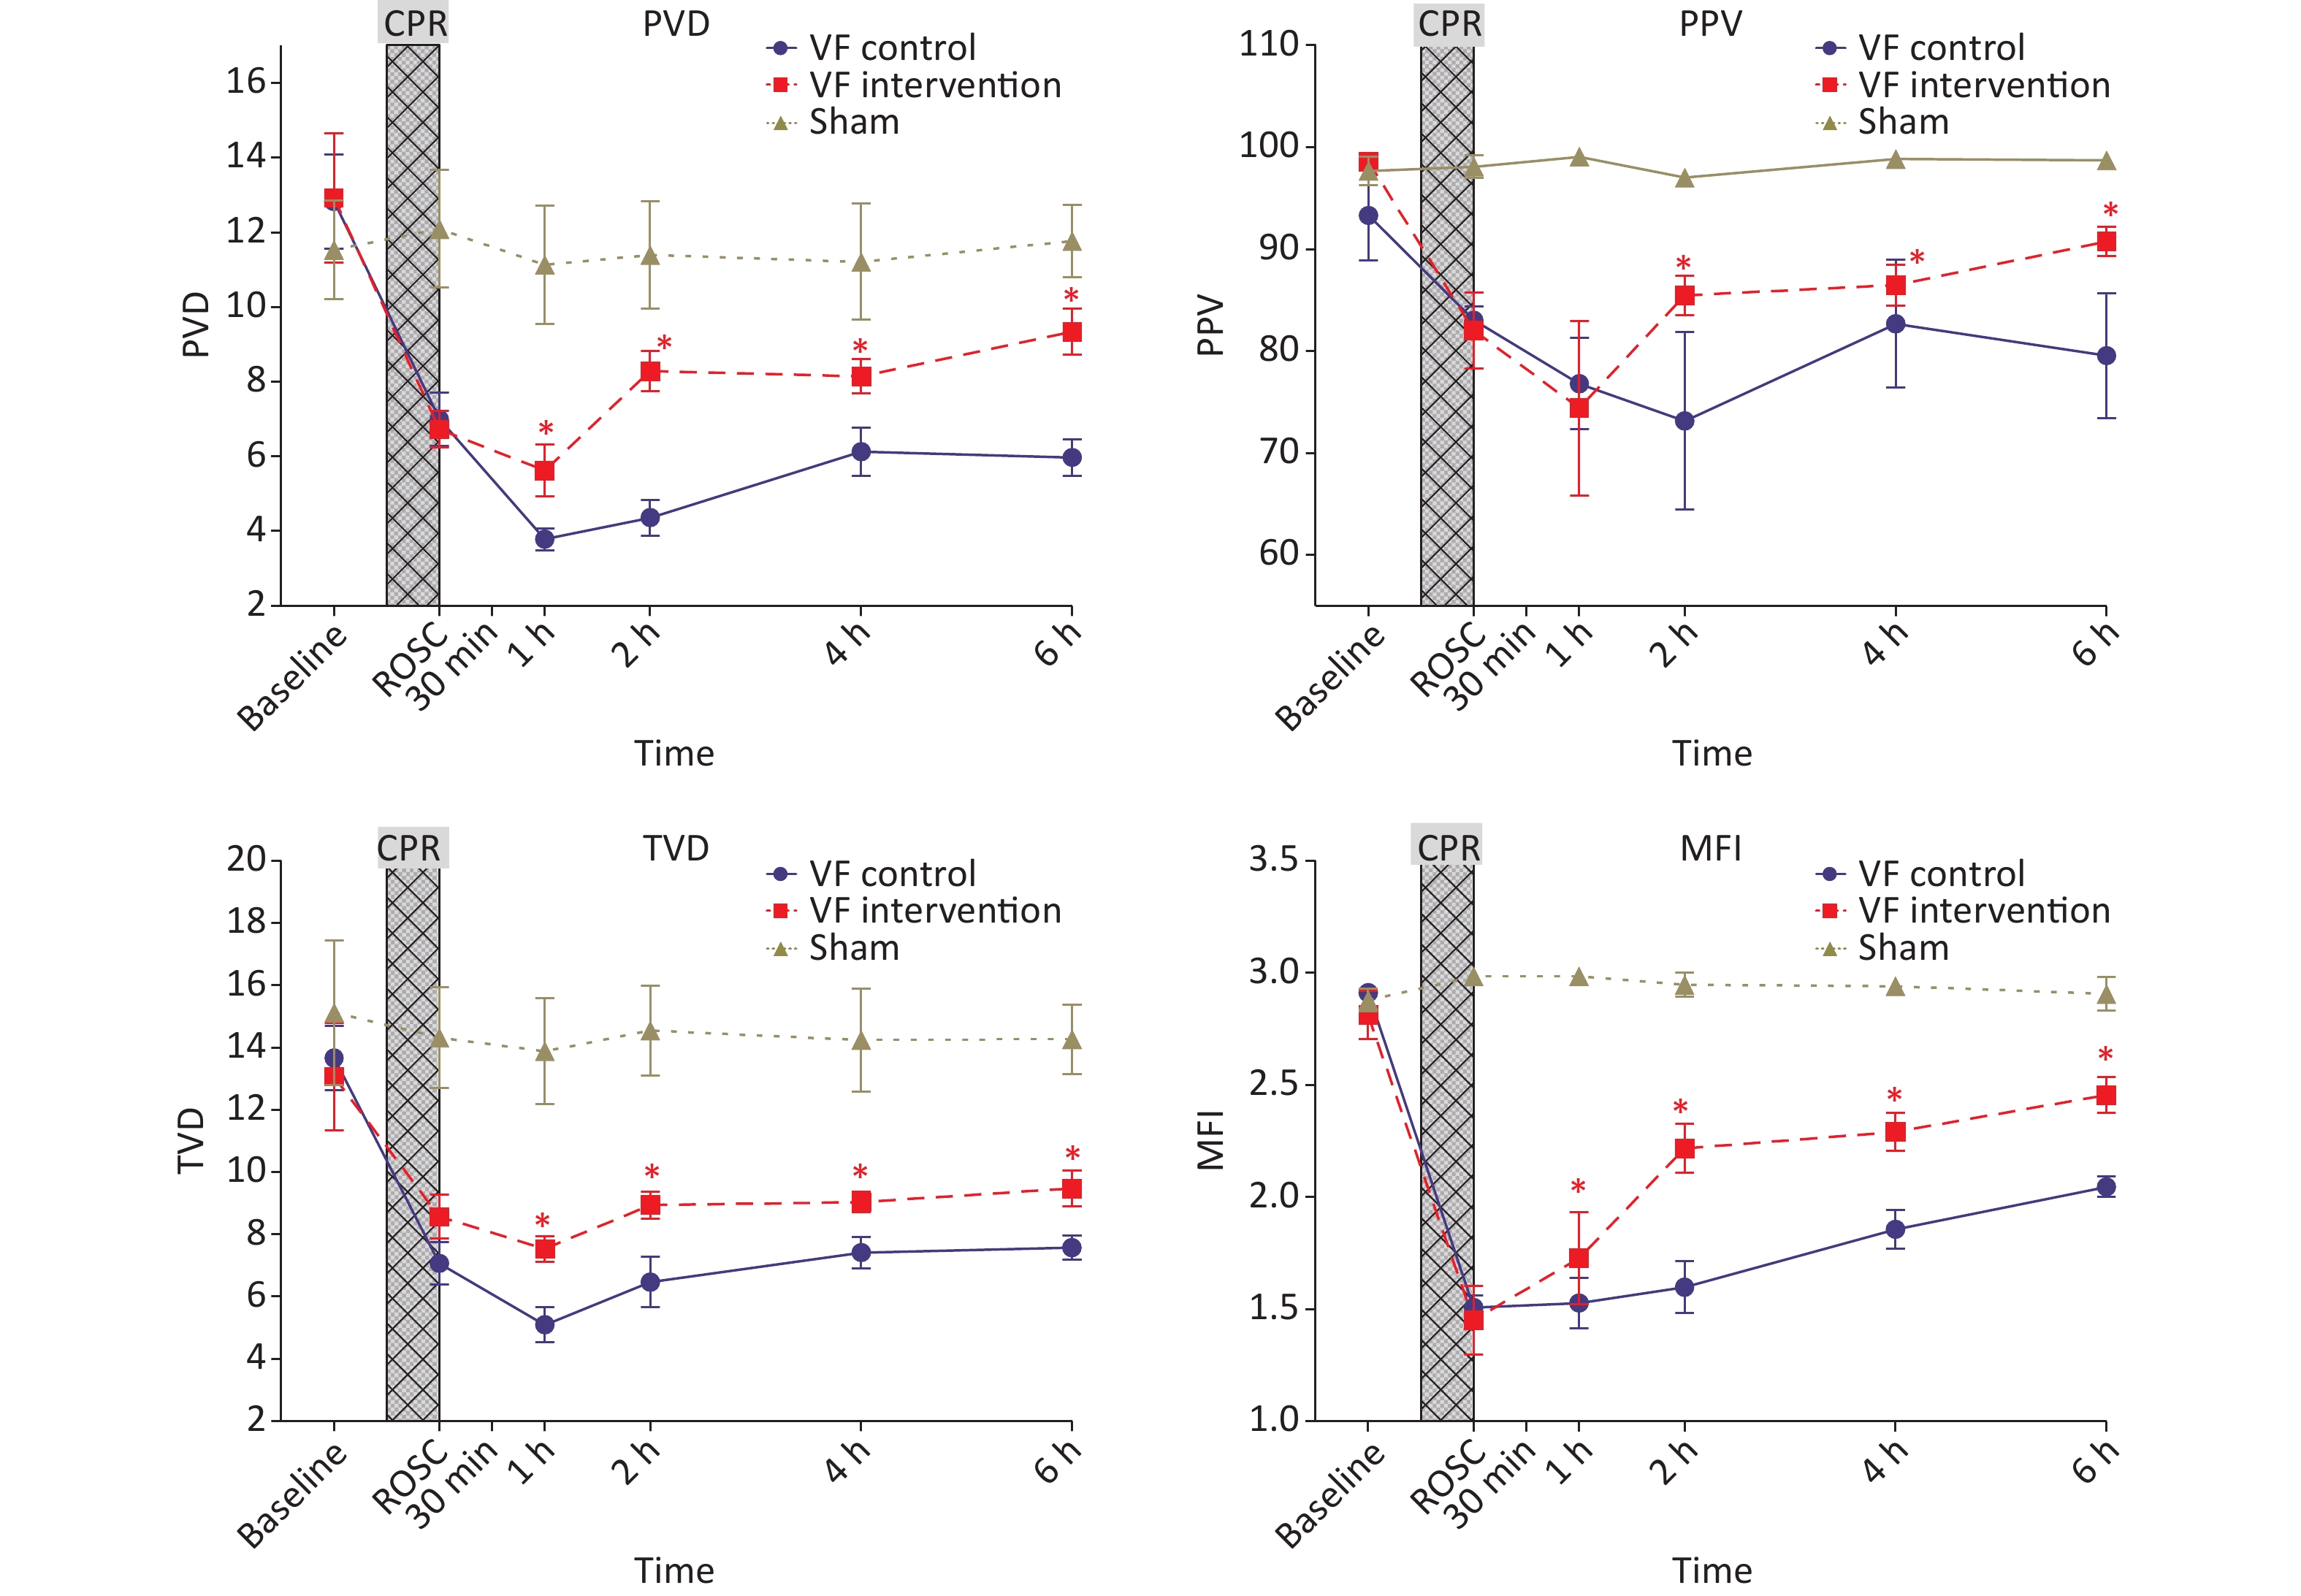
At baseline, the visceral microcirculation monitoring parameters in the three groups of experimental animals, including MFI, TVD, PPV and PVD, showed no significant differences. Although the experimental animals maintained a MAP > 90 mmHg after ROSC, no significant difference was observed with respect to the S group values, although the microcirculation indices after ROSC remained significantly lower than those in the S group until 6 h after ROSC.
After the 654-1 intervention at 0.5 h after ROSC, the MFI, TVD, PPV and PVD in the VF-I group were significantly higher than those in the VF-C group at all subsequent time points, although they remained significantly lower than those in the S group at 6 h post-ROSC (Figure 3).
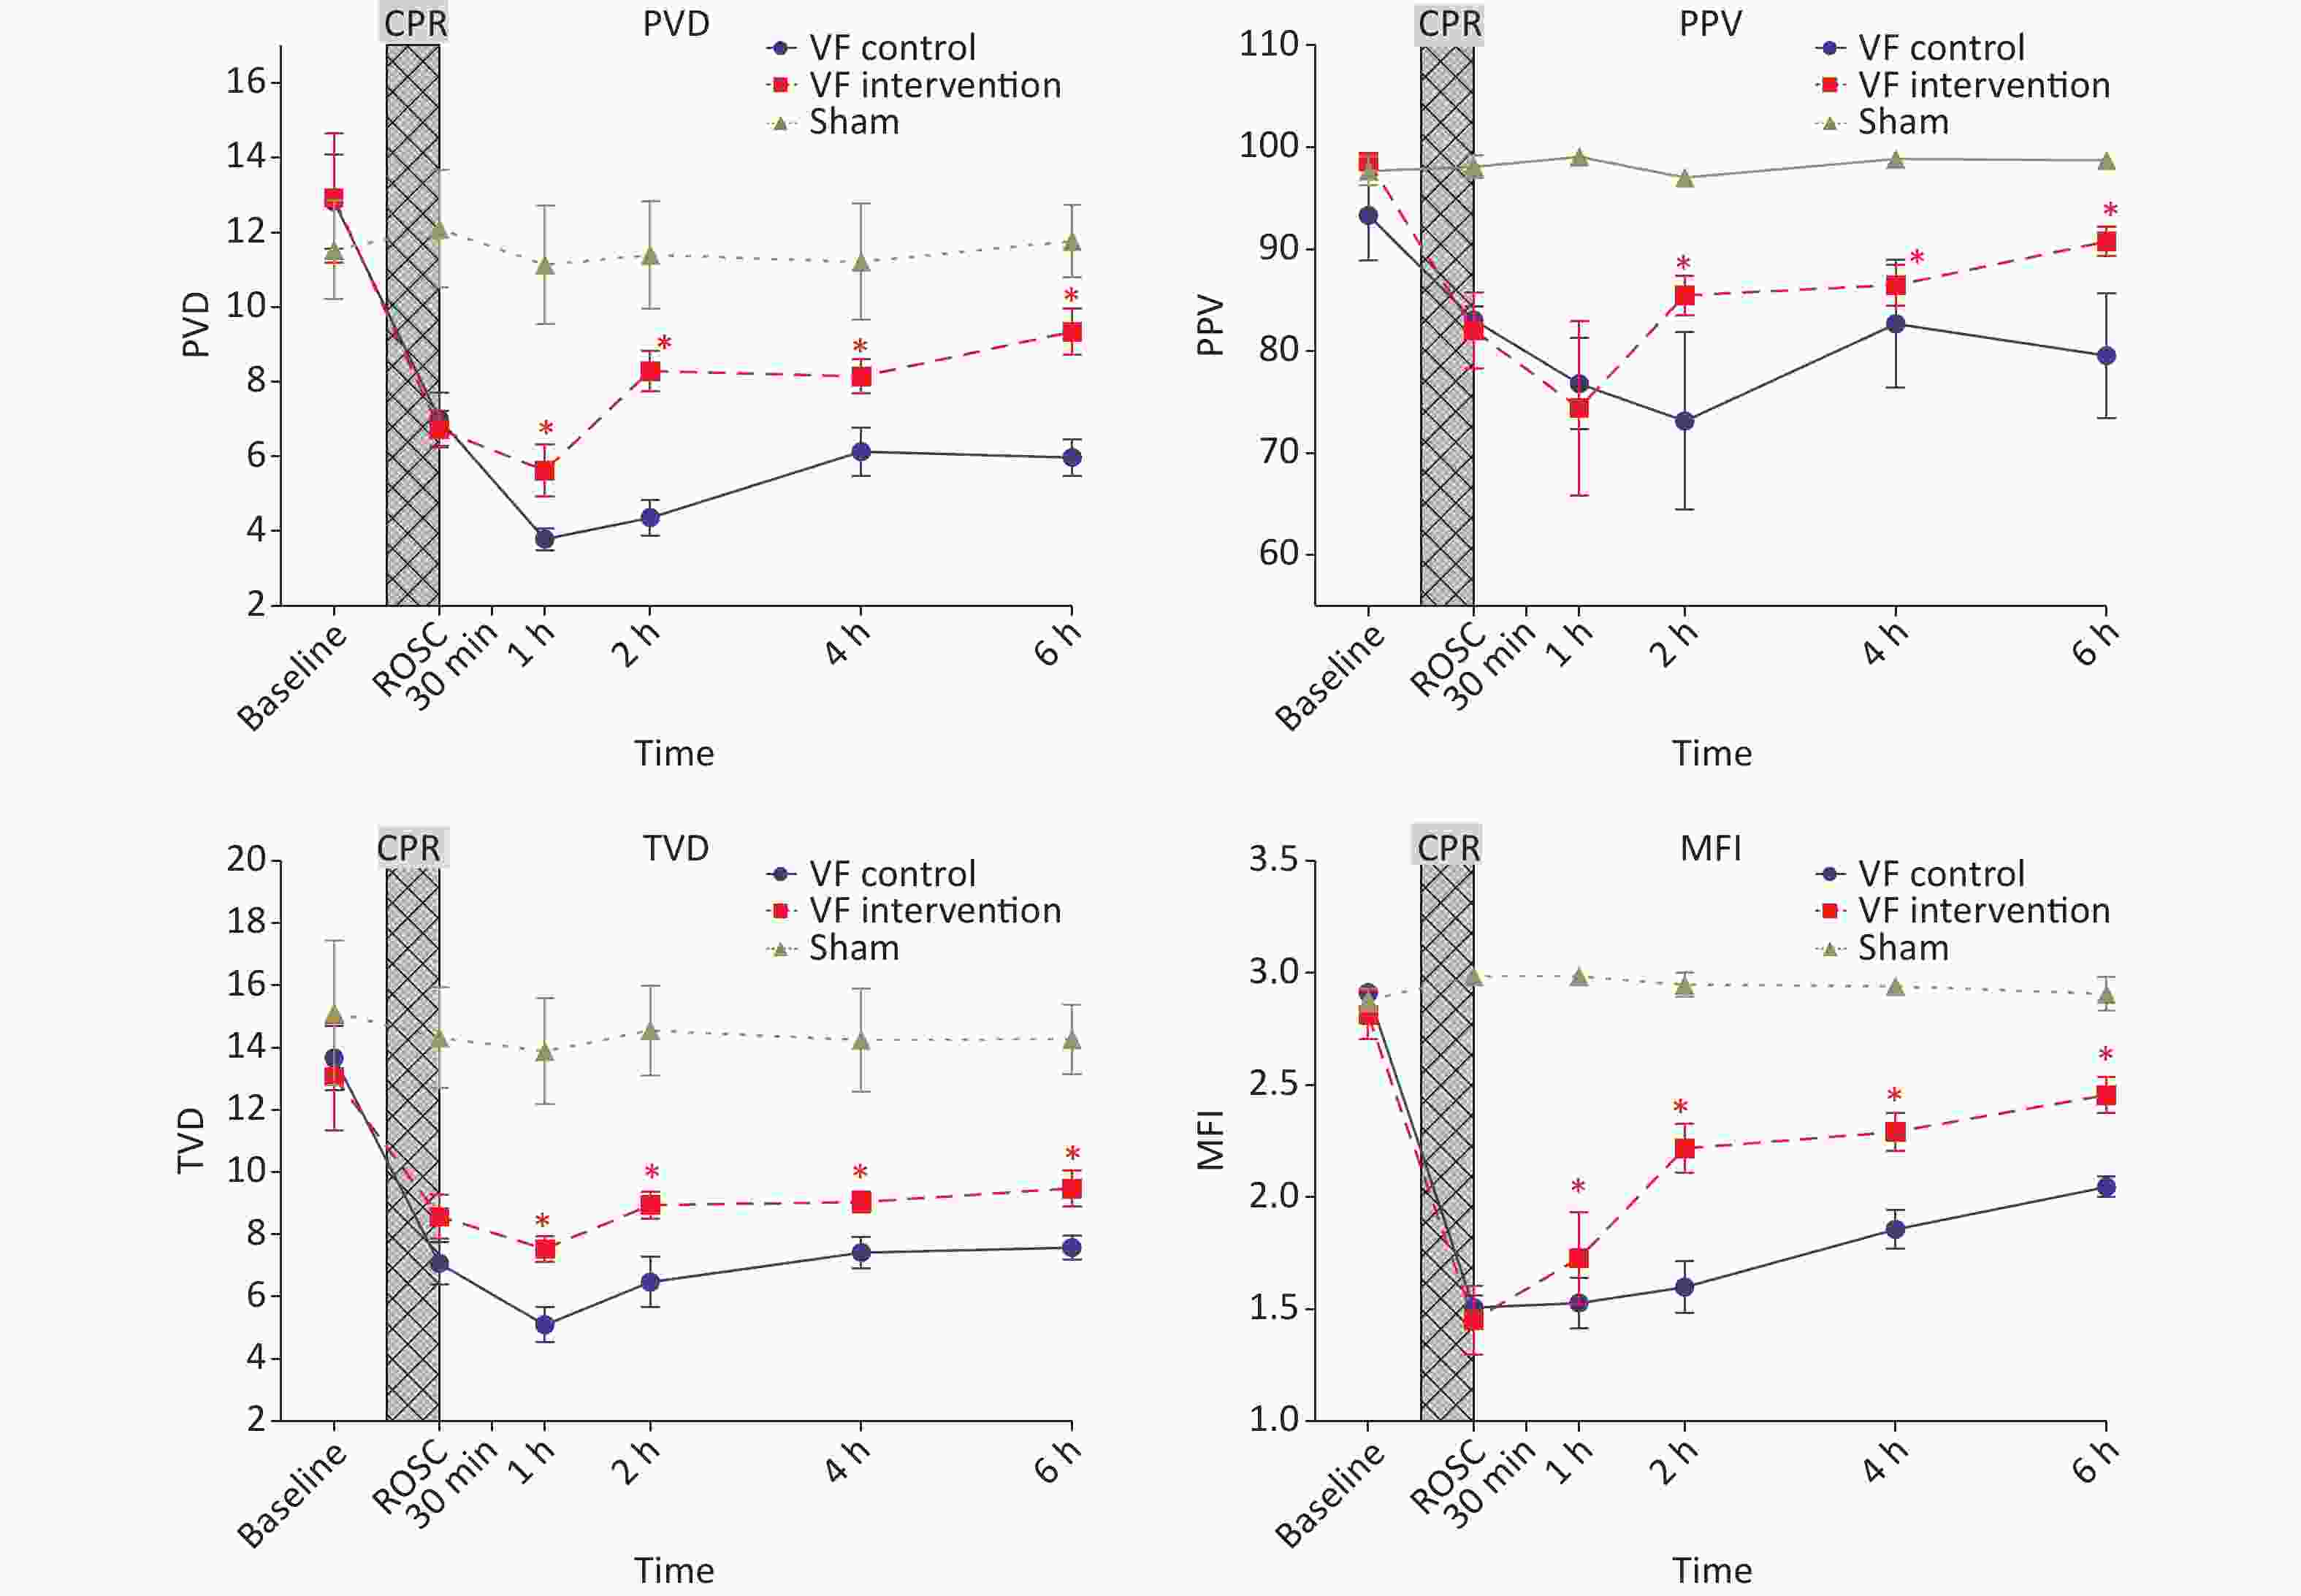
Figure 3. Comparison of microcirculation indices of the three groups of animals at different time points. The yellow curve represents the S group, the blue curve represents the VF-C group, and the red curve represents the VF-I group, compare VF-C and the VF-I group, *P < 0.05. After ROSC, the experimental animals maintained a MAP > 90 mmHg; however, the microcirculation indices (MFI, TVD, PPV and PVD) in the experimental group were significantly lower than those in the S group at ROSC and for 6 h thereafter. The MFI, TVD, PPV, and PVD after 654-1 intervention were significantly higer than those in the VF-C group at all subsequent time points, but remained significantly lower than those in the S group at 6 h after ROSC. MFI, microcirculation flow index; TVD, total vessel density. PPV, perfusion pressure of valve; PVD, perfusion vessel density; CPR, cardiopulmonary resuscitation; ROSC, return of spontaneous circulation.
-
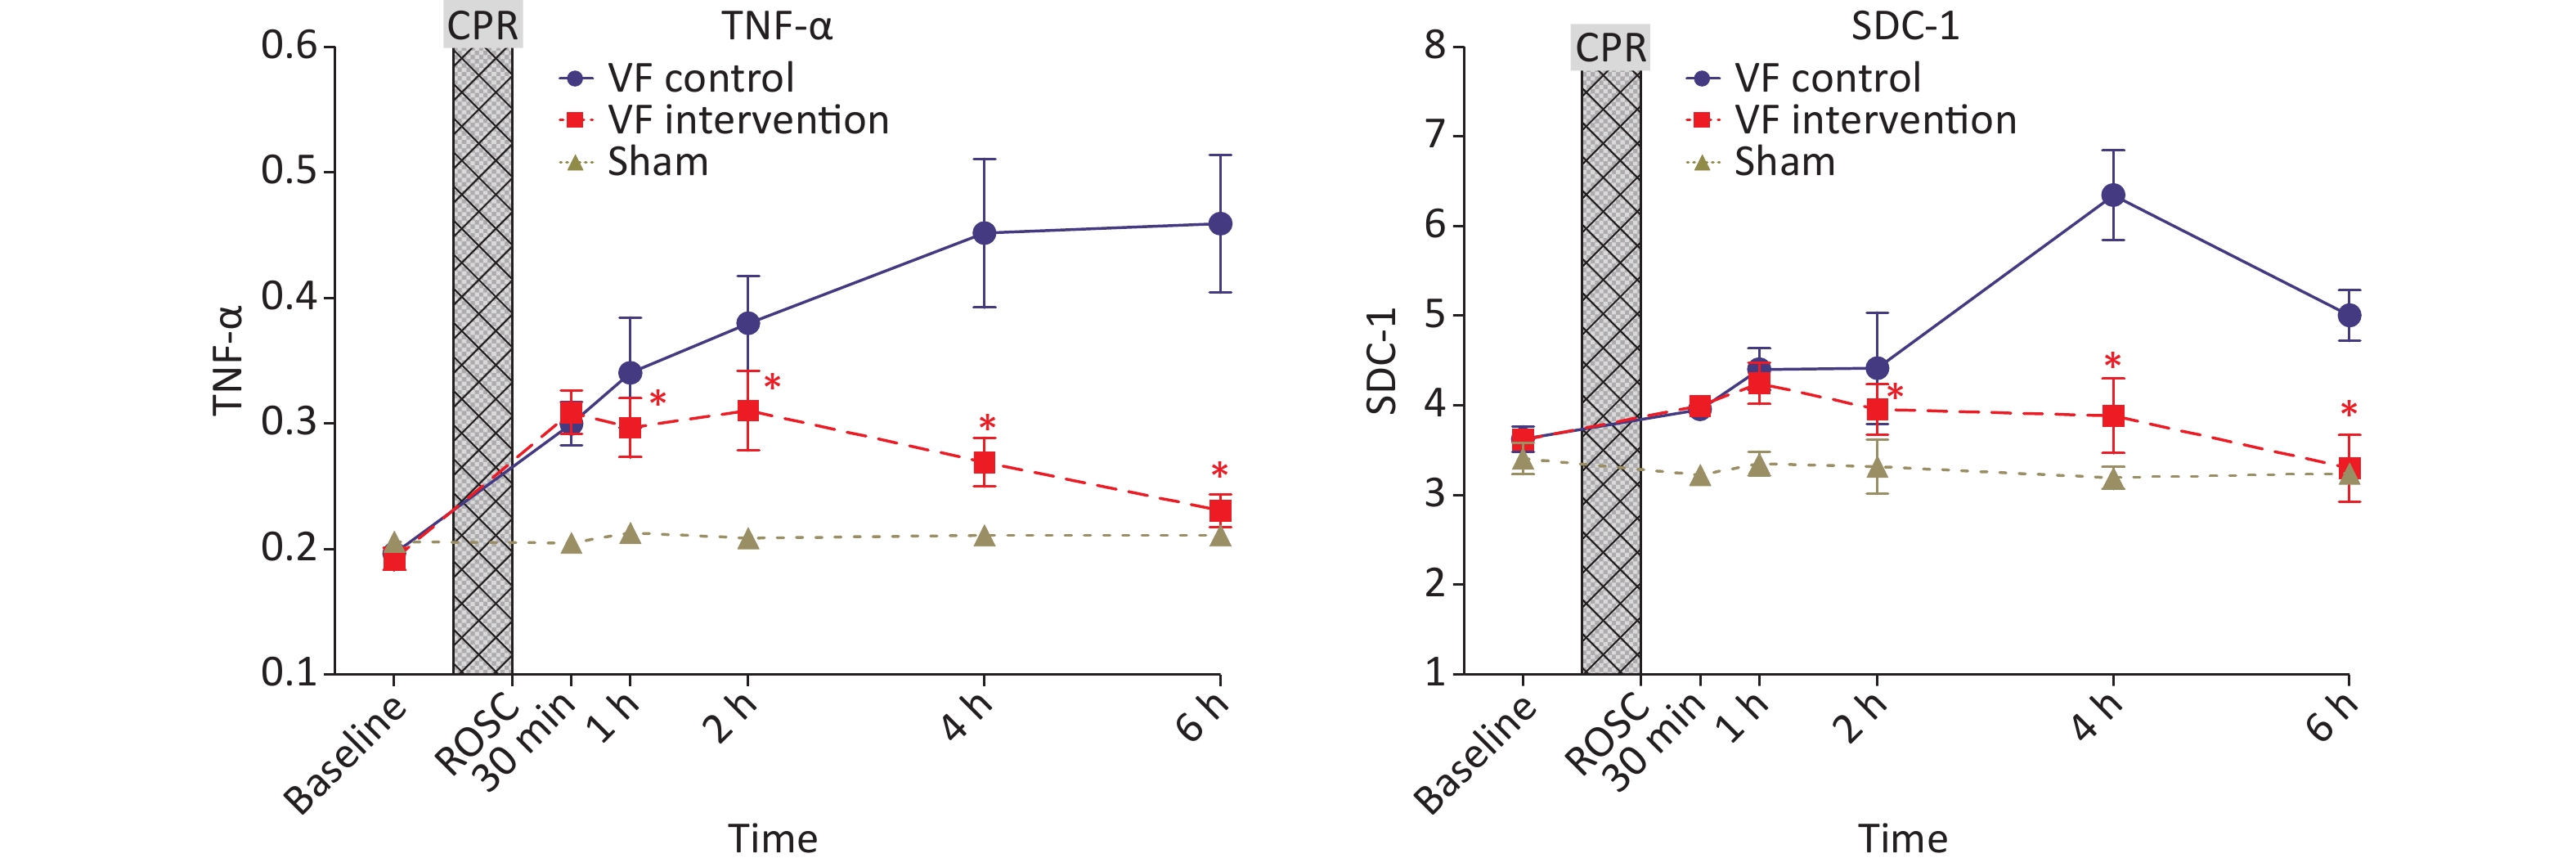
No significant differences were observed in TNF-α among the three groups of animals at baseline, and its level increased significantly after CPR. The level in the VF-C group remained significantly higher than that in the S group until 6 h after ROSC. The level in the VF-I group was higher than that in the S group at 1 h, 2 h, and 4 h after ROSC, but was significantly lower than that in the VF-C group. At 6 h after ROSC, no significant difference was observed with respect to the S group.
The SDC-1 of the three groups of animals showed no significant differences at baseline, and its level increased significantly after CPR. The VF-C group level peaked at 4 h after ROSC, then decreased thereafter, but remained significantly higher than that in the S group after 6 h. No significant difference was observed between the VF-I group and VF-C group at 1 h ROCS, and the level was significantly lower than that in the VF-C group at each subsequent time point. No significant difference was observed at 6 h after ROSC with respect to the S group (Figure 4).
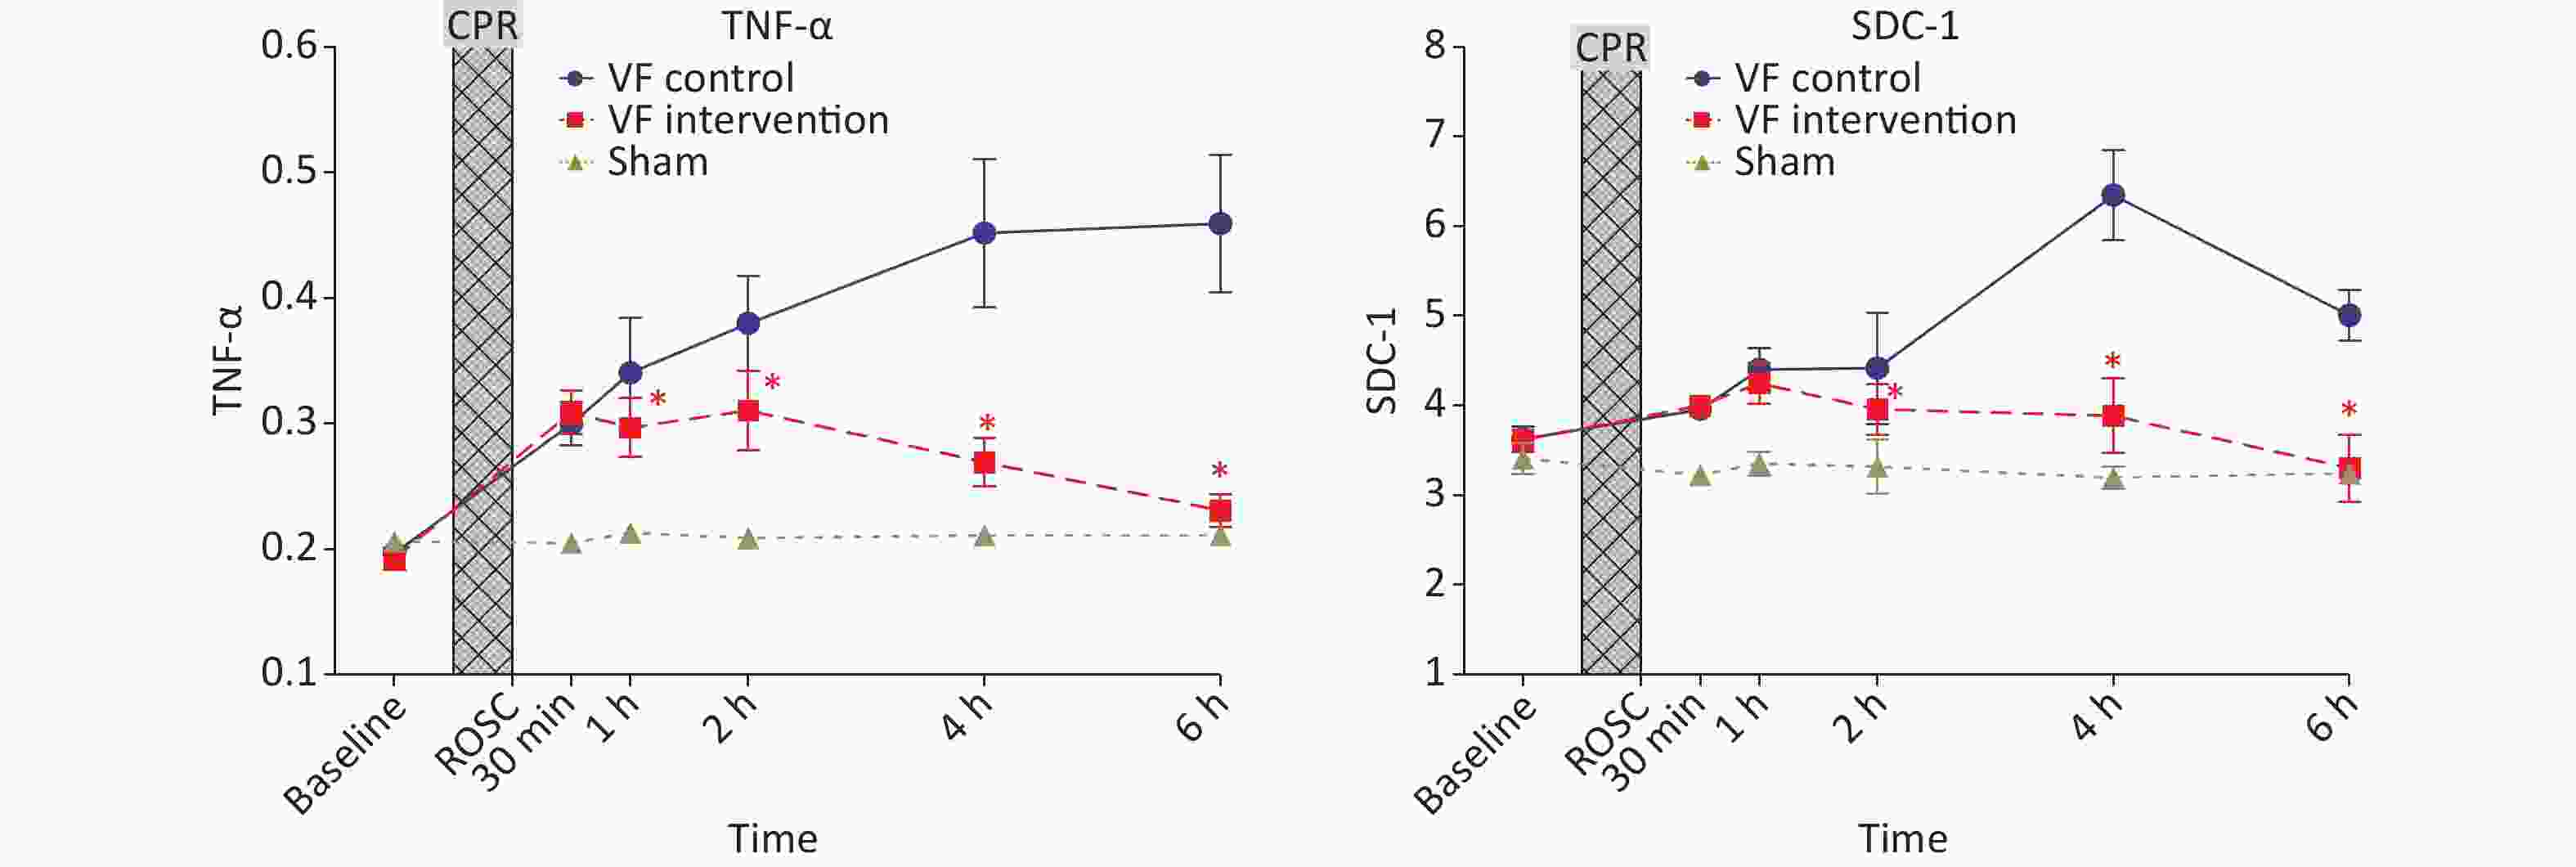
Figure 4. Comparison of TNF-α and SDC-1 levels in the three groups of animals at different time points. The yellow curve represents the S group, the blue curve represents the VF-C group, and the red curve represents the VF-I group, *P < 0.05. No significant difference was observed in the levels of TNF-α and SDC-1 in the three groups at baseline, and the levels significantly increased after ROSC. The VF-C group level was significantly higher than that in the S group at 6 h after ROSC. The levels of the two indicators were significantly lower than those in the VF-C group at simultaneous time points, and no significant difference with respect to the S group was observed at 6 h after ROSC. CPR, cardiopulmonary resuscitation; ROSC, return of spontaneous circulation.
-
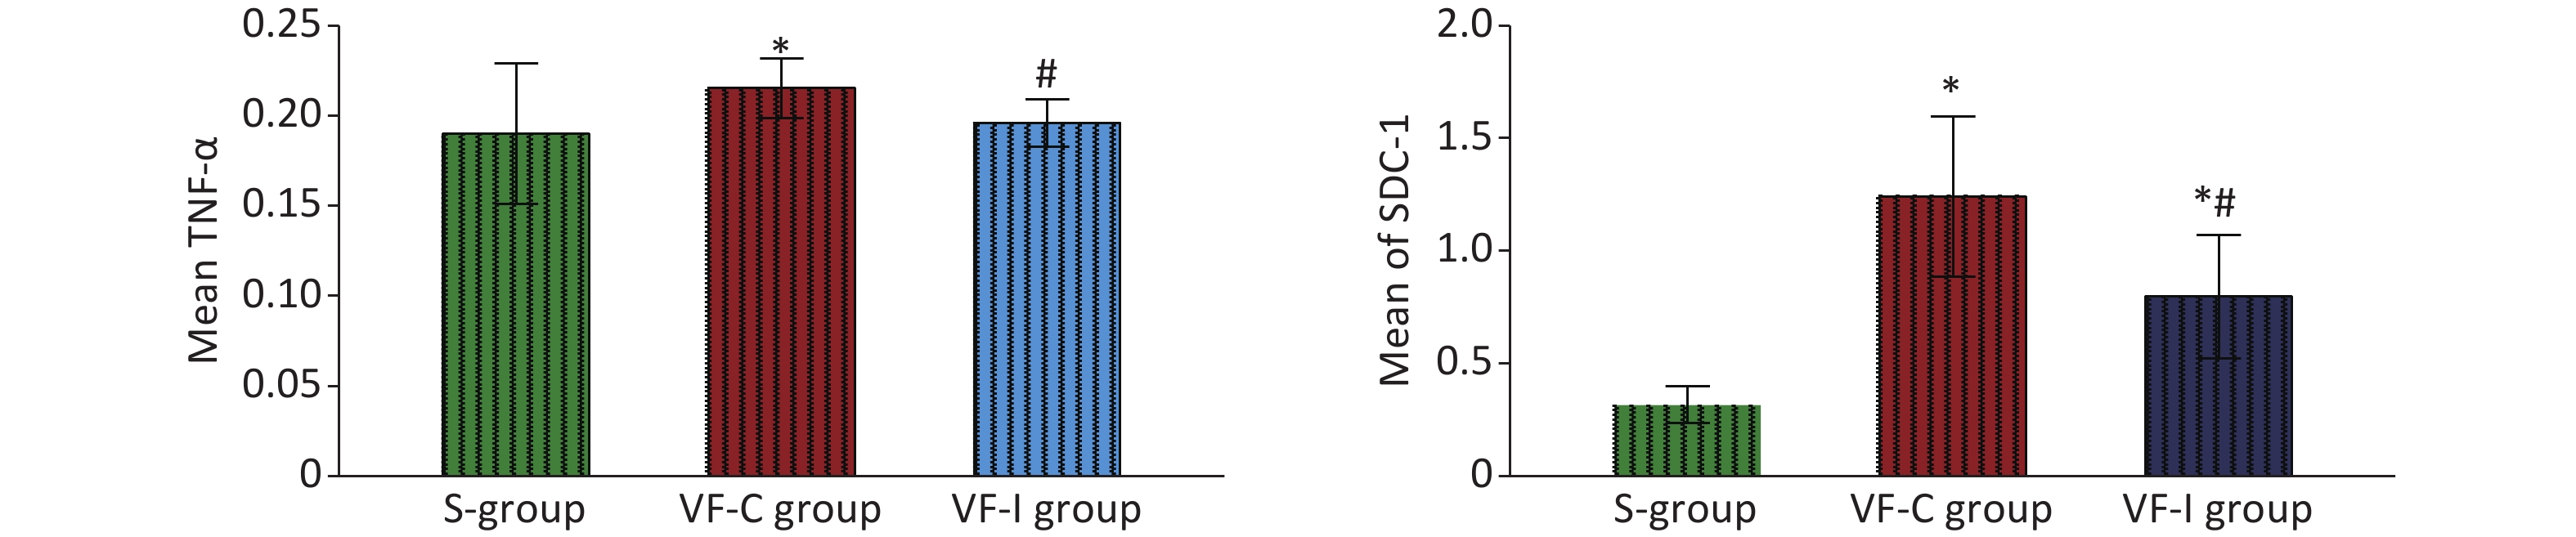
At 6 h post-ROSC, the levels of TNF-α and SDC-1 in the myocardial tissue of the VF-C group were significantly higher than those in the S group and the VF-I group, whereas the TNF-α level in the VF-I group did not significantly differ from that in the S group. Although the SDC-1 level in the VF-I group was higher than that in the S group, it was significantly lower than that in the VF-C group (Figure 5).
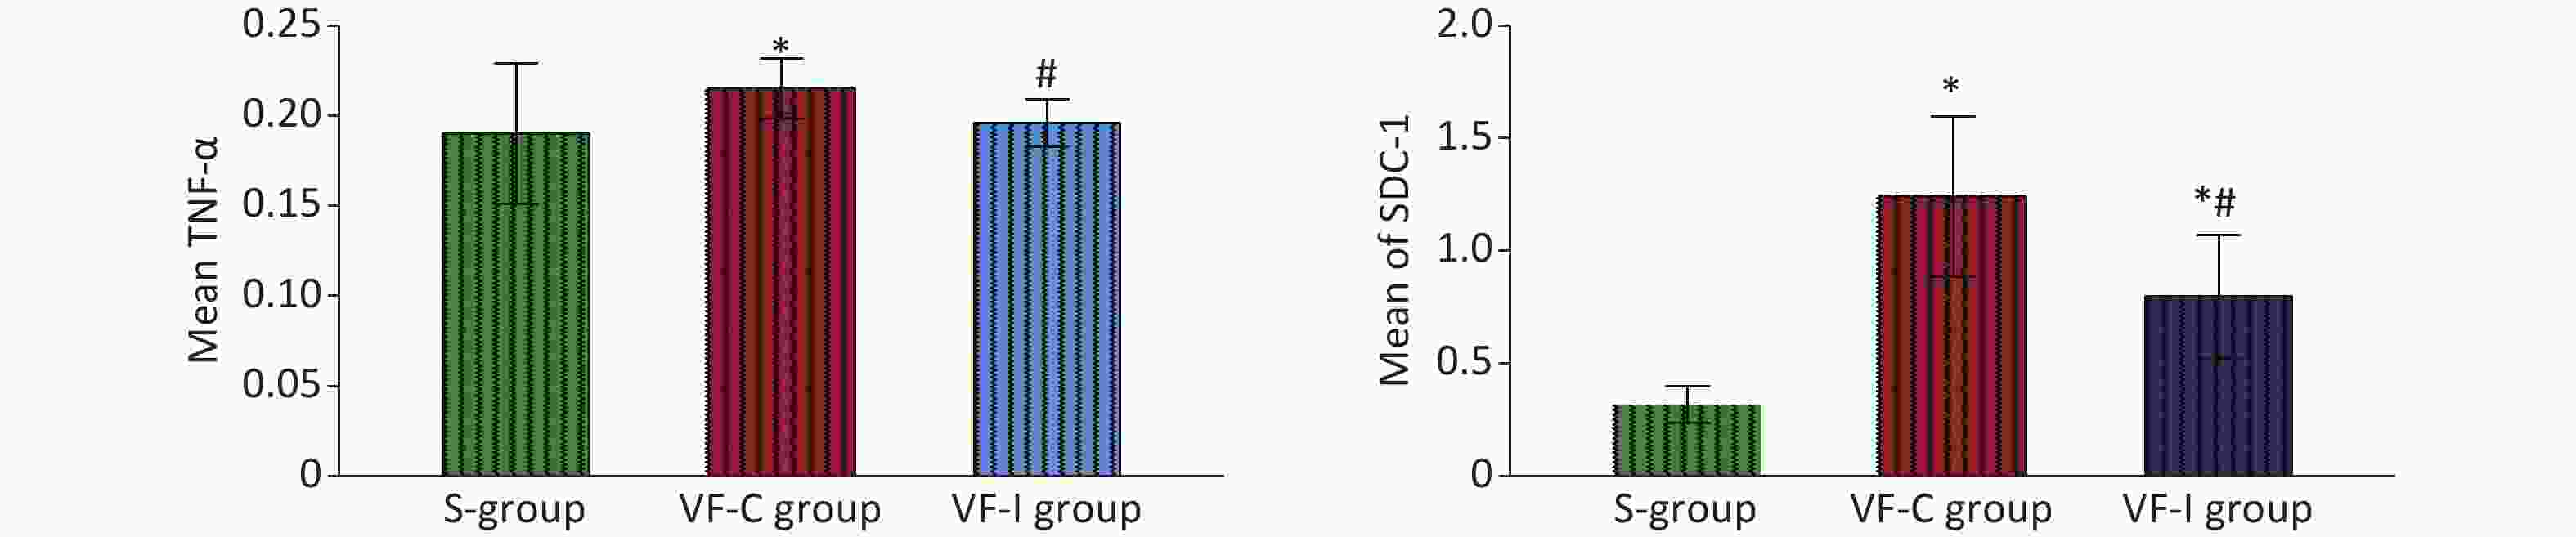
Figure 5. Comparison of TNF-α and SDC-1 levels in myocardial tissues of the three groups of animals 6 h after ROSC. The green bar represents the S group, the red bar represents the VF-C group, and the blue bar represents the VF-I group. *Significant difference with respect to the S group, #significant difference with respect to the VF-C group. At 6 h post-ROSC, the levels of TNF-α and SDC-1 in the myocardial tissue of the VF-C group were significantly higher than those in the S group. No significant difference was observed in TNF-α levels between the VF-I group and the S group. The SDC-1 level was higher than that in the S group but significantly lower than that in the VF-C group. ROSC, recovery of spontaneous circulation.
-
Under a light microscope, the myocardial myofilaments of samples from the VF-I group appeared to be arranged neatly, whereas those in the VF-C group samples were disordered. Under an electron microscope, the myocardial muscle fibers of samples from the VF-I group appeared mildly damaged, with relatively complete and neatly arranged myofilament structures, whereas those in the VF-C group were severely damaged, showing a damaged, broken and disordered myofilament structure (Figure 6).
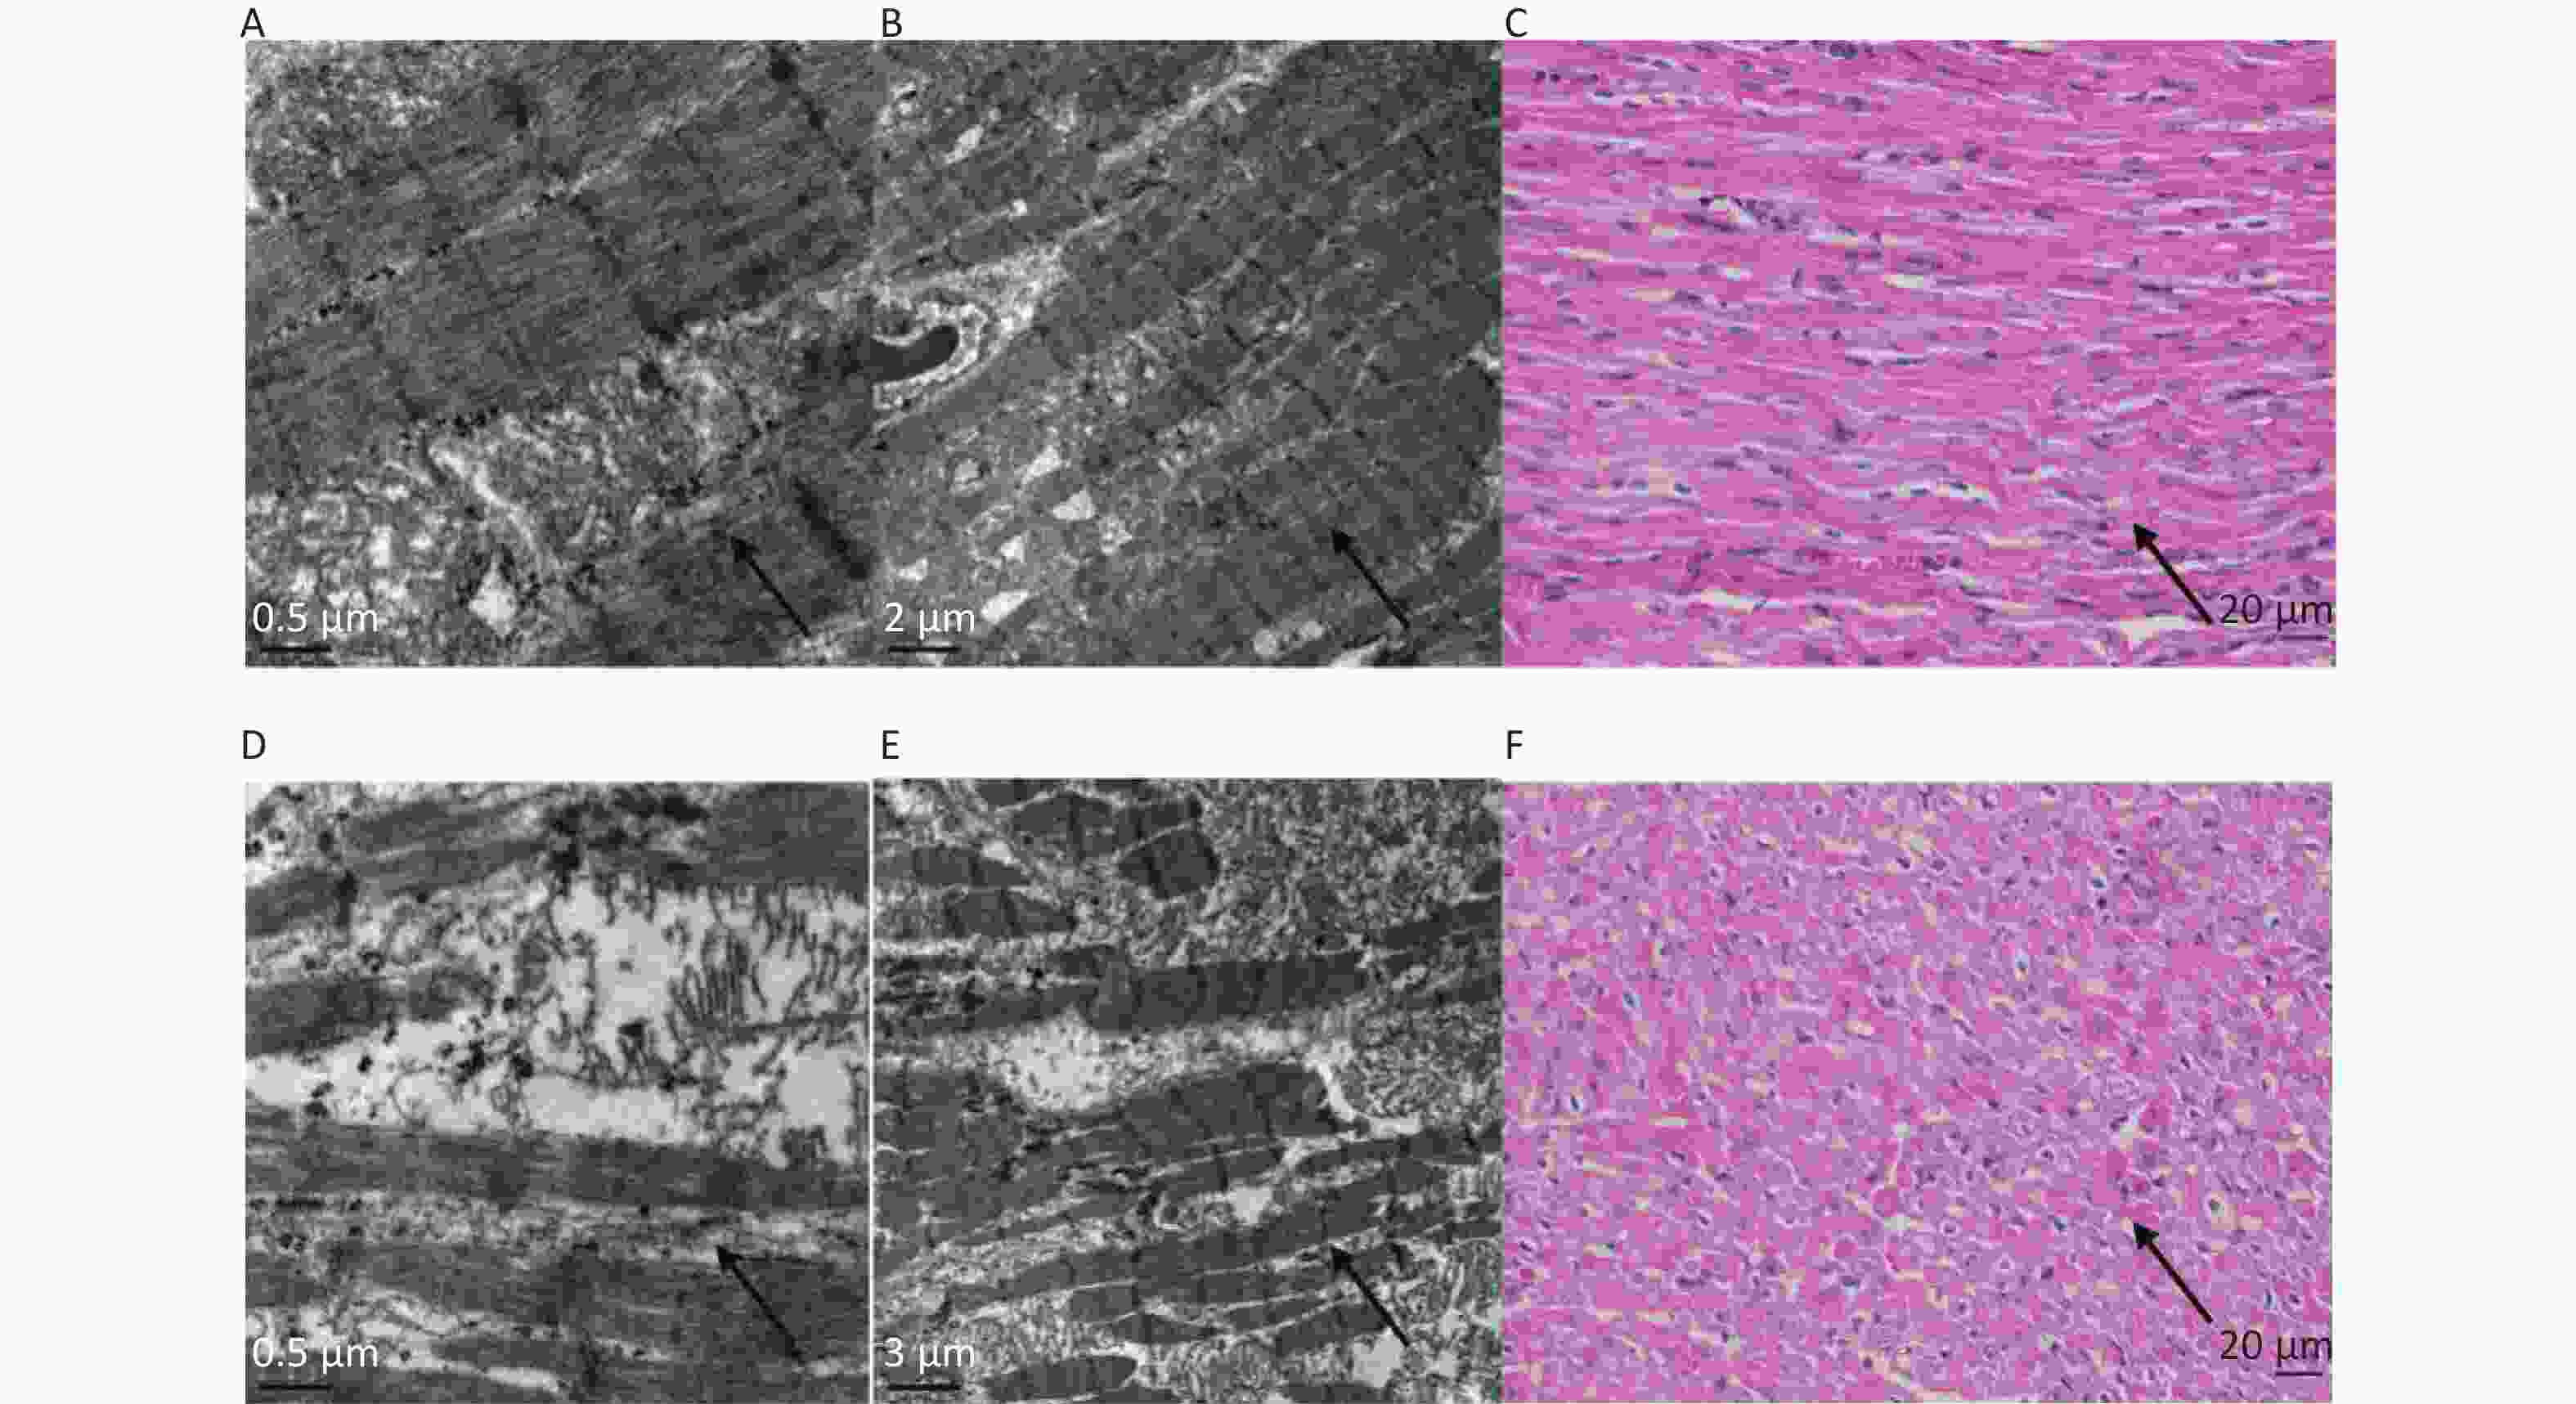
Figure 6. Electron microscopy and histopathological (H&E-stained samples) light microscopy of myocardial tissue from the VF-I group and the VF-C group. Pictures of the VF-I group: 0.5 μm transmission electron microscopy (A); 2 μm transmission electron microscopy (B); 400× magnification of histopathologic (H&E-stained) samples (C). Pictures of the VF-C group: 0.5 μm transmission electron microscopy (D); 3 µm transmission electron microscopy (E); 400× magnification of histopathologic (H&E-stained) samples (F). The results of electron microscopy and light microscopy of histopathologic (H&E-stained) tissue samples revealed that the myocardial myofilament structure in the VF-I group was nearly complete and neatly arranged, and showed minimal muscle fiber damage; in contrast, the myocardial fibers in the VF-C group were severely damaged, as indicated by myofilament structures with clear damage and disordered arrangement.
-
CA is one of the most critical clinical emergencies. Given the complex pathophysiological changes underlying CA, the long-term overall survival of CA patients is extremely poor[8]. Cardiac dysfunction after resuscitation is among the most important causes of death in patients with CA[9]. Studies have shown that systolic and diastolic function significantly decrease after ROSC. A similar trend is observed for the left ventricular cardiac output and ejection fraction within 6 h of ROSC, thus often leading to myocardial damage-related cardiac dysfunction or recurrent malignant heart rhythms. These complications are associated with high mortality within 72 h of their development[10]. In the present study, we also found that cardiac function in animals with ventricular fibrillation deteriorated significantly 6 h after ROSC. In particular, the CI values of animals after ventricular fibrillation at each time point after ROSC, in contrast to those in the S group, were significantly lower than those in the basal state. An opposite trend was observed for the SVR, which normalized 6 h after ROSC, thus suggesting persistent systolic and diastolic dysfunction of the myocardium after resuscitation. Myocardial tissue electron microscopy revealed that ROSC damages cardiomyocytes, thereby suggesting that cardiac dysfunction was associated with this injury. Our findings indicated that preventing myocardial injury and cardiac dysfunction after CPR may improve the long-term survival of patients with CA.
Events underlying myocardial injury and dysfunction after CPR are highly complex but are strongly associated with microcirculation dysfunction. The primary function of microcirculation is to directly supply nutrients and remove waste from the myocardial tissues. As such, microcirculatory dysfunction after CPR cuts off the oxygen supply and therefore metabolism in the myocardial tissues, and consequently exacerbates tissue and organ damage[11]. CA disrupts the oxygen and nutrient supply in the body. The increasing oxygen shortage induces excessive inflammation in activated endothelial cells, thus leading to microcirculation dysfunction[12]. Persistent microcirculatory dysfunction and an insufficient oxygen supply after ROSC further activate endothelial activation, thereby inducing an uncontrolled systemic inflammatory response culminating in myocardial injury[13,14].
Herein, visceral microcirculation assessment according to SDF revealed that, when MAP was maintained within the normal range, the visceral microcirculation after ROSC, including MFI, TVD, PPV and PVD, remained significantly lower than that at baseline and did not improve until 6 h after ROSC. These findings suggested that even after the systemic hemodynamics reached a stable state after continuous fluid resuscitation and the use of vasoactive drugs after ROSC, the visceral microcirculation remained impaired, and microcirculation could not resolve the microcirculatory perfusion disorder[15]. Simultaneously, blood tests revealed that the levels of Pv-aCO2 and Lactic acid (LAC) were significantly lower and higher after ROSC, respectively, and remained unchanged until 6 h after ROSC. In contrast, the plasma levels of TNF-α increased significantly after ROSC in a time-dependent manner. These findings suggested that microcirculation dysfunction after ROSC was closely associated with the sustained disrupted oxygen supply and metabolism in tissues. Combined with abnormal inflammation, these responses led to organ failure and even death[1,16].
In addition, we found that the level of plasma syndecan-1 increased significantly after ROSC and remained significantly elevated for 6 h, thus suggesting substantial glycocalyx injury and endothelial dysfunction[17]. Studies have shown that endothelial cell damage induced the release of active substances in the body that increased cell permeability, overexpression of adhesion factors, activation of platelets and inflammation, and proliferation and migration of vascular smooth muscle cells, among other responses. Overall, these events impaired microcirculatory function[18]. Meanwhile, prolonged continual progression of microcirculation impairment further aggravates endothelial cell dysfunction[13]. The significant increase in syndecan-1 levels after ROSC reflects the pathophysiological processes and interaction between microcirculation impairment and endothelial dysfunction, which together aggravate ischemia-reperfusion injury in multiple organs, including myocardial tissue[18].
Microcirculation dysfunction is closely associated with myocardial injury after ROSC. Previous studies have shown that restoring microcirculation in internal organs regulated the release of pro-inflammatory factors, thus decreasing apoptosis of myocardial cells after resuscitation[2,10,19]. Herein, we assessed the effects of improving visceral microcirculation on myocardial dysfunction after ROSC by using anisodamine hydrobromide (654-1). Anisodamine is a scopolane alkaloid extracted from Scopolia tanggutica Maxim. Anisodamine hydrobromide (654-1) inhibits the activation of the cholinergic anti-inflammatory pathway by blocking the M receptor. It also inhibits activation of the NF-κB signaling pathway, thereby blocking the excessive inflammatory response and improving microcirculation[20,21]. In addition, 654-1 blocks the functioning of certain non-M cholinergic receptors by vasodilation of microcirculatory blood vessels, thus enhancing the extrusion of cells through the microvessels, inhibiting activation and aggregation of platelets, and preventing the formation of microthrombi. In general, preventing diffuse coagulation and micro thrombosis in blood vessels improves tissue microcirculation[20].
In the present study, we found that, administration of 654-1 (4 mg/kg) 0.5 h after ROSC for 1.5 h, compared with the control, significantly increased the heart rate in experimental animals. However, this treatment had no significant effect after infusion. At 1, 2, 4 and 6 h after ROSC, the CI of the VF-I group increased significantly, whereas the SVR displayed an opposite trend, thereby suggesting that 654-1 corrects cardiac dysfunction after ROSC. Notably, this effect was not achieved through a continual increase in heart rate. At 1, 2, 4 and 6 h after ROSC, the SDF revealed that 654-1 significantly improved microcirculation perfusion after ROSC. Simultaneously, 654-1 administration substantially lowered the Pv-aCO2 and LAC levels. These findings suggested that improving the microcirculation perfusion state enhanced oxygen supply and metabolism in tissues. In addition, the TNF-α and syndecan-1 levels in the VF-I group were significantly lower than those in the VF-C group at all time points. This finding suggested that improving microcirculation enhanced endothelial function and inhibited the inflammatory response, which in turn decreased ischemia-reperfusion injury.
Electron microscopy of the myocardial tissue 6 h after ROSC showed that the myocardial injury was substantially less severe in the VF-I group than the VF-C group, thus suggesting that 654-1 protected cardiomyocytes against microcirculation-related injury. Overall, the CI values revealed that cardiomyocyte injury was closely associated with cardiac dysfunction. The levels of TNF-α and syndecan-1 in the myocardial tissue of the VF-I group were significantly lower than those in the VF-C group. This finding suggested that 654-1 protected against endothelial injuries, and regulated hypoxia and the TNF-α-related inflammatory response by improving microcirculation. Consequently, myocardial ischemia-reperfusion injury decreased, and cardiac dysfunction and the prognosis of patients with CA were both improved.
Although animal models can reflect the clinical hemodynamics and visceral microcirculatory changes associated with ROSC in humans to some extent, critical differences may still exist. In addition, given that our findings are limited to after 6 h after ROSC, the longer-term effects of 654-1 on organ function were not ascertained. Regarding study limitations, although dynamic cardiac heart function was assessed through invasive hemodynamic methods, the general structure of the heart was not examined.
In summary, visceral microcirculatory dysfunction played a crucial role in the deterioration of myocardial function after resuscitation. However, 654-1 protected against endothelial injury and inhibited excessive inflammatory reactions by improving visceral microcirculation. Consequently, myocardial injury was decreased, cardiac function after ROSC was maintained, and the overall prognosis of patients with CA improved. The findings of this study opened a new frontier for improving organ function after CA and CPR.
-
Not applicable.
-
All data used in this study are available from the corresponding author Shu-Bin Guo on email request.
-
YJ: surgery and manuscript writing. DGJ and WHW: operating. ZX: data acquisition. WFJ: statistical analysis. ZJ: final approval of the manuscript. GSB: conception, design and final approval of the manuscript. All authors read and approved the final manuscript.
-
This study was approved by the Animal Care and Use Committee of Beijing Chao-Yang Hospital, Capital Medical University (No. SCXK 11-00-002), and the use of all animals that received treatment was in compliance with the National Research Council’s 1996 Guide for the Care and Use of Laboratory Animals.
-
Patients were not involved.
-
The authors declare that they have no competing interests.
Influence of Microcirculatory Dysfunction on Myocardial Injury after Cardiopulmonary Resuscitation
doi: 10.3967/bes2022.044
- Received Date: 2021-10-25
- Accepted Date: 2022-01-27
-
Key words:
- Cardiopulmonary resuscitation /
- Post-cardiac arrest syndrome /
- Microcirculation dysfunction /
- Myocardial injury /
- Anisodamine hydrobromide (654-1)
Abstract:
| Citation: | YANG Jun, DONG Gui Juan, WANG Hong Wei, ZHAO Xin, WANG Fu Jun, ZHANG Jian, GUO Shu Bin. Influence of Microcirculatory Dysfunction on Myocardial Injury after Cardiopulmonary Resuscitation[J]. Biomedical and Environmental Sciences, 2022, 35(4): 334-344. doi: 10.3967/bes2022.044

|


 Quick Links
 DownLoad: