


-
The Coronavirus Disease 2019 (COVID-19) pandemic challenges government leaders to make proper decisions that balance public safety and people’s livelihood. At the time of the outbreak, interventions must be imposed immediately to ensure public safety. However, after the outbreak has been brought under control, easing restrictions could also be a hard task. If the restrictions are relaxed slightly, then people’s livelihood remains affected. If restrictions are relaxed too much, then the outbreak may become uncontrollable again. This challenge was highlighted when the Omicron strain recently became popular in some areas and was designated as a variant of concern by WHO. The restrictions of various countries have undergone great changes since the emergence of the previous variants. The number of countries adopting stricter interventions, such as “close public transport” “restrict travel” and “stay-at-home requirement,” has increased remarkably. However, China has always adopted targeted interventions and implemented no significant change with the emergence of the Omicron strain, indicating that this country may have an exceptional response to virus mutations.
Quantitative analysis of the impact of interventions will greatly assist policymakers in maintaining social stability while safeguarding people’s livelihood; however, some obstacles might be encountered. The traditional compartment model uses fixed parameters to implement the prediction, thus leading to large deviations in long-term forecasts. In addition, data on daily cases are not sufficient to accurately depict the transmission, and no quantifiable association can be made between daily onsets and interventions.
To solve these problems, Brauner et al.[1] proposed a Bayesian hierarchical model that links intervention implementation dates to case and death count. Similarly, Flaxman et al.[2] collected case data, population data, and non-pharmaceutical interventions for each country to build a Bayesian hierarchical model that simulates intervention impacts on infections. Both models have sufficient theoretical support. However, as a linear model, the Bayesian hierarchical model has a strong assumption that features are independent of each other and interventions are not necessarily independent. Another study[3] analyzed geographical, demographic, and epidemiological data in Singapore to create an agent-based model that simulates future infections. However, agent-based models run even slower than Bayesian models and require too many parameters as input. In the real world, these parameters are difficult to obtain accurately. Other investigations in China and the US developed susceptible-exposed-infectious-removed (SEIR) or regression modeling frameworks and quantitatively evaluated the effectiveness of interventions[4,5]. Although both studies proved that non-pharmaceutical interventions (NPIs) have helped contain the outbreak to varying degrees, they were published early in the outbreak and did not consider the impact of vaccination or viral mutations.
Davies et al.[6] compared several scenarios for interventions, estimated the impact of the Alpha (lineage B.1.1.7) variant of SARS-CoV−2 in England, and assumed some vaccination scenarios. The study predicted a new wave in COVID-19 cases and deaths with the presence of virus mutations, but the peak time of the wave would vary with policy changes. Buckner et al.[7] built a compartmental model parameterized to optimize vaccine deployment and minimize the overall burden of disease. With the presence of highly transmissible variants and the availability of vaccines, Giordano et al.[8] proposed a compartmental model named SIDARTHE−V to forecast epidemic scenarios with the consideration of vaccines and viral mutations. However, this model added vaccination as a compartment, which needs to be analyzed in combination with practical cases. Therefore, SIDARTHE−V has certain limitations and may not be suitable for all scenarios; accurate results will be difficult to obtain when applying this model to new scenarios. A recent study[9] assessed the UK government’s roadmap out of lockdown restrictions with an advanced model that incorporated the delta (B.1.617.2) variant of SARS-CoV-2 and vaccinations and found that even when the vaccination coverage is relatively high, the complete cancelation of NPIs may bring about new crises due to the emergence of new variants. The study offered suggestions for lifting control measures but did not propose appropriate and targeted interventions.
By taking full account of daily cases, interventions, populations, economy, vaccines, and viral variants, we built a machine learning enhanced compartment model and web service to simulate current real-world scenarios. The model dynamically learns parameters through real−world data from multiple countries and thus is compatible with different scenarios. We also used a nonlinear model to overcome the issue of multicollinearity so that simulations can be carried out without the assumption of policy independence. In addition to the interventions commonly used by countries around the world, we added two of China’s most favorable prevention and control measures against the epidemic, which are also the core interventions in China’s “dynamic zero-COVID strategy”. This approach allowed us to select tailored interventions in different scenarios and balance economic development, social stability, and human health.
-
An overview of our method follows a pipeline, as shown in Figure 1. First, real-world factors were collected, including interventions such as school closing, regional factors such as population, and virus-related factors such as virus mutation. The suitable model was carried on to map the above factors to the parameters of infection. Finally, those parameters were applied to the compartment model to run the simulation.
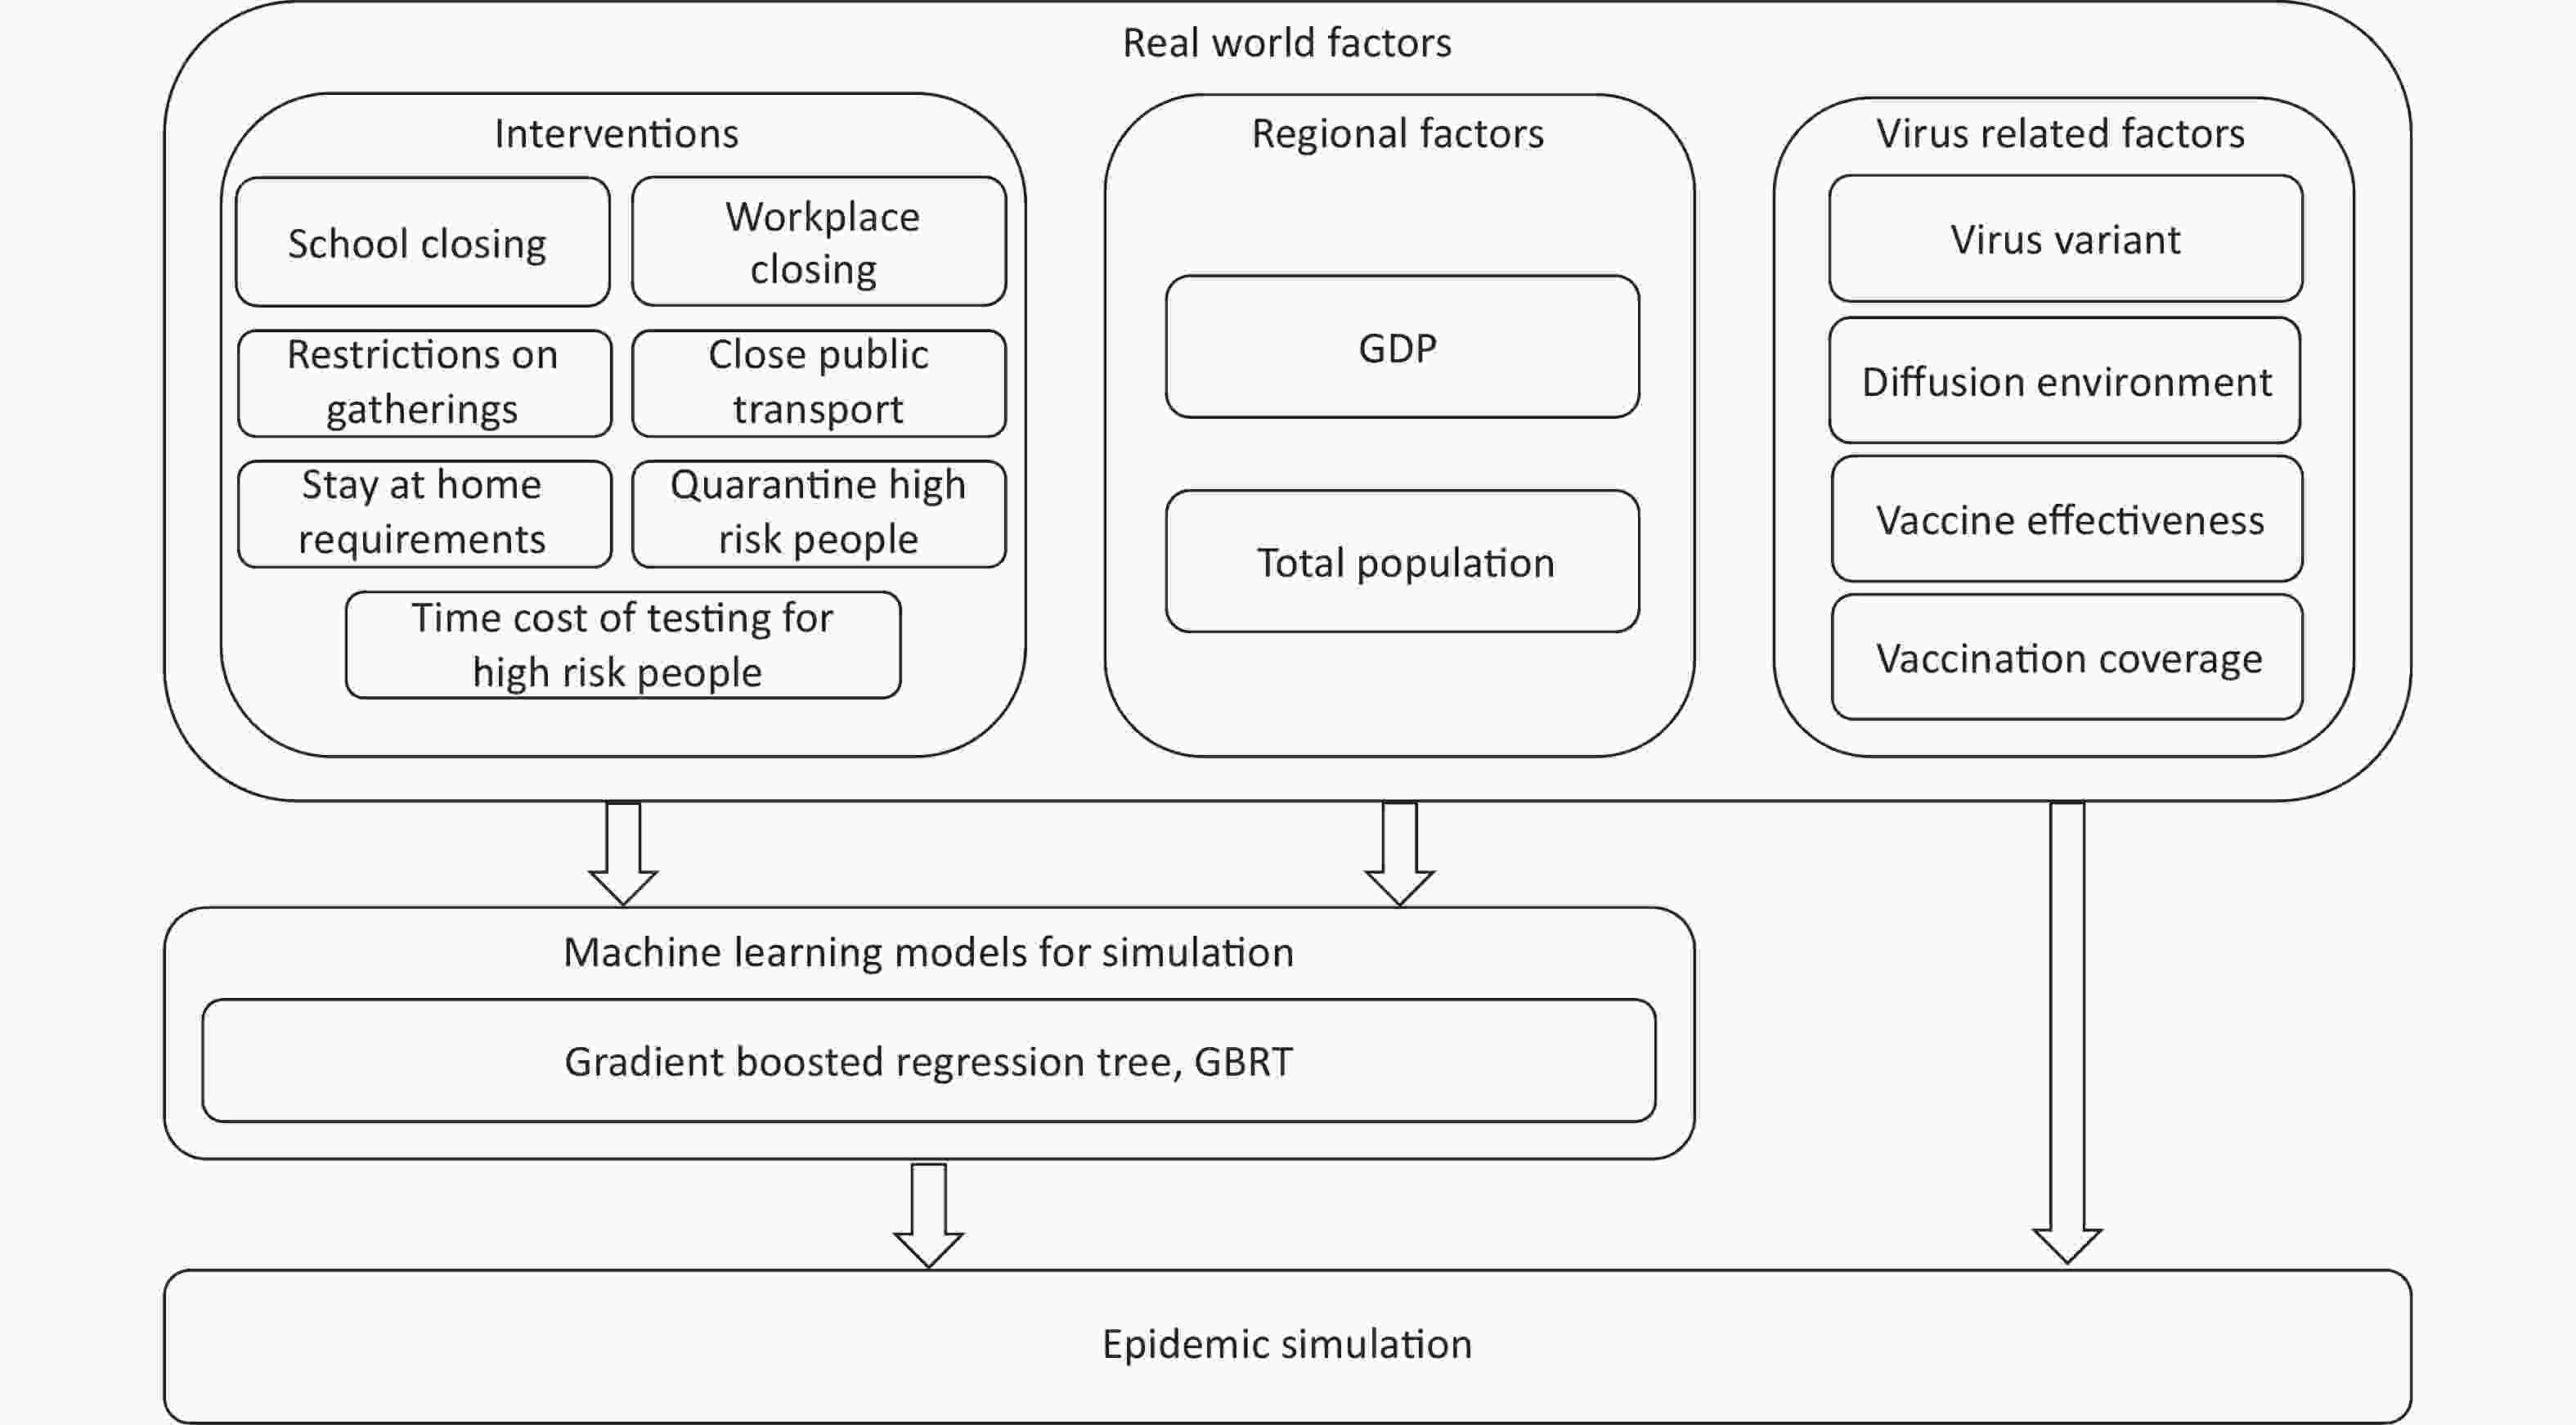
Figure 1. Summary of the simulation.
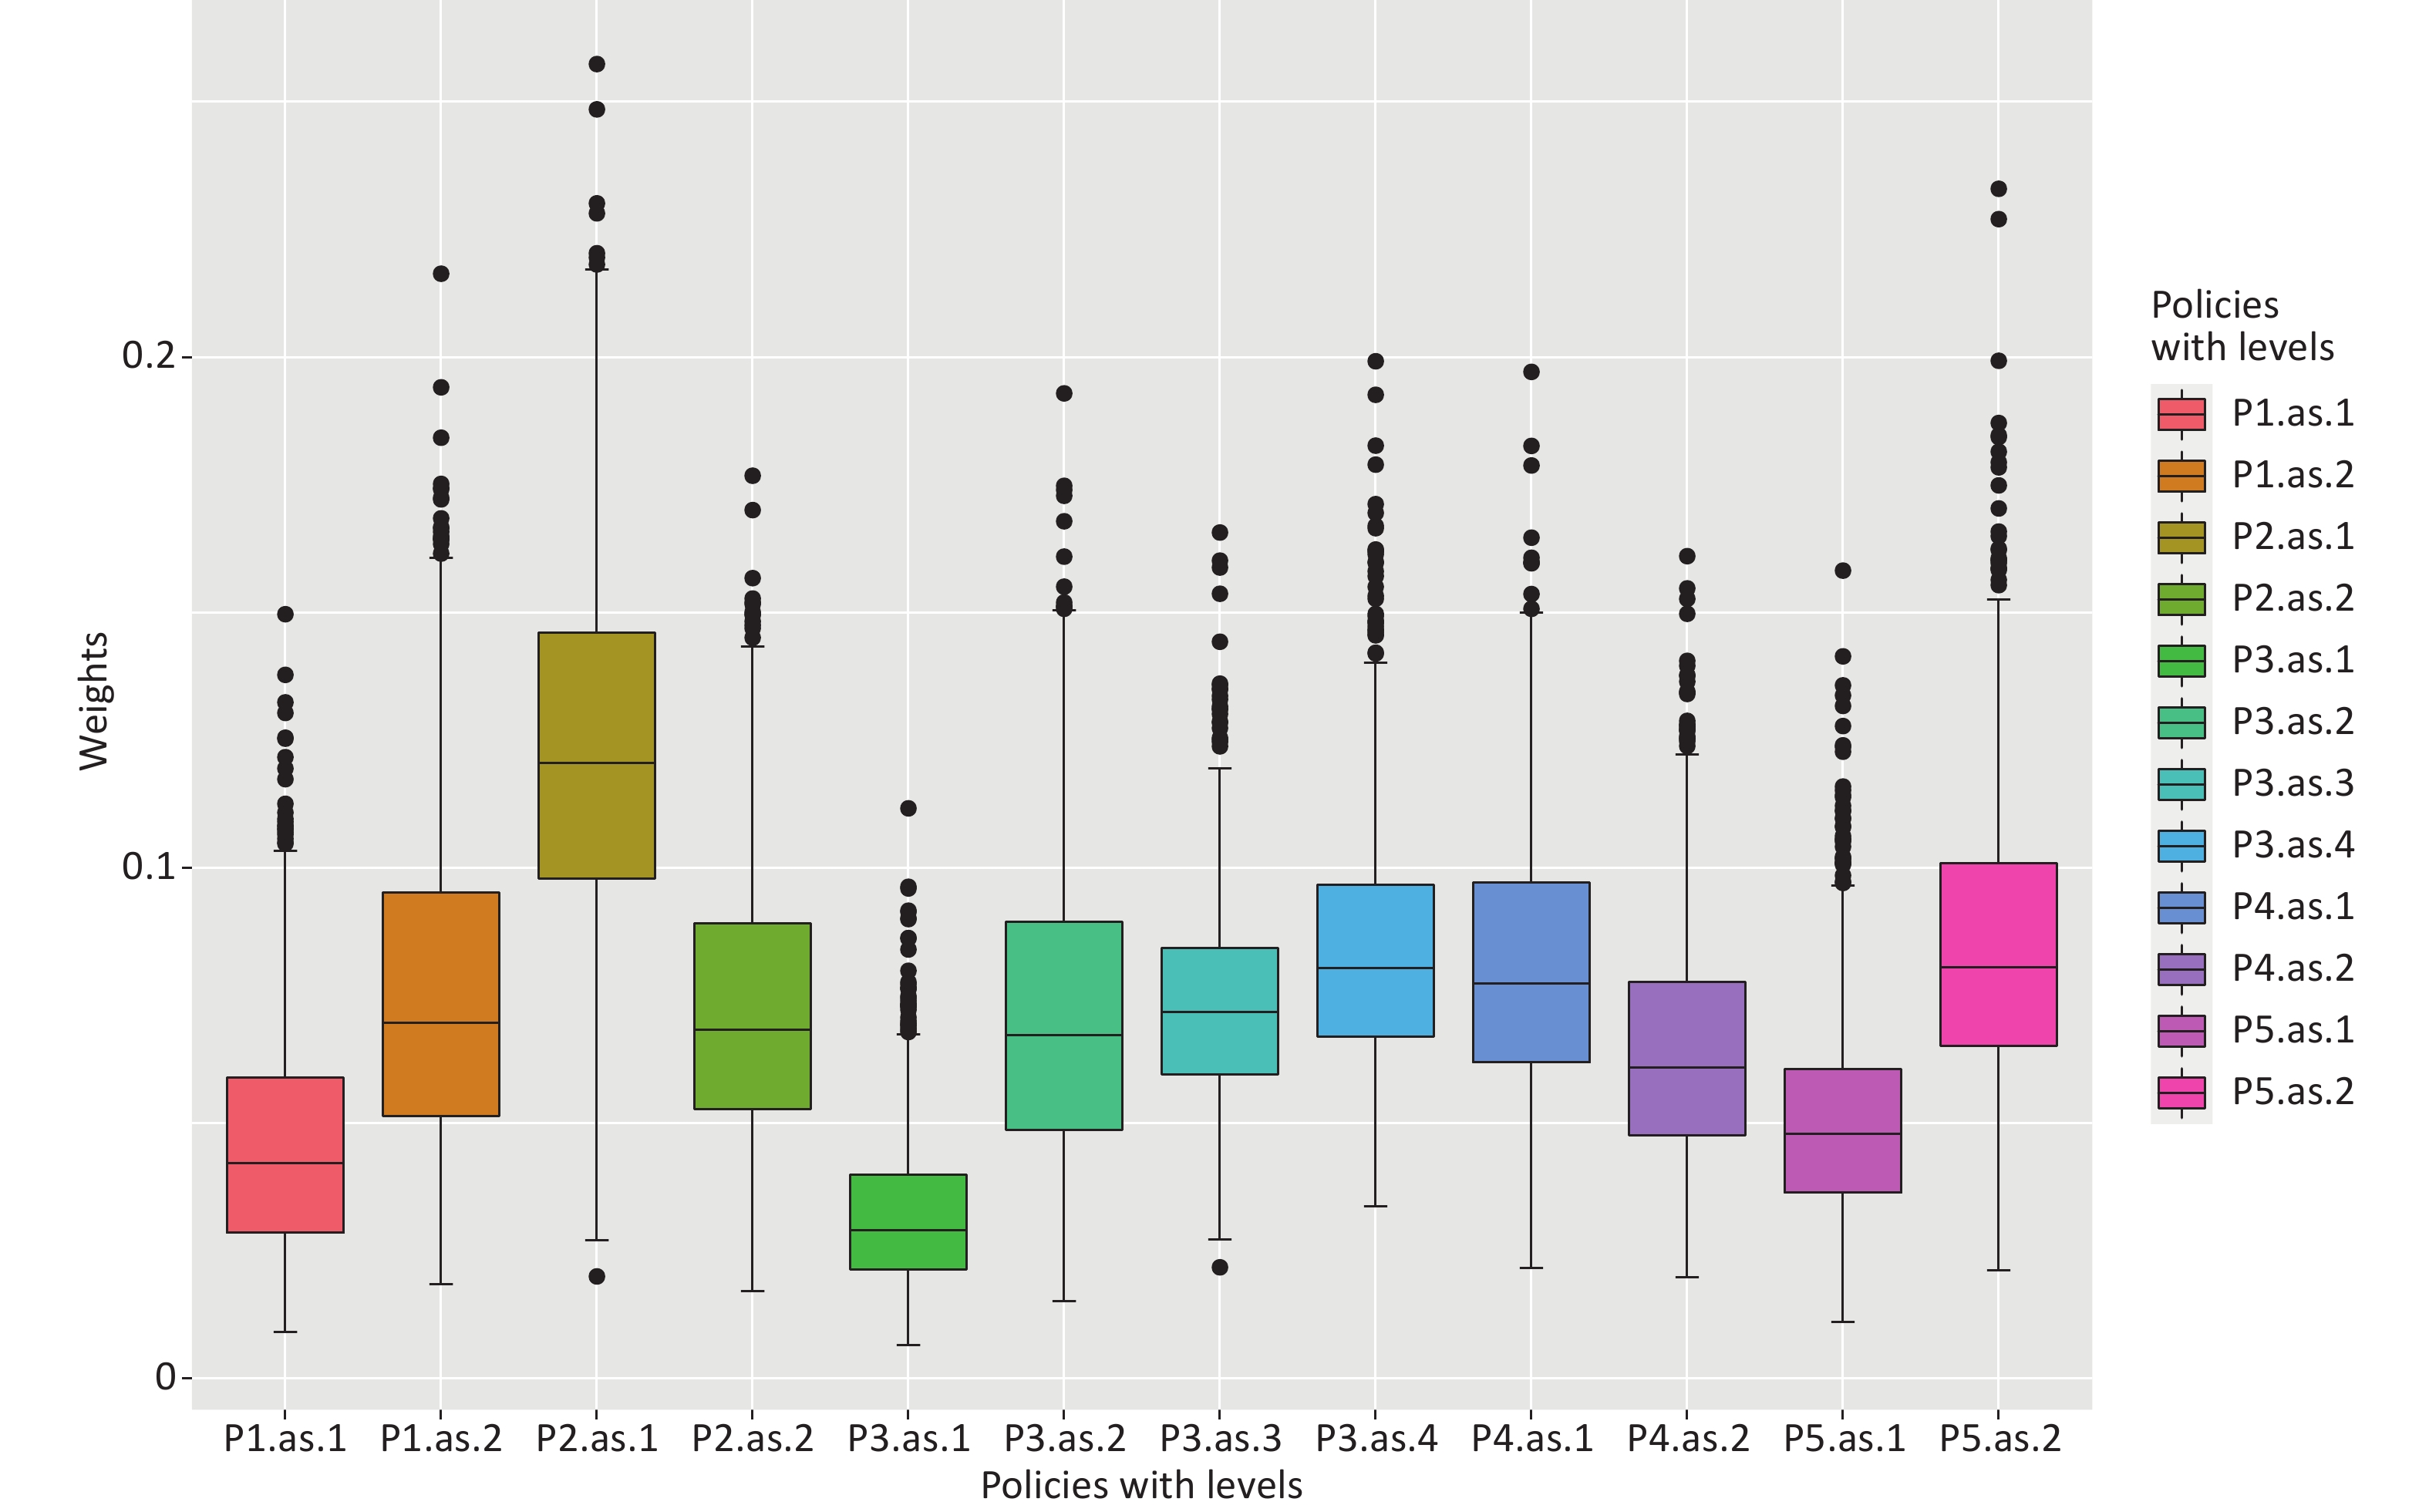
For intervention assessment, the Oxford Covid-19 Government Response Tracker (OxCGRT) [10] compiled by the University of Oxford was analyzed and disassembled. A previous study[1] showed that school closing (P1), workplace closing (P2), restrictions on gatherings (P3), close public transport (P4), and stay at home requirements (P5) are executed by most countries. Therefore, an OxCGRT dataset of 165 countries from February 1, 2020, to December 31, 2020, covering containment and closure indicators C1 school closing, C2 workplace closing, C4 restrictions on gathering size, C5 close public transport, and C6 stay at home requirements for each day was used in our model to calculate the effectiveness of interventions. Data in 2020 were chosen to avoid the impact of variants and vaccines; during this year, the original strain was still the main source of transmission, and vaccines had not yet been released. Daily confirmed COVID-19 data from Johns Hopkins[11] from February 1, 2020, to January 10, 2021, were also selected to match each country’s OxCGRT data. Gross domestic product (GDP) and total population could also affect transmission; therefore, 2020 GDP and 2020 population for each country from United Nations Statistics Division[12] were collected as confounders in evaluating the effectiveness of individual interventions. Considering that the input interventions are not independent, a nonlinear model must be applied to provide accurate measurement of interventions. Thus, a gradient regression tree model (Gradient Boosted Regression Tree, GBRT)[13] was built based on the above data. Owing to the limited information on interventions, the results from a single model were not stable. Therefore, 1,000 iterations were performed on current data, and the weights of P1–P5 are shown as a box plot in Figure 2.
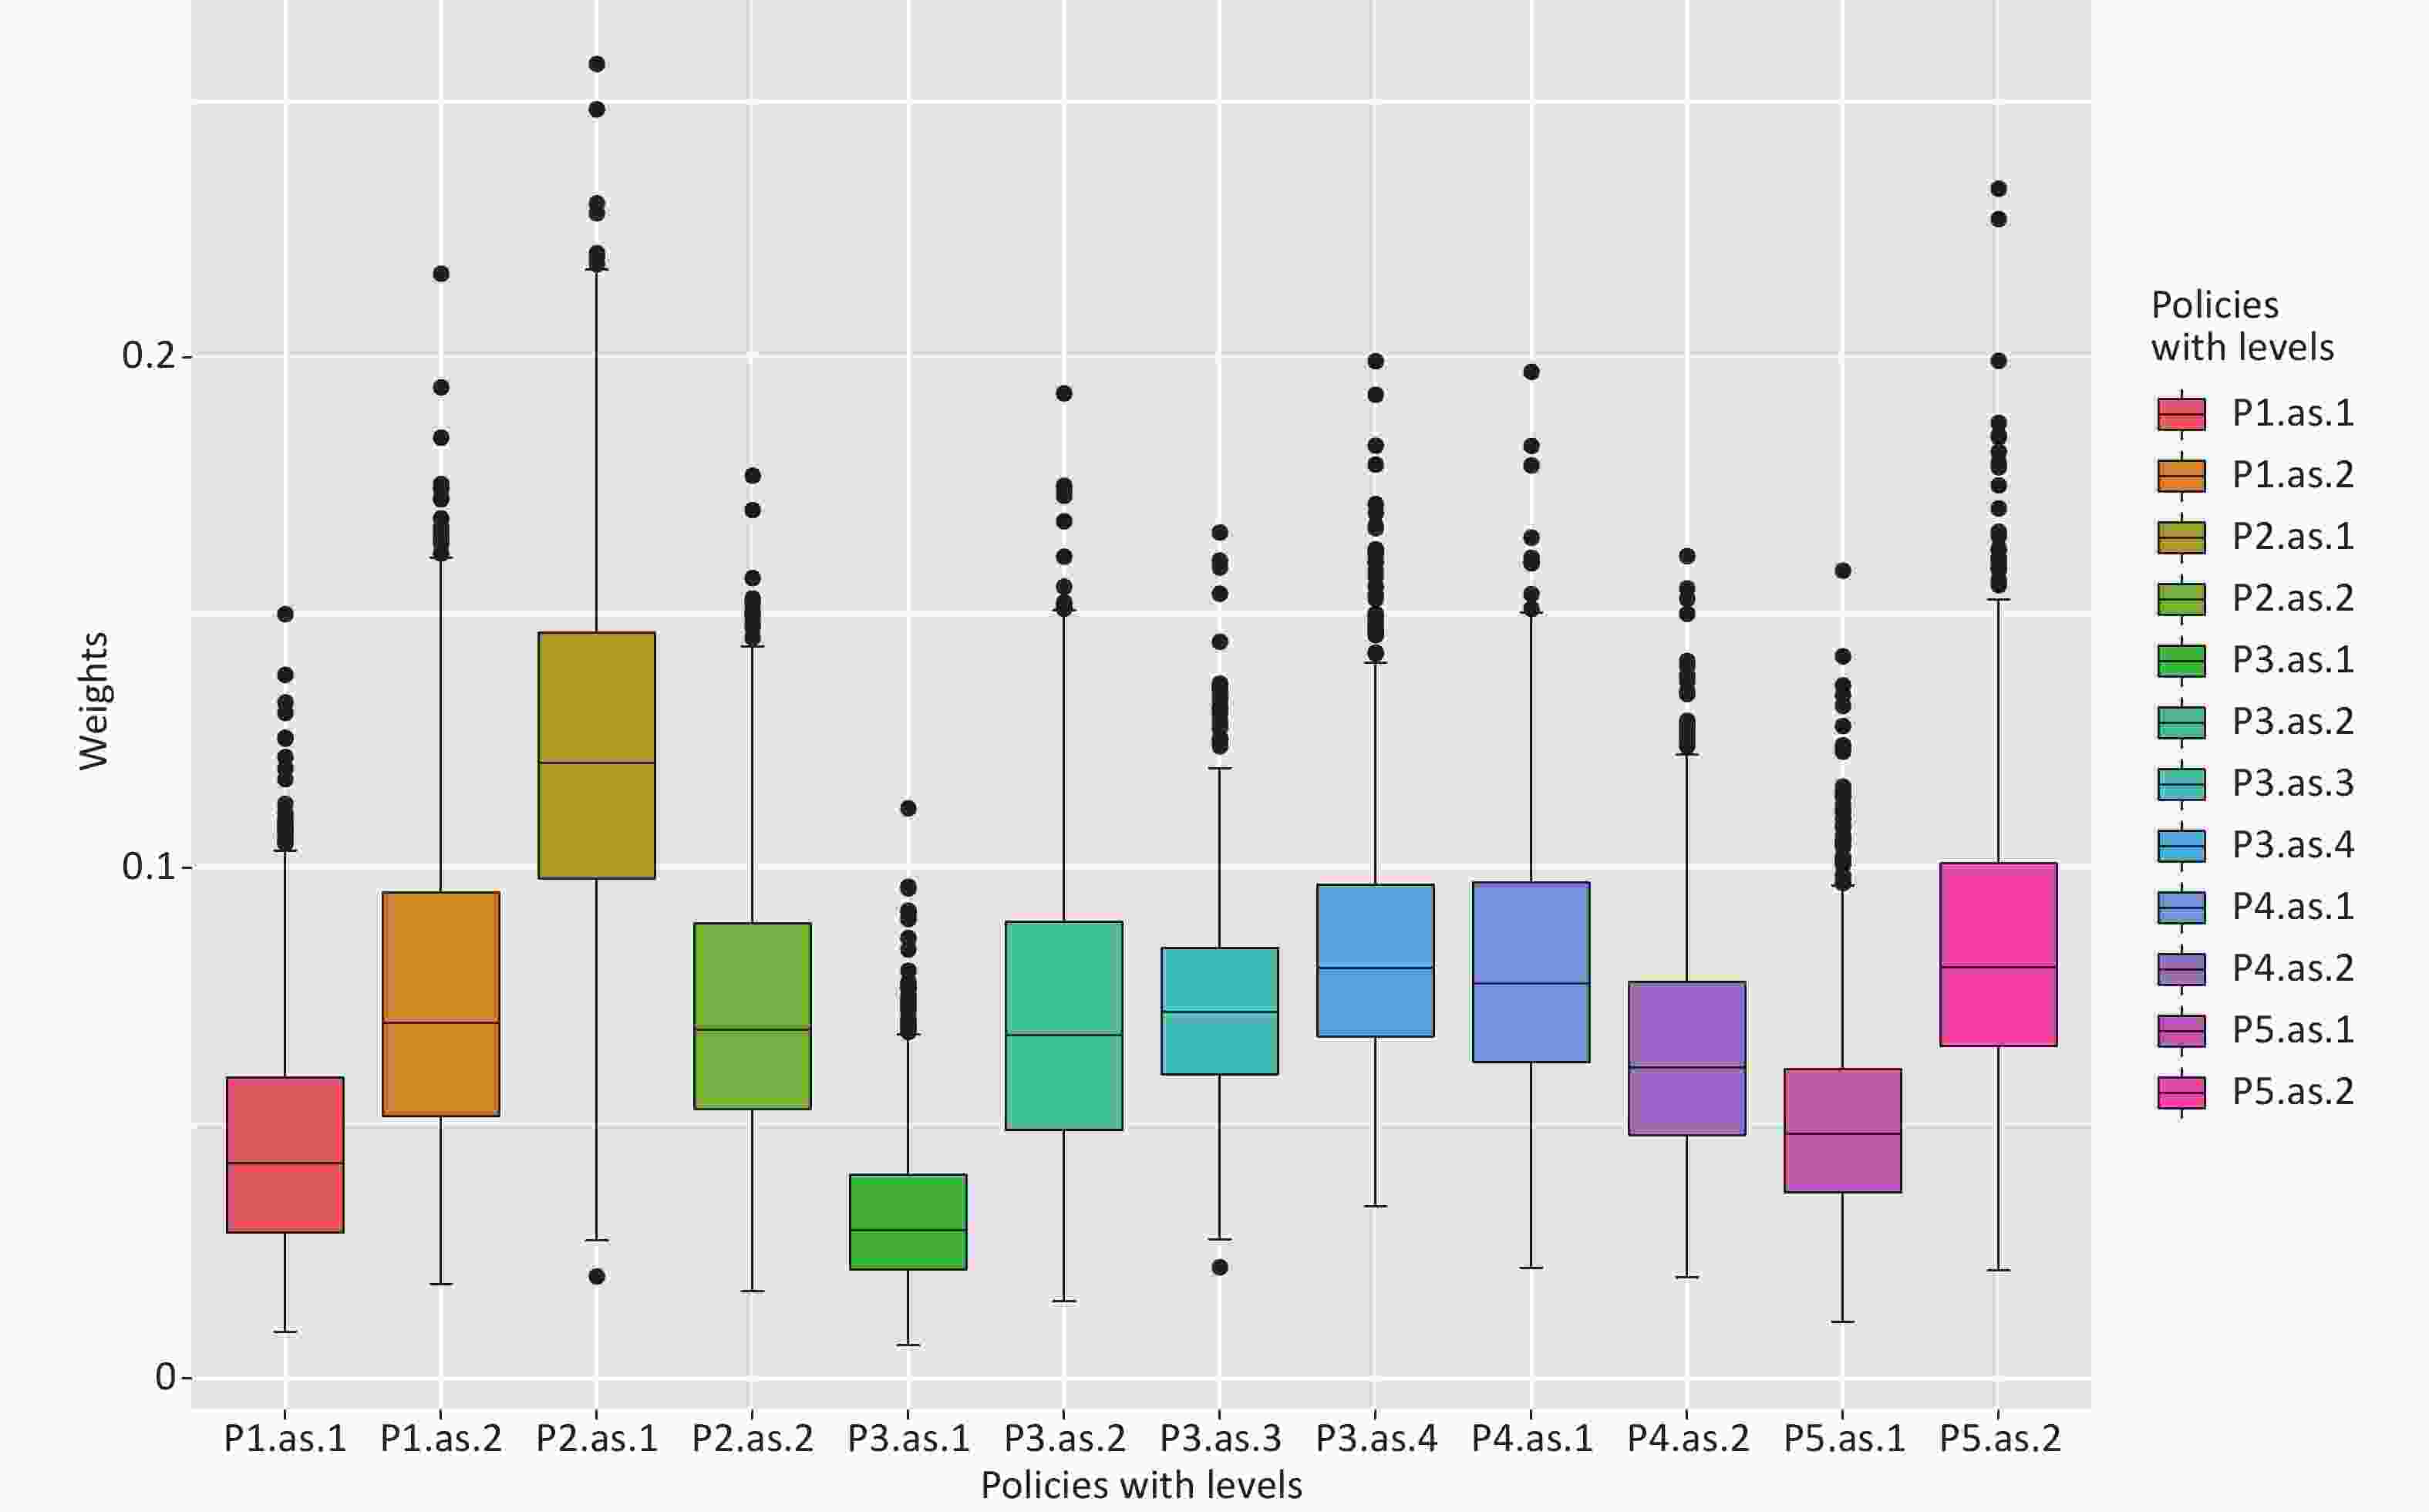
Figure 2. Boxplot for government policies P1–P5 with specified intervention level. The X-axis indicates the intervention variables, and the y-axis indicates the impact on daily growth. Detailed definitions of P1–P5 are listed in Appendix A.
Quarantine and testing for high-risk people are the most powerful measures in China. Therefore, quarantining high-risk people (P6) and the time cost of testing for quarantined high-risk people (P7) were added as interventions in our study. The effectiveness of P6 and P7 was quantified by rates between cases from high-risk people and all cases in Guangzhou’s outbreak in China in mid-2021. Data were collected from Guangzhou Municipal Health Commission[14].
In the epidemic simulation, the basic reproduction number R0 was calculated using the information on vaccines, strains, and environment. Diffusion environment (R2) was classified into five types[15], and the average basic reproduction number of each type was used to represent the spread rate of the original strain. In addition, the spread rate for each variant (R1) was obtained and compared with that for the original strain [16,17]. The effectiveness (R3) and coverage (R4) of the vaccine were also considered in our model. Finally, R1–R4 values can functionally lead to R0. Imported cases number (C1) and population number (C2) were also required to initialize a scenario. Days of the virus spreading freely (P8) were recorded as the time length before interventions. A functional relationship was then established between intervention effectiveness and effective reproduction number
$ {R}_{t} $ for days after interventions[1]. The details of these factors are listed in Appendix A (available in www.besjournal.com). -
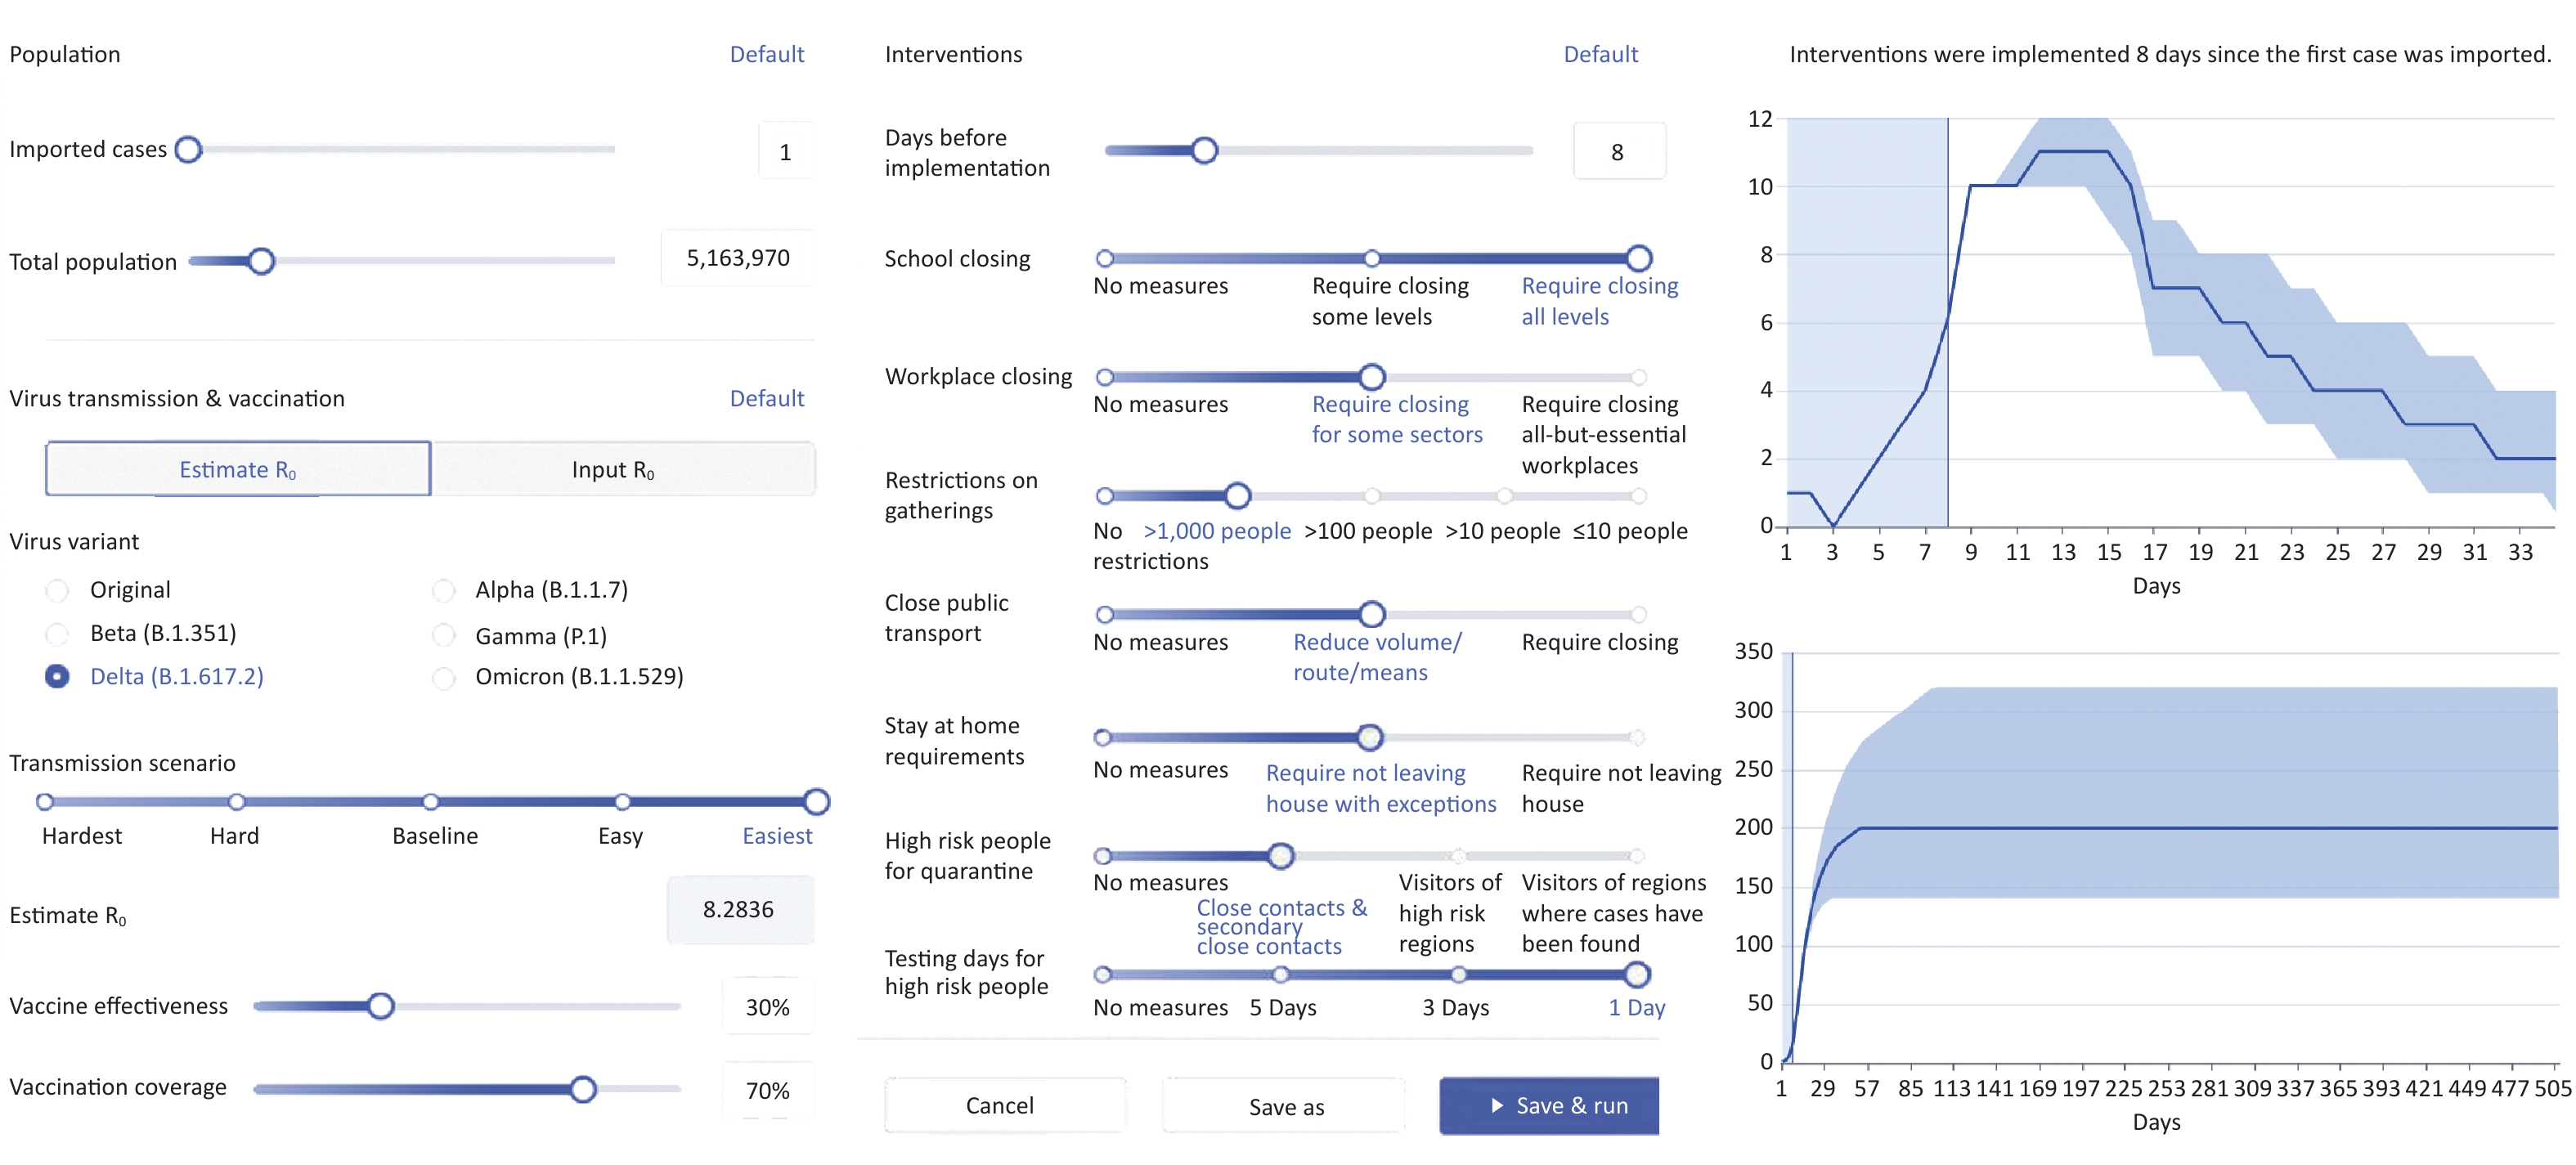
A web service for simulation of COVID-19 development was built using the above parameters to simulate the transmission scenario that comes with a sudden imported case. In the SIR model, the coefficient of different intervention measures was inputted to simulate the impact of each intervention with the outcome of predicting the infected daily cases. The web service was built on the global pandemic data analysis and risk assessment platform as a tool (Figure 3) for decision-makers to analyze the collocation of interventions. On the web service, any combination of parameters can be set according to the user’s objective to compare the epidemic status after interventions.
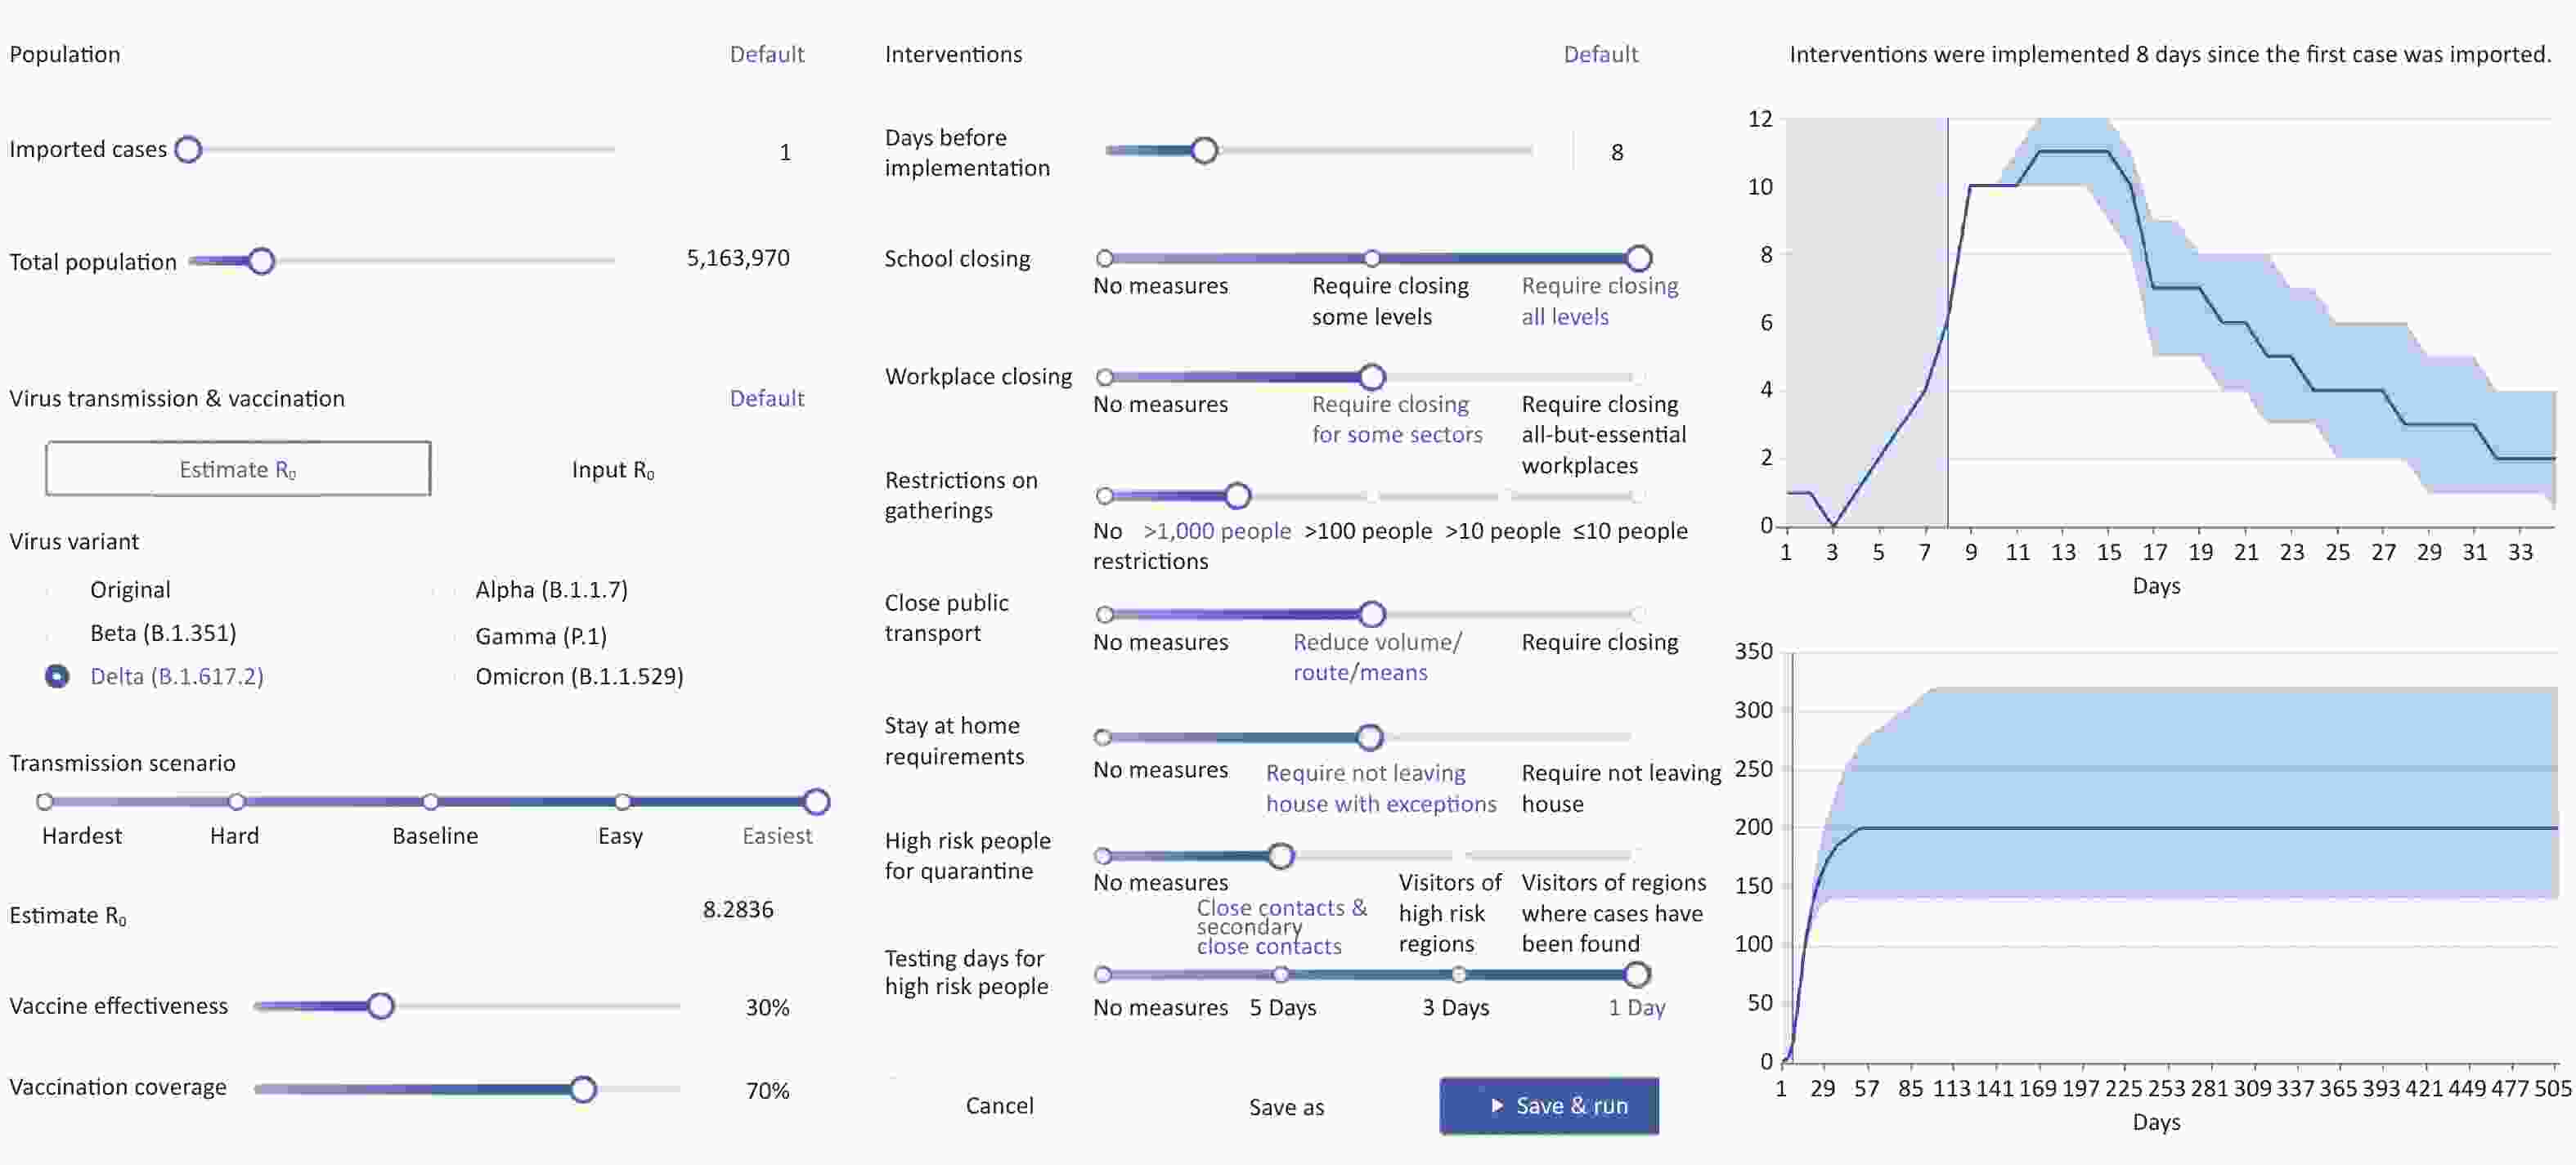
Figure 3. Web service of our model on the global pandemic data analysis and risk assessment platform results
-
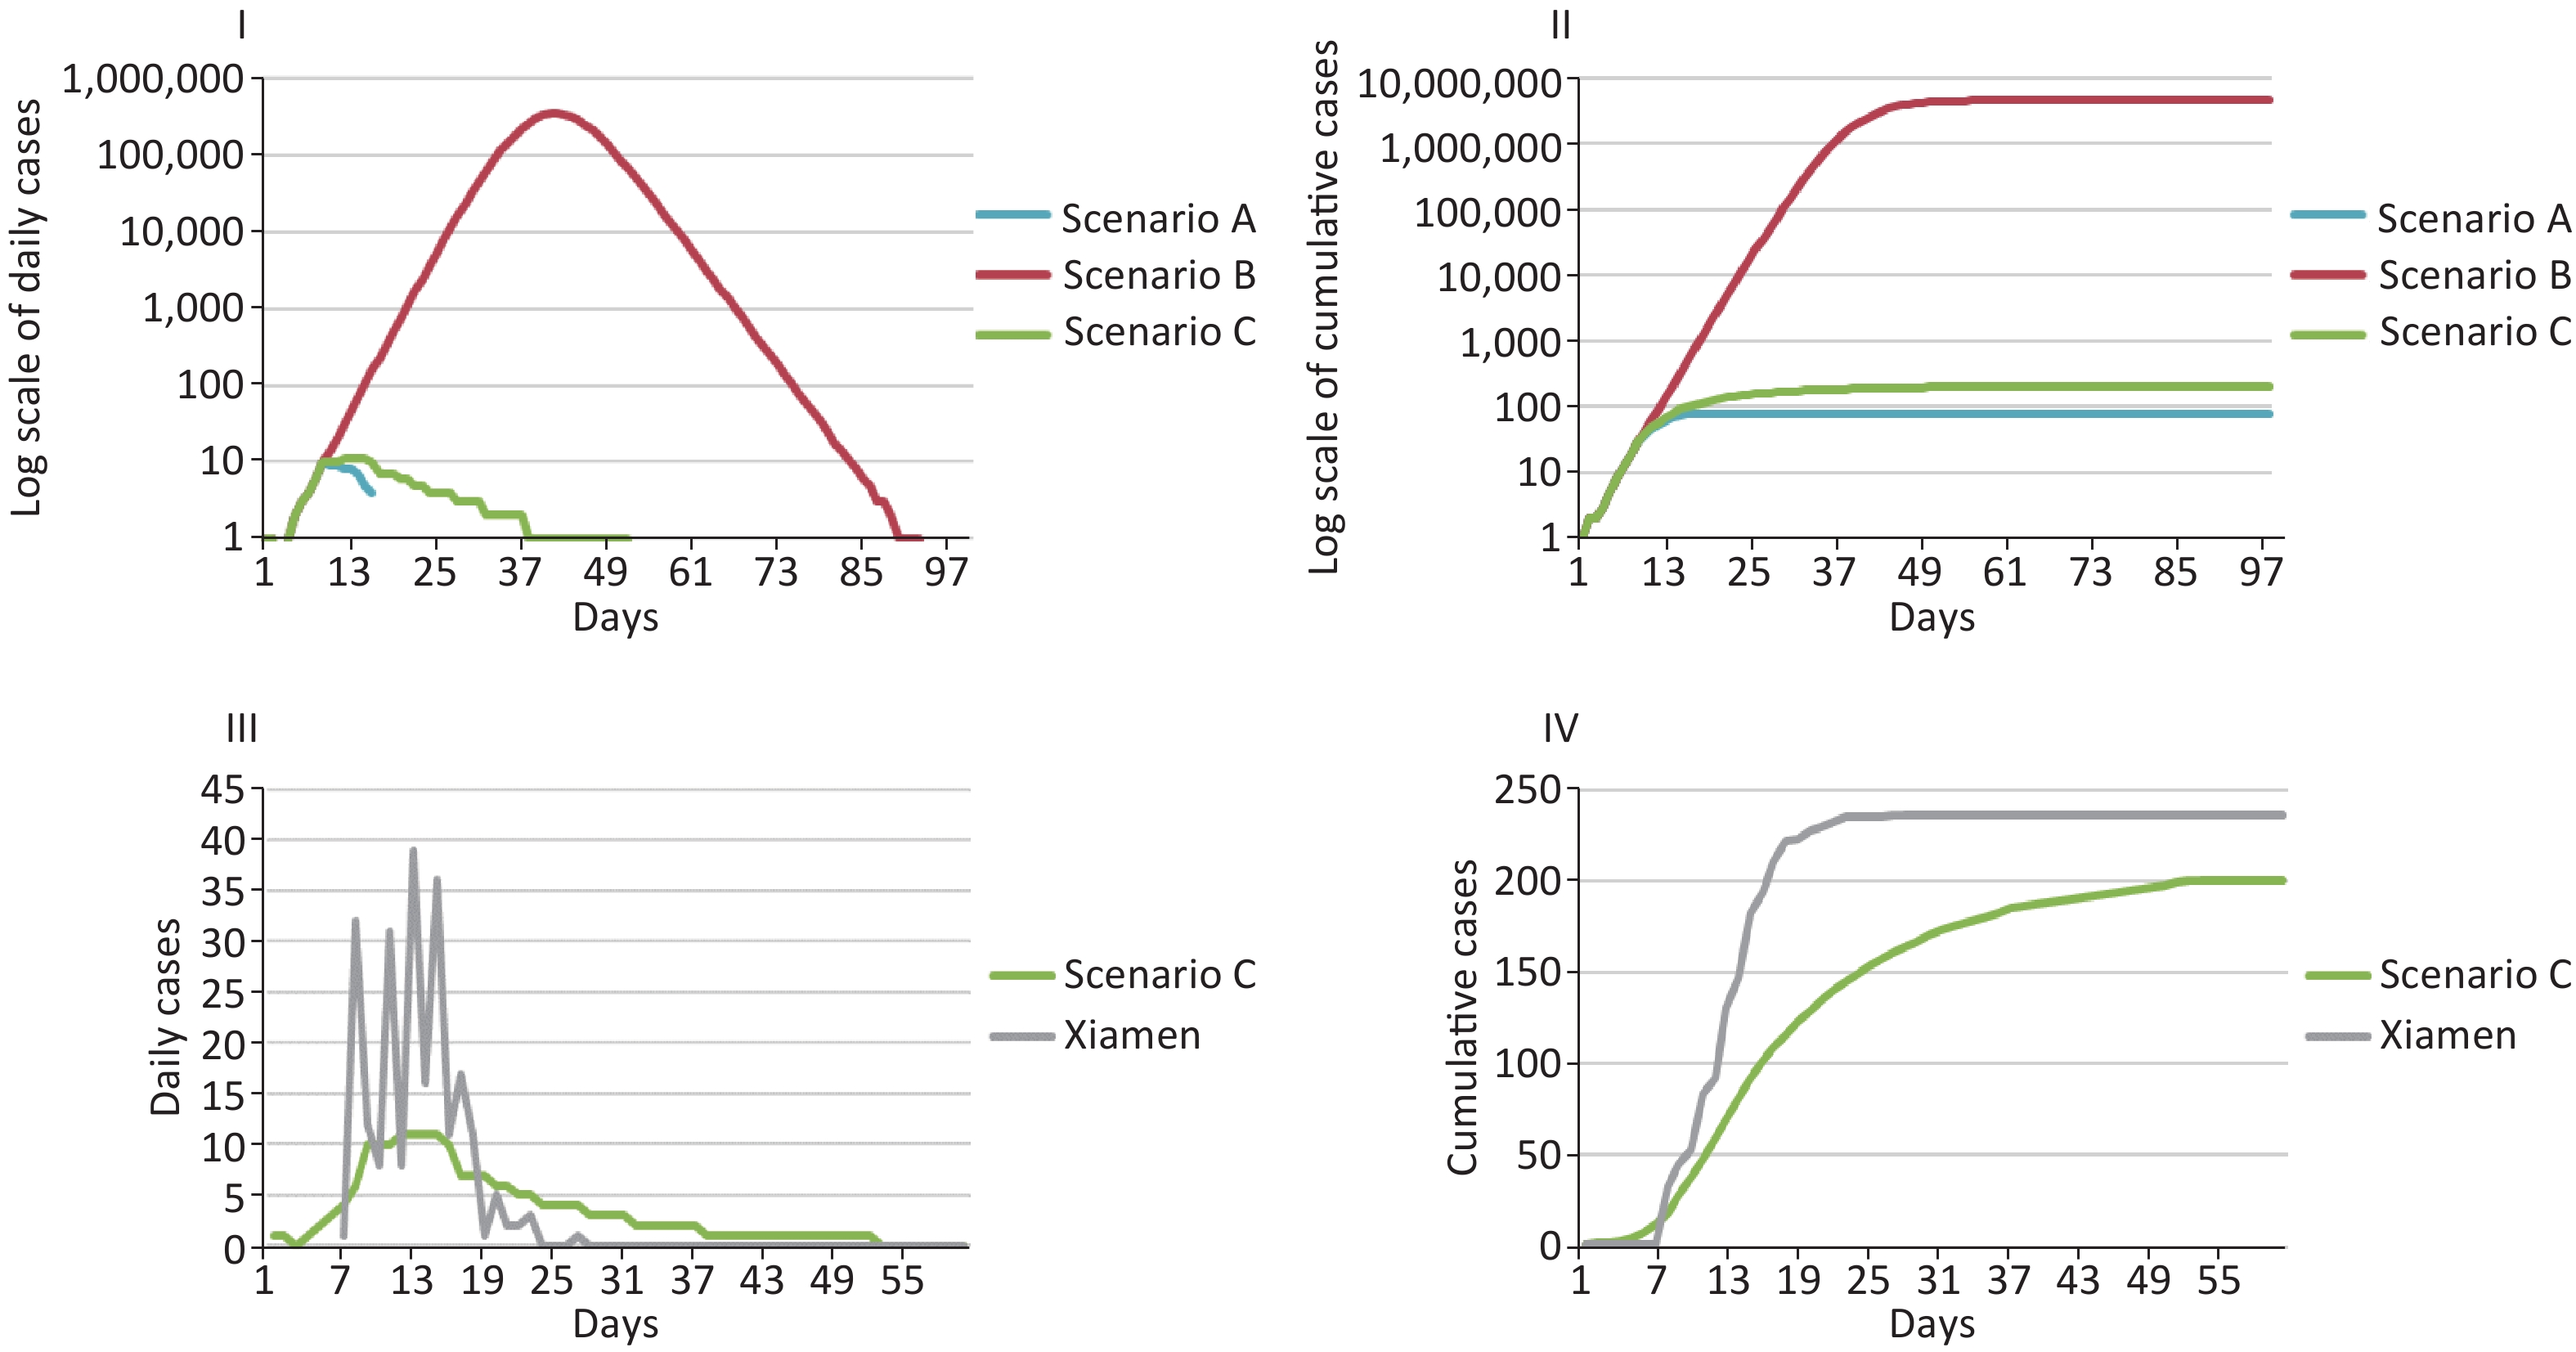
The Xiamen outbreak that started in September 2021 was selected as an example to demonstrate the partial function of our system. According to Xiamen Municipal Health Commission[18], the first case was imported on September 6, and the interventions were executed on 14. Hence, the imported case number (C1) on Day 1 was set as 1, and the days of the virus spreading freely (P8) were set as 8. The population of Xiamen is 5,163,970, according to the Xiamen Municipal Bureau of Statistics[19]. The virus variant (R1) was the Delta strain, and the diffusion environment (R2) was set to be the easiest to spread the virus because the first case was reported to be working in a confined and crowded factory before testing positive for SARS-CoV-2. For vaccines, the effectiveness (R3) and coverage (R4) were set as 30% and 77%, respectively, according to CDC expert experience and the report from Xiamen Municipal Health Commission[20]. With the above parameters unchanged, three intervention settings were implemented to generate three different scenarios. Scenario A had the strongest intervention combination and the largest P1–P7. Scenario B had no restrictions at all, with 0 for P1–P7. Scenario C had the settings closest to those carried on by the Xiamen government in the real world in this outbreak, with P1 as 2, P2–P6 as 1, and P7 as 3. The detailed definition of the intervention code is listed in Appendix A. The graphs in Figure 4 were scaled to give an overview of the epidemic trends for the three scenarios. For the measurement of the weight of interventions, the 95% confidence interval (CI) was calculated to represent the trends, as shown in Figure 3. Thus, the final predictions of the three scenarios also had corresponding 95% CIs. For comparability, the mean of the interval was only plotted in Figure 4. The epidemic curve of the Xiamen outbreak was also plotted to compare the simulated and real-world data.
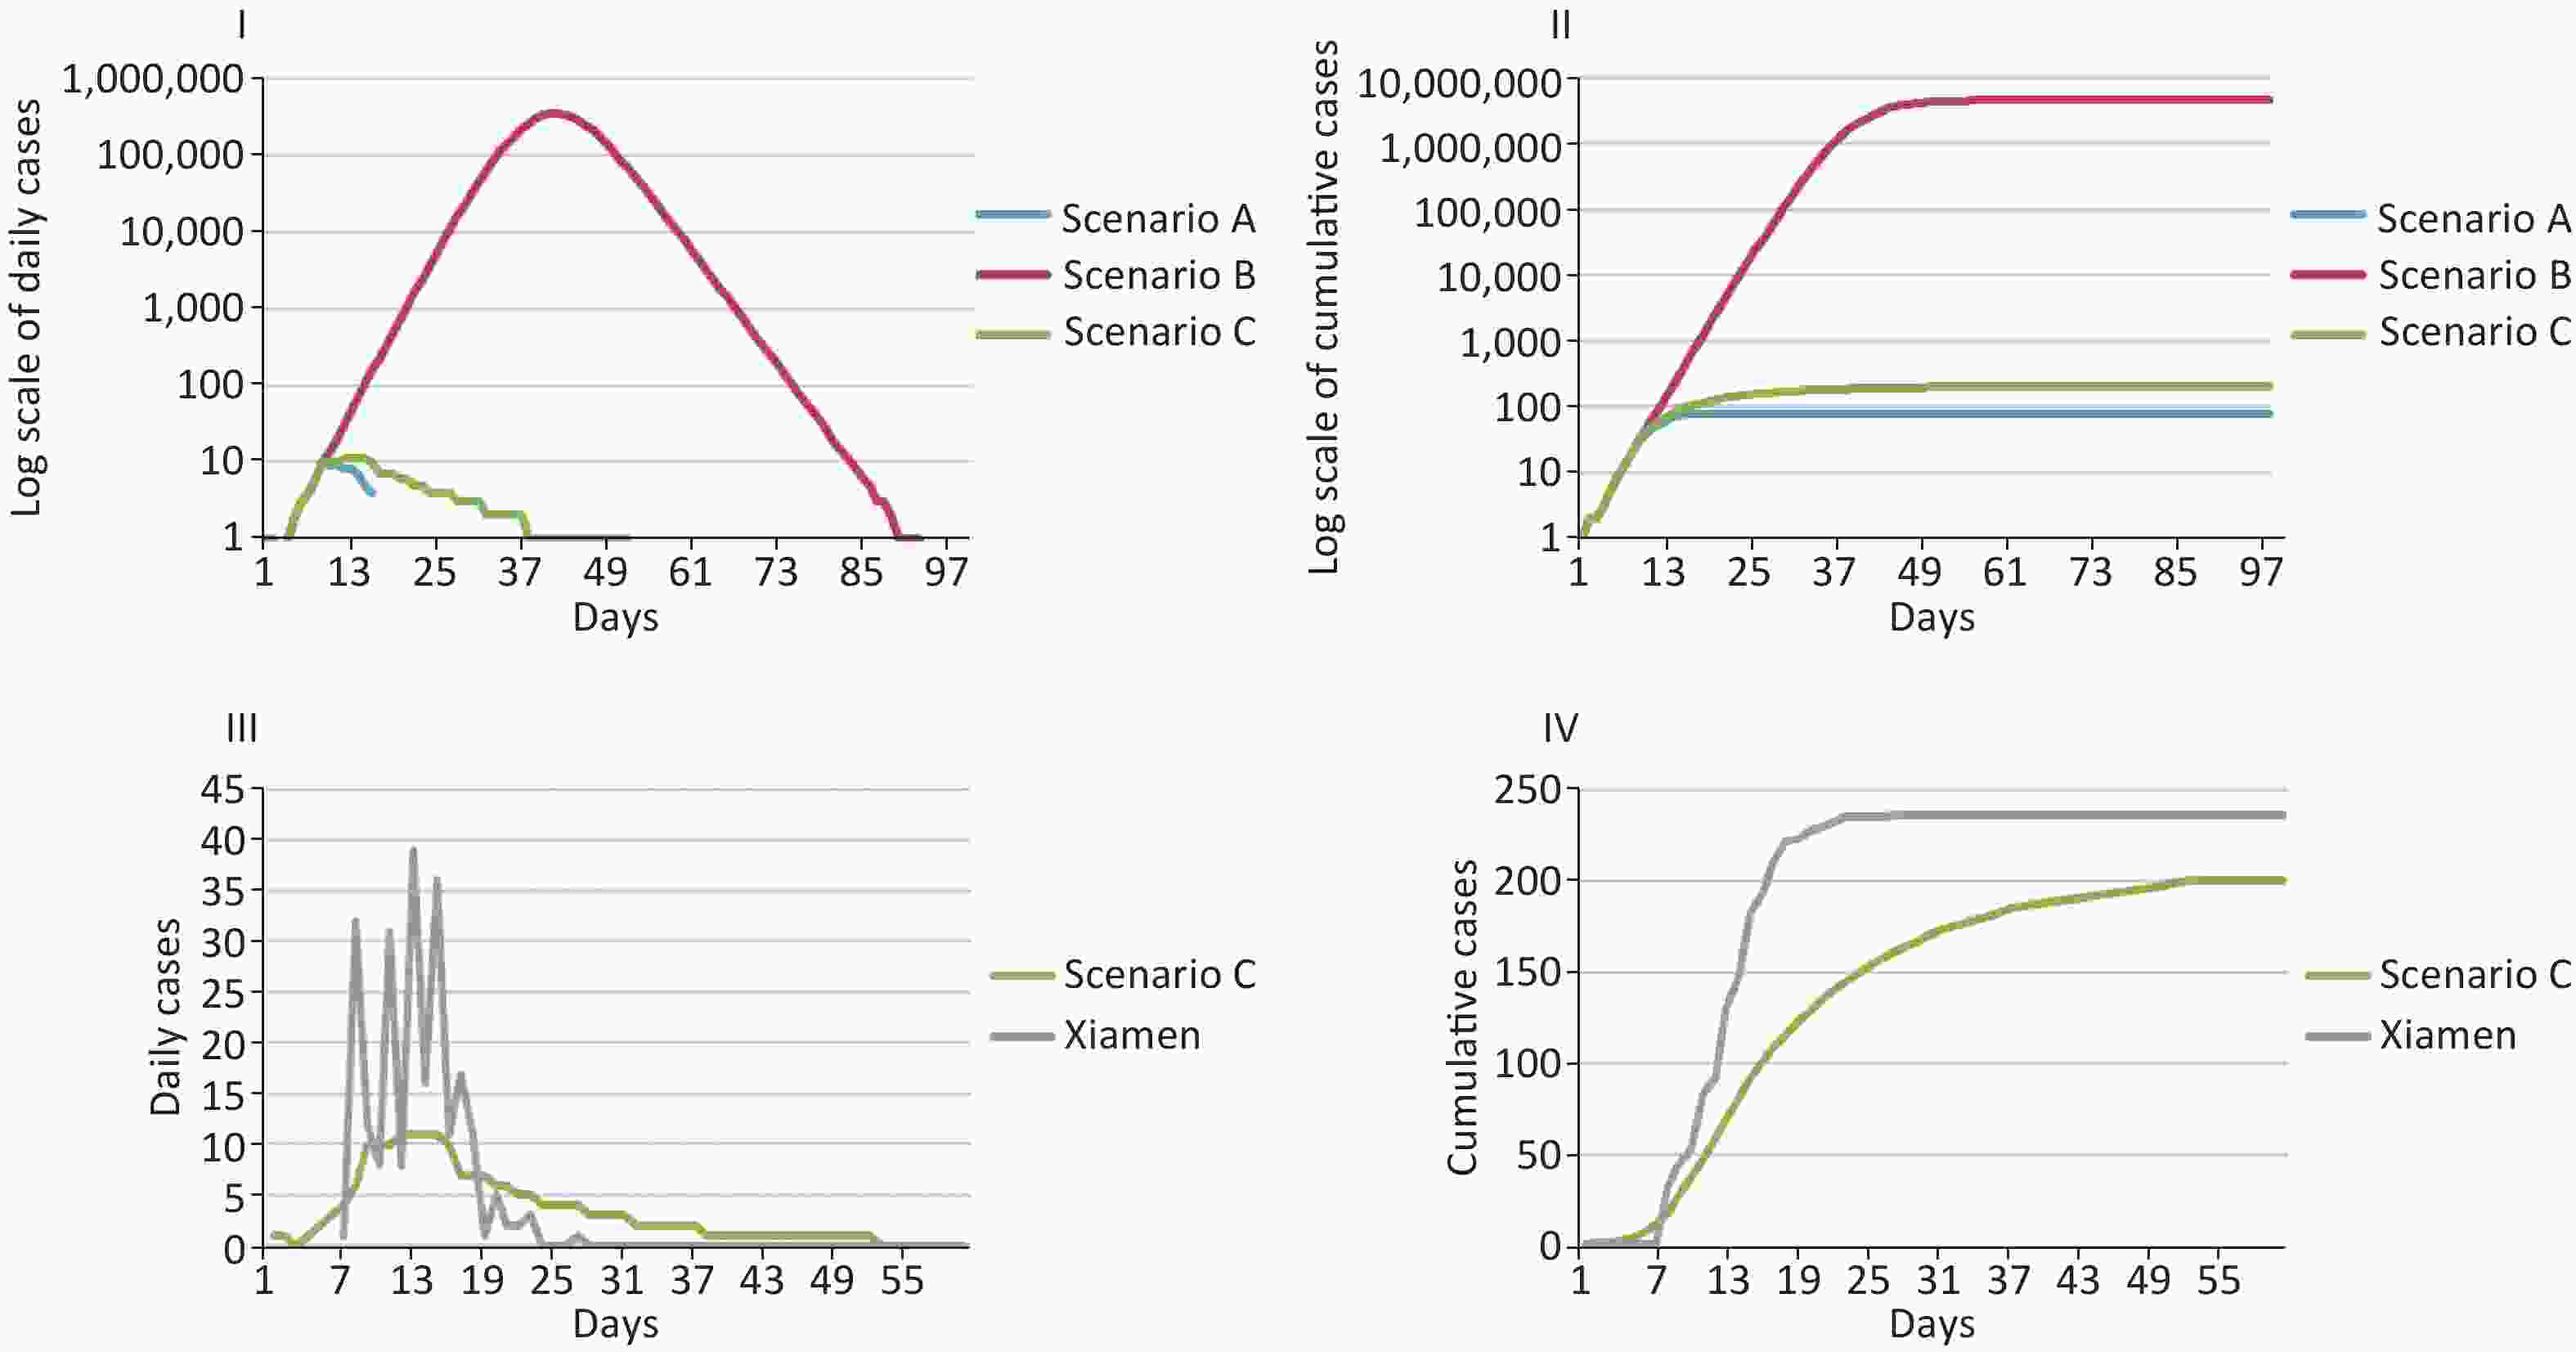
Figure 4. Epidemic trends of three scenarios and Xiamen outbreak after an imported case. (I) Daily cases of scenarios A, B, and C with a log scale. (II) Cumulative cases of scenarios A, B, and C with a log scale. (III) Daily cases of scenario C and the Xiamen outbreak. (IV) Cumulative cases of scenario C and the Xiamen outbreak.
-
The comparison among scenarios A, B, and C is plotted in Figures 4I and 4II. When all interventions were taken at the strictest level, the number of daily cases dropped to zero in the shortest time (16 days), and the cumulative number of cases was 78 at the end. Under no restrictions at all, the daily cases rose dramatically before reaching the peak, and the cumulative cases could reach a huge number of 4,614,641 on the 96th day. The result for the interventions of the Xiamen government was between the above two scenarios; that is, the cumulative cases dropped from 4,614,641 to 200, and the daily cases returned to zero 52 days after the first case was imported.
The comparison between scenario C and the real epidemic situation in the Xiamen outbreak is plotted in Figures 4III and 4IV. The Xiamen outbreak actually involved 236 people and ended on the 27th day[21]. Xiamen intensively reported confirmed cases in the early stage of the outbreak. Meanwhile, scenario C presented a smooth trend during this period with small case numbers. The duration of the Xiamen epidemic was 25 days shorter than the simulation result in scenario C, but the cumulative number of cases increased by 36.
-
We took the Xiamen outbreak as an example to verify the reliability and practicability of our model. According to the Xiamen Municipal Government’s announcement on October 2, the number of daily cases dropped to zero, and a total of 236 cases had been reported since September 12. Our simulated results showed that the cumulative number of cases was 36 fewer than the actual number and the deviation was within the 95% CI, consistent with the actual values. The actual duration of the Xiamen outbreak was 25 days shorter than the simulation result. A certain amount of time and process are needed for the deployment of intervention measures by the government up to the actual implementation. Therefore, the number of cumulative cases in the early outbreak of Xiamen was slightly greater than the number in the simulation. With the development of the epidemic, the Xiamen Municipal Government had continuously strengthened and adopted additional targeted interventions, such as expanding the number of people being tested and canceling dine-in services in some restaurants. The outbreak was more quickly brought under control than we expected in the model.
The duration of the COVID-19 outbreak can be affected by many factors, such as testing capacity, medical resources, and prevention strategies of each country[22]. However, China adopted targeted prevention and control measures that contributed to shortening the duration of the epidemic[23]. As observed in the Xiamen outbreak, China implemented targeted interventions in response to the pandemic according to the situation. For example, the first imported case was quickly observed and quarantined after entering Xiamen. The case’s living and travel histories were reported afterward, and close contacts were also quarantined. Owing to the sensitive surveillance system and sufficient epidemiological investigations in China, local outbreaks can be controlled within a relatively short time.
Since the outbreak of COVID-19, numerous studies on simulation or prediction models focusing on public data have been carried out[24]. However, the traditional curve fitting prediction method does not involve the characteristics of infectious diseases and, therefore, cannot predict ideal results[25]. Meanwhile, the transmission dynamics model considers various factors, such as the transmission mode of infectious diseases and policy interventions. Although the effects of different prevention and control measures have been documented, previous studies did not consider multiple intervention combinations and influencing factors such as vaccinations and viral variants. Here, we proposed a set of general tools that can be simulated and adjusted with different intervention combinations to help find the most suitable prevention and control methods for policymakers in a country or a region. We also added two more important interventions that were implemented in China for the following reasons. During an outbreak, the rapid identification of the quarantined population can quickly control the viral transmission to a certain group of people, thereby reducing the risk of continued transmission in the community. In addition, the speed of testing on these quarantined populations can determine the development of the spread and adjust other interventions in time. However, one of the limitations of our model is that it used global data, assumed homogeneity in population structure, and ignored differences between regions. Therefore, regional differences must be carefully considered when using the model. In addition, the accuracy of the model prediction depends on the quality and quantity of input data. The current structured database on intervention measures and epidemic control effects is helpful for modeling. However, when new mutant strains appear or when data such as their spread speed and vaccine effectiveness are lacking, the model cannot perform simulation. Therefore, data, parameters, and algorithms must be consistently updated according to the development and changes of the epidemic in real time. Our model established a connection to the real world and especially covered quarantine and testing for high-risk people interventions as common measures taken in China.
On the global pandemic data analysis and risk assessment platform, the machine learning methodology and web service for COVID-19 policy simulation are combined with the advantages of the transmission dynamics model to integrate multiple factors, such as policy stringent, vaccination, and speed of viral variants spread. This platform can adjust the parameters according to actual situations of different activity scenarios and participating groups and build a dynamic system that calculates the risk of transmission and evaluate the interventions’ effectiveness in an actual scenario. The output provides a scientific and reasonable basis for decision-making departments to maximize the benefits of activities and prevent the epidemic.
On the basis of the high-quality data monitored in actual time on this global platform, the changes in the epidemic situation in countries with which our country has economic and trade relations are presented in actual time. This feature can help us identify risks and take effective prevention and control measures to ensure the safety of our population. In the future, this technology will also help in the prevention and control of common infectious diseases and provide technical support for the prevention and control of emerging infectious diseases all over the world.
Conflicts of Interest The authors declare no conflict of interest.
HTML
Epidemic Simulation

Web Service
Parameters of Xiamen Outbreak
Simulation Results
Discussion
 22002Supplementary Materials.pdf
|

|

 Quick Links
 DownLoad: