


-
Organophosphorus pesticides (OPs) are extensively used for their high efficiency, broad spectrum, and low residue. However, the health hazards caused by long-term, low-dose exposure to OPs are easily ignored. Omethoate is a large class of OPs that is widely used in China. The inhibition of the cholinesterase (ChE) activity is the main toxicity mechanism of OPs, and such an activity is used as a biomarker of exposure to OPs[1].
Telomeres are composed of noncoding DNA repeats, telomere-binding proteins (TBPs), and telomerase, which gradually shorten during cell division. POT1-TIN2 Organizing Protein (TPP1), a kind of TBP, actively recruits telomerase to telomeres, protects chromosome ends, and regulates telomere length together with POT1[2]. TGF β-regulated and epithelial cell-enriched phosphatase 1 (TEP1), a mammalian telomerase-associated protein, is associated with telomerase activity and the telomerase reverse transcriptase, and it specifically interacts with telomerase RNA[3]. TEP1 and TPP1 are telomere-associated protein genes that participate in telomere length regulation and terminal protection to affect chromosome stability[4, 5]. In addition, studies have shown that telomere- associated proteins first affect chromosome stability and then change the expression level of ChE-related genes, thus affecting ChE production and degradation[6].
Single nucleotide polymorphism (SNP) is a common form of single-base mutation and can affect the mRNA expression levels of their genes or protein functions. So far, the correlations among the polymorphisms of TPP1, TEP1 genes, and the ChE activity are unclear. Therefore, this study explored the relationship between TPP1, TEP1 gene polymorphisms, and ChE activity.
A total of 180 workers exposed to omethoate for more than eight years were included in the exposure group. In addition, 115 healthy persons from a company in the same area without a history of exposure to omethoate or other toxicants comprised the control group. Individuals with histories of chronic diseases or other acute and chronic infections were excluded. People who smoked at least one cigarette a day for more than half a year were defined as smoking; people who drank alcohol more than twice a week in the last six months were defined as drinking. Demographic characteristics, occupational histories, and biological samples were collected by trained professionals. All subjects signed informed consent, and the study was approved by the Ethics Committee of Zhengzhou University.
In this study, whole blood, red blood cell, and plasma ChE activities were measured, and the damage induced by omethoate was represented by the red blood cell ChE activity. The detailed determination method could be seen in our previous study[7].
Eleven polymorphic loci of TEP1 rs1713449, TEP1 rs1760897, TEP1 rs1760903, TEP1 rs938886, TEP1 rs1760904, TEP1 rs4246977, TPP1 rs1800752, TPP1 rs3758978, TPP1 rs7488, TPP1 rs1128396, and TPP1 rs2555173 were screened through the HapMap, NCBI-SNP, and 1,000 Genomes databases or published works. PCR and single-base extension primers were designed by the Assay Designer 3.1 software and were synthesized by Thermo Fisher Scientific Co., Ltd, 2020 (Supplementary Table S1 available in www.besjournal.com). The SNPs were genotyped with a MassARRAY® matrix-assisted laser desorption/ionization time-of-flight mass spectrometry platform (Agena, Inc., 4.0 San Diego, CA, USA).
Gene SNP Primer Primer Sequence (5’–3’) TEP1 rs1713449 Forward ACGTTGGATGAAGAGTGGATGCCATAACCG Reverse ACGTTGGATGCTCTGTGTCTTATCAGCTGG UEP-SEQ GAGGGGTCAGAGCTTCTGGTGGTAACC rs1760897 Forward ACGTTGGATGTGTAGACTCTGGAACAAGGG Reverse ACGTTGGATGACATCCTCTCCTTGGAGAAC UEP-SEQ CCCCGTGCCTGGCCACCCTC rs1760903 Forward ACGTTGGATGGTCTGCTTAGGTAGCTCTTC Reverse ACGTTGGATGCAGATGCCTGGAAATCTGAC UEP-SEQ TCTGAAGAGGCCGCA rs938886 Forward ACGTTGGATGCCTCATTTTTGTGTGCCAGC Reverse ACGTTGGATGTTACCTGTGGTCCATTCTCC UEP-SEQ GGGTCTGCATTTGGCCAGGTTCCATAG rs1760904 Forward ACGTTGGATGATGCAGGCATCTCTTGTGTC Reverse ACGTTGGATGCCCCAGAAAAGTGGAAGAAG UEP-SEQ CAAGAAAAGTGGAAGAAGACTAATG rs4246977 Forward ACGTTGGATGCTCCATGACCTAATGACCTC Reverse ACGTTGGATGGAAACCCTAATCCCAATGCG UEP-SEQ ACCCAATGCGATGGTA TPP1 rs1800752 Forward ACGTTGGATGAGTCAAGCACTGAGTAAGCC Reverse ACGTTGGATGAGTCTGTGGGTCTCTACAGC UEP-SEQ CCTACAGCCCACTCACT rs3758978 Forward ACGTTGGATGGTTAGGGTGTTGAATGGGTC Reverse ACGTTGGATGTTTCTGTCCATCCCAACTCC UEP-SEQ CCCACCTCCTGCGATCATTTGAC rs7488 Forward ACGTTGGATGTGTGCCTACCTCTAGCATTG Reverse ACGTTGGATGAACGGTCTTGGAAAGGAAGG UEP-SEQ AAACTGGCCATTTCAATACTA rs1128396 Forward ACGTTGGATGTTCTCAACCCAAGGCTCTAC Reverse ACGTTGGATGTGAAAACGTCCACACCCTTC UEP-SEQ CTTCCATACTTACATCAAAGAG rs2555173 Forward ACGTTGGATGATGGCTACGGCAGCGCAGTT Reverse ACGTTGGATGATAGTGGATCTGCGGGTTAG UEP-SEQ CAGGGCGGAGACCGA Note. Forward: upstream primer, Reverse: downstream primer, UEP-SEQ: single base extension primer. Table S1. The primer sequences of polymorphic loci
All statistical analyses were conducted using SPSS 21.0 software (SPSS Inc., Chicago, IL, USA). The independent samples t-test was performed to compare the ChE activity between the exposure and control groups. Covariance was used to analyze the effects of genetic polymorphisms on the ChE activity, and the Dunnett method was employed to perform the comparisons between the two groups. Generalized linear models (GLMs) were used to determine the influencing factors of the ChE activity. All statistical tests were two-sided, and the statistical significance level was set at α = 0.05.
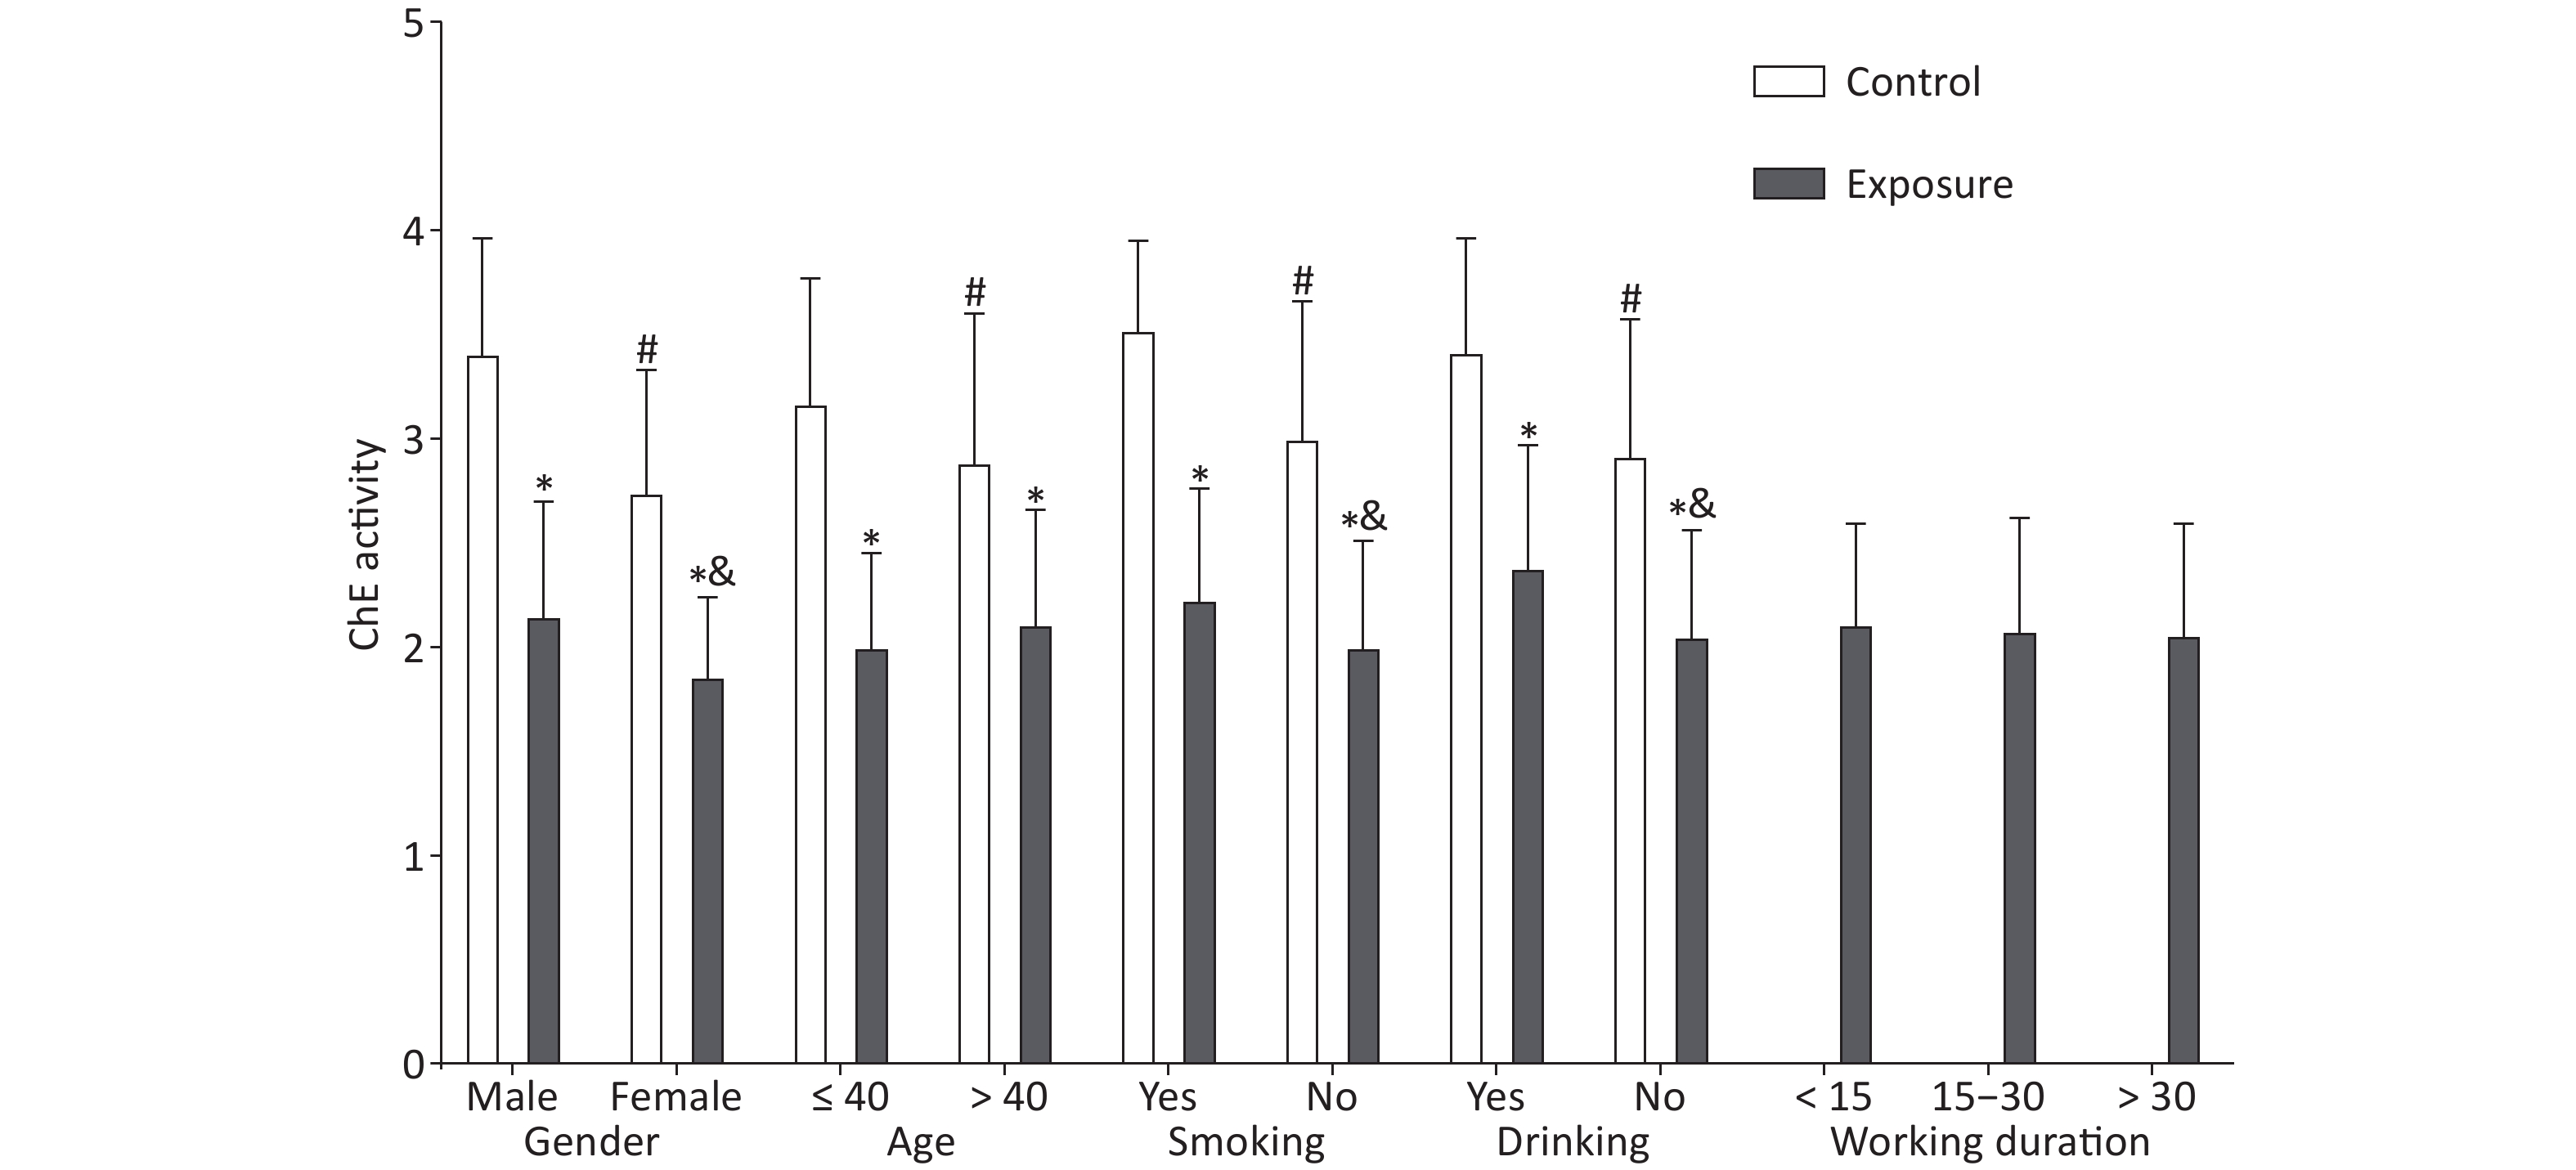
Significant differences were observed in demographic characteristics, including gender, age, smoking, and drinking (P < 0.001), comparing the exposure and control groups (Supplementary Table S2 available in www.besjournal.com), which were described in detail in our previous study[8]. The red blood cell ChE activity in the exposure group was lower than that in the control group (2.09 ± 0.52 vs. 3.06 ± 0.65, P < 0.001) (Supplementary Table S3 available in www.besjournal.com). As illustrated in Figure 1, gender, age, smoking, and drinking had an effect on the red blood cell ChE activity (P < 0.05); in the exposure group, the ChE activity was associated with gender, smoking, and drinking (P < 0.05). However, age and working duration had no effect on the ChE activity in the exposure group (P > 0.05) (Supplementary Table S4 available in www.besjournal.com).
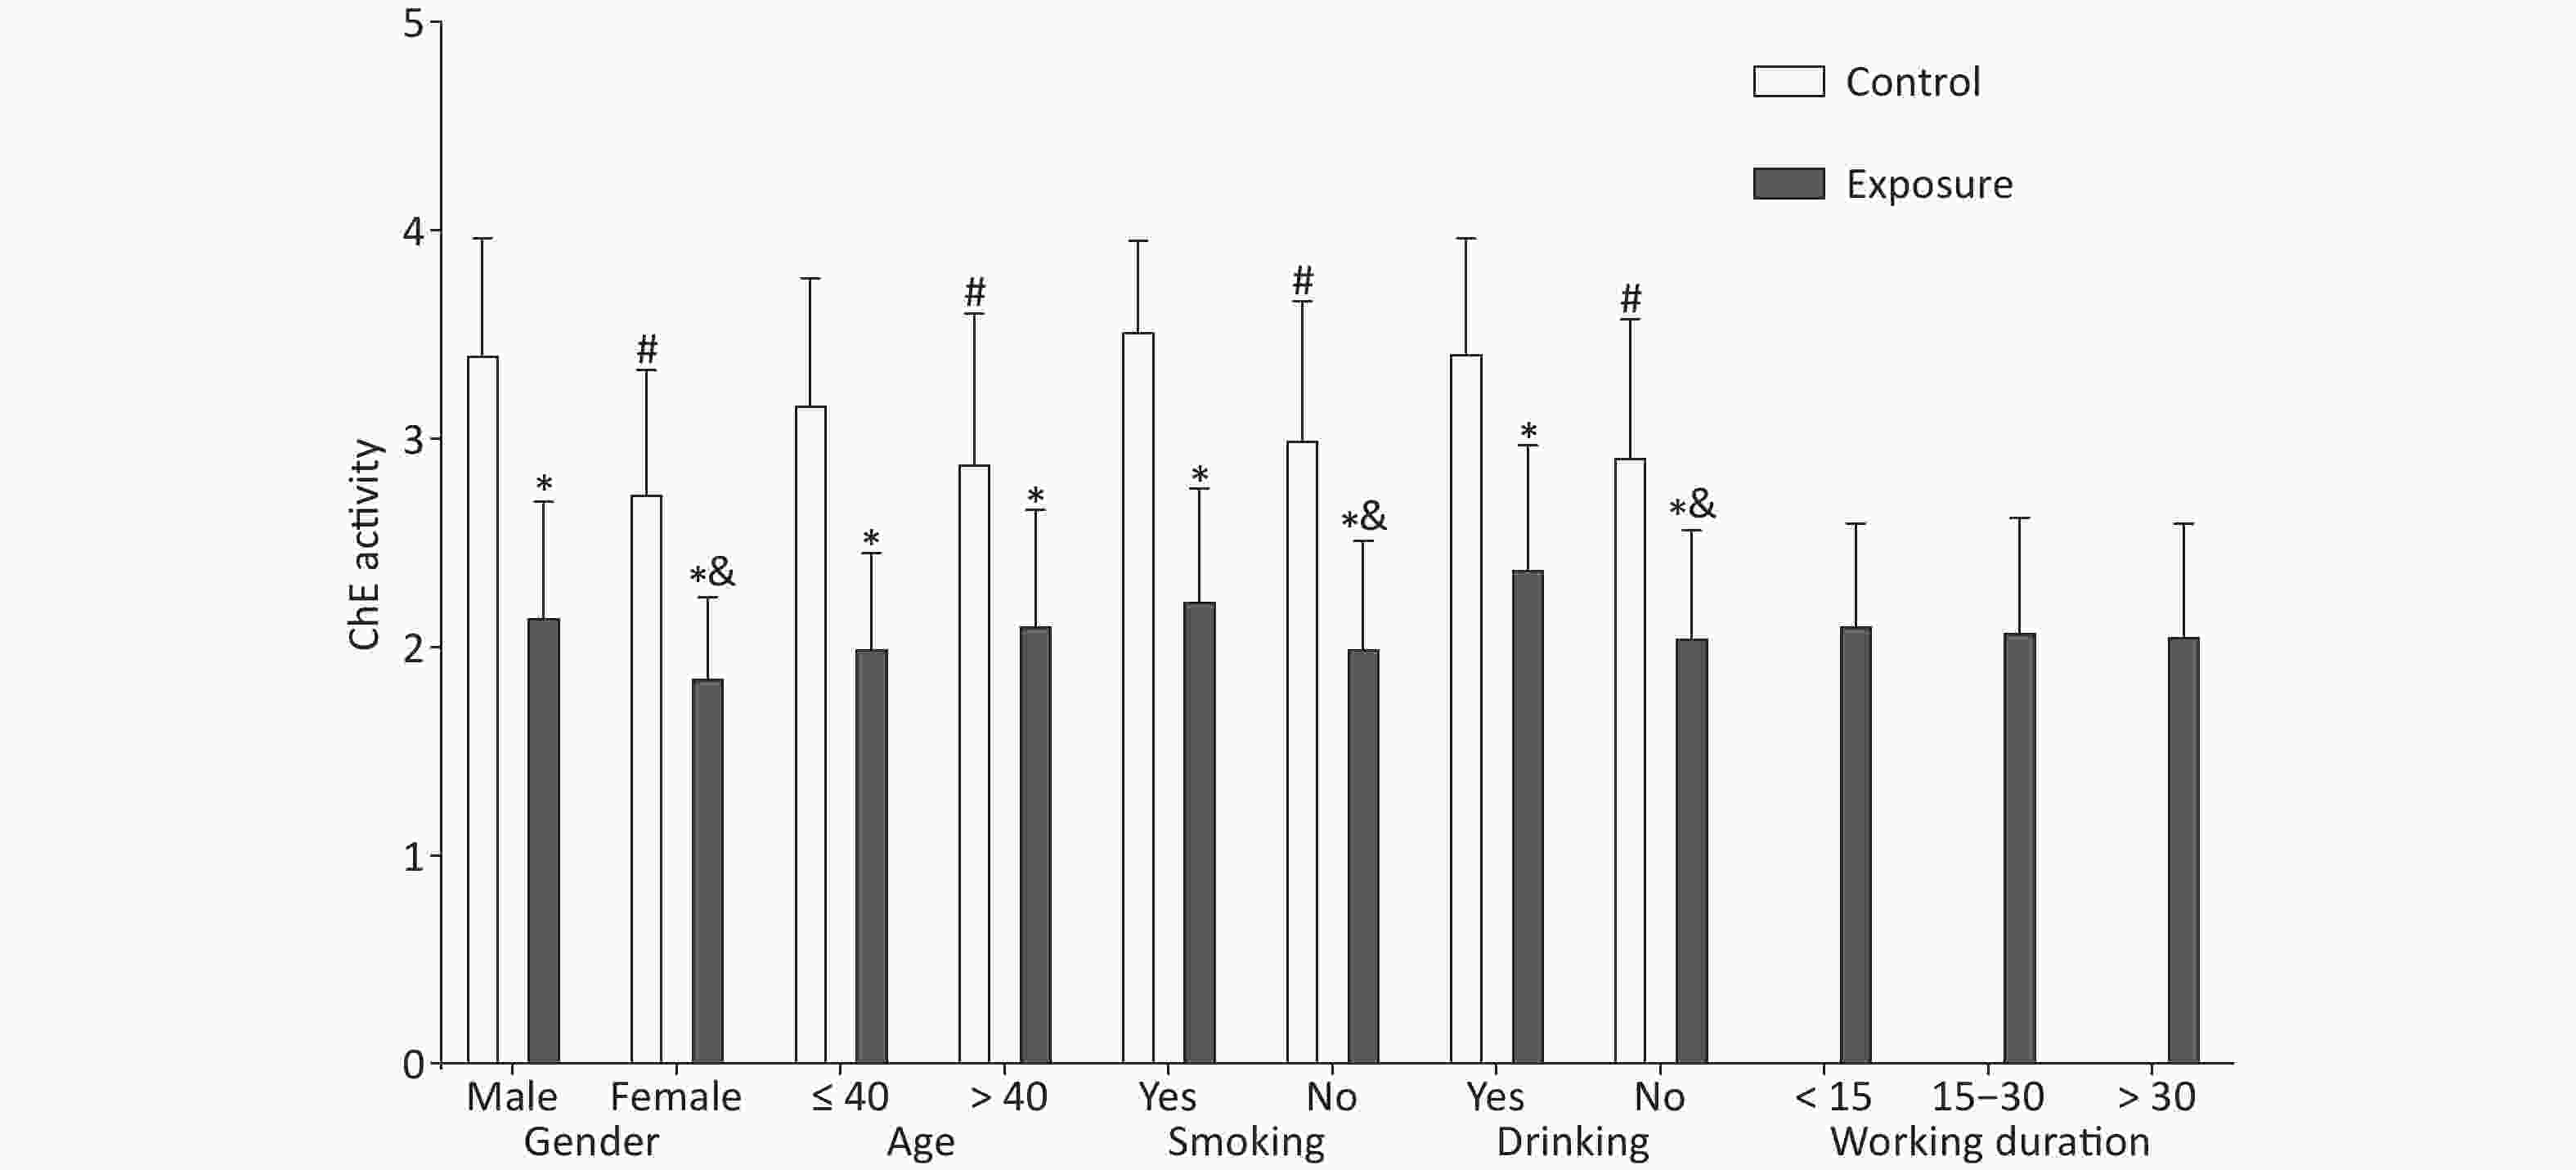
Figure 1. Effect of demographic characteristics on cholinesterase activity. The independent samples t-test was utilized to compare the ChE activity between the exposure and control groups. *The difference in the ChE activity between both groups after stratification was statistically significant. #The difference in the control group was statistically significant. &The difference in the exposure group was statistically significant.
Variables Control (n = 115) Exposure (n = 180) χ2 P Gender Male 54 (47.0) 137 (76.1) 26.130 < 0.001* Female 61 (53.0) 43 (23.9) Age < 40 67 (58.3) 53 (29.4) 24.146 < 0.001* ≥ 40 48 (41.7) 127 (70.6) Smoking Yes 12 (10.4) 63 (35.0) 22.333 < 0.001* No 103 (89.6) 117 (65.0) Drinking Yes 30 (26.1) 16 (8.9) 15.769 < 0.001* No 85 (73.9) 164 (91.1) Working duration < 15 26 (14.4) 15–30 117 (65.0) > 30 37 (20.6) Note. The χ2 test was utilized to compare the general characteristics of exposure and control groups. *The difference was statistically significant. Table S2. General characteristics of exposure and control group, n (%)
Variables Control Exposure t P Whole blood ChE activity 3.89 ± 0.80 2.47 ± 0.53 16.790 < 0.001* Red blood cells ChE activity 3.06 ± 0.65 2.09 ± 0.52 13.485 < 0.001* Plasma ChE activity 0.82 ± 0.24 0.38 ± 0.21 16.621 < 0.001* Note. The independent-samples t-test was utilized to compare the ChE activity between the exposure and control group. ChE: Cholinesterase activity. *The difference was statistically significant. Table S3. The comparison of cholinesterase activity between exposed group and control group
Variables Exposure Control t P n $\bar{{x} }\pm {s}$ n $\bar{x} \pm {s}$ Gender Male 137 2.16 ± 0.54 54 3.42 ± 0.54 14.504 < 0.001* Female 43 1.87 ± 0.37 61 2.75 ± 0.58 9.351 < 0.001* t 3.920 6.333 P < 0.001# < 0.001# Age ≤ 40 53 2.01 ± 0.44 67 3.18 ± 0.59 12.332 < 0.001* > 40 127 2.12 ± 0.54 48 2.90 ± 0.70 6.921 < 0.001* t 1.426 −2.273 P 0.157 0.025# Smoking Yes 63 2.24 ± 0.52 12 3.53 ± 0.42 8.037 < 0.001* No 117 2.01 ± 0.50 103 3.01 ± 0.65 12.029 < 0.001* t 2.995 3.803 P 0.003# 0.001# Drinking Yes 16 2.39 ± 0.58 30 3.43 ± 0.53 6.102 < 0.001* No 164 2.06 ± 0.50 85 2.93 ± 0.64 10.871 < 0.001* t 2.483 3.081 P 0.014# < 0.001# Working < 15 26 2.12 ± 0.47 duration 15–30 117 2.09 ± 0.53 > 30 37 2.07 ± 0.52 F 0.066 P 0.936 Note. *Indicates the comparisons of ChE activity between exposure group and control group after stratification; #Represents the comparisons among the layers after stratification. Table S4. The effects of sex, age, smoking, drinking and working duration on ChE activity
The genotypic distribution of each polymorphic locus accorded with Hardy-Weinberg balance (P > 0.05) indicated that the selected samples were representative. We analyzed the differences in the ChE activity between different genotypes of TPP1 and TEP1 polymorphisms (Table 1). The CT and CC genotypes of TPP1 rs1800752 had a similar ChE activity, so they were combined. TPP1 rs3758978, TPP1 rs7488, and TPP1 rs1128396 were the same. The ChE activity of the TPP1 rs1800752 CT + CC genotype was lower than that of the TT genotype (2.02 ± 0.54 vs. 2.18 ± 0.46, P = 0.006). The ChE activity of the TPP1 rs3758978 CG + GG genotype was lower than that of the CC genotype (2.01 ± 0.54 vs. 2.19 ± 0.46, P = 0.003). The ChE activity of the TPP1 rs1128396 AT + TT genotype was lower than that of the AA genotype (2.00 ± 0.53 vs. 2.17 ± 0.50, P = 0.002). Moreover, the ChE activity of the TPP1 rs2555173 AC + AA genotype was lower than that of the CC genotype (2.03 ± 0.55 vs. 2.13 ± 0.49, P = 0.037). No significant difference in genotypes was found in other loci (P > 0.05). C Gu et al.[5] identified that TEP1 rs1760904 AG/AA genotypes were significantly associated with a decreased risk of prostate cancer compared with the GG genotype. However, we found no statistically significant difference among the different genotypes of TEP1 rs1760904.
SNP n# Control P n# Exposure P $\bar{{x} }\pm {{s} }$ $\bar{{x} }\pm {{s} }$ TEP1 rs1713449 TT 16 2.77 ± 0.59 Ref 27 2.02 ± 0.53 Ref CT 48 3.08 ± 0.62 0.136 59 2.06 ± 054 0.851 CC 49 3.13 ± 0.70 0.057 92 2.12 ± 0.50 0.669 CT+CC 113 3.10 ± 0.66 0.067 151 2.10 ± 0.52 0.724 TEP1 rs1760897 CC 6 3.20 ± 0.61 Ref 10 2.02 ± 0.40 Ref CT 38 3.01 ± 0.67 0.650 62 2.01 ± 0.51 0.789 TT 67 3.09 ± 0.67 0.727 106 2.14 ± 0.53 0.635 CT+TT 105 3.06 ± 0.66 0.691 168 2.09 ± 0.52 0.845 TEP1 rs1760903 TT 48 2.97 ± 0.66 Ref 64 2.02 ± 0.46 Ref CT 44 3.17 ± 0.68 0.311 79 2.12 ± 0.56 0.523 CC 21 3.09 ± 0.60 0.446 36 2.14 ± 0.51 0.450 CT+CC 65 3.14 ± 0.65 0.273 115 2.12 ± 0.54 0.432 TEP1 rs938886 CC 12 2.97 ± 0.64 Ref 24 1.99 ± 0.53 Ref CG 48 3.07 ± 0.62 0.973 60 2.06 ± 0.55 0.632 GG 50 3.12 ± 0.69 0.589 90 2.13 ± 0.50 0.492 CG+GG 98 3.10 ± 0.65 0.750 150 2.10 ± 0.52 0.521 TEP1 rs1760904 CC 46 2.98 ± 0.66 Ref 64 2.01 ± 0.46 Ref CT 46 3.16 ± 0.67 0.319 76 2.14 ± 0.56 0.345 TT 21 3.05 ± 0.62 0.803 37 2.12 ± 0.53 0.559 CT+TT 67 3.13 ± 0.65 0.392 113 2.13 ± 0.55 0.346 TEP1 rs4246977 TT 59 3.01 ± 0.70 Ref 75 2.06 ± 0.52 Ref CT 50 3.11 ± 0.60 0.507 81 2.09 ± 0.50 0.292 CC 5 3.21 ± 0.67 0.437 20 2.18 ± 0.60 0.269 CT+CC 55 3.12 ± 0.60 0.418 101 2.11 ± 0.52 0.212 TPP1 rs1800752 TT 43 3.06 ± 0.62 Ref 70 2.18 ± 0.46 Ref CT 56 3.10 ± 0.69 0.762 80 2.01 ± 0.56 0.007* CC 12 3.04 ± 0.61 0.805 27 2.04 ± 0.51 0.098 CT+CC 68 3.09 ± 0.67 0.849 107 2.02 ± 0.54 0.006* TPP1 rs3758978 CC 45 3.02 ± 0.63 Ref 71 2.19 ± 0.46 Ref CG 55 3.09 ± 0.69 0.665 80 2.01 ± 0.55 0.004* GG 12 3.04 ± 0.61 0.916 27 2.04 ± 0.51 0.080 CG+GG 67 3.08 ± 0.68 0.730 107 2.01 ± 0.54 0.003* TPP1 rs7488 AA 95 3.06 ± 0.66 Ref 140 2.11 ± 0.51 Ref AG 16 3.09 ± 0.65 0.303 35 2.00 ± 0.55 0.605 GG 0 0 3 2.04 ± 0.16 0.895 AG+GG 16 3.09 ± 0.65 0.303 38 2.00 ± 0.53 0.646 TPP1 rs1128396 AA 59 3.04 ± 0.64 Ref 95 2.17 ± 0.50 Ref AT 45 3.11 ± 0.69 0.676 66 2.00 ± 0.53 0.004* TT 8 3.02 ± 0.66 0.516 14 2.02 ± 0.56 0.093 AT+TT 53 3.09 ± 0.68 0.856 80 2.00 ± 0.53 0.002* TPP1 rs2555173 CC 62 3.06 ± 0.66 Ref 102 2.13 ± 0.49 Ref AC 44 3.09 ± 0.66 0.791 65 2.05 ± 0.55 0.097 AA 8 2.97 ± 0.71 0.571 11 1.87 ± 0.55 0.037* AC+AA 52 3.07 ± 0.66 0.681 76 2.03 ± 0.55 0.037* Note. The covariance was obtained to compare the difference in the ChE activity among the genotypes, adjusted for gender, age, smoking, drinking, and working duration. Ref: The reference group for comparing different genotypes. SNP: Single nucleotide polymorphism. #Some samples were missing due to limitations of detection methods. *The difference was statistically significant Table 1. Relationships between genetic polymorphism and ChE activity
The factors affecting the ChE activity of workers exposed to omethoate were analyzed using GLMs. The adjusted age, smoking, working duration, drinking, omethoate exposure, gender, and interaction between the TPP1 rs3758978 CC genotype and omethoate exposure might be the influencing factors of the ChE activity of omethoate-exposed workers (P < 0.05) (Table 2). The ChE activity of females was lower than that of males, indicating that women were more susceptible to omethoate than men. Drinking might be another potential protective factor in the ChE activity, which was similar to the finding that moderate alcohol consumption could increase antioxidant activity[9], suggesting that drinking might have played a similar role in workers exposed to omethoate. Hernandez et al.[10] evaluated pesticide-induced oxidative stress and found an interaction between pesticide exposures and genes. They suggested that the interaction between these genes and the pesticides may play a key role in the development of many chronic and degenerative diseases.
Parameter β (95% CI) χ2 P Constant 2.808 (2.556, 3.061) 474.301 < 0.001* Drinking 0.271 (0.078, 0.463) 7.615 0.006* Exposure −0.903 (−1.235, −0.571) 28.392 < 0.001* Female −0.408 (−0.555, −0.262) 29.918 < 0.001* TPP1 rs3758978 CC −0.034 (−0.229, 0.161) 0.114 0.736 Exposure ×
rs3758978 CC0.250 (0.001, 0.499) 3.867 0.049* Note. Adjusted for age, smoking, and working duration by using the GLM method. GML: Generalized linear models. *The difference was statistically significant. Table 2. Influencing factors of the ChE activity
This study observed an interaction of telomere-associated protein genes and environmental factors that affects human health, thereby providing clues for the screening of susceptible workers exposed to omethoate and the mechanism of inheritance variation. However, this research has some limitations. First, it is a cross-sectional study, which may require further follow-up to confirm its correlation. Second, the OPs were metabolized and excreted in the urine, usually within 24−48 hours of exposure. Therefore, the relationship of urinary metabolites with the ChE activity and gene polymorphism may need to be further evaluated.
In conclusion, this study suggests that drinking, omethoate exposure, gender, and the interaction between the TPP1rs3758978 CC genotype and omethoate exposure may be the influencing factors of the ChE activity of omethoate-exposed workers.
No potential conflicts of interest were disclosed.
The authors express their gratitude to all the individuals who volunteered to participate in this study.
FAN Ya Hui, data analysis and manuscript drafting; LI Xin Ling, LIU Xiao Hua, GUO Zhi Feng, and YAN Meng Qing, project investigation and quality control; DUAN Xiao Ran, experiment; MIAO Wen Bin, manuscript revision; WANG Wei, funding acquisition and project design; all authors commented on the article before submission.
HTML
 21431Supplementary Materials.pdf
|

|

 Quick Links
 DownLoad: