


-
Heart failure (HF) is a serious and advanced stage of heart disease that has remained a major public health threat despite advances in medical therapy. HF prevalence in developed countries is 1.5%–2.0% and significantly increases with age, with a reported HF prevalence of ≥ 10% in patients aged > 70 years[1]. Moreover, HF is associated with poor quality of life and has a five-year mortality rate of up to 50%[2]. HF is a complex syndrome involving different pathophysiological pathways (e.g., remodeling, myocardial injury, fibrosis, and inflammation), the components of which can be reflected by some biomarkers. The most used diagnostic and prognostic HF biomarker is the N-terminal B-type natriuretic peptide precursor (NT-proBNP) due to its longer plasma half-life and less biological variation compared to the B-type natriuretic peptide precursor (BNP)[3]. There has been extensive research on other biomarkers, including cystatin C (Cys-C) and free triiodothyronine (FT3), with prognostic value in patients with HF. When HF occurs, renal insufficiency activates the renin-angiotensin-aldosterone and sympathetic nervous systems, resulting in fluid retention, increasing cardiac preload, and aggravating pump failure. Cys-C is an early indicator of kidney injury that is involved in the pathological process of HF development. In patients with HF, chronic tissue hypoxia, gastrointestinal mucosal and liver congestion, and reduced protein intake and synthesis will lead to hypermetabolic thyroxine disorder, increasment of thyroxine receptor level, and inhibition of T4 transformation into T3, resulting in the increase of T3 clearance rate and decrease in plasma T3 level.
Cys-C is not only an appropriate early biomarker of renal impairment, but also an inflammatory biomarker involved in the process of cardiac fibrosis in patients with HF. Cys-C can selectively inhibit cysteine protease activity, reduce elastic fiber degradation in cardiomyocytes, and increase myocardial collagen fiber destruction, which disturbs cardiac structure and function [4]. In addition, Cys-C may inhibit the degradation of tissue inhibitor of metalloproteinases-1 and osteopontin, promoting myocardial fibrosis and aggravating ventricular remodeling [5]. Clinically, plasma Cys-C levels are associated with left ventricular hypertrophy, diastolic dysfunction, and mortality in patients with HF [6]. Several studies have reported the prognostic value of baseline Cys-C levels with respect to rehospitalization and all-cause mortality in acute decompensated and chronic HF [7].
Thyroid hormone abnormalities, including thyroid function hyperfunction, hypothyroidism, and low T3 syndrome, can influence the clinical manifestations and outcomes of cardiovascular disease. Among the thyroid hormones, FT3 and FT4 are more sensitive and clinically relevant than T3 and T4 since the former are the physiologically active forms of the latter [8]. Reduced FT3 levels are associated with increased cardiovascular morbidity and mortality (including for HF) [9]. There are several possible mechanisms underlying the influence of low FT3 levels on the prognosis of patients with HF. First, insufficient FT3 transformation causes increased oxidative stress damage of the endoplasmic reticulum and impaired adenosine triphosphate (ATP) utilization by cardiomyocytes, which results in myocardial fibrosis, ventricular remodeling, myocardial perfusion, and metabolic abnormalities, leading to impaired systolic function in patients with HF [10]. Second, there are specific T3 receptors in the myocardium. The low FT3 levels possibly decrease myocardial contractility and increase susceptibility to arrhythmia, which could cause death in patients with HF [9].
In the present study, it was hypothesized that the Cys-C/FT3 ratio would be a useful prognostic predictor for the long-term outcome in HF patients and that combining this ratio with NT-proBNP would further improve risk stratification.
Clinical data from patients with HF hospitalized in the Department of Cardiology, Shengjing Hospital of China Medical University, Shenyang, China between 2013 and 2018 were retrospectively collected. HF was diagnosed based on clinical signs and symptoms, echocardiography, and laboratory test results, as recommended by the 2016 ESC Guidelines [3]. Based on the cardiac function classification published by the New York Heart Association, heart function was categorized into levels II–IV. Furthermore, HF with reduced ejection fraction (HFrEF), mid-range left ventricular ejection fraction [LVEF] (HFmrEF), and preserved LVEF (HFpEF) was defined as having an LVEF of < 40%, ≥ 40% LVEF < 50%, and ≥ 50%, respectively. All patients were enrolled with informed consent, the study was approved by the Shengjing Hospital of China Medical University Ethics Committee and conducted according to the principles of the Declaration of Helsinki. The ethics approval number is 2019PS594K.
In the retrospective cohort, all laboratory tests using fasting peripheral venous blood samples were performed on the day of admission or the morning after admission. The LVEF was determined through echocardiography using the biplane Simpson method within 3 days of admission. In December 2020, each patient’s survival status was investigated using the population death information registration management system of the Disease Control and Prevention Center of Liaoning Province. Additionally, cardiac and non-cardiac death was determined based on the International Classification of Diseases code of death diagnosis. In case information was unavailable in the system, data were obtained from the patients’ medical records, physicians, or relatives via telephone. Efforts were made to determine the nature of death in each case. The median follow-up duration was 3.2 (2–8) years.
Normally and non-normally distributed quantitative variables were compared using one-way analysis of variance and the Mann-Whitney U-test, respectively, and expressed as the mean ± standard deviation and median (interquartile range), respectively. Categorical variables were compared using the chi-square test and presented as counts and proportions (%). The relationship between variables and survival was assessed using univariate and multivariate Cox regression models and reported as the hazard ratio (HR) [95% confidence interval (CI)]. C statistics were used to quantify the ability of the Cys-C/FT3 ratio to identify patients who died. Additionally, continuous net reclassification improvement (NRI) and integrated discrimination improvement (IDI) analyses were performed to assess the incremental prognostic value of the Cys-C/FT3 ratio. Effects of the Cys-C/FT3 ratio and NT-proBNP levels on survival were represented using the Kaplan-Meier curves. Comparisons were made using the log-rank test. The area under the receiver operating characteristic (AUROC) curve was used to determine whether the Cys-C/FT3 ratio in combination with the NT-proBNP level could predict cardiovascular and all-cause mortality in patients with HF with different types of LVEF. All tests were two-sided. Statistical significance was set at P < 0.05. Statistical analyses were performed using the SAS9.4 software (SAS Institute, Cary, N.C., USA).
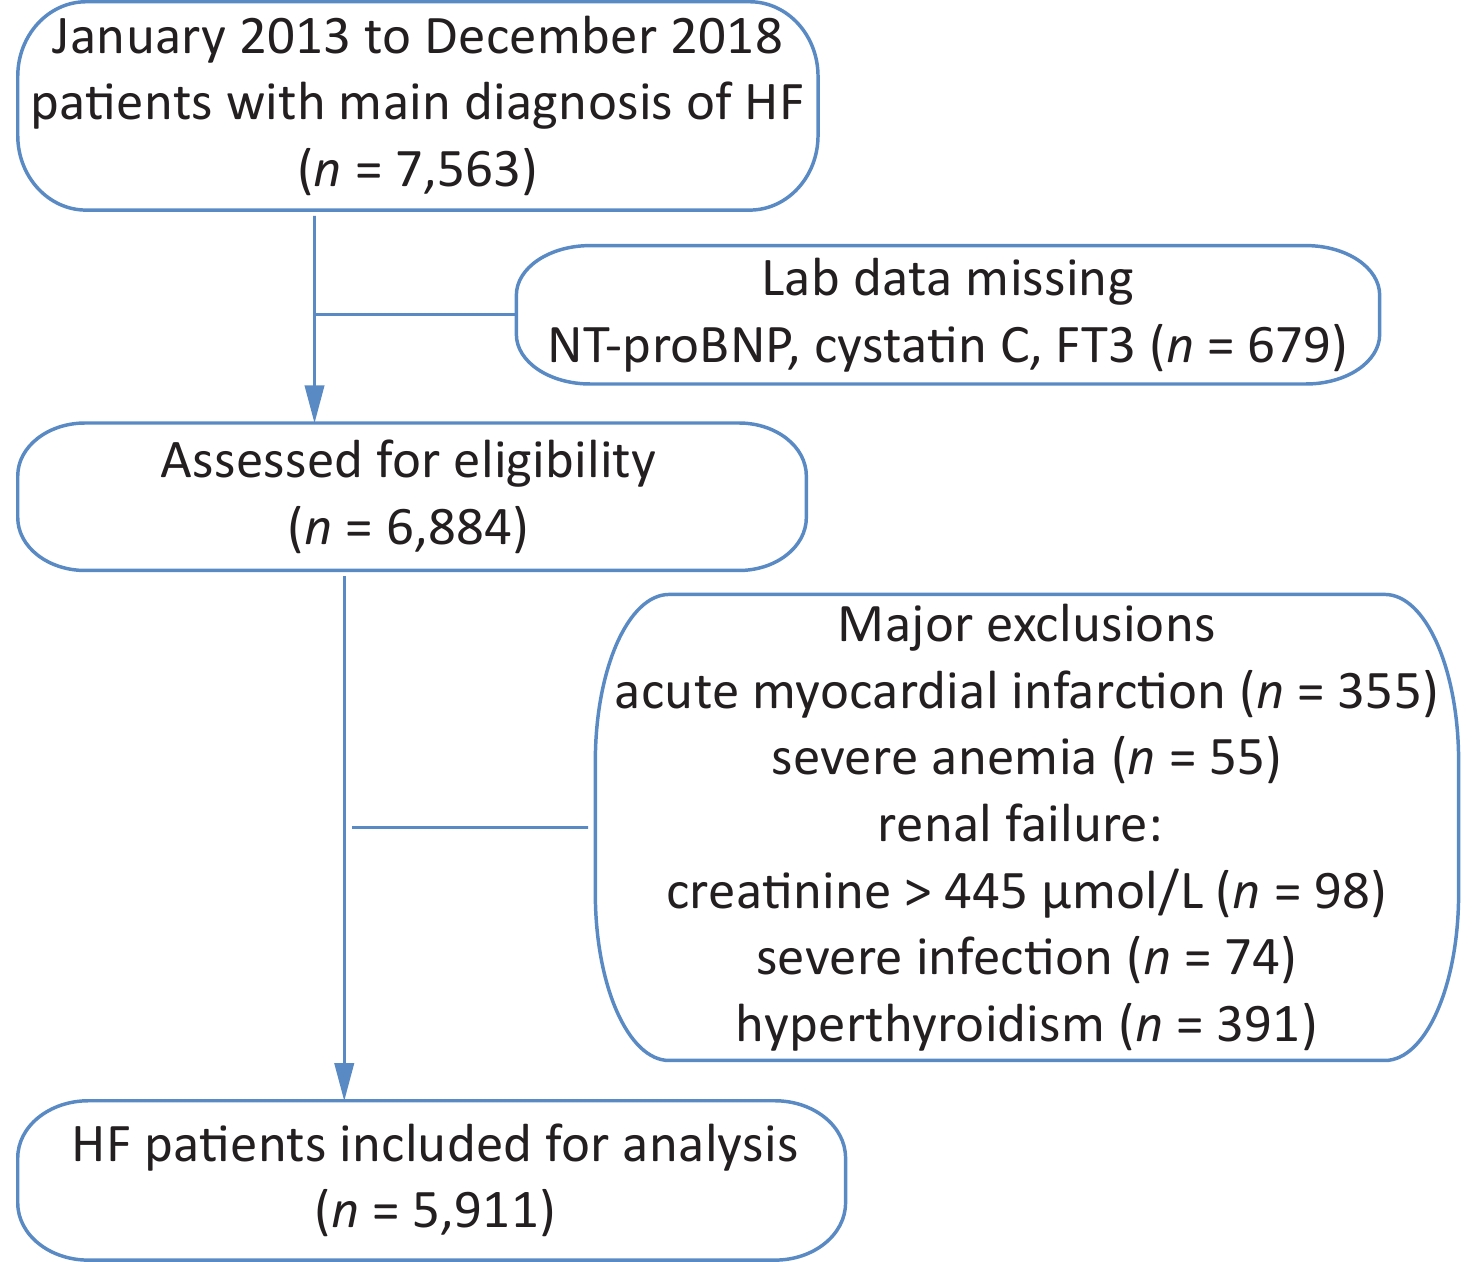
The study cohort included retrospective data for 7,563 HF patients hospitalized between January 2013 and December 2018. Those with acute myocardial infarction, severe anemia, renal failure, and severe infection were excluded from this study (Supplementary Figure S1, available in www.besjournal.com). The resulting cohort consisted of 5,911 patients, including 1,970 with a low Cys-C/FT3 ratio, 1,971 with a medium Cys-C/FT3 ratio, and 1,970 with a high Cys-C/FT3 ratio. Baseline patient characteristics and the occurrence of risk factors according to the Cys-C/FT3 ratio tertiles are shown in Table 1.
Variables Cys-C/FT31st tertile Cys-C/FT32nd tertile Cys-C/FT33rd tertile P-value N 1,970 1,971 1,970 Age (years) 64.25 ± 13.68 70.09 ± 13.16 73.32 ± 12.16 < 0.001 Male 1,118 (56.8) 1,094 (55.5) 985 (50) < 0.001 NYHA Fc < 0.001 NYHA class II 683 (34.7) 363 (18.4) 159 (8.1) NYHA class III 787 (39.9) 874 (44.3) 769 (39.0) NYHA class IV 500 (25.4) 734 (37.2) 1,042 (52.91) CHD 1,201 (61.0) 1,316 (66.8) 1,381 (70.1) < 0.001 Hypertension 1,169 (59.3) 1,224 (62.1) 1,335 (67.8) < 0.001 Diabetes mellitus 552 (28.0) 608 (30.8) 830 (42.1) < 0.001 Atrial fibrillation 745 (37.8) 659 (33.4) 529 (26.9) < 0.001 Previous MI 298 (16.8) 403 (20.4) 453 (23.0) < 0.001 COPD 308 (21.1) 297 (20.3) 251 (17.6) 0.042 Stroke 311 (15.8) 353 (17.9) 470 (23.9) < 0.001 Current smoker 591 (30.0) 579 (29.4) 517 (26.2) 0.020 Alcohol-related 395 (20.1) 371 (18.8) 304 (15.4) < 0.001 WBC (1012/L) 7.17 ± 2.23 7.29 ± 2.40 7.75 ± 3.00 < 0.001 Hemoglobin (g/L) 135.66 ± 17.71 130.57 ± 19.03 117.17 ± 24.17 < 0.001 Platelet (109/L) 197.52 ± 61.43 191.53 ± 62.94 189.42 ± 81.45 0.001 Albumin (g/L) 39.01 ± 3.71 37.37 ± 3.96 35.09 ± 4.58 < 0.001 TC (mmol/L) 4.13 ± 0.81 4.01 ± 0.75 4.02 ± 0.87 < 0.001 Triglycerides (mmol/L) 1.37 ± 1.06 1.23 ± 0.87 1.32 ± 1.10 < 0.001 HbA1c (%) 6.39 ± 1.25 6.59 ± 1.35 6.59 ± 1.27 0.002 Cys-C (mg/L) 1.02 ± 0.20 1.38 ± 0.24 2.37 ± 0.94 < 0.001 BUN (mmol/L) 6.21 ± 1.98 7.44 ± 2.52 12.63 ± 6.55 < 0.001 Creatinine (μmol/L ) 71.40 ± 17.64 84.88 ± 23.17 144.12 ± 77.85 < 0.001 Uric acid (μmol/L ) 380.89 ± 120.10 432.36 ± 141.45 526.09 ± 171.56 < 0.001 Potassium (mmol/L) 3.97 ± 0.41 4.02 ± 0.46 4.25 ± 0.68 < 0.001 Sodium (mmol/L) 139.93 ± 3.18 139.05 ± 3.67 137.87 ± 4.45 < 0.001 FT3 (pg/mL ) 2.63 ± 0.37 2.27 ± 0.36 1.87 ± 0.42 < 0.001 FT4 (pmol/L) 14.22 ± 2.00 14.45 ± 2.15 14.21 ± 2.34 0.001 TSH (mmol/L) 1.56 (0.95, 2.46) 1.58 (0.93, 2.49) 1.61 (0.93, 2.53) 0.957 Troponin I (µg/L) 0.02 (0.00, 0.05) 0.03 (0.01, 0.08) 0.05 (0.02, 0.17) < 0.001 NT-proBNP (ng/L) 1672.5 (660.1, 3499.0) 3056.0 (1313.0, 6025.0) 6869.8 (3057.0, 13666.8) < 0.001 LVEDV (mL) 156.81 ± 61.39 162.40 ± 65.39 160.86 ± 60.29 0.015 LVESV (mL) 83.01 ± 50.35 89.41 ± 53.61 89.32 ± 48.71 0.06 LVEF (%) 49.94 ± 12.21 47.85 ± 12.15 46.90 ± 12.79 < 0.001 Note. NYHA Fc, New York Heart Association cardiac function classification; CHD: coronary heart disease; Previous MI, previous myocardial infarction; COPD, chronic obstructive pulmonary disease; SBP, systolic blood pressure; DBP, diastolic blood pressure; WBC, white blood cells; LDL-C, low-density lipoprotein cholesterol; TC, total cholesterol; Cys-C, Cystatin C; BUN, blood urea nitrogen; FT3, free thyroxine 3; FT4, free thyroxine 4; TSH, thyroid stimulating hormone; NT-proBNP, N-terminal pro–B-type natriuretic peptide; LVEDV, left ventricular end-diastolic volume; LVESV, left ventricular end-systolic volume; LVEF, left ventricular ejection fraction. Table 1. Baseline clinical characteristics, median (IQR), or N (%), or means ± SD
Figure S1. Flow diagram for participant selection.
In the final cohort, 2,651 (44.8%) patients with HF died [1,840 (31.1%) cases of cardiovascular death] over the course of a follow-up with a median duration of 3.2 years. Univariate Cox regression revealed a significant correlation of the Cys-C/FT3 ratio with survival [all-cause mortality HR: 3.510 (95% CI: 3.257–3.783)] and cardiovascular mortality [HR: 4.459 (95% CI, 3.164–3.782)]. After adjustment for demographic characteristics, patient history, and clinical characteristics in the multivariable model, the Cys-C/FT3 ratio remained a significant predictive factor for all-cause mortality [adjusted HR: 1.866 (95% CI: 1.539–2.263)] and cardiovascular mortality [adjusted HR: 2.012 (95% CI: 1.594–2.538)]. Moreover, NT-proBNP was significantly associated with all-cause and cardiovascular mortality (Table 2). Both univariate and multivariable Cox regression models demonstrated that all-cause and cardiovascular mortality in patients with HF were independently predicted by the Cys-C/FT3 ratio or NT-proBNP.
Variables Univariate analysis P Multivariate analysis* P Cys-C/FT3 ratio (per 1 increase) Cardiovascular mortality 3.459 (3.164−3.782) < 0.001 2.012 (1.594−2.538) < 0.001 All-cause mortality 3.510 (3.257−3.783) < 0.001 1.866 (1.539−2.263) < 0.001 Cys-C (per 1 increase) Cardiovascular mortality 1.626 (1.560−1.696) < 0.001 1.284 (1.156−1.426) < 0.001 All-cause mortality 1.643 (1.578−1.702) < 0.001 1.291 (1.183−1.408) < 0.001 FT3 (per 0.1 increase) Cardiovascular mortality 0.526 (0.495−0.559) < 0.001 0.809 (0.738−0.887) < 0.001 All-cause mortality 0.539 (0.512−0.567) < 0.001 0.846 (0.783−0.913) < 0.001 NT-proBNP (per 100 increase) Cardiovascular mortality 1.008 (1.007−1.008) < 0.001 1.003 (1.002−1.004) < 0.001 All-cause mortality 1.007 (1.006−1.007) < 0.001 1.002 (1.002−1.003) < 0.001 Note. *Adjusted for age, sex, NYHA Fc, coronary heart disease, hypertension, diabetes mellitus, atrial fibrillation, previous MI, chronic obstructive pulmonary disease, systolic blood pressure, diastolic blood pressure, heart rate, white blood cells, hemoglobin, platelets, albumin, low-density lipoprotein cholesterol, triglycerides, HbA1c, blood urea nitrogen, creatinine, uric acid, potassium, sodium, troponin I, LVEDV, LVESV, and LVEF. Cys-C, Cystatin C; FT3, free thyroxine 3; FT4, free thyroxine 4; NT-proBNP, N-terminal pro–B-type natriuretic peptide; LVEDV, left ventricular end-diastolic volume; LVESV, left ventricular end-systolic volume; LVEF, left ventricular ejection fraction. Cys-C, Cystatin C; BUN, blood urea nitrogen; FT3, free thyroxine 3; FT4, free thyroxine 4; NT-proBNP, N-terminal pro–B-type natriuretic peptide; LVEDV, left ventricular end-diastolic volume; LVESV, left ventricular end-systolic volume; LVEF, left ventricular ejection fraction Table 2. Univariate and multivariate Cox regression analysis
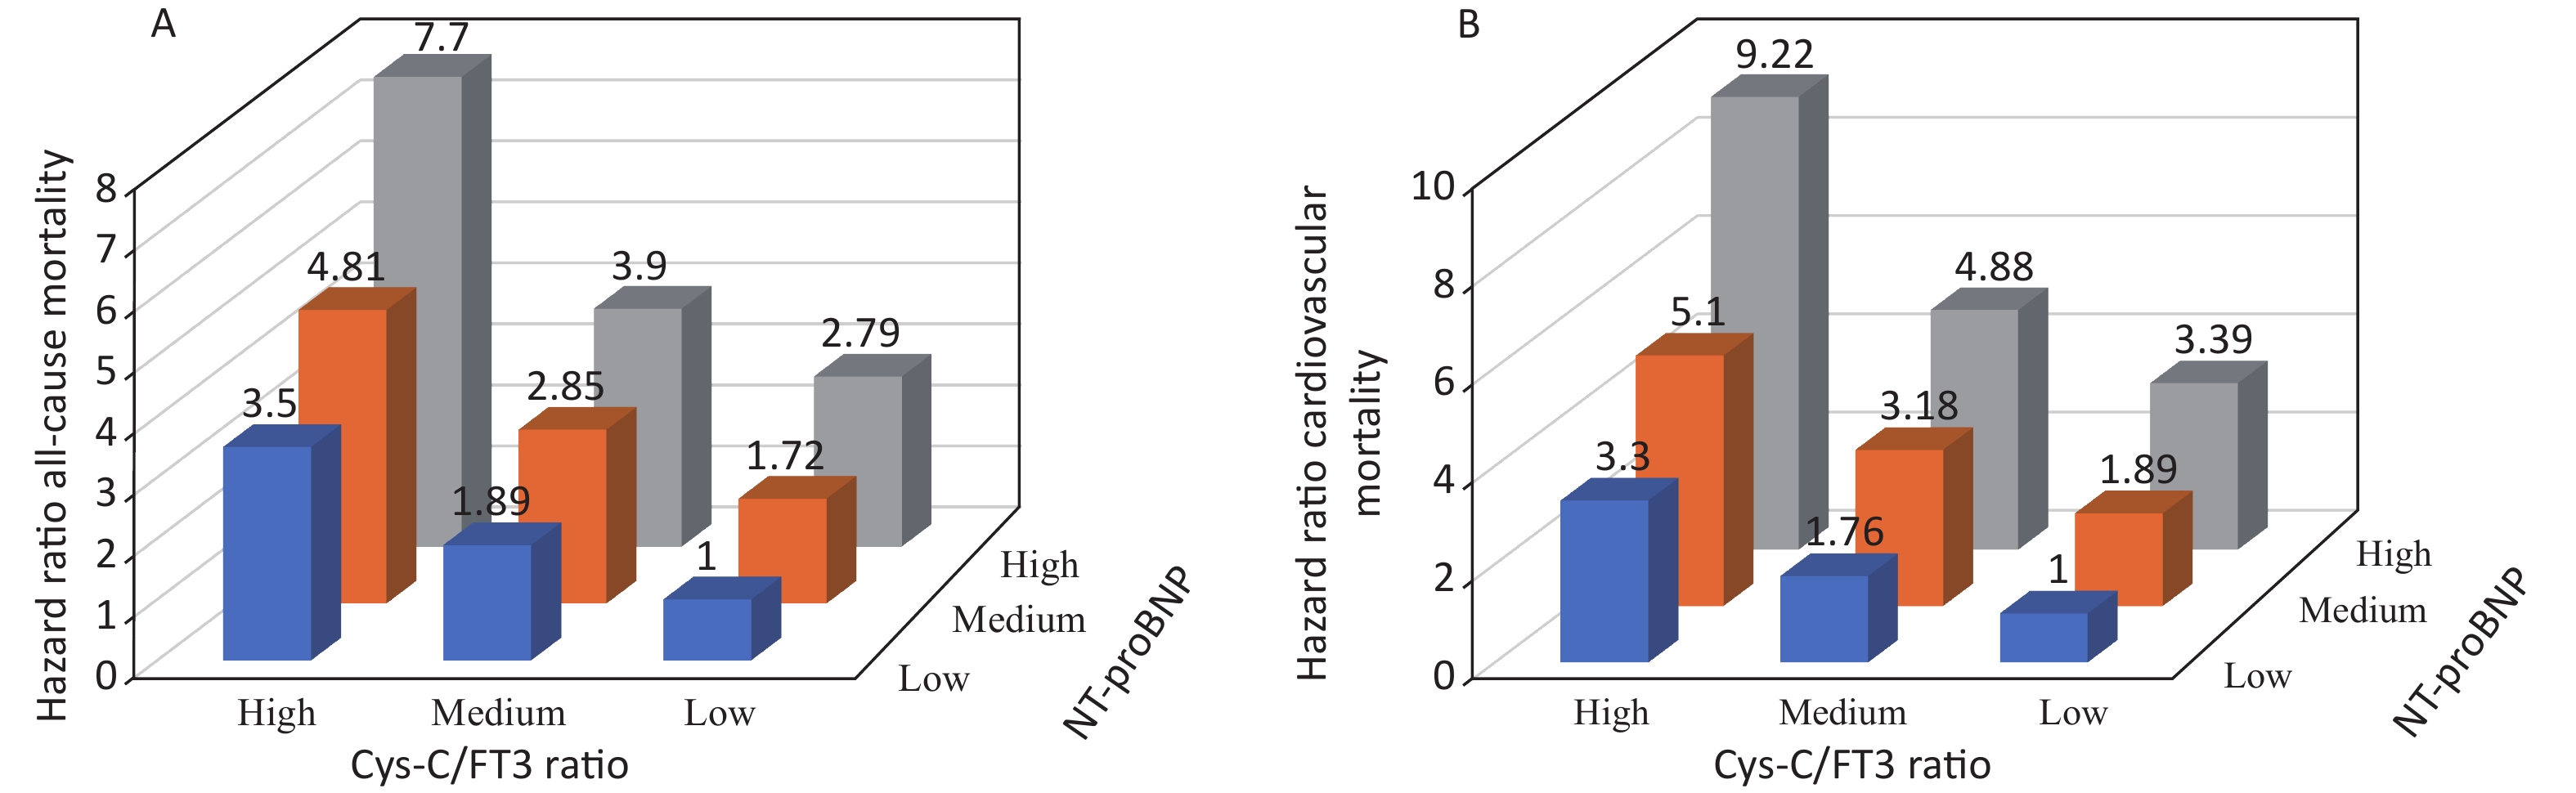
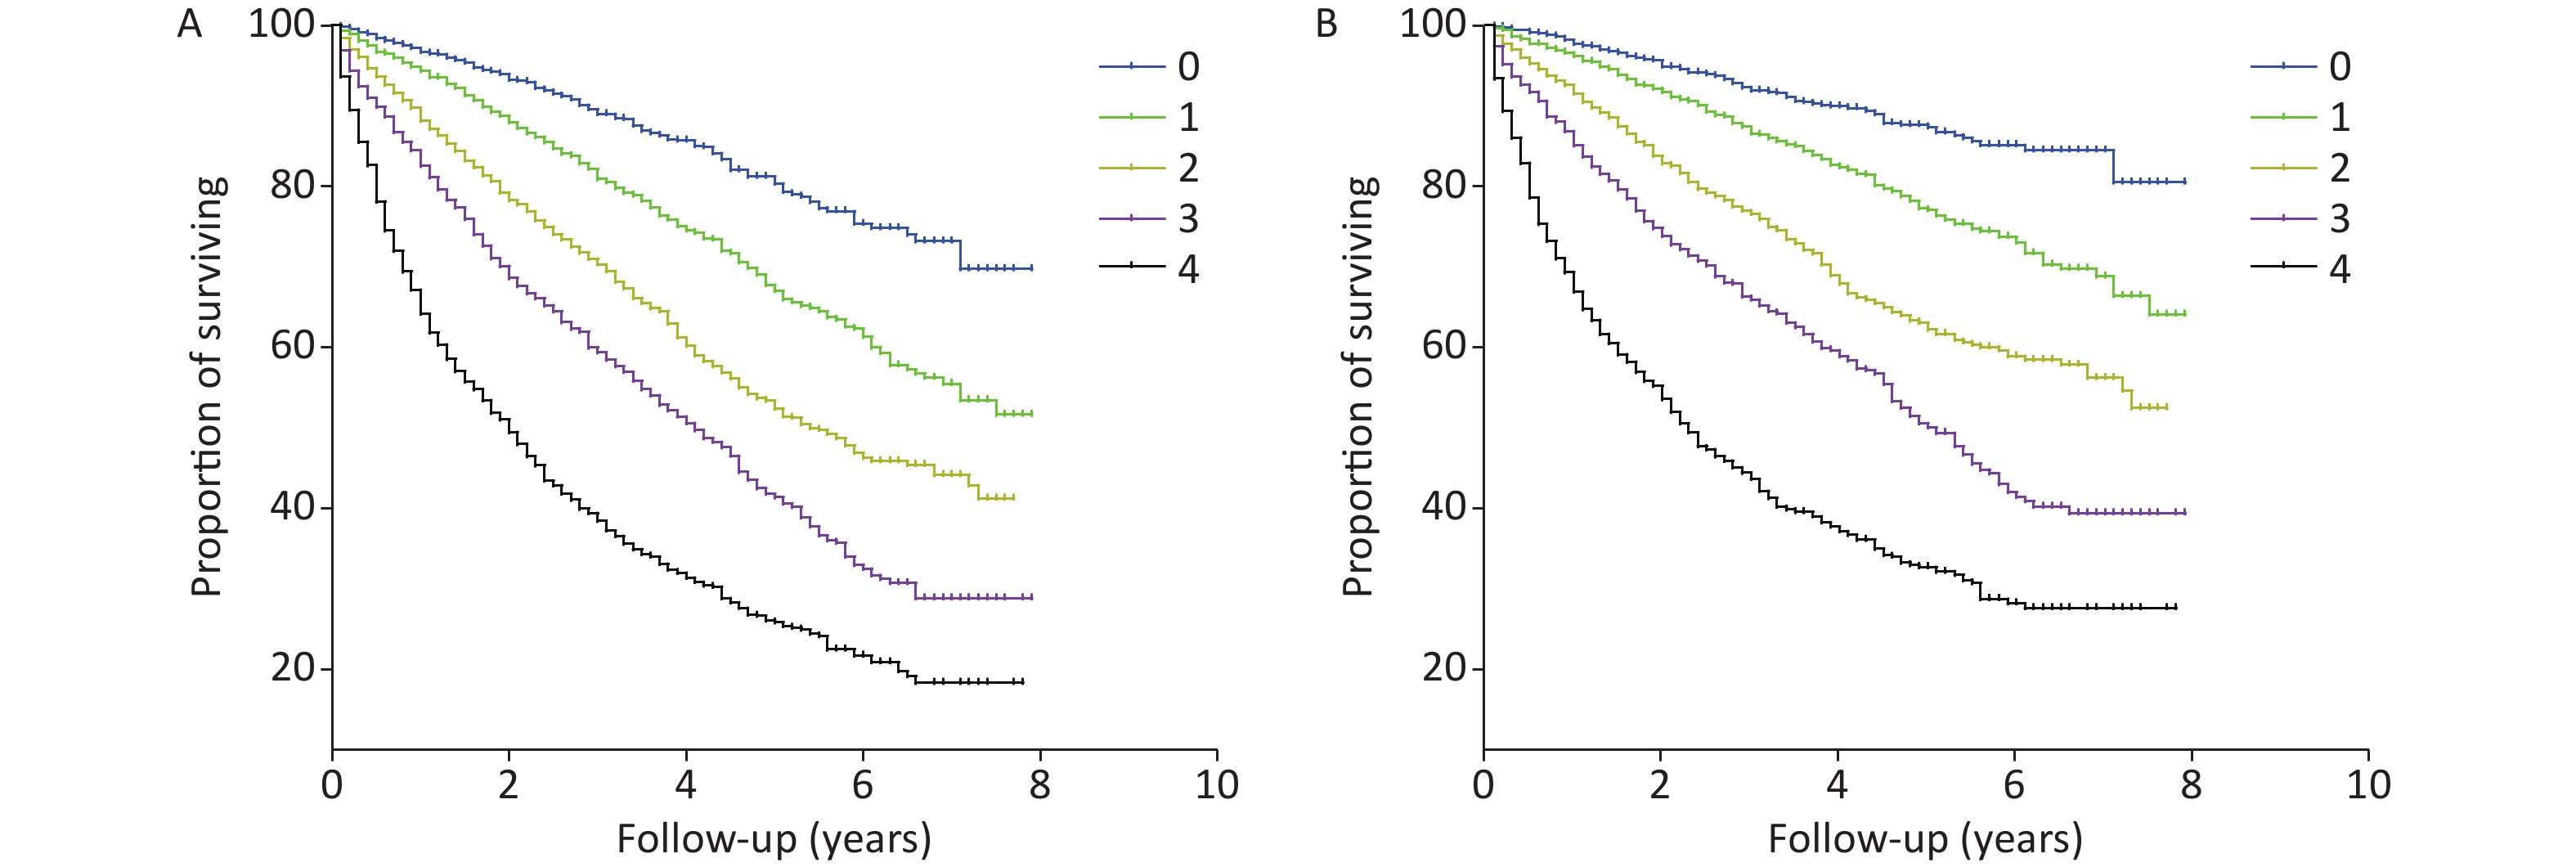
The AUROC, NRI, and IDI revealed that the Cys-C/FT3 ratio allowed for a better prognostic prediction of the individual risk of all-cause and cardiovascular mortality in patients with HF when combined with the NT-proBNP levels (Table 3). Patients were stratified into nine groups according to the Cys-C/FT3 ratio and NT-proBNP level tertiles. Graduated increases in risk with respect to both markers were observed for those in the higher tertiles. The risk ratio for long-term all-cause mortality for patients with a high Cys-C/FT3 ratio in combination with high NT-proBNP levels was 7.7 times higher than for those with low levels and 9.22 times higher for cardiovascular mortality (Supplementary Figure S2, available in www.besjournal.com). Scores of 0, 1, or 2 were assigned to the Cys-C/FT3 ratio and NT-proBNP level tertiles. The minimum score was 0 and the maximum scores was 4 when the two markers’ scores were added. Supplementary Figure S3 (available in www.besjournal.com) shows the Kaplan-Meier survival curves for all-cause mortality according to the scores.
Variables C-statistic NRI IDI Z P NRI P IDI P All-cause mortality Cys-C/FT3+NT-rpoBNP vs. Cys-C/FT3 7.093 < 0.01 0.402 0.026 0.055 0.018 Cys-C/FT3+NT-rpoBNP vs. NT-rpoBNP 8.252 < 0.01 0.489 0.014 0.057 0.020 Cardiovascular mortality Cys-C/FT3+NT-rpoBNP vs. Cys-C/FT3 2.770 < 0.01 0.402 0.014 0.055 0.014 Cys-C/FT3+NT-rpoBNP vs. NT-rpoBNP 3.769 < 0.01 0.489 0.016 0.057 0.032 Note. NRI: net reclassification improvement; IDI: integrated discrimination improvement. Cys-C, Cystatin C; BUN, blood urea nitrogen; FT3, free thyroxine 3; FT4, free thyroxine 4 Table 3. The C-statistic, discrimination, and reclassification
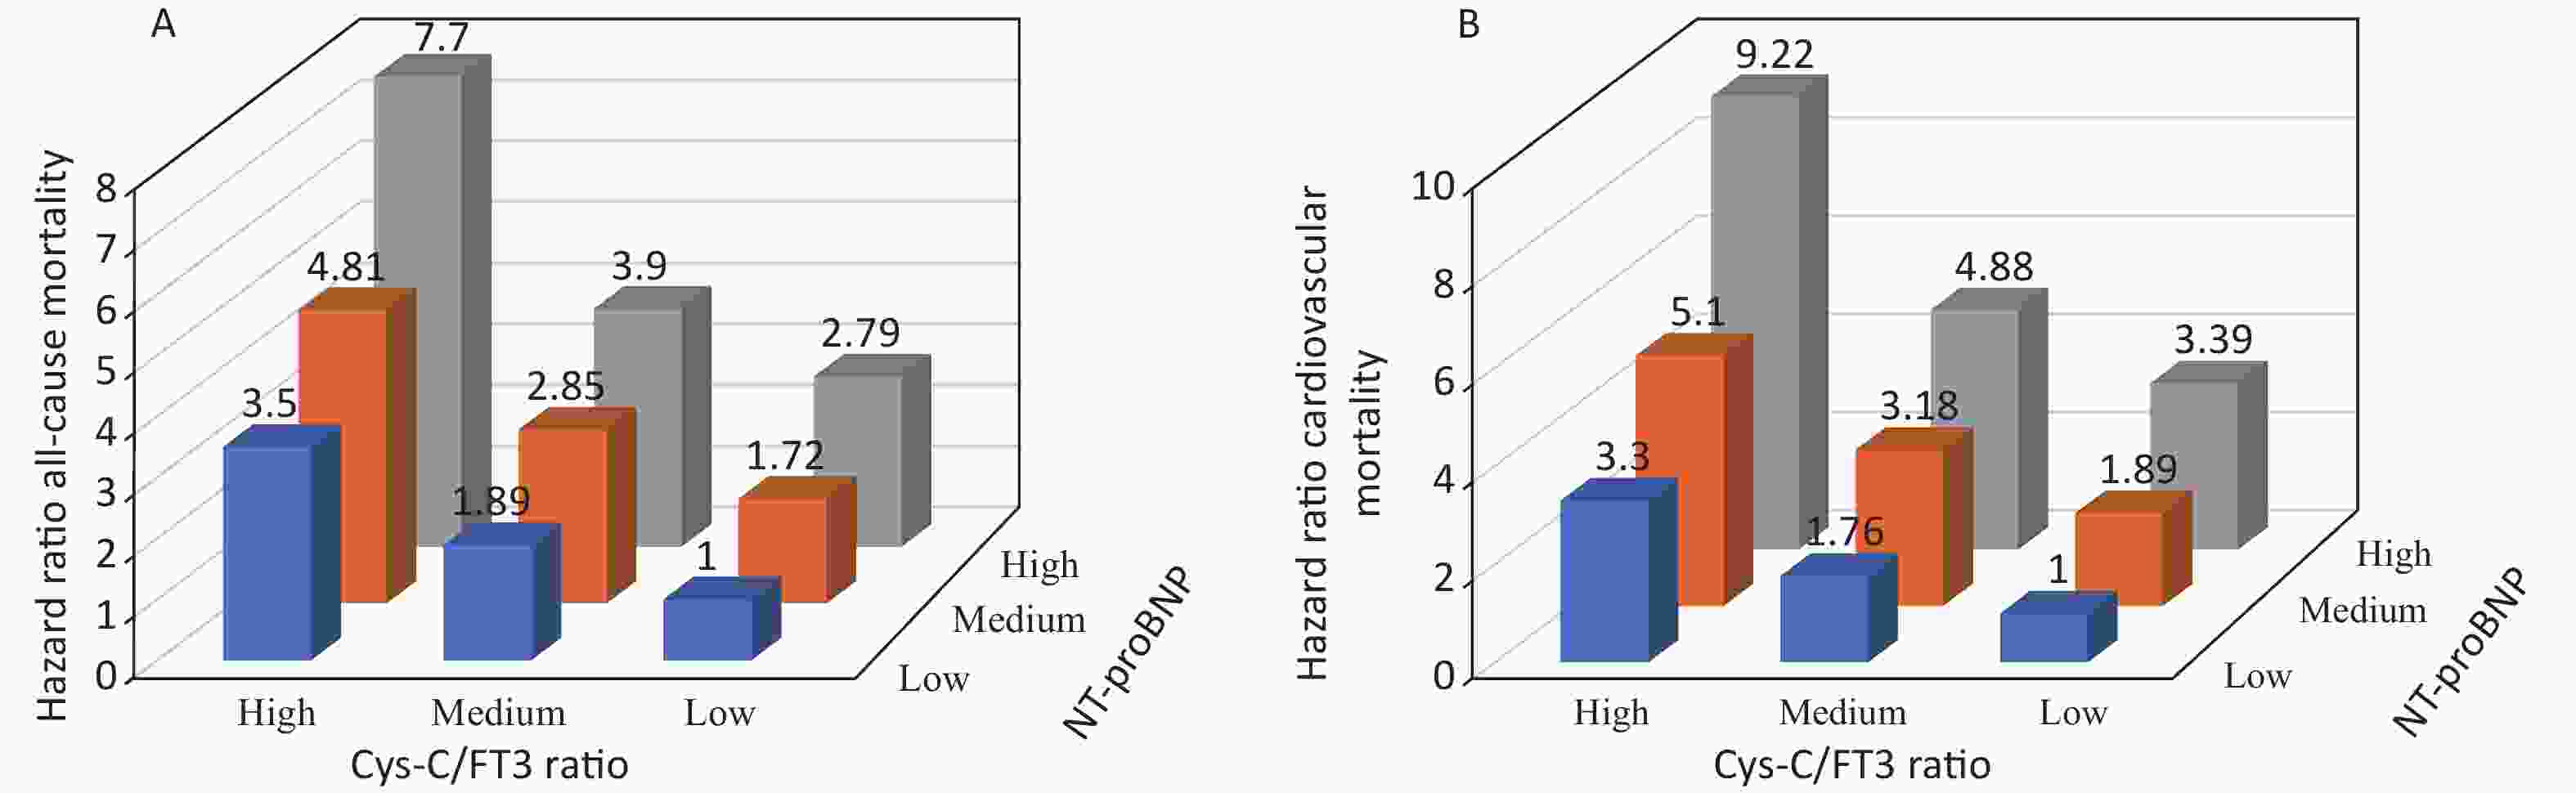
Figure S2. Relative risk of all-cause (A) and cardiovascular (B) mortality stratified by tertiles of Cys-C/FT3 ratio and NT-proBNP level combination.
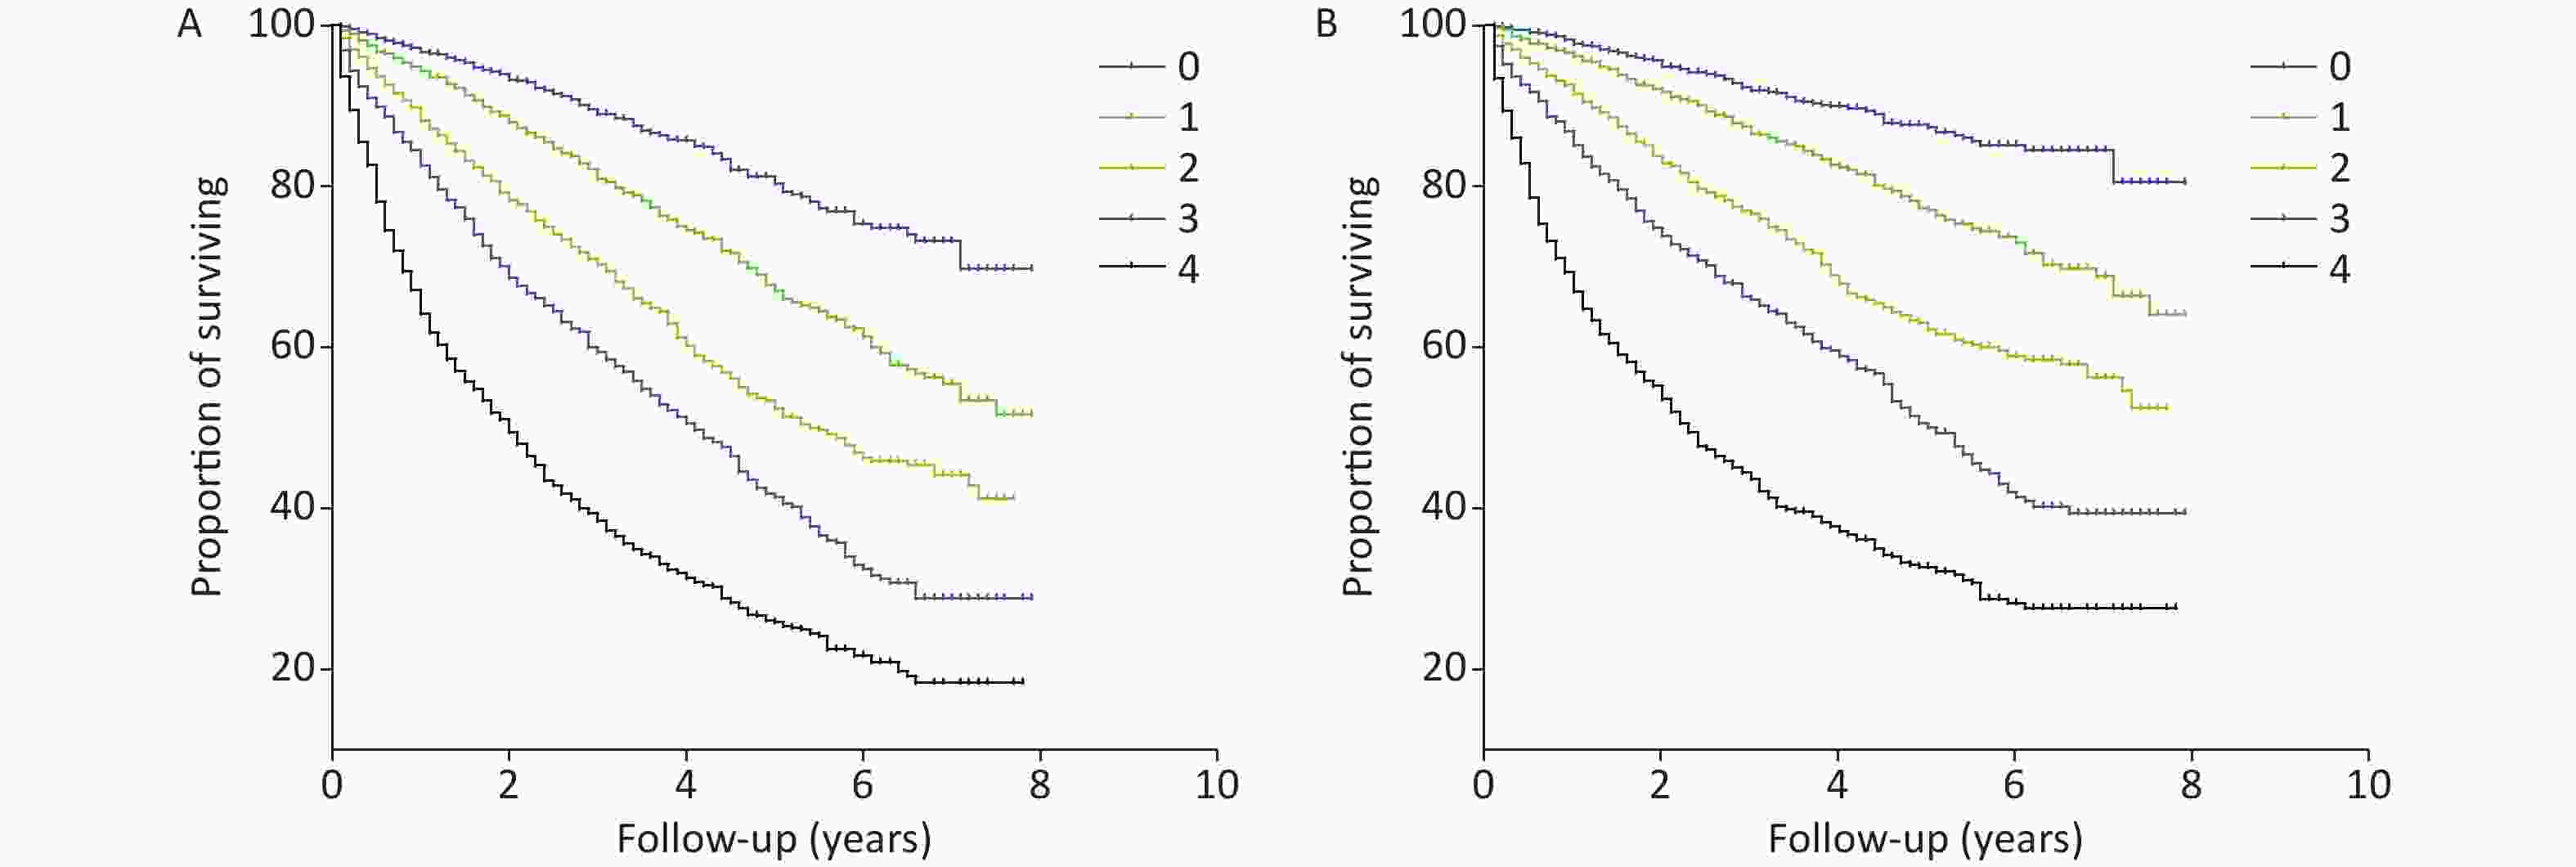
Figure S3. Kaplan-Meier estimates of all-cause (A) and cardiovascular (B) mortality.
The AUCs for the combination of the Cys-C/FT3 ratio and NT-proBNP level for predicting all-cause mortality were 0.780, 0.767, 0.744, 0.740, and 0.737 for in-hospital, 1-, 3-, 5-, and 8-year mortality, respectively. The AUCs of the combination of the Cys-C/FT3 ratio and NT-proBNP level for predicting cardiovascular mortality were 0.779, 0.772, 0.729, 0.720, and 0.714 for in-hospital, 1-, 3-, 5-, and 8-year mortality, respectively (Supplementary Table S1, available in www.besjournal.com). In the subgroup analysis, the Cys-C/FT3 ratio in combination with NT-proBNP level had a greater discriminative ability for the mortality risk in patients with HFpEF than in patients with HFrEF. Most of the studies on predicting prognosis of patients with HF in recent decades have focused on individuals with HFrEF, while HFpEF appeared to have epidemiological and etiological characteristics that are different from HFrEF. The present study suggested that Cys-C/FT3 may be a valuable predictor for patients with HFpEF.
Item HF HFrEF HFmrEF HFpEF In-hospital mortality Cardiovascular mortality 0.779 (0.746−0.813) 0.781 (0.714−0.847) 0.751 (0.693−0.808) 0.794 (0.739−0.849) All-cause mortality 0.780 (0.749−0.811) 0.784 (0.721−0.848) 0.749 (0.695−0.802) 0.800 (0.752−0.848) 1-year mortality Cardiovascular mortality 0.772 (0.754−0.789) 0.741 (0.709−0.773) 0.745 (0.711−0.779) 0.787 (0.759−0.816) All-cause mortality 0.767 (0.751−0.782) 0.746 (0.716−0.777) 0.735 (0.705−0.766) 0.787 (0.763−0.811) 3-year mortality Cardiovascular mortality 0.729 (0.715−0.744) 0.687 (0.659−0.715) 0.706 (0.667−0.734) 0.741 (0.718−0.765) All-cause mortality 0.744 (0.731−0.757) 0.713 (0.687−0.739) 0.722 (0.696−0.748) 0.757 (0.737−0.777) 5-year mortality Cardiovascular mortality 0.720 (0.706−0.734) 0.675 (0.648−0.702) 0.702 (0.674−0.730) 0.726 (0.704−0.747) All-cause mortality 0.740 (0.727−0.753) 0.708 (0.682−0.733) 0.726 (0.701−0.751) 0.748 (0.730−0.767) 8-year mortality Cardiovascular mortality 0.714 (0.700−0.728) 0.663 (0.635−0.690) 0.695 (0.668−0.723) 0.748 (0.729−0.766) All-cause mortality 0.737 (0.724−0.749) 0.698 (0.671−0.724) 0.722 (0.697−0.747) 0.756 (0.739−0.774) Table S1. The AUC of the combination of the Cys-C/FT3 ratio and NT-proBNP level for clinical outcomes prediction
There were a few limitations in the present study despite its large sample size. First, only the initially measured baseline levels of Cyst-C, FT3, and NT-proBNP without dynamic monitoring were used, which likely resulted in a bias in accuracy. Second, drug use among the included patients was not considered, which might have affected the study findings. The results confirmed that the Cys-C/FT3 ratio was a very valuable predictor for all-cause and cardiovascular mortality among patients with HF. Moreover, the Cys-C/FT3 ratio added prognostic information to that provided by the NT-proBNP level, especially in patients with HFpEF.
Acknowledgements All of the authors who contributed towards this article met the criteria for authorship.
HTML
 21497Supplementary Materials.pdf
|

|

 Quick Links
 DownLoad: