


-
Mycobacterium tuberculosis is the primary bacteria that leads to human tuberculosis (TB), which usually affects the pulmonary organs. TB is one of the top 10 causes of death worldwide; however, China is one of eight countries that together account for two-thirds of the total number of cases globally. The traditional analysis of TB is limited by discovering outbreaks or clusters in the spatial-temporal dimension[1]. The spatial-temporalanalysis could be a more effective method based on Monte Carlo statistics for detecting underlying outbreaks of TB at the community level, however, few studies have been conducted with the space-time scan analysis at the community level in China.
This study gathered TB data from the National Notifiable Infectious Disease Reporting Information System (NNIDRIS), which was established by the Chinese Center for Disease Control and prevention (China CDC) for surveillance of diseases. The purely temporal scan, spatial autocorrelation, and space-time scan statistical analysis was used to search for TB clusters at the community level in spatial-temporal dimension from 2014 to 2019 in the Baoshan district, Shanghai. Eventually, various control measures were adopted based on the analysis combining the classic analysis with space-time scan statistical analysis, which was utilized to rank the different risks of communities distributed in the clusters classified.
Shanghai is a municipality with 16 districts distributed in east of China, one of which is the Baoshan district that governs 12 communities, is located in north of Shanghai, and contains an area of 424.56 km2 (Supplementary Figure S1, available in www.besjournal.com). In 2019, the population in Baoshan district numbered 2,080,963.
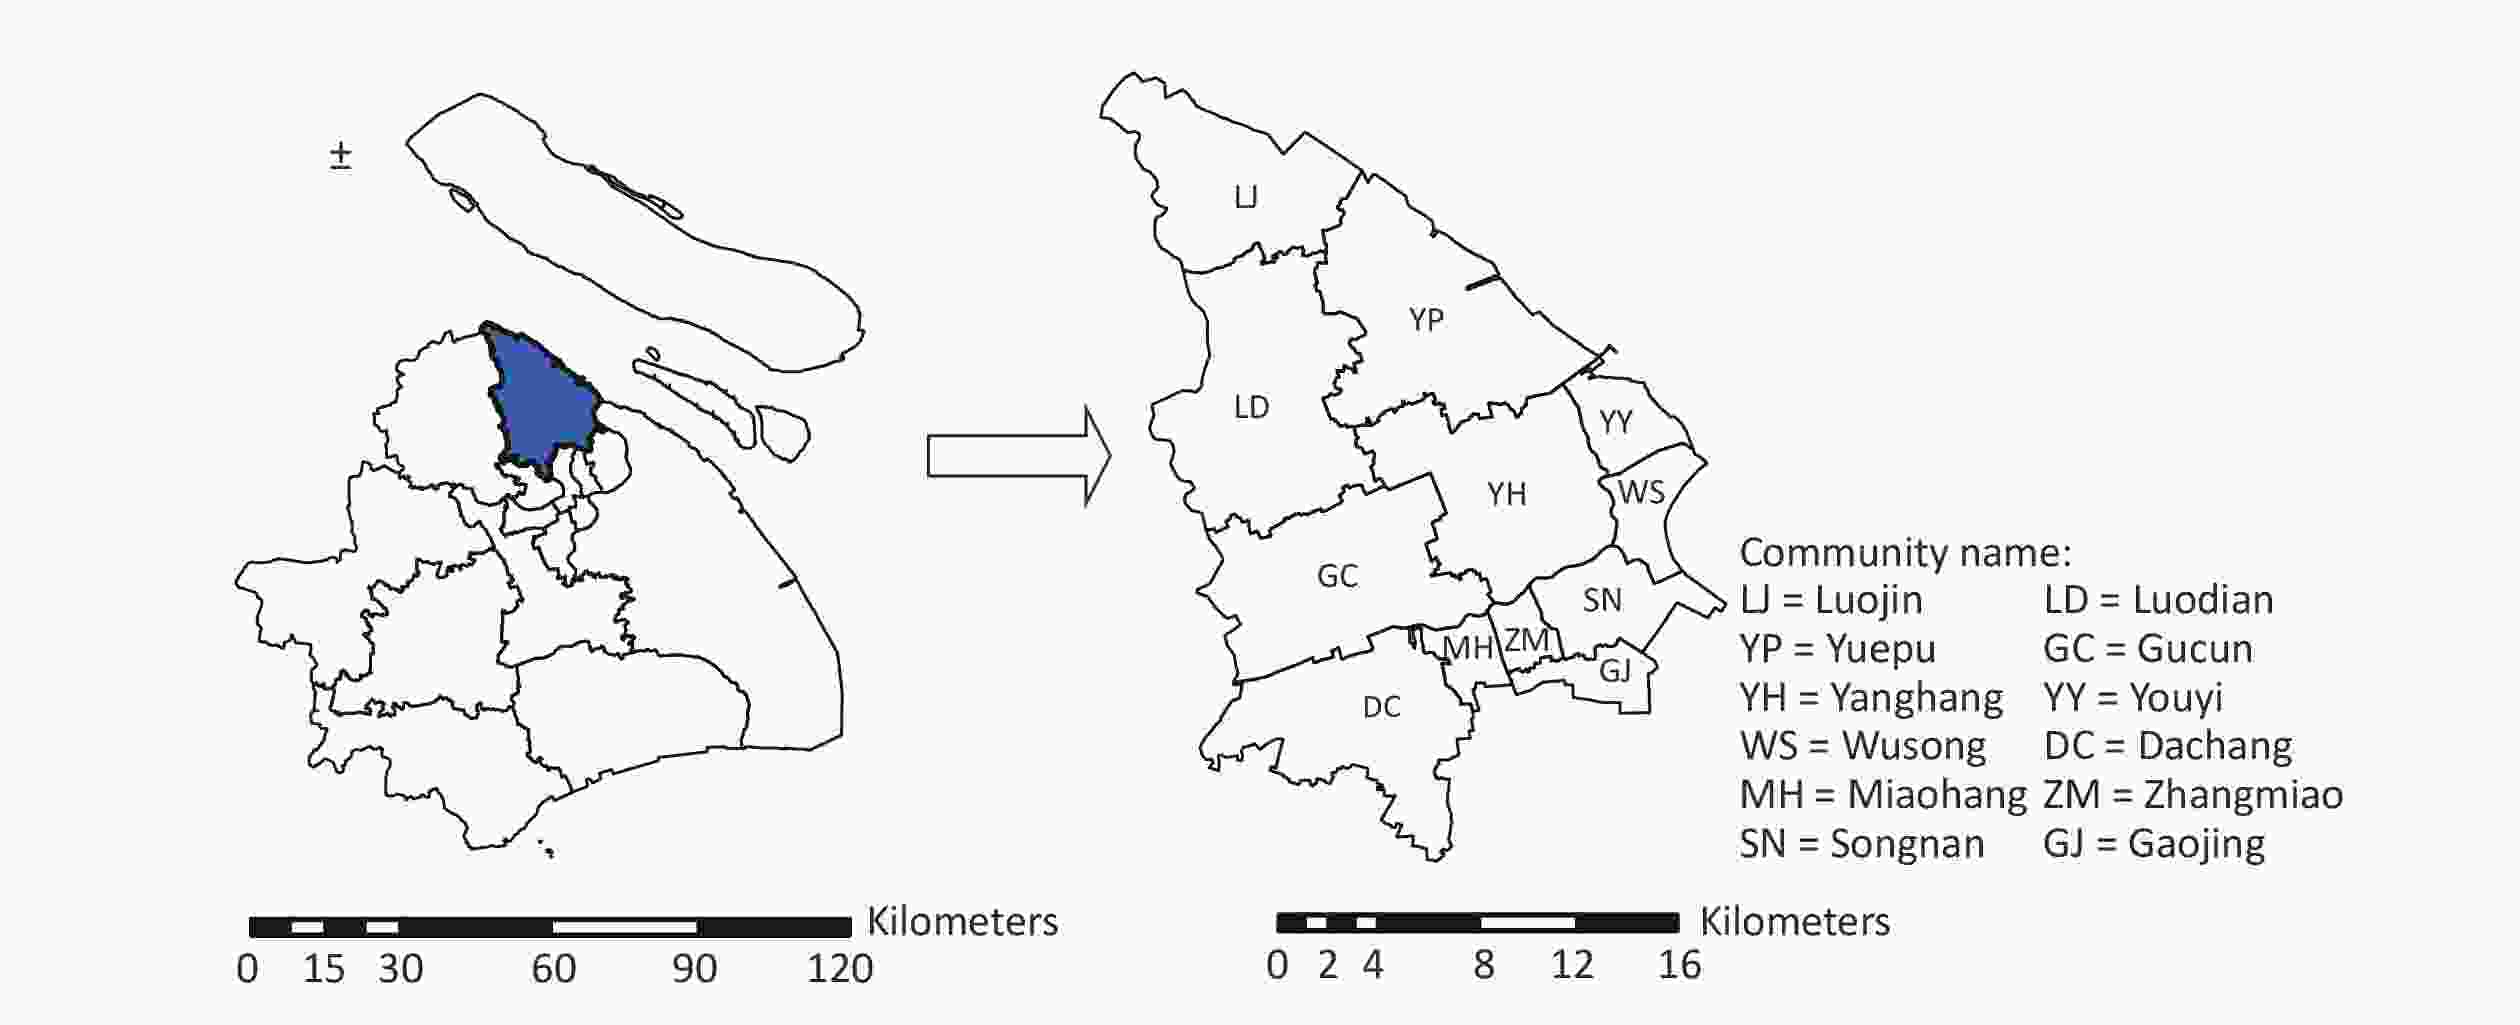
Figure S1. The geographical location of Baoshan district distributed in Shanghai (Blue area represents Baoshan district of Shanghai city and the right map presents the Baoshan district at the community level).
Totally 3,343 TB cases in the study were pulmonary tuberculosis (PTB) cases except MDR-TB (Multi-drug resistance TB), Mono-resistance TB and Poly-resistant TB, resided in Baoshan district from 2014 to 2019, which were confirmed with criteria announced in 2008 by the Ministry of Health of the People’s Republic of China[2]. The PTB cases in this study were clinically-diagnosed and laboratory-confirmed by the TB-designated hospital in Shanghai, and reported by the medical staff who were specialized in notification and submitting of TB to the NNIDRIS. The data of population and social- health-economy characteristics distributed in the 12 communities was gathered from the Statistical Yearbooks of Baoshan district[3], such as the sex, age, residence address, current address, onset date. The notifiable date of confirmed PTB cases were screened from the system. The administrative code of current address at the community level was consistent with the area code from the polygon map based on a 1:1,000,000 scale layer, and the community’s central point were selected as the representation of a potential cluster, the longitude and latitude coordinates of which were determined through the Google geocoding service and toolbox of Geoprocessing in ArcGIS v.10.8 (ESRI Inc, Redlands, CA, USA).
The dimensions of purely temporal scan and spatial autocorrelation analyses were confined to temporal and spatial measures, respectively. To merge the spatial and temporal dimensions, we utilized Kulldorff’s space-time scan statistic for space-time scan analysis, which could be realized by SaTScanTM v9.6[4]. Kulldorff’s space-time scan statistic is an analysis for detecting and evaluating local clusters in a study area with spatial-temporal dimension. The statistic produces a cylindrical window containing a circular geographic base and height linking to time scanning. The cylindrical window moves in space along with time for searching likely clusters through a 999-times replicated simulation. The hypothesis was shaped in this study to determine whether the risk of being a confirmed TB case in communities inside the cluster(p) appear larger compared to the one outside(q). The spatial-temporal risk can be assessed through the null hypothesis (H0:p = q) and the alternative hypothesis (H1:p﹥q). The relative risk (RR) was utilized to estimate the risks inside and outside the cluster, which is calculated with the following equation: RR =
$ \,\dfrac{p}{q} $ . The log likelihood ratio (LLR) was used to calculate each simulative cylindrical window, and the sum of the LLRs ($ \sum\limits_i {LL{R_i}} $ ) in which the observed cases were larger than the one with expected cases among 999 simulative replications applied to assess the probability of the cluster that appeared. The maximum sum of LLRs ($ M{\text{ax}}\sum\limits_i {LL{R_i}} $ ) with more expected TB cases indicated the most likely cluster; the second largest LLR indicated the second likely cluster. The relative likelihood (RL) evaluates the significance of the TB cluster, which is the value of the LLR inside the cluster to the overall LLR(L0). The RL produced as the cylindrical window move in this study and the rank of the RL was generated to assess the statistical significance of the TB cluster at the 0.05 level (α = 0.05). In our space-time statistical analysis, limits were set such that the expected TB cases were no more than the total TB cases and the scan time range was no more than one-half of the study period in case that$ M{\text{ax}}\sum\limits_i {LL{R_i}} $ did not reflect the difference between the risk of infection inside of the cluster and the risk outside for overlapping most communities and the study period.The PTB is a high burden disease, the spread and treatment of which are strongly influenced by social-economy status[5]. Previous studies explored the risks of PTB in association with economy status and demography characteristics inside the cluster in the study area on the prefecture level[1]. We involved the indicators of social-economy status and population structure, such as annual average values of GDP per capita, native-total population ratio (NTR), and the lowest society guarantees rate (LSGR) over 6 years span. The risk rank of every community was defined as a 3-1 values based on corresponding RR values through the space-time scan statistical analysis over 6 years span, which depends on every community’s locations inside the most likely cluster (RR > 1), inside the second-like cluster (0.54 < RR < 1), and outside the cluster (RR < 0.54) respectively. The Spearman rank correlation test was used to explore the correlations of the risk and social-economy-demography influencing factors with R [v4.1.0; R Foundation for Statistical Computing, Vienna, Austria (
https://www.r-project.org/ )].A total of 3,343 TB cases were included in the study. The average annual notification rate in the Baoshan District was 27.09/105 from 2014 to 2019. The number and notification rate of male cases were both larger than the female cases from 2014 to 2019 and the ratio of males to females was roughly greater than 2 (Supplementary Table S1, available in www.besjournal.com). A larger notification rate appeared among the cases > 60 years of age compared to the other age groups. In addition, the number and notification rate of native cases were larger than migrant cases. Supplementary Figure S2 (available in www.besjournal.com) presents the distribution of PTB cases in the Baoshan district from 2014 to 2019. Few regular patterns appeared and the peak of distribution mostly presented in the summer after April. This study showed that the characteristics of the 20–30 year age group, > 60 year age group, and natives possessed a larger proportion compared to other characteristics in this study, which supports the findings of previous studies; specifically, the high prevalence existing in the elderly and native populations, and the elderly population presented a limited immunity and a worse treatment outcome compared to the other age groups, which may possess a higher risk in transmission of PTB[6].
Characteristics 2014 2015 2016 2017 2018 2019 Gender Male 414 (38.70) 362 (33.71) 389 (36.03) 396 (36.75) 337 (31.47) 351 (32.50) Female 181 (19.46) 187 (20.01) 187 (20.32) 165 (17.82) 194 (20.21) 180 (18.70) Age (year) 0– 25 (9.69) 20 (7.72) 19 (7.42) 19 (7.23) 12 (4.34) 15 (6.08) 20– 139 (32.09) 137 (31.50) 140 (32.74) 146 (34.77) 127 (30.56) 108 (39.41) 30– 93 (23.31) 92 (22.96) 95 (24.10) 91 (23.51) 96 (25.08) 108 (24.15) 40– 70 (22.87) 70 (22.78) 68 (22.48) 67 (22.56) 65 (22.15) 58 (17.74) 50– 113 (35.17) 86 (26.65) 107 (33.73) 93 (29.85) 75 (24.32) 66 (18.86) > 60 155 (54.94) 144 (50.82) 147 (48.59) 145 (44.58) 156 (44.02) 176 (44.27) Residence Native 368 (39.31) 329 (34.70) 345 (35.77) 356 (36.46) 346 (34.83) 366 (30.60) Migrant 227 (19.96) 220 (19.89) 231 (20.95) 205 (19.03) 185 (17.24) 165 (19.77) Total 595 (28.70) 549 (26.73) 576 (27.86) 561 (27.32) 531 (25.69) 531 (26.21) Note. PTB, Pulmonary tuberculosis. Table S1. The no and notification rate (per 100,000 population) of PTB case with characteristics from 2014 to 2019 in Baoshan district, Shanghai, n (%)
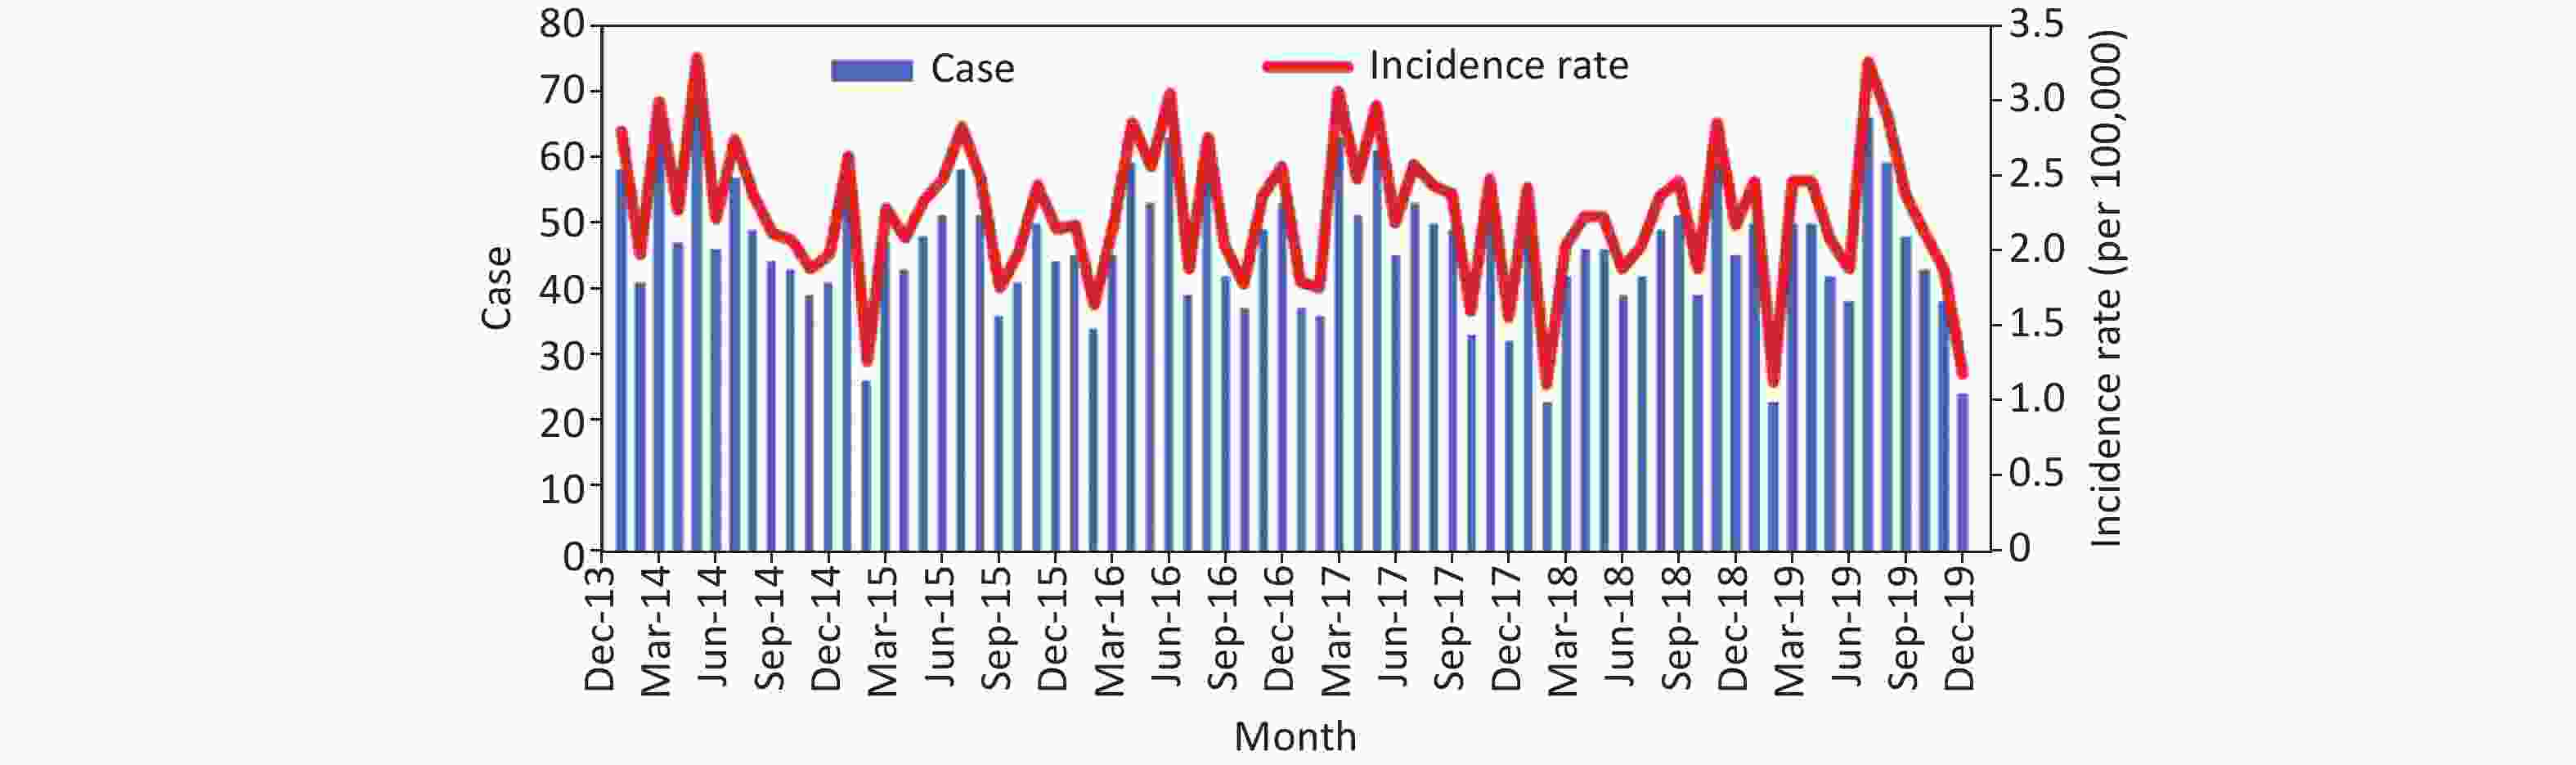
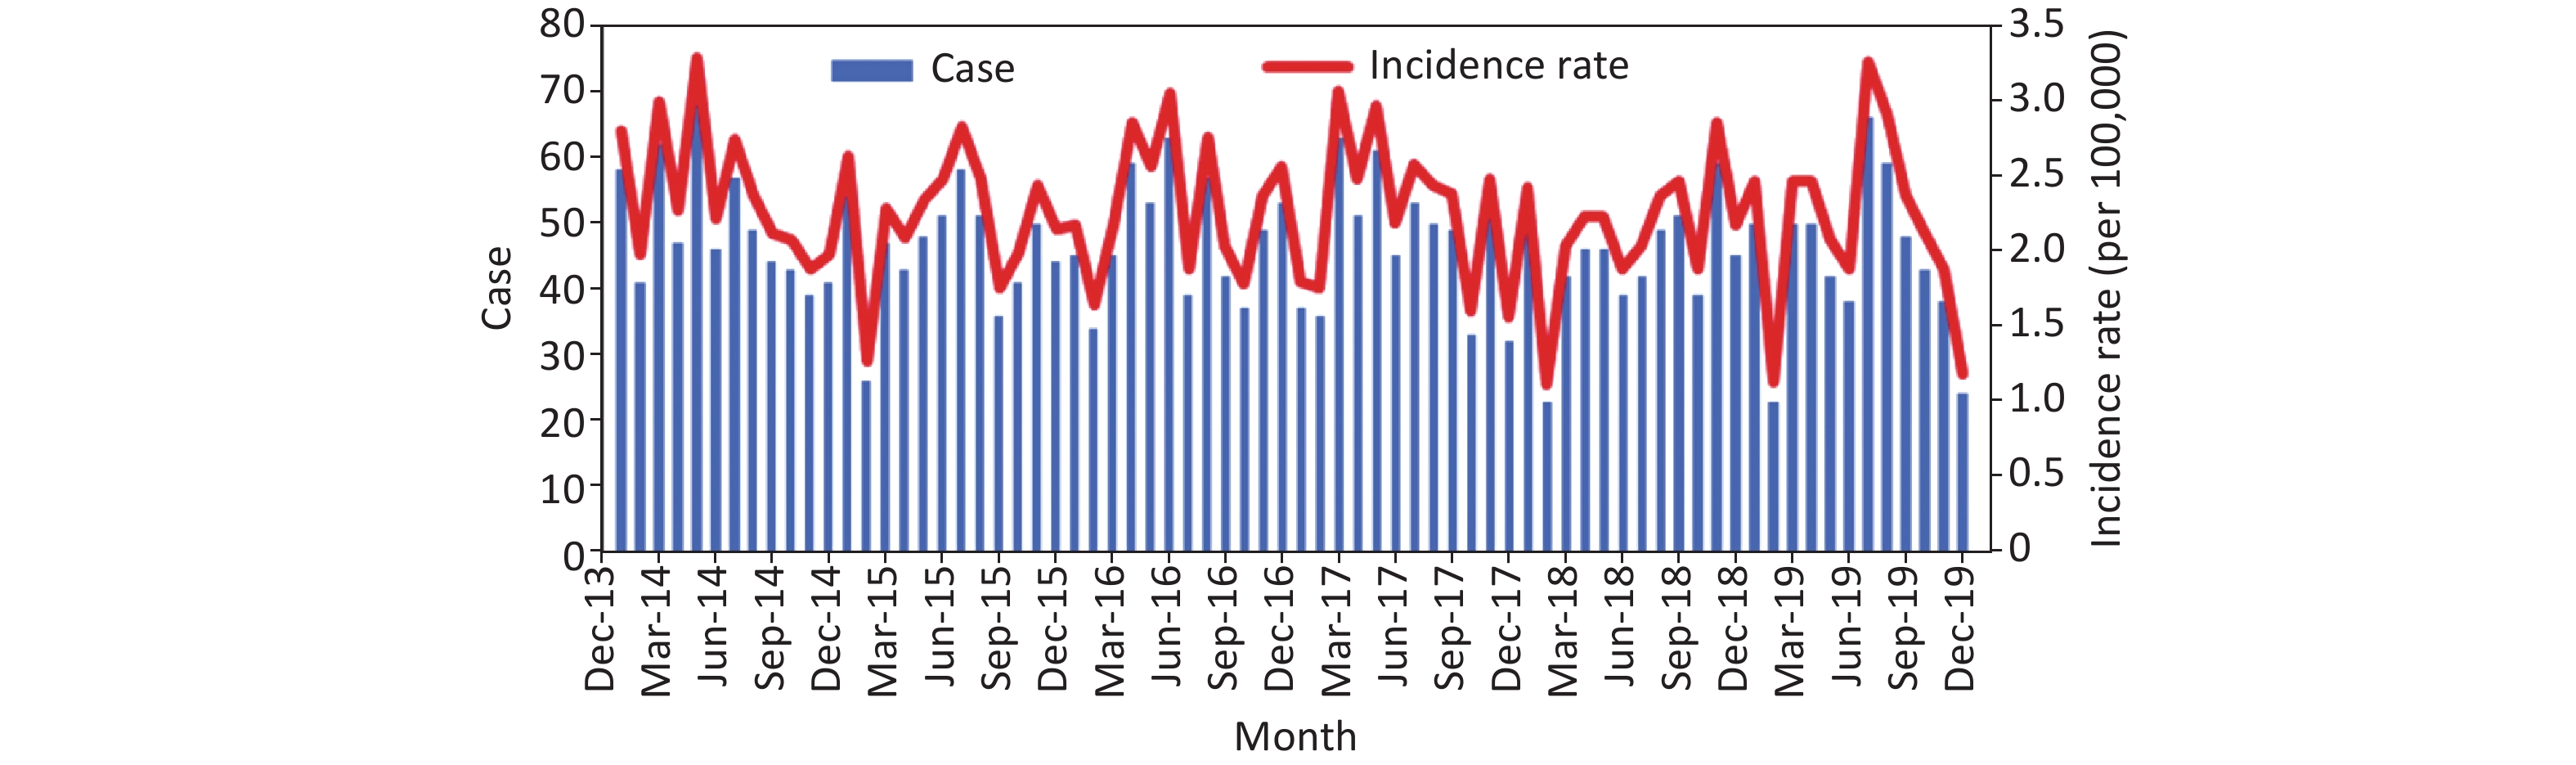
Figure S2. The monthly trend of PTB cases in Baoshan district, Shanghai from 2014 to 2019.
Figure 1 presents the results of purely temporal scan and seasonal temporal analysis. The former showed that a temporal cluster started from April 17th to May 1st, 2014 (Figure 1A), the RR and LLR of which were 2.36 and 15.08, respectively. Seasonal temporal analysis indicted a seasonal cluster from March to August (Figure 1B), accordingly, the RR and LLR were 1.20 and 13.43, respectively. The P values of purely temporal scan and seasonal temporal analysis were both < 0.001. The seasonal cluster of PTB was from March to August, considering the uncertain incubation period of TB, the onset time of which started nearly 3 months later, the case usually infect from December last year to next May, which corresponded to the seasonal pattern analysis with the ARIMA model in Li et al.[7] There is evidence that exposure to air pollution with particulate matter with an aerodynamic diameter ≤ 10 μm (PM10), sulfur dioxide (SO2), and nitrogen dioxide (NO2) increase the PTB risk[8]. A previous study revealed that ambient air pollutants are associated with the seasonality of TB in Shanghai, China[9]. The pure temporal scan analysis showed that a temporal cluster started from April 17th to May 1st, 2014, and the specific period was consistent with the seasonal pattern from March to August, which indicated the rising notification rates of PTB cases and peak cluster in the study area for uncertain incubation of TB, exposure to air pollution, crowding in airtight room and delay on seeing a physician during the Lunar New Year [8].
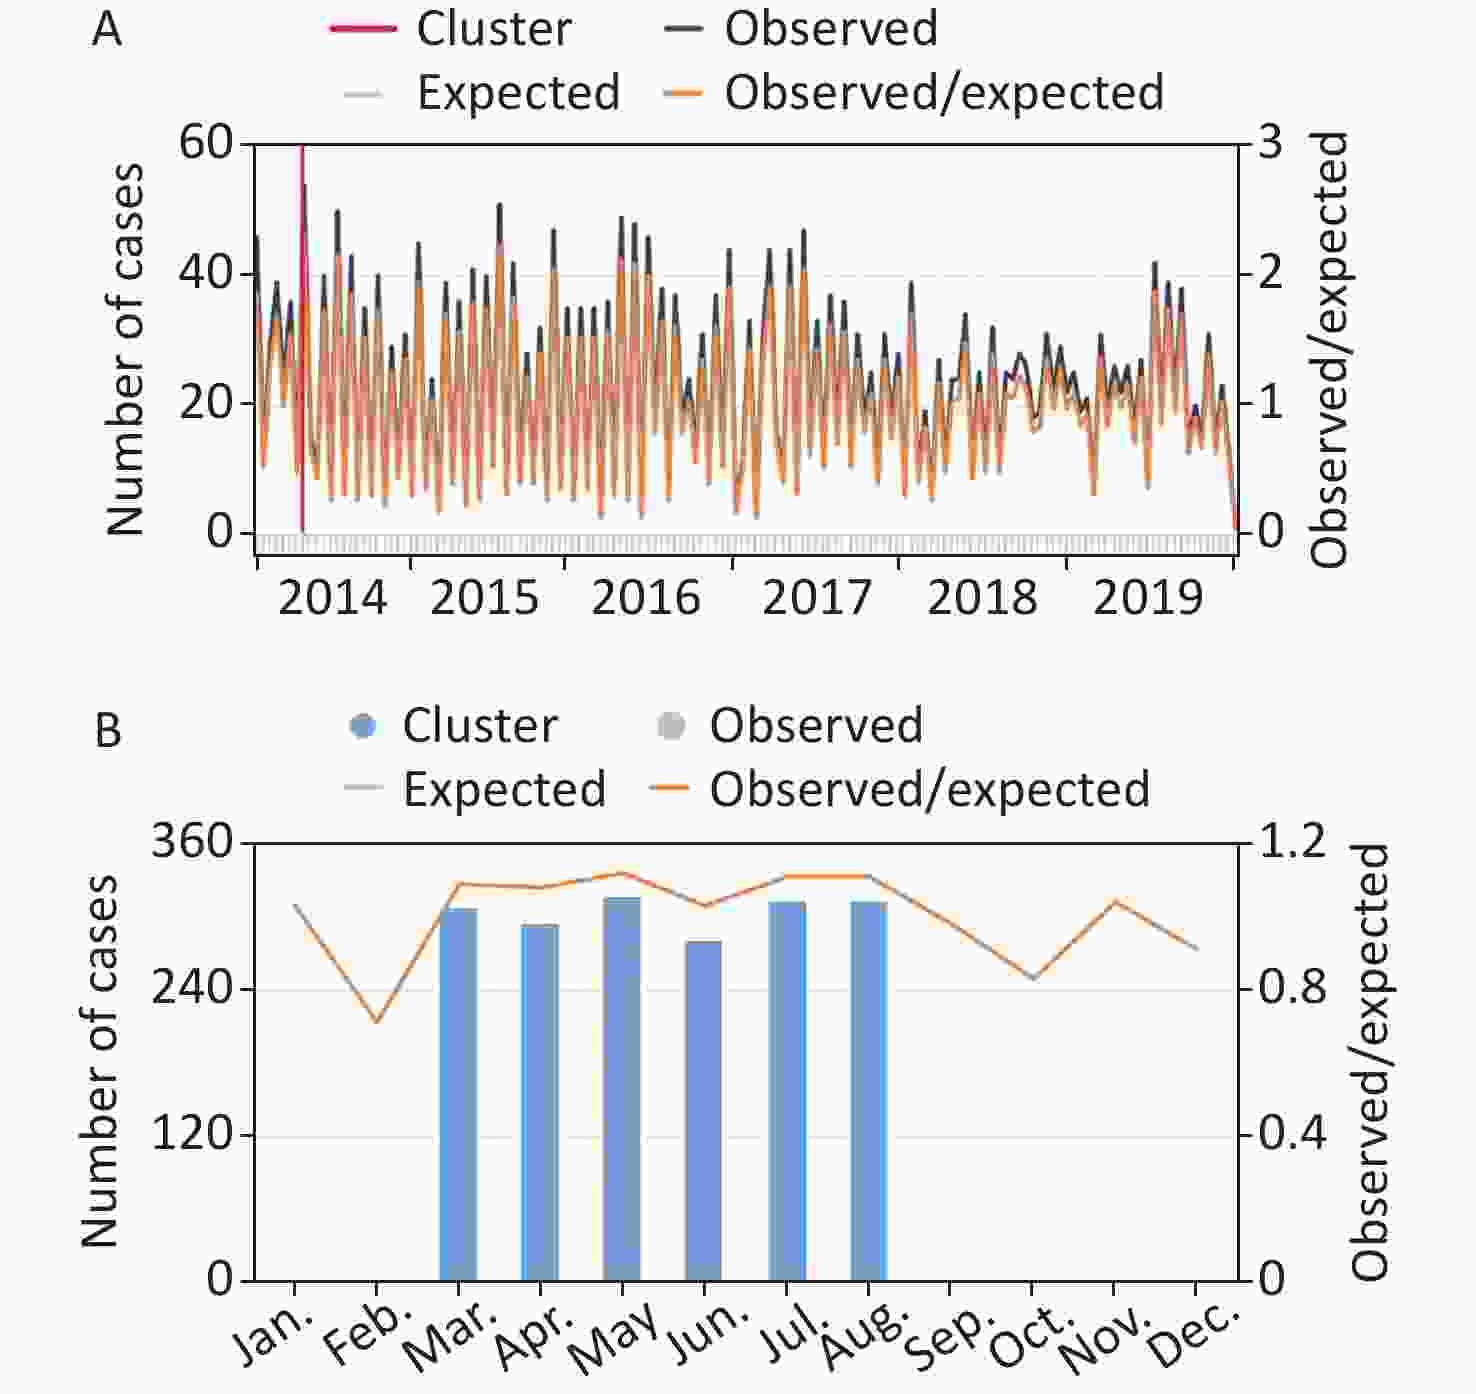
Figure 1. (A) Purely temporal scan analysis graph showing the mostly likely cluster in the time dimension. (B) Seasonal temporal analysis graph presenting the most likely seasonal cluster with the seasonal pattern among 6 years. Graphs were from the HTML produced by SatScan.
The spatial distribution was presented with a notification rate from 2014 to 2019 at the community level, and the cut-off values of the legends during the 6 years were aggregated and adjusted to a unique value in one legend (Supplementary Figure S3, available in www.besjournal.com). The highest-level notification rates were distributed in Wusong and Gaojing communities in 2014, Zhangmiao community in 2015 and 2018, and Luojin community in 2019, respectively. The notification rates of Luodian, Youyi, Miaohang, Yanghang, and Dachang communities were relatively lower.
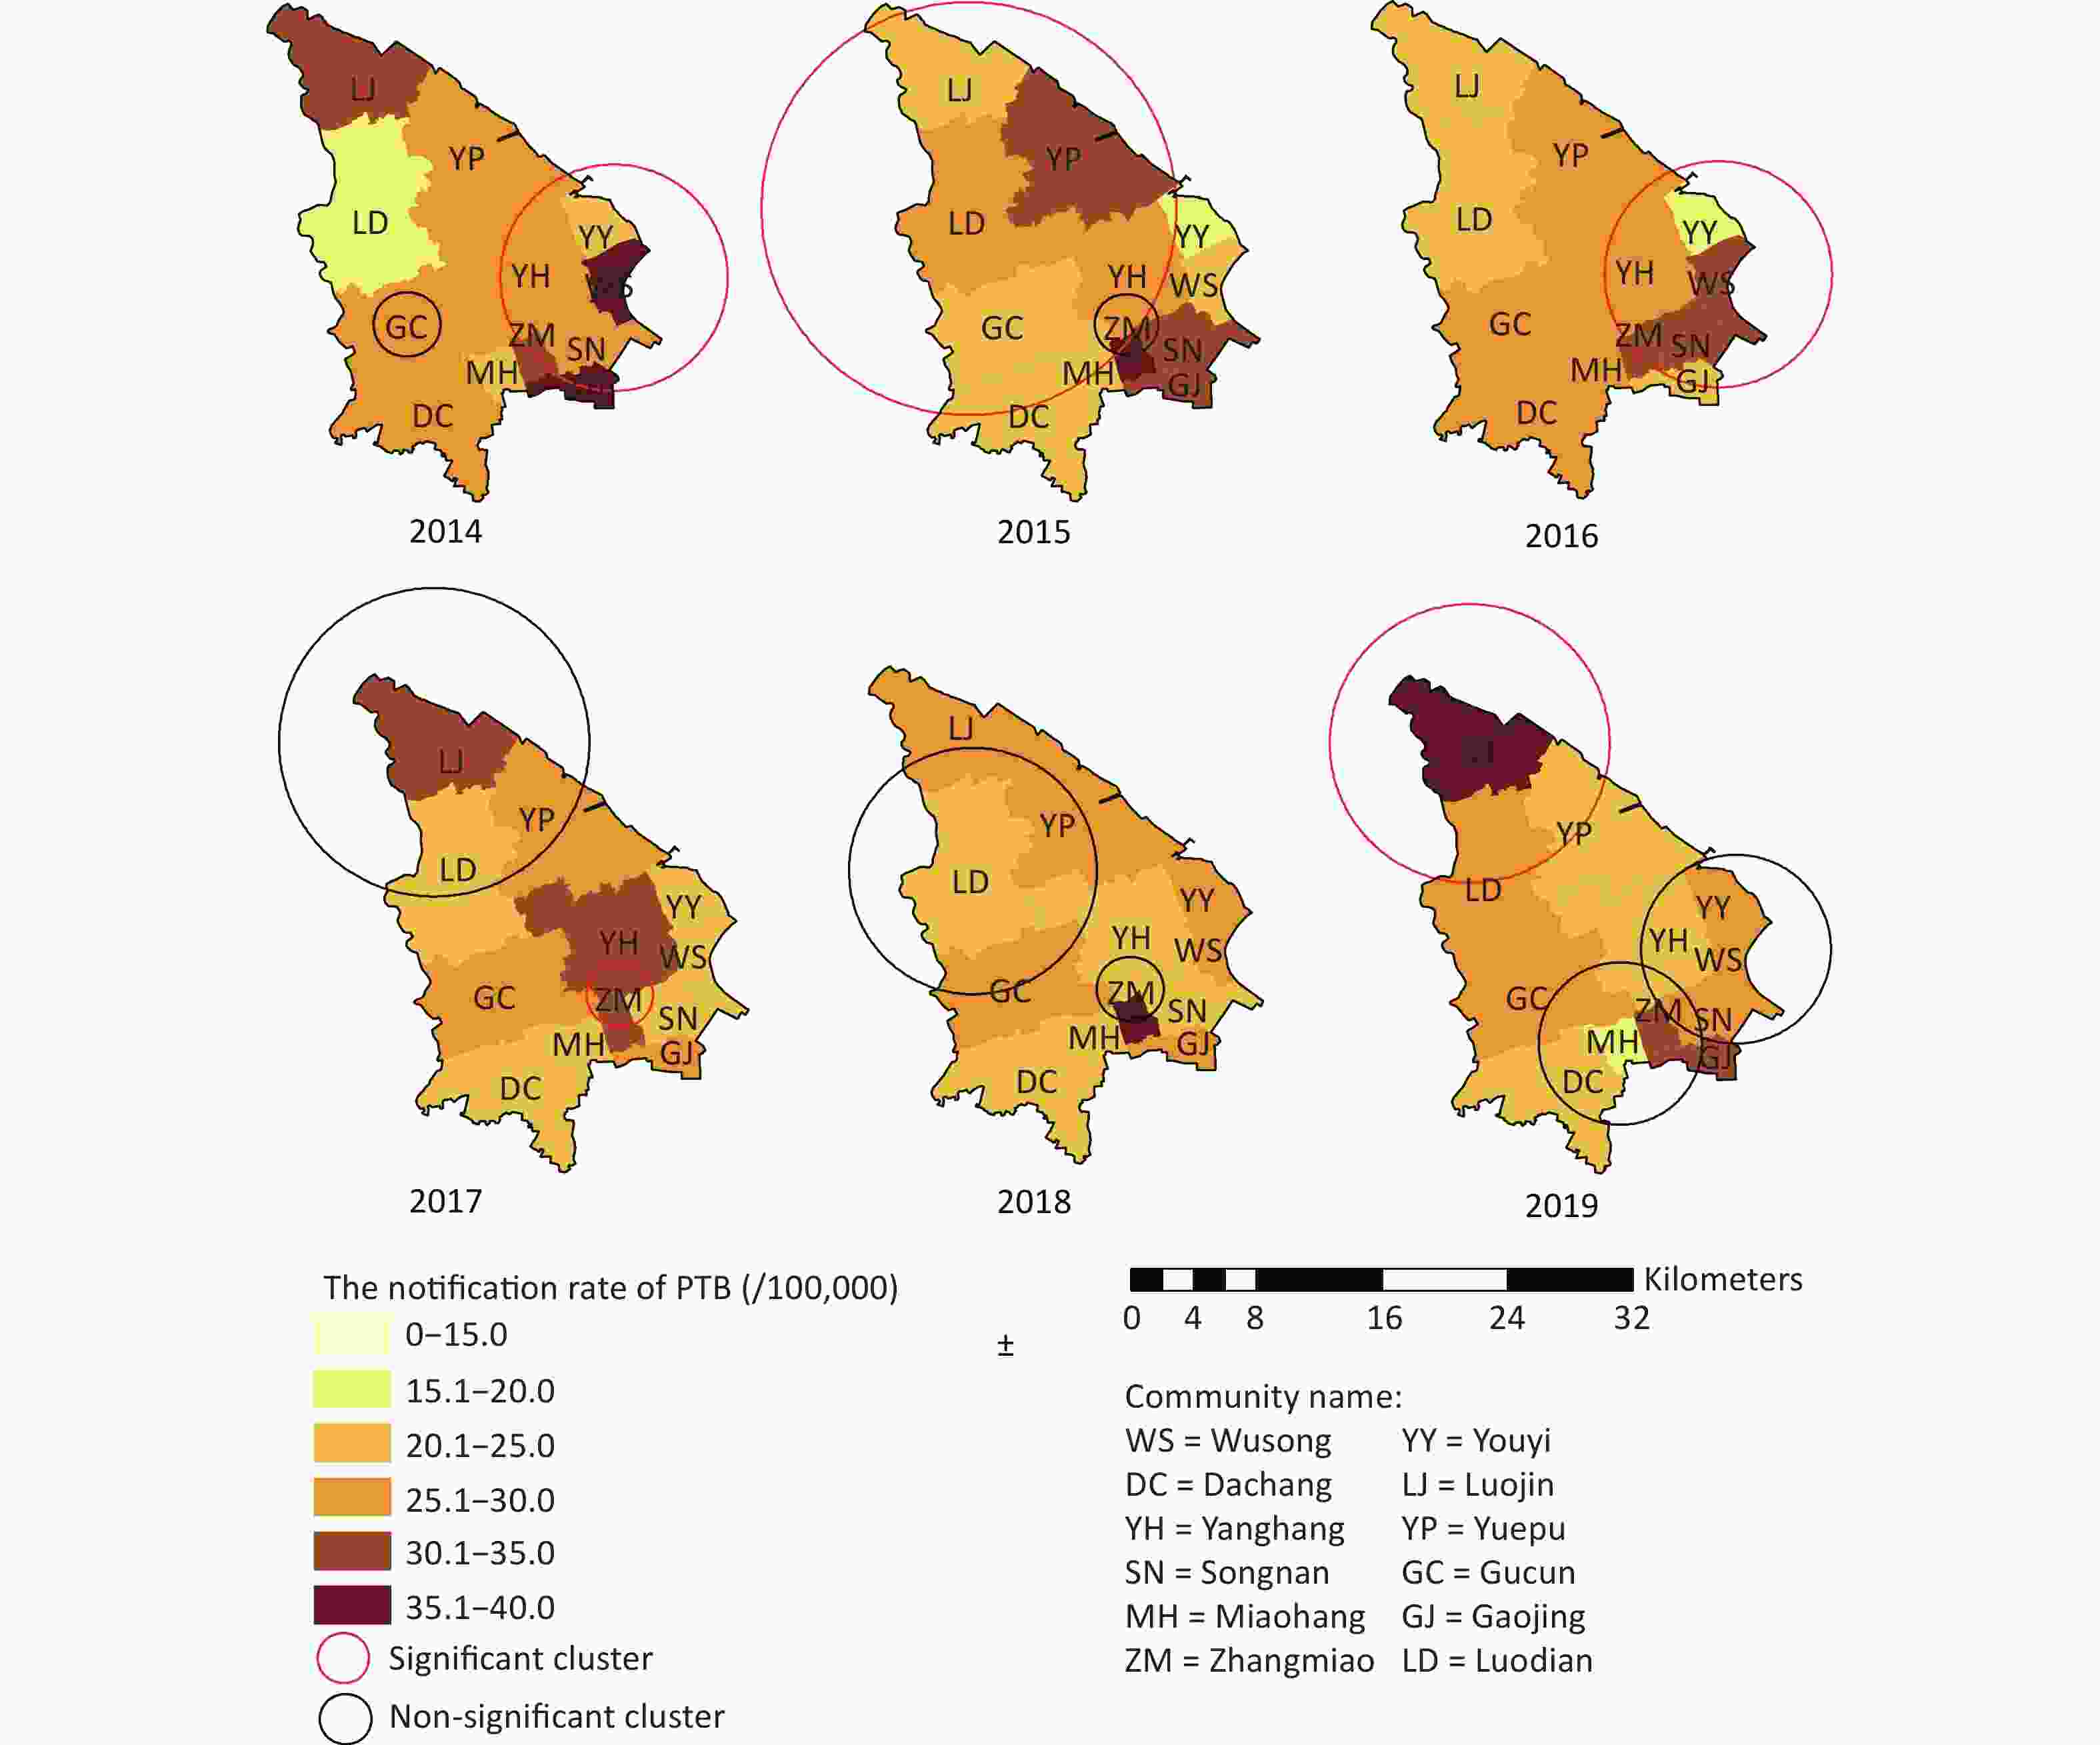
Figure S3. The spatial-temporal cluster of PTB cases at community-level from 2014 to 2019 in Baoshan district, Shanghai (red circle and black circle represents the statistically significant clusters, non-significant clusters respectively).
The result of global spatial autocorrelation analysis indicated the possible clusters with Global Moran’s over 6 years (Supplementary Table S2). No apparent cluster with statistical significance was found through global spatial autocorrelation analysis.
Years Moran’s I Z-score P value Pattern 2014 −0.284 −1.091 0.27 dispersed 2015 0.041 0.756 0.44 clustered 2016 0.039 0.730 0.46 clustered 2017 −0.090 0.0005 0.99 dispersed 2018 −0.121 −0.263 0.79 dispersed 2019 −0.122 −0.188 0.85 dispersed Table S2. Global Moran’s I analysis of PTB in Baoshan district, Shanghai 2014–2019
Supplementary Figure S3 showed the clusters in spatial-temporal dimension, which presented at the community level annually from 2014 to 2019. Five statistically significant clusters with P values < 0.05 were found among a total of 12 clusters; the RR values were all > 1 (Table 1). An outbreak of PTB occurred among students at a school on September 28, 2015[10] which located in the community inside one of five statistically significant clusters through the annual space-time scan analysis in the Baoshan district. A statistically significant cluster suggested a potential outbreak at the community level inside the cluster, and the space-time scan analysis proved to be helpful and effective in detecting a real outbreak. When a statistically significant cluster was found through annual space-time scan analysis, the measures of investigation and controlling intervention adopted among the communities inside the cluster could be more effective and accurate during the early stage of the outbreak compared to the general intervention in the entire district with less resource consumption.
Year Involved communities† Period Observed case Expected
caseP LLR RR 2014 ZM, GJ, SN, YH, YY, WS 5/1−6/4 157 109.40 0.0029* 11.52 1.593 GU 9/18−10/2 13 3.68 0.1350 7.16 3.59 2015 LD, YH, YP, MH, LJ, GC 6/20−7/4 30 10.74 0.0025* 11.90 2.90 ZM 1/1−6/4 38 19.20 0.1310 7.48 2.05 2016 GJ, ZM, SN, YH, YY, WS 4/21−5/5 28 10.03 0.0082* 11.06 2.88 2017 ZM 7/5−9/2 23 7.32 0.0058* 10.88 3.24 LD, LJ, YP 11/17−12/1 14 4.36 0.2120 6.77 3.27 2018 LD, YP, GC 1/1−1/20 21 8.91 0.3550 6.06 2.41 ZM 1/1−5/5 29 14.28 0.3620 6.03 2.09 2019 LD, LJ 6/20−7/4 12 2.49 0.0100* 9.46 4.91 DC, MH, ZM 6/20−9/2 56 35.00 0.4130 5.77 1.67 YH, SN, WS, YY 2/20−3/6 15 6.03 0.7490 4.77 2.53 Note. †Abbreviation for community; WS, Wusong; YY, Youyi; DC, Dachang; LD, Luodian; YH, Yanghang; YP, Yuepu; SN, Songnan; GJ, Gaojing; MH, Miaohang; LJ, Luojin; ZM, Zhangmiao; GC, Gucun; LLR, log likelihood ratio; RR, relative risk; *P < 0.05. Table 1. Annual space-time scan statistical analysis of PTB in Baoshan district, Shanghai from 2014 to 2019
PTB is a disease that is strongly influenced by social, economic, demographic characteristics[5], then the GDP per capita, NTR, and LSGR are involved. The Spearman’s rank correlation test was used to test the associations of social, economic, and demographic characteristics with ranked risk base on the space-time scan analysis over a 6-year span in the study area.
Consequently, the results of the Spearman’s rank correlation test showed that the annual average GDP per capita (
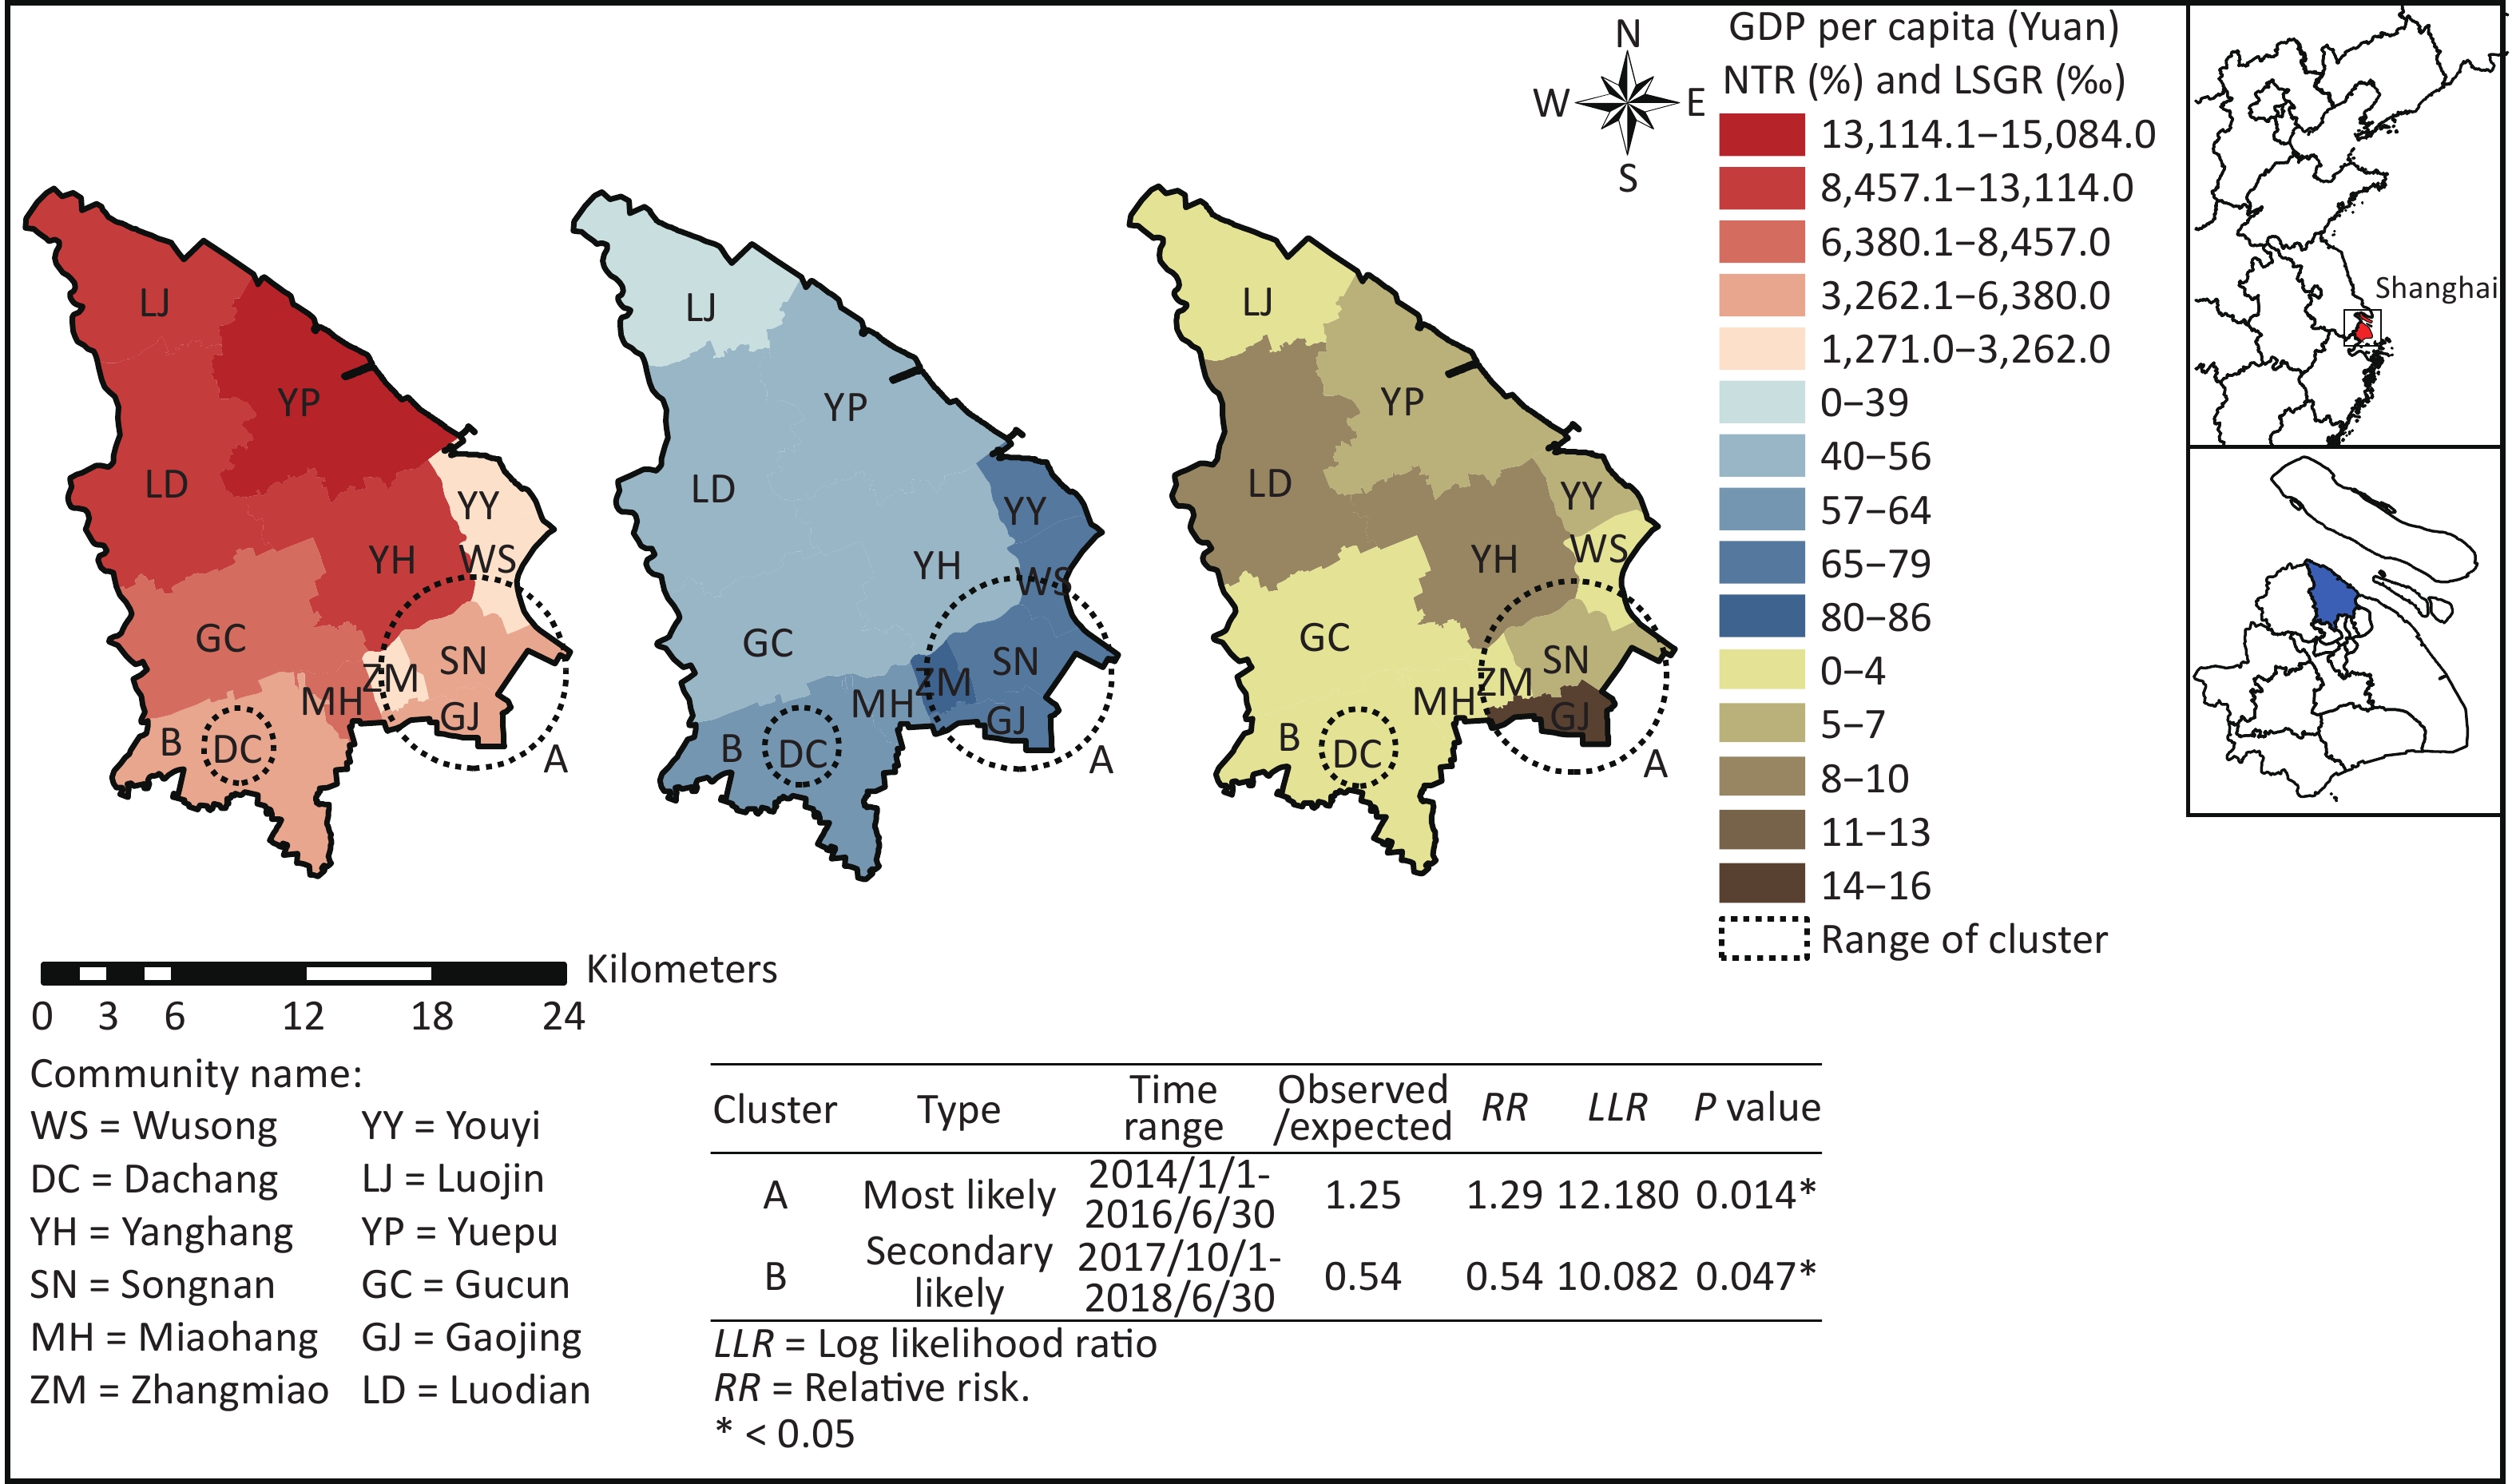
$r_{k \cdot GDP}$ = −0.670, P < 0.05), NTR ($r_{k \cdot MTR}^{}$ = 0.658, P < 0.05), and LSGR ($r_{k \cdot LSGR}$ = 0.703, P < 0.05) presented associations with risk rank of the communities at a statistically significant level in the study area (Supplementary Table S3). The most likely cluster included four communities, and the value of RR was > 1 with a P value < 0.05. The secondary likely cluster was located in one community, and the RR value was < 1 with a P value = 0.047. The communities distributed in the most likely cluster and secondary likely cluster possessed a lower GDP per capita, higher NTR, and higher LSGR compared to the communities outside, which is consistent with the results of the Spearman’s rank correlation test (Figure 2).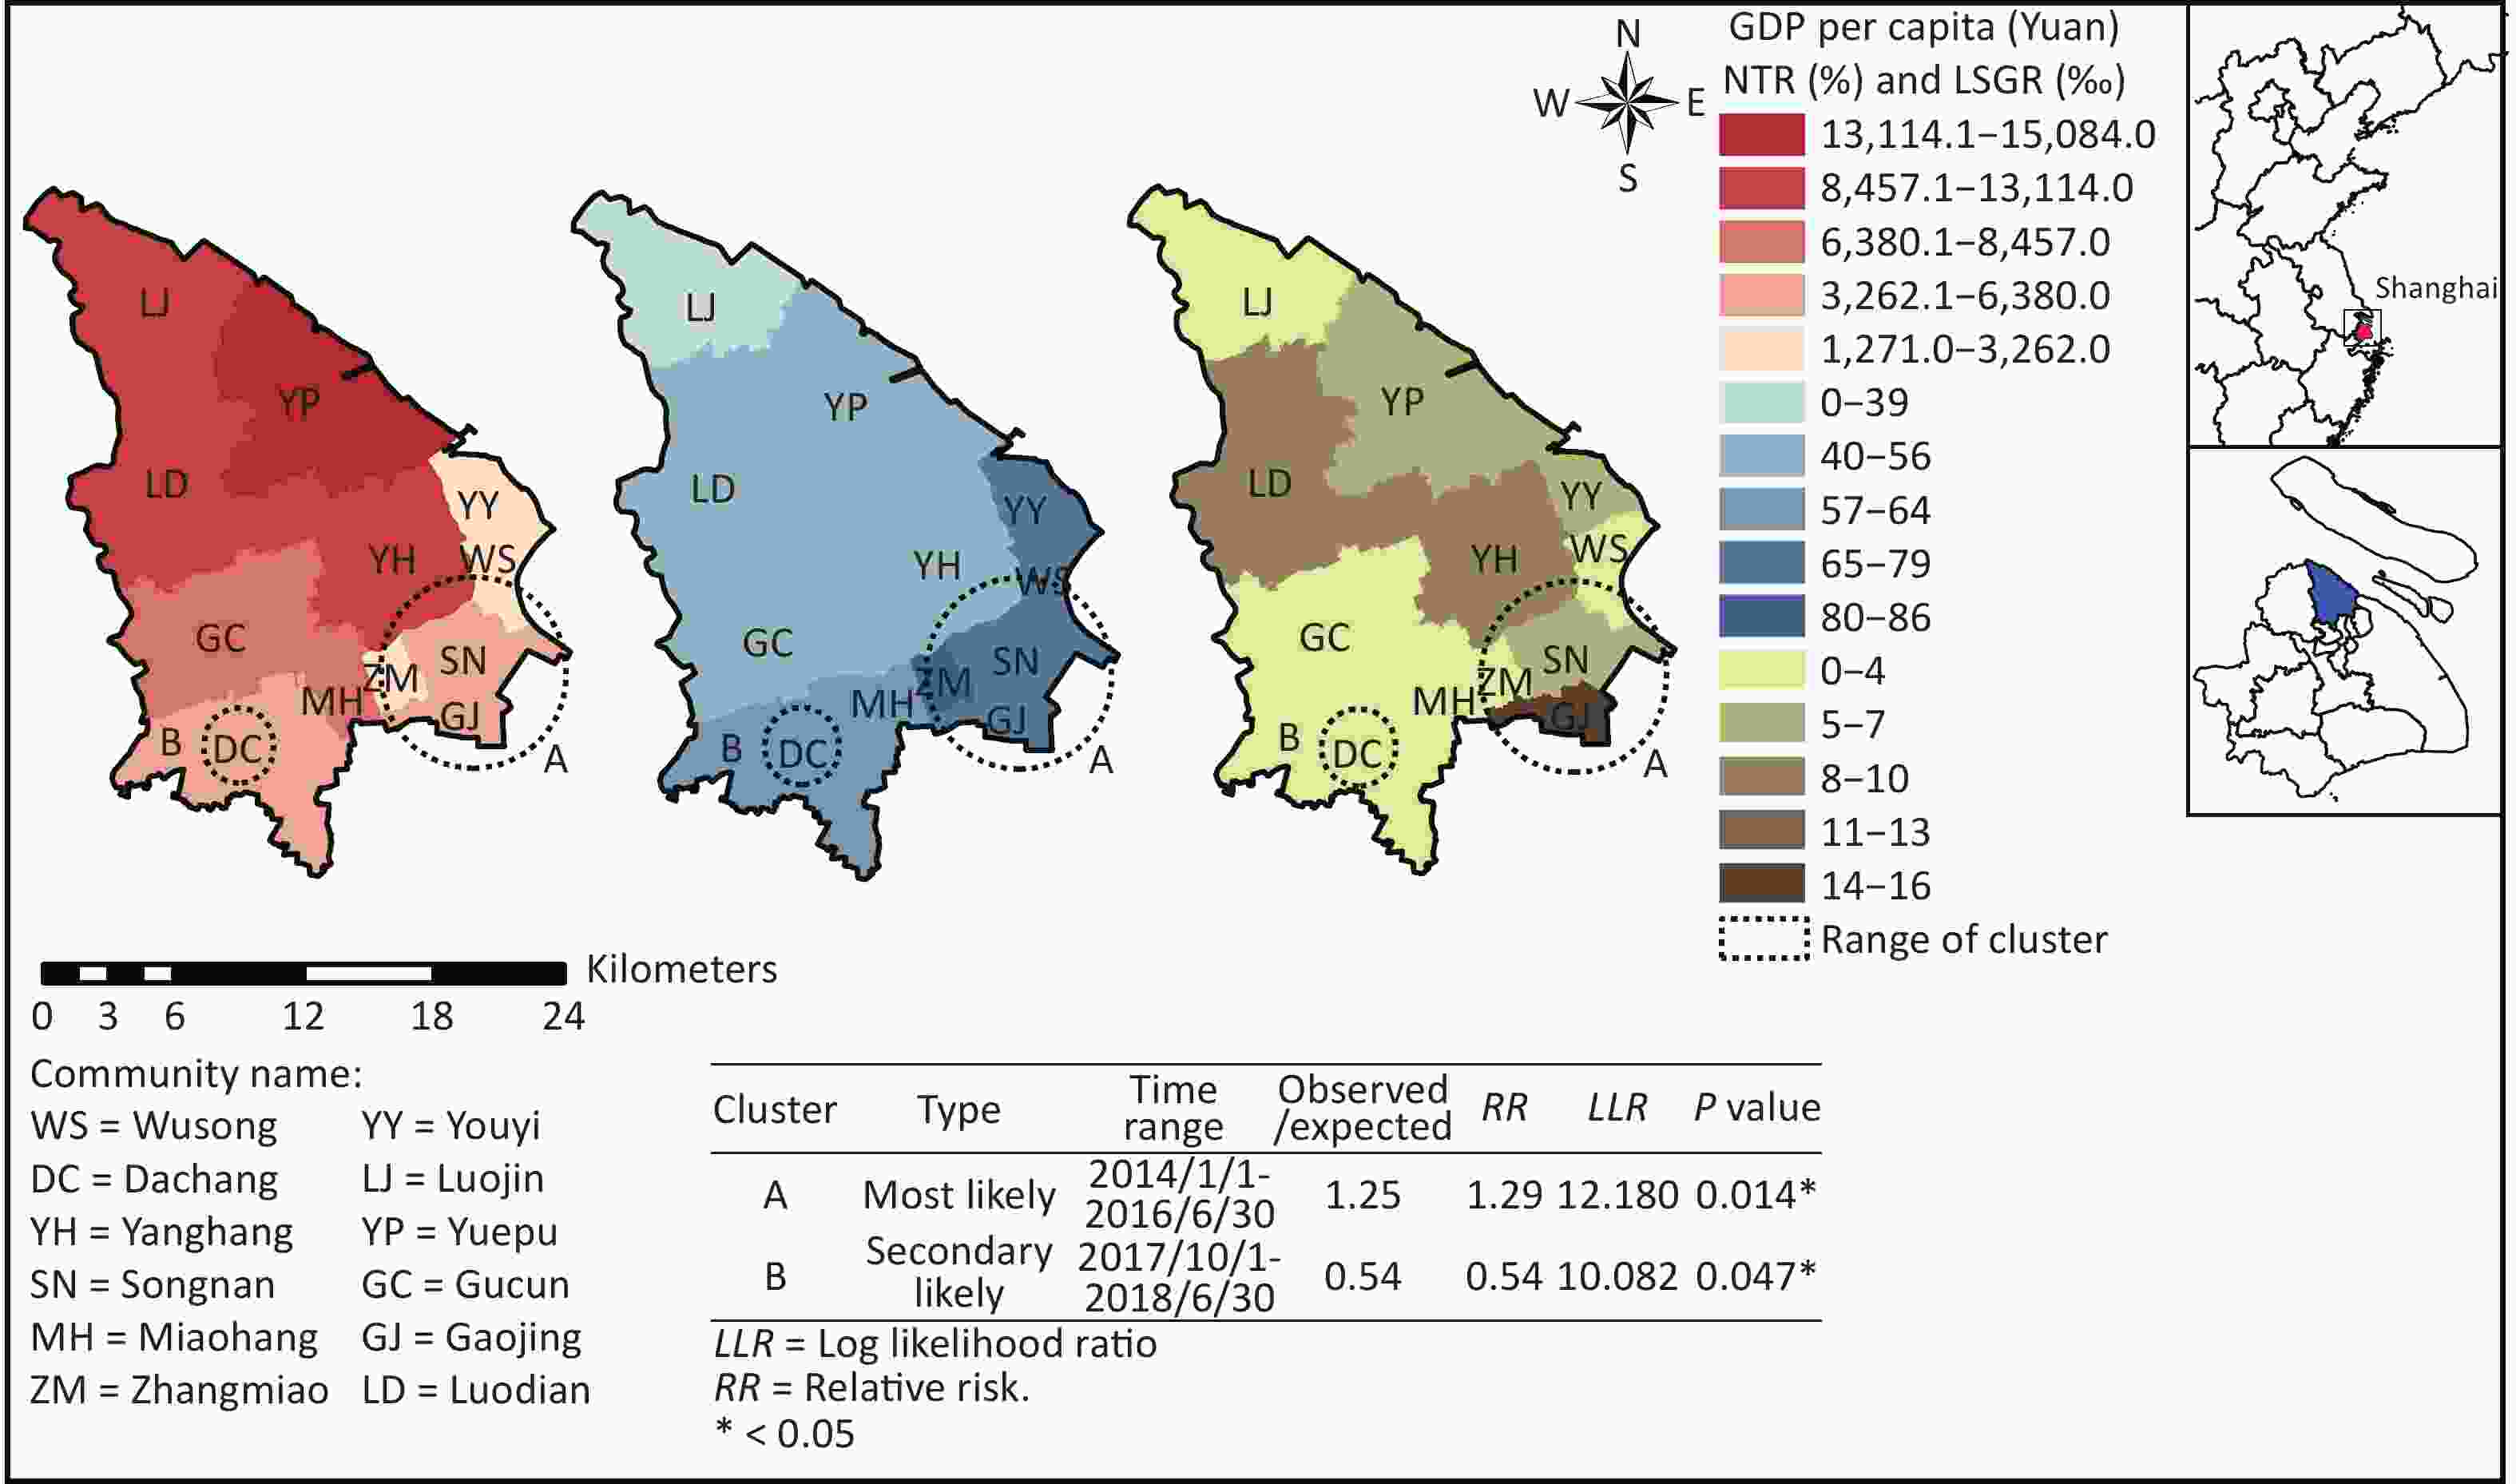
Figure 2. The PTB clusters through space-time scan statistical analysis and distributions of annually average GDP per capita (left), native-total population ratio (middle) and lowest society guarantees rate (right) over a 6-year span in the Baoshan district, Shanghai.
Communities GDP per capita
(Yuan)NTR
(%)LSGR
(‰)Risk rank Yanghang 12,531.4 48.7 1.9 1 wusong 3,262.0 73.4 10.4 3 Dachang 5,623.7 61.5 2.6 2 Songnan 4,982.7 74.6 8.6 3 Zhangmiao 1,270.6 86.0 15.7 3 Miaohang 8,456.8 64.5 2.6 1 Luodian 11,362.2 51.3 3.1 1 Gaojing 6,380.1 76.5 5.6 3 Youyi 3,100.0 79.1 3.0 1 Yuepu 15,084.2 51.1 5.4 1 Gucun 7,150.6 55.7 4.8 1 Luojin 13,113.8 39.0 4.2 1 $ r_k^{} $ −0.670 0.658 0.703 P 0.017* 0.020* 0.011* Note. PTB, Pulmonary tuberculosis; GDP per capita, Gross Domestic Products per capita; NTR, native-total population ratio; LSGR, lowest society guarantees rate; rk, Spearman’s rank correlation coefficient; *P < 0.05. Table S3. The trend between risk rank of PTB and annually average values of GDP per capita (Yuan), native-total population ratio (%), lowest society guarantees rate (‰) respectively over 6 years span from 2014 to 2019 through the Spearman Rank Correlation test in Baoshan district, Shanghai
Bases on the findings in this study, 4 measures were appropriate for the study area below: 1) merging a neo-approach like spatial-temporal analysis into active surveillance for detecting a potential outbreak; 2) enhancing personal protection, like wearing a mask outdoors from winter-to-next spring, based on the seasonal cluster discovered; 3) spreading PTB-related knowledge among a native population based on the social characters associated with the risk of PTB; and 4) improving economic status and LSGR distributed in low-GDP communities based on the economic factor identified significantly associated with risk. We recommend the 4 measures prior to the stakeholders or politicians of high risk communities inside the statistically significant clusters, aiming to control the spreading trend of a potential outbreak and impacting the range of PTB risk. Eventually, by combining the spatial-temporal analysis with active surveillance for factor analysis, a latent outbreak or cluster will be handled at the community level with less time compared to the classic method of surveillance-investigation-controlling.
There were some limitations for this study. First, the sample size at the community level was confined, by which the power of the test may have been affected. Second, the variables involved for identifying association with risk of PTB was limited and more potential factors with a statistically significant trend may exist.
In conclusion, this study detected a seasonal cluster of PTB ranges from March to August, which conformed the pattern of air pollutants. The PTB risk-rank cluster was discovered, and the GDP per capita, NTR, and LSGR were identified as being significantly associated with PTB risk rank of communities in the Baoshan district of Shanghai. We recommend 4 measures prior to the high risk communities to control the next potential TB outbreak, and the effectiveness of the 4 measures being implemented could be verified. This study will bring a new hypothesis: Whether the analysis and corresponding measures can be applied to other airborne diseases, like Covid-19, which will be determined in the future.
Acknowledgements This study was supported by the Center of Disease Control and Prevention in Baoshan district, Shanghai. The authors would like to thank Jeanette J. Rainey of the United States Centers for Disease Control and Prevention (US CDC) for technical support. We appreciate Dr. Lei Zhou from the Chinese Center for Disease Control and Prevention for her support and help with the methodology and study design. All authors are grateful for medical stuffs’ dedications to TB control, protection of the health in the Tuberculosis Prevention and Clinic Departments of the Baoshan district.
Conflicts of interest All authors declare that they have no competing interests.
Author contributions ZM and XS designed the research. ZM, NW, and FH collected data. ZM wrote the first draft of the manuscript and performed the analysis. ZM prepared all figures and tables. ZM and XS interpreted the results. ZM, XS, and XL reviewed and revised the manuscript. All authors read and accepted the final manuscript.
HTML


 21465Supplementary Materials.pdf
|

|

 Quick Links
 DownLoad: