


-
Waist circumference (WC) reflects the presence of fat in the abdomen and is an index of visceral fat and oxidative stress in the body[1]. WC is also a low-cost and quickly acquired anthropometric parameter that has been adopted as an indicator of abdominal obesity and metabolic syndrome[2]. As a good health indicator independent of body mass index (BMI), a high WC is associated with cardiovascular disease[3, 4], stroke[5], type 2 diabetes[6], various types of cancer, premature death [7], depression, cognitive decline[8, 9], osteoporosis[10], frailty[11], and all-cause mortality in the general population[12], among other conditions. Unfortunately, the age-adjusted mean WC increased by 2.7 cm among men and 2.1 cm among women in China between 2010 and 2012 [13]. In the United States, the overall age-adjusted mean WC increased by 3.0 cm between 1999 and 2012[14]. Other developed and developing countries have also reported significant increases in WC[15-18].
Aging is a real global challenge today. The excessive increase in WC must be viewed as a health risk factor in elderly people. The associations between age, physical activity (PA), energy intake, drinking, smoking, education, income, urbanicity, and gender and a high adult WC vary[19-21]. The physiological functions and living habits of the elderly can differ from those of middle-aged people, so health factors may be different. It is important to understand changes in WC and their effect on elderly people to reduce diseases and the economic burden on families and societies.
However, few studies have focused on the effect of WC on the elderly in China or elsewhere[22,23]. We hypothesized that factors affecting WC in the elderly may have different effects on different percentiles of the WC distribution, so different interventional strategies would be needed. The purpose of this study was to explore the temporal trends in the percentile distribution of WC among Chinese adults ≥ 65-year-old and to investigate the related factors.
-
We used data from the China Health and Nutrition Survey (CHNS) household-based survey across eight survey rounds that included 12 provinces between 1993 and 2015. A multistage, stratified, random cluster sampling design within each province ensured a suitable representation of the population[24, 25]. The surveys collected data on health, nutrition, and socioeconomic variables at the community, household, and individual levels using a questionnaire, a dietary survey, and physical measurements. Ethical approval was obtained from the Institutional Review Committees of the University of North Carolina at Chapel Hill, as well as from the National Institute for Nutrition and Health, which is affiliated with the Chinese Center for Disease Control and Prevention (201524). All participants provided informed written consent. Further information on the survey procedures and rationale are in the cohort profile[25].
-
Our sample included adults ≥ 65-years from 12 provinces who participated in the eight survey rounds collected in 1993, 1997, 2000, 2004, 2006, 2009, 2011, and 2015. The total number of observations (age ≥ 65 years) was 12,987. After excluding participants who were pregnant or lactating or who had disabilities (n = 201), those with missing or extreme WC measurements (n = 21), and those with only one measurement (n = 2,672), the final 3,085 participants with 10,093 observations were included in the analysis. Each subject had an average of 3.2 observations.
-
Our key outcome of interest was WC (cm). We measured WC at the midpoint between the bottom of the rib cage and the top of the iliac crest at the end of exhalation. All surveys used identical anthropometric measurement techniques.
-
The categorical covariates included sex (male, female) and educational level (none or primary school, middle school, senior school, or above). The continuous covariates included age, energy intake, total PA, per capita annual family income, and urbanicity level. Energy intake, PA, educational level, marital status, and income data were collected through a questionnaire and a dietary survey.
BMI Height was measured without shoes to the nearest 0.2 cm using the portable SECA206 wall-mounted metal tape. Weight was measured without shoes and in light clothing to the nearest 0.1 kg on a calibrated beam Seca 880 (Digital Scales, Seca Ltd., Birmingham, UK). Identical anthropometric measurement techniques were used in all surveys. BMI was calculated by dividing weight (kg) by the square of the height (m).
PA We estimated the average metabolic equivalent of task (MET) hours per day during a week using CHNS data, including occupational, domestic, active leisure, and travel activities, to deduce an individual’s PA level. This measurement accounted for the average intensity of each activity and the time spent on each activity. A MET is the ratio of a person’s active metabolic rate (the rate of energy expenditure) to their basal metabolic rate when sitting quietly. One MET is one kilocalorie per kilogram per hour of energy cost. We report MET hours per week (MET h/w).
Per Capita Family Annual Income We based per capita income on reported gross annual per capita household income and inflated it to 2015 values using the consumer price index[26].
Energy Intake The survey collected detailed dietary data at the household and individual levels over 3 consecutive days to determine the average daily energy intake for each individual[27, 28]. We report kilocalories per day (kcal/d).
Education Level The number of years of formal education.
Urbanicity Index We calculated this index at the community level using a multicomponent continuous scale. Communities received a maximum of 10 points for each of 12 components, including population density, economic activity, traditional markets, modern markets, transportation infrastructure, sanitation, communications, housing, education, diversity, health infrastructure, and social services [29].
Survey Time We included time as a continuous measure defined as years since 1993.
-
We conducted a descriptive analysis stratified by gender. As the distributions were not normal, we used the Kruskal–Wallis test and the chi-square test to examine the differences in means (or percentages) of these variables over time. We used SAS 9.4 software (SAS Institute Inc., Cary, NC, USA) for the descriptive analysis. We conducted these analyses in 2020. We constructed the WC distribution and percentile curves for 1993, 2004, and 2015 by gender using the lambda-mu-sigma method with the VGAM package in R version 4.0.2 (The R Foundation for Statistical Computing, Vienna, Austria)[30].
To investigate changes in the WC distribution over time, we used a longitudinal quantile regression (QR) to treat the skewed distribution of the outcome variable to describe the full distribution[31]. As the effect of obesity-related covariates was hypothesized to vary across the BMI distribution, the use of QR analysis rather than traditional regression is particularly helpful when the effect of the covariates differs at different levels of the response variable. We fit three models. Model 1 controlled for time only where the time was a surrogate for the time-dependent variables. The coefficients indicated which change in WC was associated with each additional year at a particular percentile of the WC distribution. Model 2 controlled for time and individual characteristics, such as age, PA, education, BMI (kg/m2), diet, and per capita family annual income. Model 3 controlled for time, individual characteristics, and urbanicity. We used the VGAM package in R version 4.0.2 to conduct the longitudinal QRs.
-
Table 1 summarizes the statistics for the variables examined, including changes in individual, household, and community characteristics associated with WC status. The PA level and energy intake decreased gradually from 1993 to 2015. Average age, percentage of energy from dietary fat, BMI, per capita income, and education increased gradually, and the difference in the urbanization index between quartile 1 (Q1) and quartile 3 (Q3) increased.
Wave 1993 1997 2000 2004 2006 2009 2011 2015 Pb Sample size (n) 458 801 1,073 1,308 1,446 1,609 1,989 1,409 Age (years) 69.7
(66.9, 74.5)71.0
(68.0, 75.7)71.3
(67.8, 75.5)71.5
(68.1, 76.2)71.9
(68.6, 76.6)72.2
(68.5, 76.6)72.3
(68.5, 77.0)74.9
(71.6, 78.9)< 0.0001 Male, n (%) 221 (48.3) 391 (48.8) 509 (47.4) 602 (46.0) 644 (44.5) 751 (46.7) 918 (46.2) 647 (46.0) 0.6241 Education
(years)0.0
(0.0, 13.0)0.0
(0.0, 14.0)0.0
(0.0, 15.0)13.0
(0.0, 16.0)12.0
(0.0, 16.0)13.0
(0.0, 21.0)15.0
(0.0, 23.0)16.0
(11.0, 23.0)< 0.0001 Income
(1,000 yuan per year)2.5
(1.4, 4.7)3.0
(1.6, 5.0)4.0
(1.7, 7.2)5.4
(2.7, 10.2)5.7
(2.5, 11.4)9.0
(4.1, 17.0)11.7
(5.2, 21.9)15.4
(5.7, 27.9)< 0.0001 Physical activity
(100 MET h/w)2.3
(1.0, 3.4)0.5
(0.1, 2.5)0.4
(0.1, 1.7)0.4
(0.2, 1.0)0.4
(0.2, 0.9)0.3
(0.1, 0.9)0.4
(0.1, 0.9)0.2
(0.0, 0.5)< 0.0001 Energy intake
(1,000 kcal/d)2.1
(1.7, 2.5)2.0
(1.6, 2.4)1.9
(1.6, 2.4)1.9
(1.5, 2.5)1.9
(1.5, 2.4)1.8
(1.5, 2.3)1.7
(1.4, 2.2)1.7
(1.3, 2.1)< 0.0001 Percentage of energy
from fat (%)25.4
(16.9, 34.4)27.1
(19.1, 35.3)31.1
(23.7, 39.0)29.1
(20.2, 37.3)31.6
(23.4, 39.6)32.1
(24.5, 39.9)34.3
(26.6, 43.2)34.8
(27.3, 42.8)< 0.0001 Urbanization index 50.9
(35.9, 65.4)61.3
(41.9, 72.8)70.5
(48.3, 77.6)73.2
(46.7, 85.0)73.6
(50.7, 85.8)69.2
(51.4, 89.1)74.4
(54.5, 88.3)77.1
(58.1, 90.2)< 0.0001 BMI (kg/m2) 21.4
(19.3, 23.9)21.7
(19.6, 24.1)22.2
(19.9, 24.9)22.5
(20.1, 25.2)22.5
(20.1, 25.2)22.7
(20.4, 25.4)23.2
(20.8, 25.7)23.5
(21.0, 25.9)< 0.0001 WC (cm) 78.0
(71.0, 86.0)79.0
(72.0, 87.0)81.0
(74.0, 90.0)82.0
(74.0, 90.0)82.4
(75.0, 91.0)84.0
(76.4, 91.5)85.0
(77.1, 92.0)86.0
(79.0, 94.0)< 0.0001 Note. aValues are medians (Q1, Q3). bP < 0.05, Kruskal-Wallis test for continuous variables, chi-square test for categorical variables. Table 1 shows that the PA level and energy intake gradually decreased from 1993 to 2015. Average age, energy supply ratio of dietary fat, BMI, per capita income, and years of education gradually increased, and the community urbanization index fluctuation increased. Table 1. Demographic characteristics of the study participantsa
-
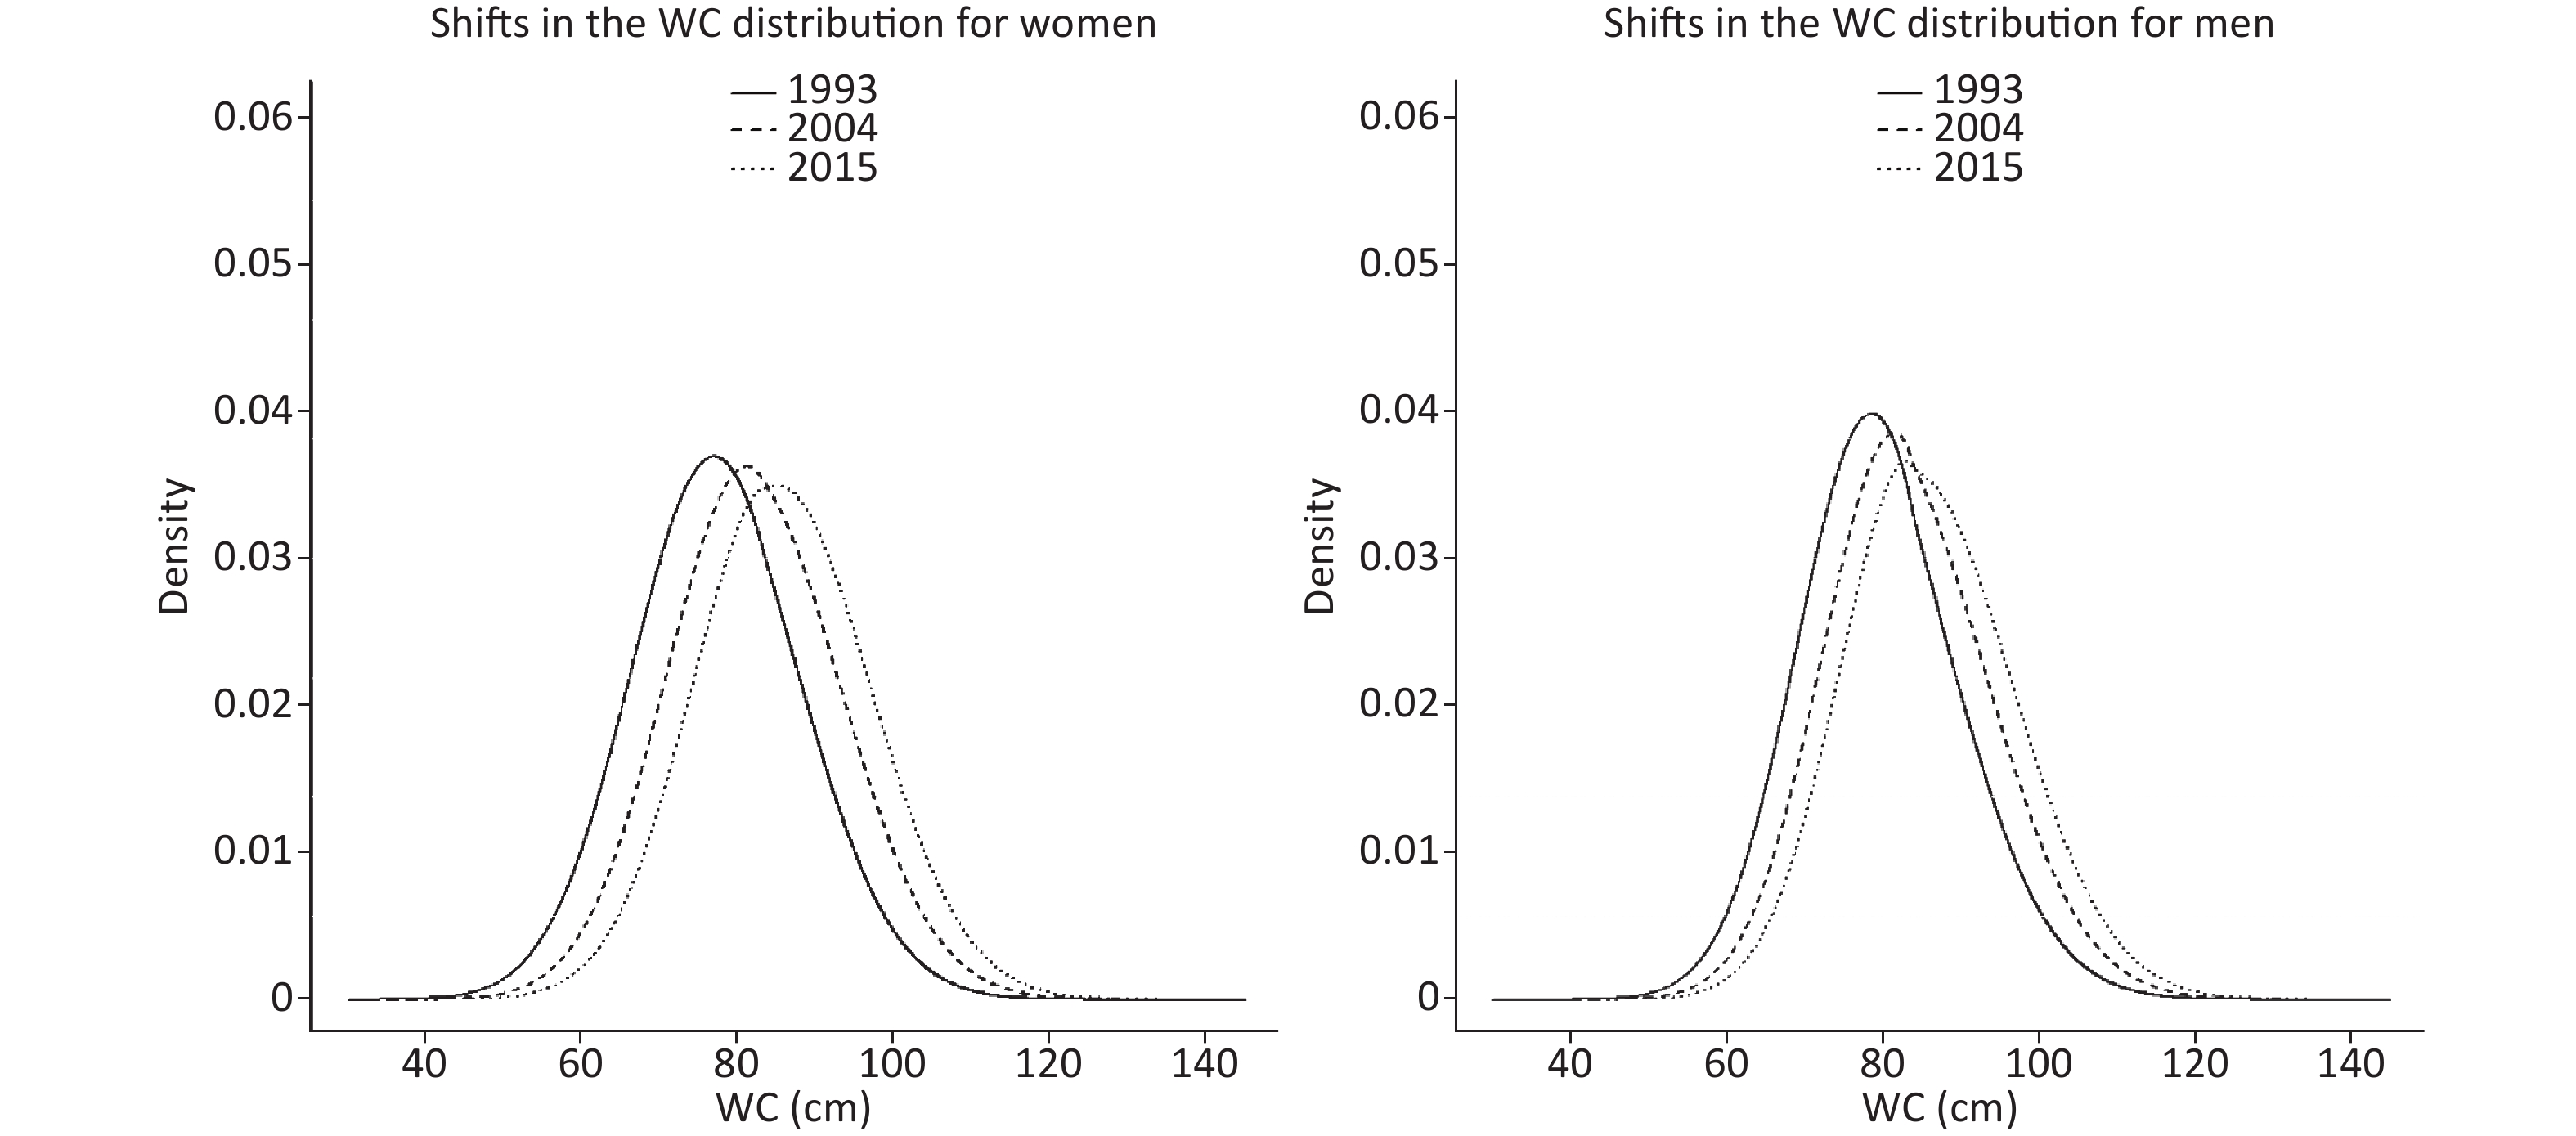
Figure 1 shows the changes in the WC distributions among men and women in 1993, 2004, and 2015. The WC distribution curves widened, shifted to the right, and the peaks decreased from 1993 to 2015. The overall WC level increased, the distributions became wider, and the proportion of participants with a high WC increased. In addition, the curve shifts to the right were larger from 1993 to 2004 than from 2004 to 2015 in both genders. The women’s curve shifted farther to the right and was wider than the men’s, indicating that the increase in WC was larger among women than men.

Figure 1. Shifts in the WC distribution in Chinese women and men (≥ 65 years), during 1993 to 2015, waist circumference (WC) gradually increased among Chinese adults older than 65. The curves shifted to the right with wider distributions and lower peaks in both men and women.
-
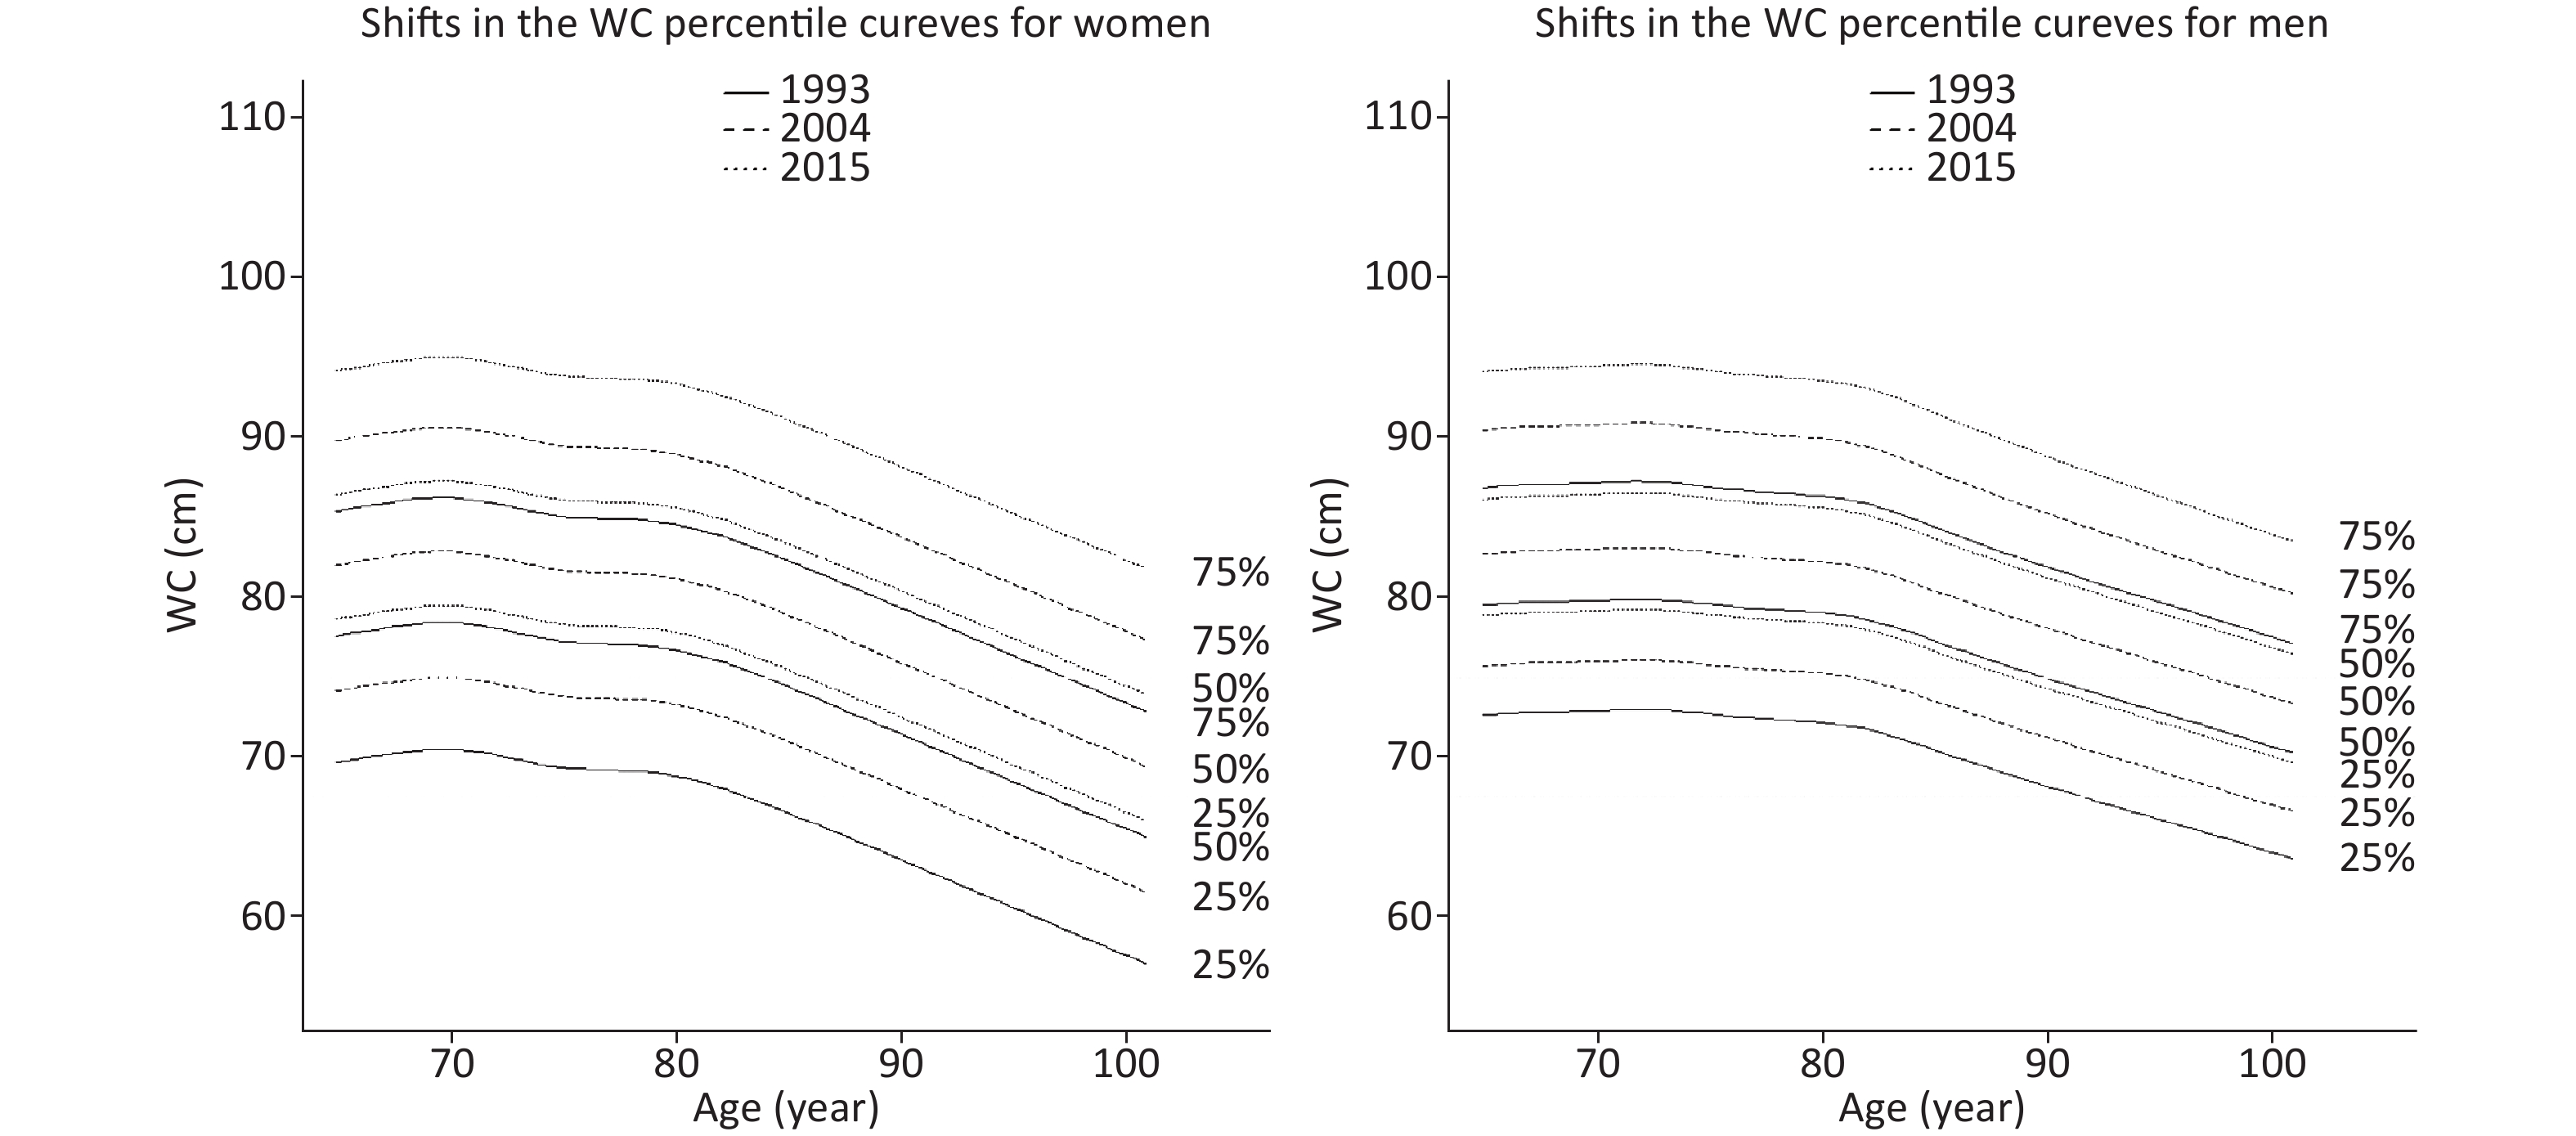
Figure 2 shows the WC percentile curves for the years 1993, 2004, and 2015 by gender and age. The 25th, 50th, and 75th percentiles of gender in men and women trended upward in all age groups, and the increases were the same in the three percentiles. The increases among women were generally higher in all age groups than those among men. The WC distribution slowly increased until the age of 70-years in women and 72-years in men and then declined. The decline accelerated significantly after the age of 80-years in women and 82-years in men. This finding suggests that the WCs of elderly women and men peaked at the ages of 70 and 72-years, respectively, and then declined.

Figure 2. Shifts in the WC percentile curves for Chinese women and men (≥ 65 years), 1993–2015. All WC percentile curves shifted upward with similar growth rates in the 25th, 50th, and 75th percentiles.
-
Table 2 shows the yearly changes in the WC percentiles among women and men based on the longitudinal QR. The results from model 1 suggest a significant increase from the 10th percentile to the 90th percentile for men. The increases were greater in the upper percentiles than in the lower percentiles. For example, the WC increased 0.273 cm at the 75th percentile [95% confidence interval (CI): 0.151, 0.395], whereas the increase was 0.134 cm at the 25th percentile (95% CI: 0.041, 0.228). However, the increases for women were greater in the lower and upper percentiles than in the middle percentiles. The WC increased 0.272 cm (95% CI: 0.141, 0.403) and 0.295 cm in the 10th and 75th percentiles (95% CI: 0.214, 0.376), respectively, whereas the increase was 0.263 cm in the 50th percentile (95% CI: 0.196, 0.330).
Models Coefficients (95% CI) 10th 25th 50th 75th 90th Women Intercept 79.126
(65.853, 92.399)a85.132
(76.201, 94.063)a92.303
(81.690, 102.915)a93.470
(82.633, 104.307)a97.798
(88.238, 107.359)aModel 1 0.272 (0.141, 0.403)a 0.270 (0.187, 0.353)a 0.263 (0.196, 0.330)a 0.295 (0.214, 0.376)a 0.268 (0.171, 0.366)a Model 2 0.204 (0.102, 0.307)a 0.218 (0.164, 0.273)a 0.290 (0.218, 0.361)a 0.328 (0.260, 0.396)a 0.264 (0.148, 0.381)a Model 3 0.193 (0.108, 0.279)a 0.206 (0.138, 0.274)a 0.274 (0.214, 0.334)a 0.325 (0.263, 0.388)a 0.273 (0.163, 0.384)a Men Intercept 96.475
(82.054, 110.896)a82.385
(68.469, 96.302)a94.974
(84.457, 105.491)a85.091
(74.401, 95.781)a89.697
(76.401, 102.994)aModel 1 0.075 (−0.062, 0.212) 0.134 (0.041, 0.228)a 0.196 (0.127, 0.266)a 0.273 (0.151, 0.395)a 0.241 (0.114, 0.368)a Model 2 0.127 (−0.002, 0.256) 0.094 (0.003, 0.185)a 0.164 (0.090, 0.238)a 0.228 (0.137, 0.320)a 0.236 (0.119, 0.354)a Model 3 0.093 (0.002, 0.184)a 0.093 (0.013, 0.173)a 0.144 (0.080, 0.209)a 0.205 (0.128, 0.281)a 0.229 (0.110, 0.347)a Note. Model 1 includes the year only. Model 2 includes the year plus education, income, PA, BMI, and diet. Model 3 includes all of the components in model 2 plus the urbanization index. aP < 0.05. Table 2. Quantile regression results for percentiles based on yearly coefficients (95% CI)
After controlling for individual-level characteristics in model 2 and urbanicity in model 3, the time effect decreased in men but increased at the higher percentiles in women. Compared with the regression coefficient of model 1, the regression coefficient of model 2 had a larger change amplitude than that of model 3 for males and females, indicating that community urbanicity was less correlated with the temporal trend in the WC distribution than the individual characteristics.
-
Table 3 shows the regression coefficients and 95% CIs for the individual characteristics and community urbanicity for the WCs of elderly women and men in the 10th, 25th, 50th, 75th, and 90th percentiles. Among the individual-level characteristics, age was positively correlated in the high percentiles (75th and 90th) of the WC distributions of men and women, and the results were significant. For example, WC increased by 0.128 cm (95% CI: 0.068, 0.188) in women and 0.095 cm (95% CI: 0.022, 0.168) in men when age was increased by 1 year in the 75th percentile. The negative correlation with the PA level was significant in the 50th, 75th, and 90th percentiles. These correlations increased with the percentile of the WC distribution, suggesting that PA has greater potential to decrease the WCs of people with larger WCs. BMI was positively correlated with the WC distribution and had a stronger correlation with the 50th percentile than with the others. Furthermore, education level was positively correlated with the 25th, 50th, and 75th percentiles of the men’s WC distribution. The WC of men in the 50th percentile increased by 0.080 cm (95% CI: 0.036, 0.123) for each additional year of education.
Variables Coefficients (95% CI) 10th 25th 50th 75th 90th Quantile regression model 3 results for women’s percentiles Intercept 28.964
(21.257, 36.672)a25.251
(20.423, 30.080)a26.498
(21.341, 31.655)a25.574
(19.599, 31.550)a27.321
(18.843, 35.800)aAge in 2015 −0.011 (-0.081, 0.058) 0.056 (−0.007, 0.119) 0.062 (0.009, 0.115)a 0.128 (0.068, 0.188)a 0.177 (0.087, 0.268)a Education (years) −0.005 (−0.090, 0.080) −0.006 (−0.036, 0.024) −0.013 (−0.052, 0.027) −0.011 (−0.048, 0.025) 0.034 (−0.055, 0.124) Income
(1,000 yuan per year)0.013 (−0.034, 0.060) −0.008 (−0.028, 0.013) −0.014 (−0.042, 0.013) −0.004 (−0.032, 0.024) −0.012 (−0.057, 0.034) Physical activity
(100 MET h/w)−0.113
(−0.392, 0.166)−0.069
(−0.296, 0.159)−0.233
(−0.394, −0.072)a−0.326
(−0.514, −0.138)a−0.447
(−0.774, −0.120)aEnergy intake
(1,000 kcal/d)−0.353 (−0.870, 0.163) −0.089 (−0.495, 0.317) 0.130 (−0.252, 0.512) 0.120 (−0.360, 0.601) −0.212 (−1.056, 0.633) Percentage of energy
from fat (%)−0.014 (−0.047, 0.018) −0.002 (−0.017, 0.014) −0.004 (−0.023, 0.016) −0.010 (−0.034, 0.014) 0.026 (−0.015, 0.067) BMI (kg/m2) 1.963 (1.832, 2.094)a 1.994 (1.905, 2.083)a 2.125 (2.040, 2.210)a 2.075 (1.939, 2.211)a 1.937 (1.805, 2.070)a Urbanization index 0.010 (−0.021, 0.041) 0.012 (−0.006, 0.031) −0.020 (−0.040, 0.001) −0.015 (−0.037, 0.008) −0.006 (−0.044, 0.032) Quantile regression model 3 results for men’s percentiles Intercept 37.249
(24.149, 50.350)a28.872
(19.389, 38.354)a23.497
(15.084, 31.910)a27.856
(18.588, 37.124)a32.678
(23.203, 42.153)aAge in 2015 −0.031 (−0.120, 0.058) −0.009 (−0.086, 0.069) 0.055 (−0.005, 0.116) 0.095 (0.022, 0.168)a 0.118 (0.032, 0.203)a Education (years) 0.049 (−0.047, 0.145) 0.053 (0.022, 0.084)a 0.080 (0.036, 0.123)a 0.062 (0.021, 0.103)a 0.029 (−0.064, 0.123) Income
(1,000 yuan per year)0.020 (−0.025, 0.065) 0.006 (−0.020, 0.031) 0.007 (−0.020, 0.035) 0.005 (−0.024, 0.034) 0.009 (−0.026, 0.043) Physical activity
(100 MET h/w)−0.233
(−0.565, 0.099)−0.150
(−0.348, 0.049)−0.232
(−0.403, −0.060)a−0.282
(−0.491, −0.073)a−0.290
(−0.544, −0.037)aEnergy intake
(1,000 kcal/d)0.164 (−0.488, 0.816) 0.104 (−0.239, 0.446) 0.217 (−0.120, 0.553) −0.006 (−0.427, 0.414) 0.074 (−0.458, 0.606) Percentage of energy
from fat (%)0.021 (−0.009, 0.052) 0.019 (−0.008, 0.047) 0.003 (−0.020, 0.026) 0.010 (−0.018, 0.039) 0.040 (0.003, 0.077)a BMI (kg/m2) 1.700 (1.342, 2.058)a 2.086 (1.909, 2.263)a 2.246 (2.060, 2.433)a 2.073 (1.937, 2.209)a 1.888 (1.713, 2.063)a Urbanization index 0.019 (−0.018, 0.057) 0.030 (0.008, 0.053)a 0.018 (0.000, 0.037) 0.019 (−0.007, 0.044) 0.010 (−0.014, 0.033) Note. aP < 0.05 Table 3 shows the regression coefficients and 95% CIs of the individual and community factors for the WCs of elderly people of different genders (10th, 25th, 50th, 75th, and 90th). Table 3. Regression coefficients and 95% CIs of the individual characteristics and urbanicity
Community urbanization was positively correlated with the WC distribution of men but was only significant at the 25th percentile. For every 1-point increase in the urbanization index, the WC of men in the 25th percentile increased by 0.030 cm (95% CI: 0.008, 0.053).
-
Taken together, our analyses of the CHNS longitudinal data show that the WCs of elderly Chinese adults increased between 1993 and 2015 based on distribution shifts in the WC. Different factors had different relationships with WC. PA was a definite protective factor, particularly for older people with larger WCs.
The mean WC of Chinese adults ≥ 65-years increased by 8.0 cm in the 22 years from 1993 to 2015 and by 4.0 cm between 2000 and 2011. An Australian descriptive study that followed participants ≥ 25-years-old for 12 years (1999/2000–2011/2012) reported that WCs increased by an average of 2.8 cm (95% CI: 2.1, 3.6) in those 65–74-year-old and by 0.8 cm (95% CI: −1.2, 2.7) in those ≥ 75-year-old. Women’s WCs have increased more than men’s[15]. In England, the median WC of adults aged 70–79-years rose 4.2 cm in men and 4.1 cm in women between 1993 and 2010. The WC distribution shifted upward over time and changed more at the upper end of the distribution[16]. The general individual characteristics were more correlated than community urbanicity.
-
To the best of our knowledge, the current study is the first age- and gender-specific analysis of the temporal trends in WC and its relationship with potential risk factors in an elderly Chinese population. WC increased more in elderly women, and this increase was uniform in all percentiles. The CHNS data also show that the proportion of women with high WCs was larger than the proportion of men with high WCs between 1993 and 2011 [32]. Studies have confirmed that gender is important to body composition and the accumulation and distribution of body fat due to the effects of sex hormones[33]. Hormonal changes in women after menopause make it more likely that adipose tissue will accumulate in the abdomen[34], suggesting a need to pay attention to the trends and changes in women’s WCs.
Although the overall WCs of older people increased over the 22 years of our study, the absolute value of the WC in older people decreased with age after 70-years in women and 72-years in men. Similarly, a study of WC trends among older people in the United Kingdom reported that abdominal obesity was more frequent in those aged 70–79-years than in those aged 80–89-years[16]. This may be due to physiological changes related to aging, such as decreased digestive function and reduced food intake, resulting in reduced energy intake, muscle atrophy, and disease.
-
PA was negatively correlated with WC, which is consistent with previous findings that total leisure-time PA is inversely associated with WC. The hazard of abdominal obesity decreased with the increase of moderately vigorous PA[35]. A study in Spain also showed that more time spent in vigorous PA was associated with a lower risk of abdominal obesity[36]. However, the PAs of male and female participants were significantly correlated with their WCs at the upper end of the distribution, suggesting that a different strategy should be adopted for people with different WCs. It may be more meaningful to encourage people with high WCs to increase their PA.
Notably, several studies showed no increase in PA levels among the elderly even though they may have more time to engage in PA. The elderly group has the lowest levels of PA compared to the other age groups[37, 38]. The main reasons for physical inactivity among older people are diseases, fear of injuries and falls, lack of energy and weakness, low motivation, and lack of partners or friends for joint activities[38]. Therefore, we should find effective ways to address these problems and increase elderly PA.
-
Higher levels of urbanization mean that the diets of older people have shifted toward the modern dietary pattern with high intakes of fruit, fast food, and processed meat[34]. However, in our study, no correlation was detected between WC and urbanization. Previous studies showed that a low level of education was responsible for a higher WC[16] and central obesity[18,20]. Our study more specifically showed that education was positively correlated with the middle (the 25th, 50th, and 75th percentiles) WC distribution in men. During our study period, the dietary energy intake of our participants decreased gradually, and the proportion of energy from fat tended to increase with age, but the change was not significant. This was consistent with a previous study[39]. Another study showed that a modern dietary pattern is positively associated with central obesity and that a traditional dietary pattern was inversely correlated with central obesity [40]. Thus, the correlation between diet and WC should be studied comprehensively.
-
This study had some limitations that should be discussed. First, the elderly dine out more frequently than before, and our investigation may have underestimated the energy intake level and the fat to energy supply ratio. Second, the impact of the urbanization index was inconsistent with previous research conclusions. The reason may be that the constituent index of the urbanization index was established more than 10 years ago, and modern urbanization has new characteristics. New indicators that better reflect the level of modern urbanization should be included in the future. Despite these limitations, our study had some strengths. For example, our research focused specifically on the WC levels of the elderly. The longitudinal nature of individual and community variables was considered, and their correlations were analyzed with the change in the WC distribution. QR allowed a more detailed and reliable analysis of the distribution and trends of the indicators.
-
The WCs of Chinese elderly people increased rapidly over our 22-year study period. These increases occurred in every percentile and were greater among women. Notably, the increase has likely continued after 2015 and is associated with ongoing urbanicity and modernization. The body functions and lifestyles of elderly people have their characteristics. PA had the most significant correlation with the increase in WC. Community groups offering volunteer-led, socially-oriented activity programs would provide an opportunity for older people to maintain or increase PA levels and promote their health[41]. The more elderly people are supported by their families, the more likely they are to exercise[42]. Therefore, we should enhance the social support of the elderly through organizations, such as universities, activity centers, and cultural institutions, and encourage family members to participate in the lives of the elderly. Future research should subdivide the dietary and exercise factors into areas of concentration.
-
Dr. YANG Xin Li and Prof. OUYANG Yi Fei conceived the study and drafted the manuscript. Ms. ZHANG Xiao Fan, Prof. SU Chang, and Ms. BAI Jing assisted with the data analyses. Prof. ZHANG Bing, Mr. HONG Zhong Xin, and Prof. DU Shu Fa contributed to the interpretation of the results and writing of the article. Prof. WANG Hui Jun directed all aspects of the study, including the conceptualization, writing, review, and editing. All authors have read and approved the final version of the manuscript.
-
The authors declare no conflicts of interest. None of the funding sources had any role in the manuscript.
-
We thank all volunteers who participated in the survey.
Funds:
Nutrition and Health, Chinese Center for Disease Control and Prevention, Carolina Population Center, the University of North Carolina at Chapel Hill [5 R24 HD050924]; the National Institutes of Health [R01-HD30880, DK056350, R24 HD050924, and R01-HD38700]; the Chinese Institute of Food Science and Technology [2020-09]; the National Natural Science Foundation of China [No.82103848]
&These authors contributed equally to this work.
 Quick Links
 DownLoad: