


-
China currently has the highest prevalence of diabetes mellitus (DM) worldwide. Diabetic retinopathy (DR), the major complication of DM, is the leading cause of blindness in the working age group. An epidemiologic study conducted in northern China reported that the overall prevalence of DR was 43.1% in a rural DM population > 30 years of age [1], and the Beijing Eye Study showed that the prevalence of DR among urban DM patients > 40 years of age in north China was approximately 37% [2]. Thus, one-third of diabetic adults will develop DR.
Age-related macular degeneration (AMD) is the leading cause of blindness in adults > 50 years of age, with a global prevalence of 8.7% [3,4]. The early and late AMD age-standardized prevalence rates among adults > 50 years of age were 4.7% and 0.2%, respectively. The prevalence of early AMD in a rural Chinese sample was similar to Caucasians, while the prevalence of late AMD was lower [5,6]. Because China has the largest global population and with the growth of the aging population, the disease burden of AMD is a serious public health issue [7].
Both DR and AMD are blinding eye diseases that severely affect visual function and the quality of life, and even more so when combined. Although DR and AMD are two leading blinding eye diseases, there are still some contradictions and disputes about the relationship between DR and AMD. It has been shown that DM promotes the occurrence and development of AMD [8-12]. Other studies have shown that simple DM, unlike DR, does not promote the occurrence and development of AMD [13]; however, there is no apparent relationship between DM and AMD[14-18]. Moreover, it has been shown that DR has a protective effect and can reduce the incidence of AMD [19-21].
Hypertension and hyperlipidemia are often complicated by DM; however, the relationship between hypertension and AMD has not been established. Some epidemiologic studies have reported that essential hypertension is a risk factor for AMD; however, there are some inconsistencies regarding the role of hypertension in the pathogenesis of AMD. Specifically, there are no data in the literature to support the view that antihypertensive medications and the successful management of hypertension have a positive effect on the clinical outcome of AMD [22-24].
The relationship between hyperlipidemia and AMD is also controversial. Epidemiologic studies that evaluated the blood lipid levels in patients with AMD and shown an inverse relationship between lipid levels and AMD risk [25-27].
The epidemiologic data on the relationship between DM and AMD are limited in Chinese populations. The aim of this study was to determine if there is a difference in the prevalence of AMD between diabetic and non-diabetic subjects in a north Chinese population-based epidemiologic study; the effect of co-existing hypertension and hyperlipidemia on the prevalence of AMD will also be determined. Further, whether DM, hypertension, and hyperlipidemia are risk factors for AMD will be determined and the correlation between DM and AMD will be clarified.
-
The Kailuan Eye Study was a cross-sectional study conducted in 2016. The research followed the tenets of the Declaration of Helsinki. The Medical Ethics Committee of the Beijing Tongren Hospital approved the study protocol, and informed consent was obtained from every individual after explaining the nature and possible consequences of the study. The present study consisted of 14,440 individuals who had undergone an ophthalmologic examination, including ocular fundus photography. Body height and weight and the circumference of the waist and hip were measured and the body mass index (BMI) was calculated. The blood pressure and heart rate were assessed with the participants sitting for at least 5 min. Under fasting conditions, blood samples were collected to determine the concentrations of blood glucose, high-density lipoprotein-cholesterol (HDL-C), low-density lipoprotein-cholesterol (LDL-C), triglycerides (TG), and total cholesterol (TC) levels.
-
The diagnostic criterion for diabetes was a fasting blood glucose concentration of ≥ 7.0 mmol/L, a self-reported history of diabetes, or a history of medication with a hypoglycemic agent, including patients who no longer required medication to maintain good blood glucose control.
The diagnostic criterion for hypertension was a blood pressure ≥ 140/90 mmHg, a history of hypertension, or use of antihypertensive medications.
The basic components of the blood lipid profile include TC, TG, LDL-C, and HDL-C. The diagnostic criterion for hyperlipemia was based on the 2016 Chinese guidelines for the management of dyslipidemia in adults [28] (Tables 1 and 2).
Stratification TC LDL-C HDL-C Non-HDL-C TG Ideal level < 2.6 (100) < 3.4 (130) Appropriate level < 5.2 (200) < 3.4 (130) < 4.1 (160) < 1.7 (150) Marginal elevation ≥ 5.2 (200) and
< 6.2 (240)≥ 3.4 (130) and
< 4.1 (160)≥ 4.1 (160) and
< 4.9 (190)≥ 1.7 (150) and
< 2.3 (200)Elevation ≥ 6.2 (240) ≥ 4.1 (160) ≥ 4.9 (190) ≥ 2.3 (200) Reduction < 1.0 (40) Note. TC, total cholesterol; LDL-C, low density lipoprotein cholesterol; HDL-C, high density lipoprotein cholesterol; Non-HDL-C, non-high density lipoprotein cholesterol; TG, triglyceride. Table 1. Appropriate level and abnormal stratification standards of blood lipids in primary prevention of atherosclerotic cardiovascular disease (ASCVD) in China [mmol/L (mg/dL); 2016 edition]
Type TC TG HDL-C Equivalent to WHO phenotype Hypercholesterolemia Elevation IIa Hyperglycemia Elevation IV, I Mixed hyperlipidemia Elevation Elevation IIb, III, IV, V Low HDL-C Reduction Note. TC, total Cholesterol; TG, triglyceride; HDL-C, high density lipoprotein cholesterol. Table 2. Clinical classification of hyperlipidemia
The criteria for BMI was based on guidelines for prevention and control of overweight and obesity in Chinese adults, as follows[29]: underweight, BMI < 18.5 kg/m2; normal weight, BMI 18.5–23.9 kg/m2; overweight, BMI 24.0–27.9 kg/m2; and obesity, BMI ≥ 28.0 kg/m2.
The diagnostic criteria for AMD were based on the Beckman Macular Research Classification [30], as follows: no apparent aging changes (no drusen and no AMD pigmentary abnormalities), normal aging changes (only small drusen ≤ 63 μm and no AMD pigmentary abnormalities); early AMD (medium drusen > 63 μm and ≤ 125 μm and no AMD pigmentary abnormalities); intermediate AMD (large drusen > 125 μm and/or any AMD pigmentary abnormalities); and late AMD [neovascular AMD and/or any geographic atrophy (GA)].
-
The ophthalmologic examinations included measurement of visual acuity, tonometry, and slit lamp-assisted biomicroscopy of the anterior segment of the eye. Using a non-mydriatic fundus camera (CR6-45NM; Canon, Tokyo, Japan), we obtained two 45° fundus photographs centered on the optic nerve head and on the macula. If fundus photographs with sufficient photographic quality could not be obtained due to the pupil diameter, we dilated the pupil medically by applying eye drops containing 0.5% tropicamide and 0.5% phenylephrine hydrochloride. The photographs were assessed by an experienced and trained ophthalmologist. Non-diagnostic photographs were reassessed by a panel comprised of several ophthalmologists.
-
Statistical analyses were performed using a commercially available statistical software program (R software). The results are expressed as the mean and standard deviation or as the mean and 95% confidential interval (CI). Logistic regression models were used to estimate the odds ratios (ORs) and the 95% CIs of each risk factor for AMD. A P value < 0.05 was considered statistically significant.
-
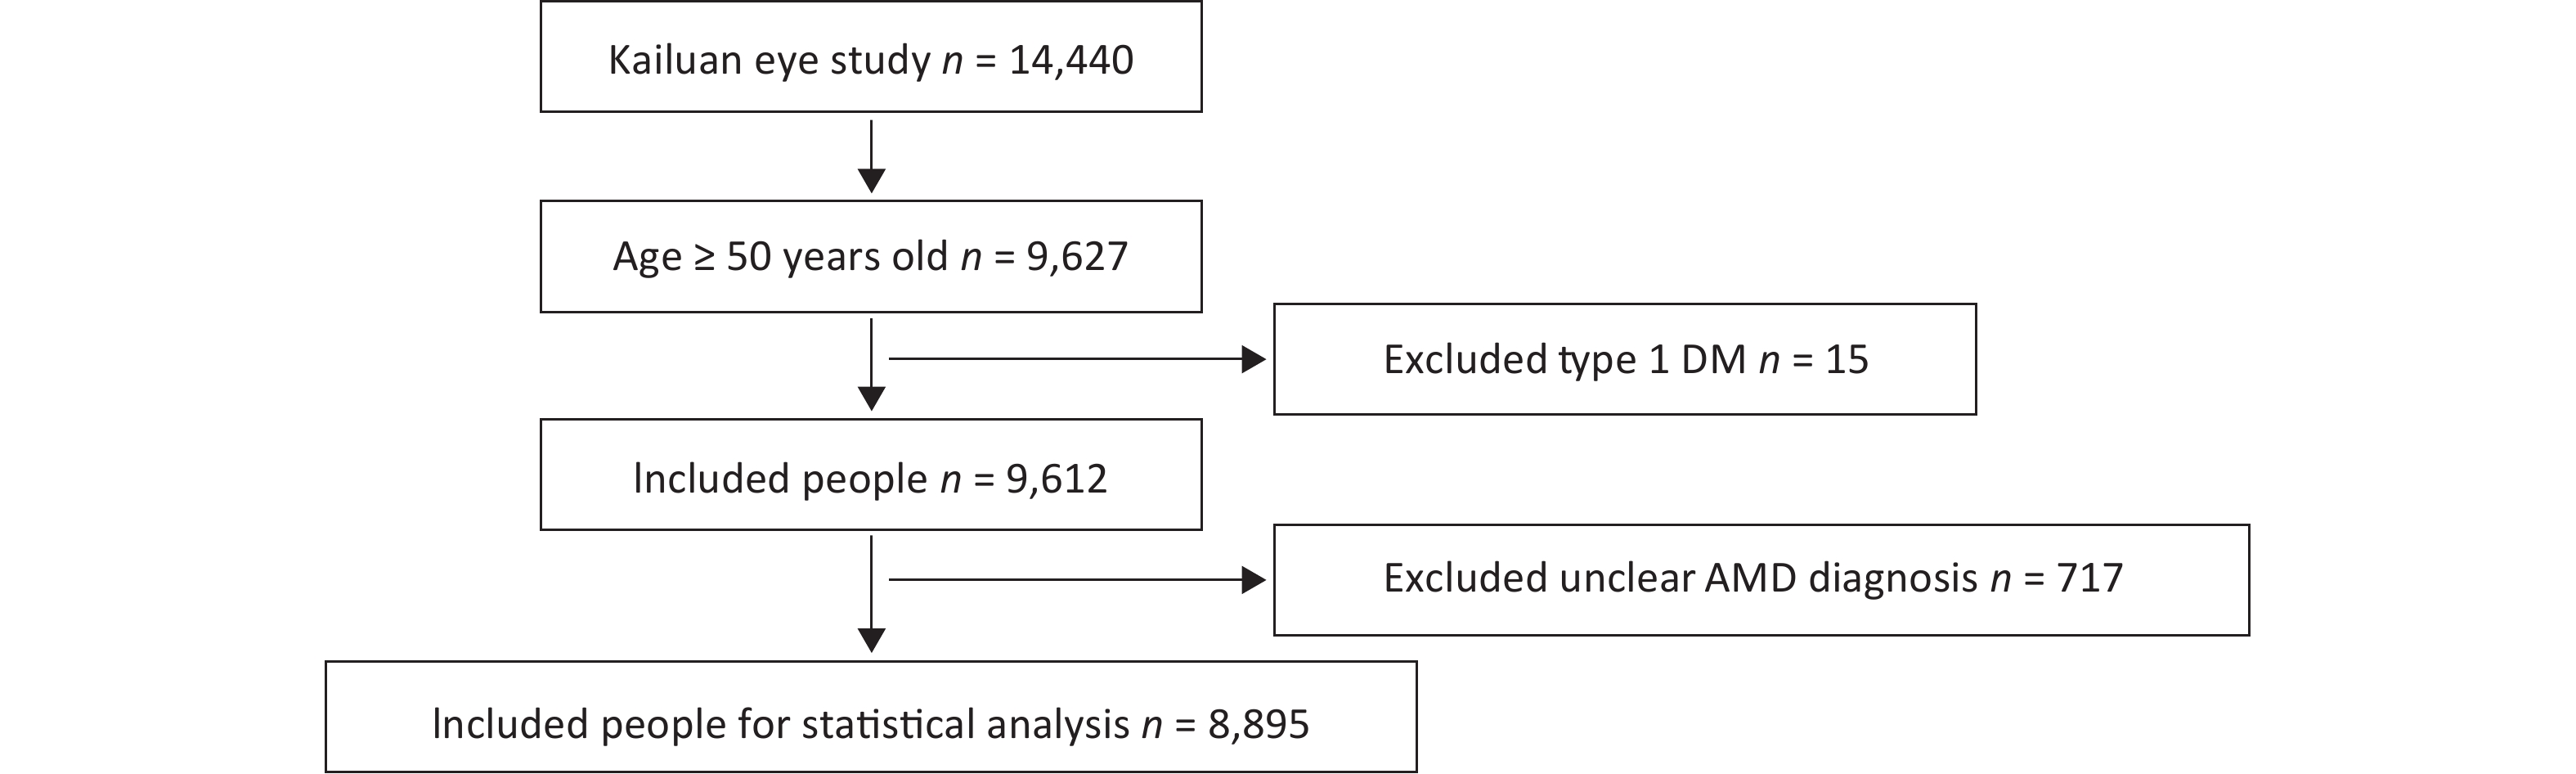
A total of 14,440 people were included in the Kailuan Eye study. According to the age definition standard of AMD, there were 9,627 people ≥ 50 years of age. Fifteen people with type 1 DM and 717 people with a questionable diagnosis of AMD were excluded. A questionable diagnosis of AMD was met if one of the following three criteria were met and the photograph was not clear: 1) unclear refractive media; 2) deviation of photograph range; and 3) lack of photographs. A total of 8,895 people entered the final statistical analysis (Figure 1).
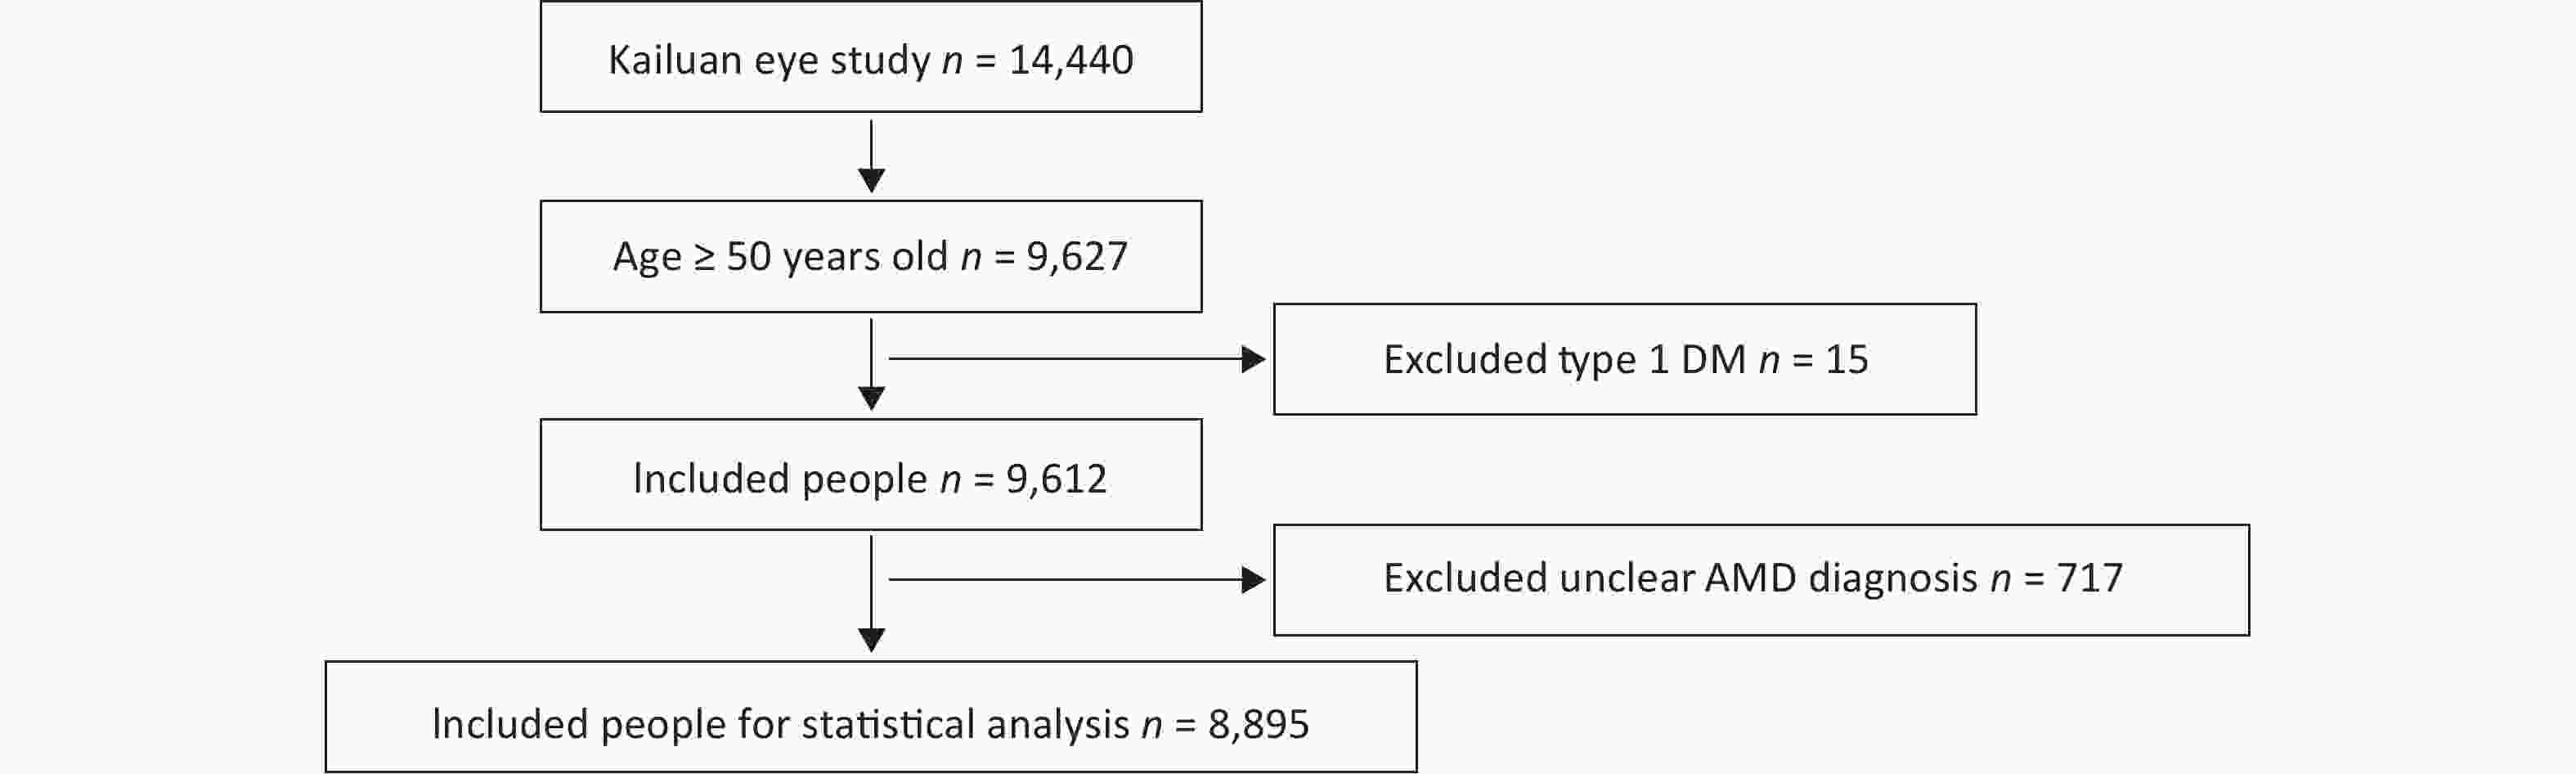
Figure 1. Inclusion and exclusion flow chart
-
A total of 8,895 people ≥ 50 years of age were included in the Kailuan Eye study, 38 of whom had wet AMD. The prevalence of wet AMD was 0.4%. There were 1,469 patients with dry AMD, and the prevalence of dry AMD was 16.5%. Of the 1,469 patients with dry AMD, 1,034, 402, and 33 had dry AMD in the early, middle, and late stages, respectively. The prevalences of dry AMD in the early, middle, and late stages were 11.6%, 4.5%, and 0.4%, respectively.
There were 1,618 people > 50 years of age with type 2 DM in the Kailuan Eye study. There were 7,277 people without DM. The prevalence of type 2 DM was 18.2%. Among people > 50 years of age, five were diagnosed wet AMD and DM; the prevalence was 0.3%. Among people > 50 years of age without DM, 33 had wet AMD; the prevalence was 0.5%.
Among people > 50 years of age with DM in the Kailuan Eye study, 275 people had dry AMD; the prevalence was 17.0%. The number of people with early, middle, and late AMD was 184, 81, and 10, respectively; the prevalence was 11.4%, 5.0%, and 0.6%, respectively. Among the people without DM > 50 years of age, there were 1,194 people with dry AMD; the prevalence was 16.4%. The number of people with dry AMD in the early, middle, and late stages was 850, 321, and 23, respectively; the prevalence was 11.7%, 4.4%, and 0.3%, respectively (Table 3)[31].
Variables Wet AMD (%)* Dry AMD (%)** Dry AMD (n = 1,469) Early dry AMD (%) Mediate dry AMD (%) Late dry AMD (%) Non-DM
n = 7,27733 (0.5) 1,194 (16.4) 850 (11.7) 321 (4.4) 23 (0.3) DM
n = 1,6185 (0.3) 275 (17.0) 184 (11.4) 81 (5.0) 10 (0.6) Total
n = 8,89538 1,469 1,034 402 33 Note. *χ2 = 0.354, P = 0.551; when the level of significance was set at 0.05, there was no significant difference in the prevalence of wet macular degeneration between type 2 DM and healthy controls. **χ2 = 0.291, P = 0.590; when the level of significance was set at 0.05, there was no significant difference in the prevalence of type 2 DM and dry macular degeneration in healthy controls. AMD, age-related macular degeneration; DM, diabetes mellitus. Table 3. Prevalence of AMD in people with and without DM
Because the number of people with AMD was limited, if the patients with DM complicated by hypertension and hyperlipidemia were excluded, the prevalence of wet AMD was not counted. Therefore, to eliminate the confounding factors of DM combined with hypertension and/or hyperlipidemia, the healthy population (no diabetes, hypertension, or hyperlipidemia), hypertension-only population, hyperlipidemia-only population, and hypertensive combined with hyperlipidemia population were statistically analyzed for the prevalence of wet AMD and dry AMD, respectively. The prevalence of wet AMD was 5.0%, 3.0%, 2.0%, and 7.0% in the healthy, hypertension-only, hyperlipidemia-only, and hypertension combined with hyperlipidemia populations, and the prevalence of dry AMD was 16.6%, 16.2%, 15.2%, and 17.2%, respectively. The prevalence of early dry AMD in the hypertension-only, hyperlipidemia-only, and hypertension combined with hyperlipidemia healthy populations was 11.9%, 11.8%, 10.9%, and 12.0%, respectively, the prevalence of middle dry AMD was 4.4%, 4.2%, 3.9%, and 4.9%, respectively, and the prevalence of late dry AMD was 0.3%, 0.2%, 0.5%, and 0.3%, respectively. There were no significant differences in the prevalence of early, middle, and late dry AMD between the groups (Table 4).
Variables Wet AMD, n (%) Dry AMD, n (%) Dry AMD (n = 1,194) Early dry AMD, n (%) Middle dry AMD, n (%) Late dry AMD, n (%) Healthy
n = 3,23215 (0.5) 536 (16.6) 383 (11.9) 143 (4.4) 10 (0.3) Hypertension
n = 6192 (0.3) 100 (16.2) 73 (11.8) 26 (4.2) 1 (0.2) Hyperlipidemia
n = 1,5393 (0.2) 234 (15.2) 167 (10.9) 60 (3.9) 7 (0.5) Hypertension complicated
with Hyperlipidemia
n = 1,88713 (0.7) 324 (17.2) 227 (12.0) 92 (4.9) 5 (0.3) Total
n = 7,27733 1,194 850 321 23 Note. After inspection and comparison, when the significance level was set at 0.05, there was no significant difference in the prevalence of AMD among the groups. AMD, age-related macular degeneration; DM, diabetes mellitus. Table 4. Prevalence of AMD in non-DM individuals
-
Because the number of people with wet AMD was limited and could not be statistically analyzed, only the risk factors for dry AMD were analyzed.
Three models were established to correct age and gender: corrected age, gender, and BMI; corrected age, gender, BMI, use of hypoglycemic drugs, and use of blood pressure-lowering drugs. The risk factors for dry AMD were analyzed, including DM, DM with hypertension, DM with hyperlipidemia, and DM with hypertension and hyperlipidemia.
DM, DM with hypertension, DM with hyperlipidemia, and DM with hypertension and hyperlipidemia were not risk factors for dry AMD (Table 5).
Variables Model 1, OR (95% CI)a Model 2, OR (95% CI)b Model 3, OR (95% CI)c Ref = non DM (n = 7,244) DM (n = 112) 1.08 (0.64, 1.73) 1.17 (0.69, 1.88) 1.18 (0.70, 1.91) DM with hypertension (n = 228) 1.01 (0.71, 1.42) 1.04 (0.72, 1.47) 1.07 (0.74, 1.52) DM with hyperlipidemia (n = 334) 1.00 (0.73, 1.34) 0.99 (0.72, 1.35) 1.02 (0.73, 1.39) DM with hypertension and hyperlipidemia (n = 939) 1.01 (0.84, 1.21) 1.02 (0.84, 1.24) 1.09 (0.88, 1.35) Note. aModel 1: corrected age (50−59, 60−69, and ≥ 70 years; sex (male, female). bModel 2: corrected for age, sex, and BMI (< 18.5, 18.5−23.9, 24−27.9, and ≥ 28.0 kg/m2). cModel 3: corrected for age, sex, BMI, use of hypoglycemic drugs (yes, no), and use of antihypertensive drugs (yes, no). AMD, age-related macular degeneration. Table 5. Risk factors for dry AMD (n = 8,857)
-
The risk factors for dry AMD were analyzed by age stratification, with 10-year increments per age group. The OR for dry AMD was 1.56 (95% CI: 1.00–2.40) in the 60–69 year age group with DM and hyperlipidemia. None of the other age groups were risk factors for dry AMD (Table 6).
Variables Model 1, OR (95% CI)a Model 2, OR (95% CI)b Model 3, OR (95% CI)c 50–59 years Ref = non-DM (n = 3,185) DM (n = 51) 1.11 (0.45, 2.33) 1.21 (0.49, 2.55) 1.21 (0.49, 2.58) DM with hypertension (n = 88) 1.08 (0.55, 1.93) 1.14 (0.58, 2.05) 1.17 (0.59, 2.12) DM with hyperlipidemia (n = 171) 0.78 (0.45, 1.27) 0.74 (0.41, 1.25) 0.75 (0.41, 1.29) DM with hypertension and hyperlipidemia (n = 342) 1.24 (0.90, 1.69) 1.26 (0.89, 1.74) 1.36 (0.94, 1.93) 60–69 years Ref = non-DM (n = 3,079) DM (n = 49) 1.20 (0.58, 2.28) 1.25 (0.60, 2.41) 1.28 (0.61, 2.46) DM with hypertension (n = 106) 0.75 (0.42, 1.24) 0.77 (0.43, 1.30) 0.79 (0.44, 1.34) DM with hyperlipidemia (n = 130) 1.43 (0.93, 2.12) 1.51 (0.97, 2.28) 1.56 (1.00, 2.40) DM with hypertension and hyperlipidemia (n = 478) 0.87 (0.67, 1.12) 0.90 (0.68, 1.17) 0.94 (0.69, 1.28) ≥ 70 years Ref = non-DM (n = 980) DM (n = 12) 0.65 (0.10, 2.48) 0.80 (0.12, 3.32) 0.80 (0.12, 3.34) DM with hypertension (n = 34) 1.77 (0.84, 3.58) 1.57 (0.72, 3.27) 1.58 (0.72, 3.32) DM with hyperlipidemia (n = 33) 0.44 (0.13, 1.14) 0.40 (0.12, 1.07) 0.41 (0.12, 1.10) DM with hypertension and hyperlipidemia (n = 119) 1.06 (0.67, 1.64) 1.06 (0.65, 1.70) 1.10 (0.61, 1.91) Note. aModel 1: corrected gender. bModel 2: corrected gender and BMI. cModel 3: corrected for gender, BMI, use of hypoglycemic and antihypertensive drugs. AMD, Age-related Macular Degeneration; DM, Diabetes Mellitus. Table 6. Age subgroup analysis of dry AMD risk factors
-
The relationship between DM and AMD is intricate. First, the pathogenesis underlying DM and AMD is complex. Second, DM is generally divided into types 1 and 2 DM. As a complication of DM, DR is divided into non-proliferative (NPDR) and proliferative DR (PDR), and non-proliferative DR is further divided into mild, moderate, and severe NPDR. AMD is divided into dry and wet AMD according to type, and early, middle, and late AMD according to stage. Late AMD includes wet AMD and geographic atrophy (GA). Therefore, it is very difficult to individually associate the classification with staging of DM, DR, and AMD.
Early studies did not demonstrate a relationship between DM and AMD [15,16]. Later, the Beaver Dam Eye Study [8] and the Blue Mountains Eye Study [9] concluded that DM and AMD were correlated, but the research conclusions were contradictory. According to the Beaver Dam Eye Study[8], DM is not associated with early AMD and GA; however, the prevalence of exudative AMD among people with DM was higher (9.4%) than those without DM (4.7%) in patients > 75 years of age. The Blue Mountains Eye Study[9] showed that DM is only associated with GA, but not related to wet or early AMD. According to the 2013 Medicare data from 6,621 patients > 69 years of age with newly diagnosed DM between 1995 and 2005 in the United States, NPDR significantly increased the risk of dry and wet AMD, while PDR only increased the risk of wet AMD. The risk of dry and wet AMD does not increase in those with DM without DR. There is no difference in the risk of wet AMD between PDR and NPDR [13]. A systematic review and meta-analysis of the relationship between DM and AMD in 2014 showed that DM was a risk factor for AMD, especially late AMD[32]. A retrospective study of the longitudinal health insurance database of Taiwan, China (1997−2012) showed that patients with DM had a 1.4-fold increased risk of dry and wet AMD over matched patients without DM, but the difference did not reach statistical significance in multivariate survival analysis. In contrast, patients with DM and DR had a 4-fold increased incidence of dry AMD and a 3.9-fold increased incidence of wet AMD over patients with DM who did not have DR. The HR of the development of dry AMD was 3.89 for patients with DM and DR compared with patients with DM who did not have DR (P = 0.001). The HR of the development of wet AMD was 3.42 for patients with DM and DR compared with patients with DM who did not have DR (P﹤0.001)[33]. This finding is consistent with the conclusion of the current study; specifically, DM may not be a risk factor for increasing the prevalence of AMD, but more attention should focus on DR, a complication of DM.
In contrast, there are studies that have shown that the incidence of AMD in the DM population was lower than the general population. Borrone[21] reported that the prevalence of AMD in patients > 75 years of age (2.51%) was significantly lower than the general population (11.0%). Proctor and Ambati[34] and Zylbermann [35] also found that the prevalence of AMD combined with DR (0.2%) was significantly lower than AMD without DR (0.8%). A systematic review and meta-analysis of AMD risk factors in 2010 [36] also showed that among the 73 risk factors that may lead to AMD, only four factors had a strong correlation and good consistency (age, smoking, cataract surgery, and family history). There were only four moderate and consistently related factors (high BMI, cardiovascular history, hypertension, and elevated fibrinogen level). Weak and inconsistent factors included sex, race, DM, iris color, cerebrovascular history, and TC and TG levels. Whether DM is a risk factor for AMD is still controversial.
Why do DM and/or DR increase the incidence of AMD? DM and/or DR may share a common pathogenesis. DR is generally considered to be a disease of the inner retina, in contrast to the outer retinal involvement in AMD, but there may be features common to both diseases. Macular retinal piment epithelium (RPE) abnormalities and increased area of drusen are correlated with increased blood glucose levels, impaired glucose tolerance, and advanced glycation end products. Hyperglycemia and dyslipidemia in diabetic patients disturb homeostasis of the retina by inducing inflammatory responses in tissue cells, including oxidative stress. Moreover, both wet AMD and DR appear to be VEGF-mediated, and the use of anti-VEGF pharmaceutical agents has proven useful in the treatment of both diseases[33].
It is likely that DM and/or DR reduce the incidence of wet AMD based on the changes in the retinal choroidal anatomic structure in DR patients [37-40] and the changes in retinal choroidal function in DR [41,42]. Long-term hyperglycemia affects the retinal pigment epithelium (RPE) and Bruch membrane, and thickening of the Bruch basement membrane and choroidal capillaries has been demonstrated on histopathologic evaluation of long-term diabetic patients. These pathologic changes may inhibit the proliferation of CNV and breakthrough of the RPE. In contrast, the blood flow in the diabetic macular fovea is significantly reduced (up to 30.0%), and choroid ischemia may also inhibit the formation of choroidal neovascularization (CNV).
The results of the current study showed that DM had no significant effect on the prevalence of AMD, which may be the dynamic balance of promoting/weakening factors in the complex pathogenesis underlying DM.
This study was a population-based epidemiologic study using cross-sectional survey data. One of the main goals of this study was to compare the prevalence of dry and wet AMD among diabetic and non-diabetic individuals. The results showed that the prevalence of wet AMD in diabetic and non-diabetic patients was 0.3% and 0.5%, respectively, and the prevalence of dry AMD was 17% and 16.4%, respectively. Because the number of wet AMD patients was small (38), if diabetics with hypertension or hyperlipidemia were excluded, it was not possible to analyze the prevalence of DM with wet AMD. To eliminate this bias, a further subgroup analysis of healthy, hypertensive, hyperlipidemic, and hypertensive combined with hyperlipidemic populations was conducted. The prevalence of wet AMD was 0.5%, 0.3%, 0.2%, and 0.7% in healthy, hypertensive, hyperlipidemic, and hypertensive combined with hyperlipidemic populations, and the prevalence of dry AMD was 16.6%, 16.2%, 15.2%, and 17.2%, respectively. There was no significant difference in the prevalence among these groups.
The second goal of this study was to determine whether DM, hypertension, and hyperlipidemia are risk factors (the number of wet AMD cases was too small to be analyzed) in people with AMD. We divided the subjects into three groups at 10 year increments of age for a subgroup-stratified analysis. Based on an analysis of risk factors for AMD, after correcting for age, sex, BMI, use of hypoglycemic or blood pressure-lowering drugs, DM, DM with hypertension, DM with hyperlipidemia, and DM combined with hypertension and hyperlipidemia did not constitute risk factors for the onset of dry AMD. Based on the stratified analysis at 10 year increments of age, with the exception of the 60−69 year age group, DM with hyperlipidemia was a risk factor for dry AMD (OR = 1.56; 95% CI: 1.00−2.40). Thus, it was confirmed that DM did not constitute a risk factor for AMD.
The limitations of this study were the cross-sectional, rather than longitudinal design. The diagnostic standard of DM is a fasting blood glucose level, not glycosylated hemoglobin. We mainly studied the relationship between DM and AMD, but did not further study the relationship between DR and AMD, which will be the subject of future corollary studies. In addition, because the number of subjects with wet AMD was limited, correlation analysis of risk factors could not be carried out. The main point of this study was to discuss the relationship between DM and AMD. We did not discuss the systolic and diastolic pressure in the section of hypertension with AMD, and there was no detailed division of the relationship between HDL-C, LDL-C, TG, TC, and AMD.
Whether DM and DR protects or promotes the occurrence of dry and wet AMD in Chinese patients is controversial. The current study was the first population-based epidemiologic study in northern China to explore the prevalence of wet and dry AMD in a DM population. The findings of this study showed that DM did not constitute a risk factor for AMD; however, good glycemic control of DM, and slowing the occurrence and development of DR and other complications may significantly reduce the incidence of AMD.
We are left with a number of unanswered questions and challenges. In addition, what role does vascular endothelial growth factor (VEGF) play in the pathogenesis of DR and wet AMD? Is there an antagonist of VEGF playing a role? Can we identify factors related to DR protection/promotion of AMD by means of molecular biology? At present, the research focus of diabetic ophthalmopathy is mainly on DR, diabetic optic neuropathy, and diabetic macular edema. Should we strengthen the study of diabetic choroidal microangiopathy (which may be more closely related to AMD)? Is the occurrence and development of wet AMD inhibited or preserved by pan-retinal photocoagulation or by anti-VEGF treatment in DR patients? What can we acquire by new image technology [43]? These fields need to be explored by more clinical and epidemiologic studies.
There is no conflict of interest in this study.
The Influence of Diabetes, Hypertension, and Hyperlipidemia on the Onset of Age-Related Macular Degeneration in North China: The Kailuan Eye Study
doi: 10.3967/bes2022.081
- Received Date: 2022-04-12
- Accepted Date: 2022-06-26
-
Key words:
- Diabetes /
- Hypertension /
- Hyperlipidemia /
- Age-related macular degeneration /
- Prevalence /
- Risk factor
Abstract:
| Citation: | ZHANG Yong Peng, WANG Ya Xing, ZHOU Jin Qiong, WANG Qian, YAN Yan Ni, YANG Xuan, YANG Jing Yan, ZHOU Wen Jia, WANG Ping, SHEN Chang, YANG Ming, LUAN Ya Nan, WANG Jin Yuan, WU Shou Ling, CHEN Shuo Hua, WANG Hai Wei, FANG Li Jian, WAN Qian Qian, ZHU Jing Yuan, NIE Zi Han, CHEN Yu Ning, XIE Ying, JONAS JB, WEI Wen Bin. The Influence of Diabetes, Hypertension, and Hyperlipidemia on the Onset of Age-Related Macular Degeneration in North China: The Kailuan Eye Study[J]. Biomedical and Environmental Sciences, 2022, 35(7): 613-621. doi: 10.3967/bes2022.081

|

 Quick Links
 DownLoad: